1. Introduction
Analysis of Land Use/Land Cover (LULC) and detection of temporal change are important for investigating the universe’s environmental transformation processes [
1,
2,
3]. Evaluation of LULC changes on basis of satellite multi-spectral images is considered one of the important topics of environmental remote sensing. LULC changes are important since they are interconnected to the global climatic, urban, and agricultural development [
4]. Knowledge of LULC change is vital in different fields such as urban development, regional planning, vulnerability and environmental impact assessment [
5,
6], monitoring and detection of natural disasters [
7,
8], and assessment of soil salinity and erosion [
9]. Quantitative evaluation and prediction of LULC are the most effective way to understand the transformation of landscape [
10] Mapping LULC change is an essential aspect of wide applications, such as in land use planning or mitigation of global warming. Subsequently, LULC change assessment is essential for different purposes for the human being’s welfare in context of quick and unrestrained growth of population along with economic/industrial development, particularly in the developing countries with intensified changes of LULC [
11,
12]. These changes have various impacts on the environment and human society through different aspects such as increasing flood, drought vulnerability, environmental deterioration, ecosystem services loss, groundwater depletion, and soil erosion [
8,
13,
14].
By using remote sensing techniques, a land cover map can be created at any time with the merit to extract the classes of land use/cover, and investigate changes [
15,
16,
17]. The high potential for spectral, spatial, and temporal resolutions became important tools to detect the changes on the earth’s surface, in addition to repeatable satellite images and creation of regular and continuous images [
18]. The Markov chain, a widely used model, can estimate future trends in land use by calculating the conversion ratio of various land uses [
19]. This model consists of a series of random values, whose probabilities change over time in relation to earlier values [
20]. Additionally, this model is employed when describing changes in the landscape and is challenging because it is an effective tool for predicting changes of Land cover/use [
19]. This method is best suited for short-term projections because of the stationary transition that the Markov chain models predicts, which is one of the problems that appears when using this approach [
19].
The temporal and spatial land use changes have been studied in several studies using remote sensing techniques, and the CA-Markov model has been used to predict land use change [
20]. LULC changes in Tanzania’s Usangu Catchment were simulated using a CA-Markov model, and the model’s effectiveness for the study area’s conditions was assessed. Another study investigated and predicted changes in vegetation cover using the CA-Markov method and satellite data [
21]. Changes of land use in the desert of Egypt were investigated, and the future changes were predicted by using the Markov model [
22]. Furthermore, CA-Markov was employed in order to simulate the spatial pattern of land use and project the result to the future [
23]. In addition, the CA-Markov model can be employed to examine the landscape dynamics in river delta of Harbin, which is considered one of the largest cities in China according to the study of [
24].
Damietta governorate, as one of the coastal dynamic regions needs an accurate monitoring of natural resources and anthropogenic activities. Thus, the present study used remote sensing data to quantitatively evaluate ESV changes, the changes of LULC, and analyze LULC effects on the ESV of Damietta Governorate from 2001 to 2021 with the prediction of LULC at 2031. These data will support the sustainable development of ecosystem services, depending on the effective use, management, and protection of land resources in Damietta Governorate.
2. Materials and Methods
2.1. Description of the Study Area
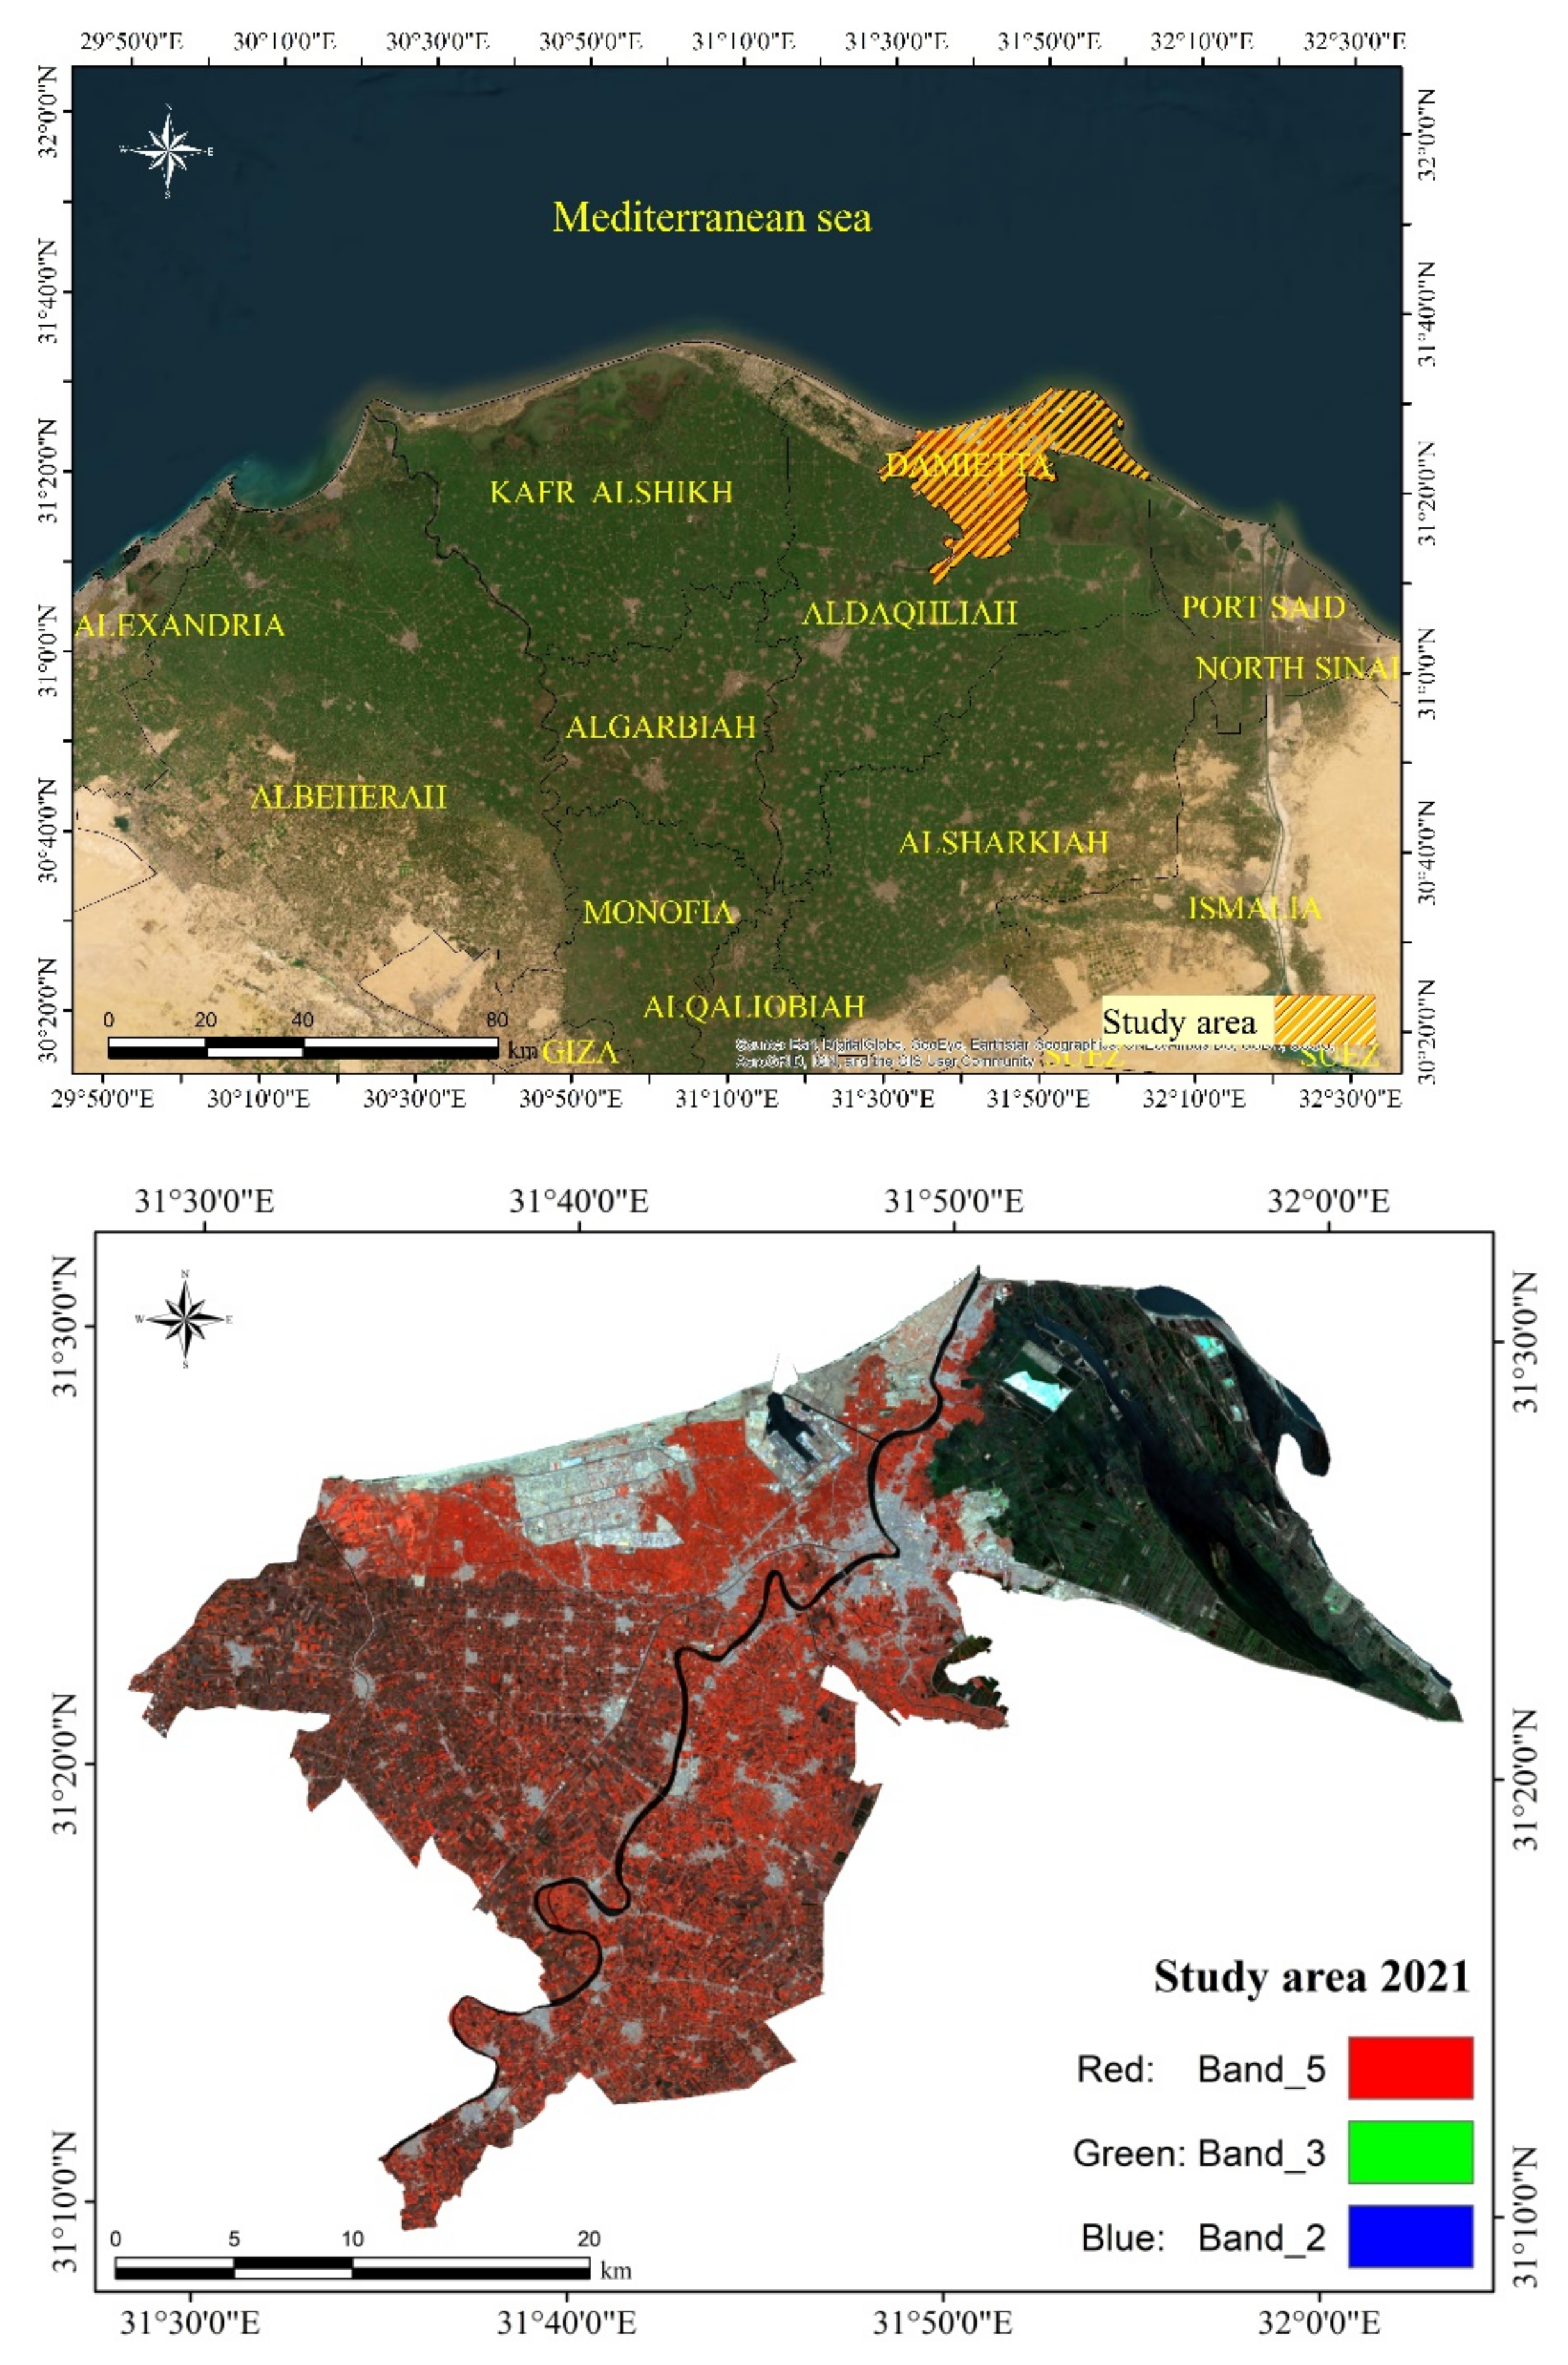
Damietta governorate is a small province located in the extreme northeast of Egypt in the delta region with Latitude 31.10, 31.30 N and longitude 32.10, 31.30 E as shown in
Figure 1. It has a little more than 1 million inhabitants, making it sparsely populated. Faraskur, Zarqa, Kafr Saad, and Damietta are the administrative districts that make up Damietta governorate. These four administrative hubs, or “markaz” in Arabic, are made up of 59 villages, 722 sub-villages, 35 local village units, and 10 cities. The storied city of Damietta serves as the governorate of Damietta’s capital. It has a Mediterranean climate, which is generally hot and dry in summer and cold and wet in winter. An air temperature varies from 18 to 19 °C in winter and from 30 to 31 °C in summer.
2.2. Remote Sensing Data and Data Processing
The data used in this study included three free downloadable images (
http://glovis.usgs.gov/ accessed on 28 April 2001); Landsat 5 Thematic Mapper data as TM 5 acquired in 28 April 2001, Landsat 7 Enhanced Thematic Mapper Plus as ETM 7+ in 13 July 2011 and Landsat 8 Operational Land Imager data as OLI in 21 May 2021. All images were referenced using the UTM system, zone 36 N. ENVI (5.3) software was used in this study for data processing, while ArcGIS (10.4.1) was used for mapping the Land Use/Cover maps. Maximum Likelihood Classifier was used in this investigation Field validation visits were elaborated to confirm the accuracy of classification. Land cover classification was assessed by the land classification system (LCCS) as reported and proposed by [
25].
In this investigation, the overall classification accuracy was found to be 99.03% for 2001 and 99.1% for 2011 while the 2021 image accuracy was 98.1. Details of single class accuracy for all images of (2001, 2011, and 2021) can also be found in
Table 1.
2.3. LULC Prediction Using the CA–Markov Model
Both the Markov model, which is adopted from IDRISI software, and Cellular automata (CA) were used in the current study to accurately predict the LULC. The simulation model for land use changes displays the numerical and spatial distribution of transition [
26]. Considering the LULC changes over time, the Markov model calculates the likelihood of changing from one state to another [
27]. Equations (1)–(3) are used in this model to calculate the dynamic change of any study area in relation to its previous or current land cover state:
where,
S(t) is the state of the system at time t,
S(t +1) is the value and state of the system at a time
(t +1);
Pij is the transition probability matrix. The modeling reliability of land use changes can be enhanced by using two or more simulation methods to get the benefits of each used method. It is important to note that the CA–Markov model is recently used for simulation of dynamic spatial phenomenon and for prediction of future land use change.
2.4. Validation of Simulated LULC
Any prediction-based study must include the model’s validation. In many studies, the kappa index is frequently used to assess the model’s accuracy [
28]. In order to evaluate the model’s accuracy, the study used the VALIDATE model in the IDRISI selva to compare the expected LULC for 2031 with the actual LULC for 2021.
2.5. LULC Change Dynamics
Natural and artificial factors are primarily affecting ESV. Urban sprawl has played a significant role in the ESV changes over a relatively short period of time. The land-use intensity displays the integrating effects of natural ecological factors and human factors in addition to reflecting the natural aspects of various land-use types themselves. The land-use comprehensive index (L) was used in this study to reflect human activity. The calculations were as follows:
Ai stands for the classification index land use type, and
L stands for the land use degree comprehensive index (L: 100–400). The level of development and use increases as
L approaches 400.
CI is the area’s percentage of the land use type;
Lb-a describes how the Comprehensive Index of Land Use Change has changed;
Cia and
Cib represent the area percentage of the i-type land type in the two stages
a and
b, while
R stands for the change rate in land use.
La and
Lb represent the comprehensive land use degree index of the initial and final time phases. The stages of development are
R > 0, decay is
R0, and stabilization or adjustment is
R = 0. According to
Table 2, construction land falls under the fifth level of land use, which also includes land used for industry, mining, transportation, habitation, etc. The fourth level is farmland, such as cultivated land; the third level is grassland, water area and forested; the second is water bodies; and the first level is bare land.
2.6. Assessment of ESV
Assessment of the ecosystem has been classified in different ways; Millennium Ecosystem Assessment (MEA), Economic of Ecosystem, and Biodiversity Assessment of Ecosystem. In the present study, the Millennium Ecosystem Assessment was proposed as it represents the most important type used in the world. Classification of this type of Ecosystem was presented in
Table 3. All values of ecosystem services were modified according to [
29].
2.7. Ecosystem Service Values (ESV)
This valuation method is still thought to be helpful for examining how changes in land cover affects ESV in the study areas. The primary idea and successful approach for ESV assessment were attained by [
29]. The assessments of ESV across were computed as follows:
where
ESVf is the function type “
f” value of the ecosystem service “
ESV” which is the total ecosystem service value in the study area;
Ui is the area for land use category,
I VCif is the value of the coefficient of ecosystem service function type “f” for land use category
I, “
Ai” for “average land type” (ha). Wherever:
ESV is the total value of ecosystem services (USD); A
i is the land type average (ha);
VCi refers to the ecosystem services of land type per unit area (USD·ha
−1·y
−1). Ten ESVs were selected in the current study, as shown in
Table 2, which are raw materials production (RMP),food production (FP), climate regulation (CR), gas regulation (GR), waste treatment (WT), culture and recreation (C&R), hydrological regulation (HR) and soil conservation (SC), as recorded by [
29]. The flow chart showing the methodology adopted in the present study to assess the LULC changes, ESV and for LULC 2032 is shown in
Figure 2.
3. Results
3.1. LULC of Damietta Governorate from 2001–2031
In the present study, LC changes were monitored from the years 2001 to 2021 in two different durations; 2001–2011 and 2011–2021. Further, prediction of future changes of LULC in 2031 was assessed. The study area is subjected to temporal changes during the period of study (2001–2021). Total areas and the percentage of each LC class are illustrated in
Table 3. During 2001–2011, a significant decrease was recorded in the cultivated areas (−56.03 km
2) and bare areas (−50.07 km
2), while the urban area and water bodies were increased (58.89 km
2, 47.22 km
2), respectively as shown in
Figure 3.
During 2011–2021, expansion in urban (52.09 km
2) and water bodies (0.96 km
2) were occurred on the expense of the bare area (−29.83 km
2) and cultivated area (−23.22 km
2).
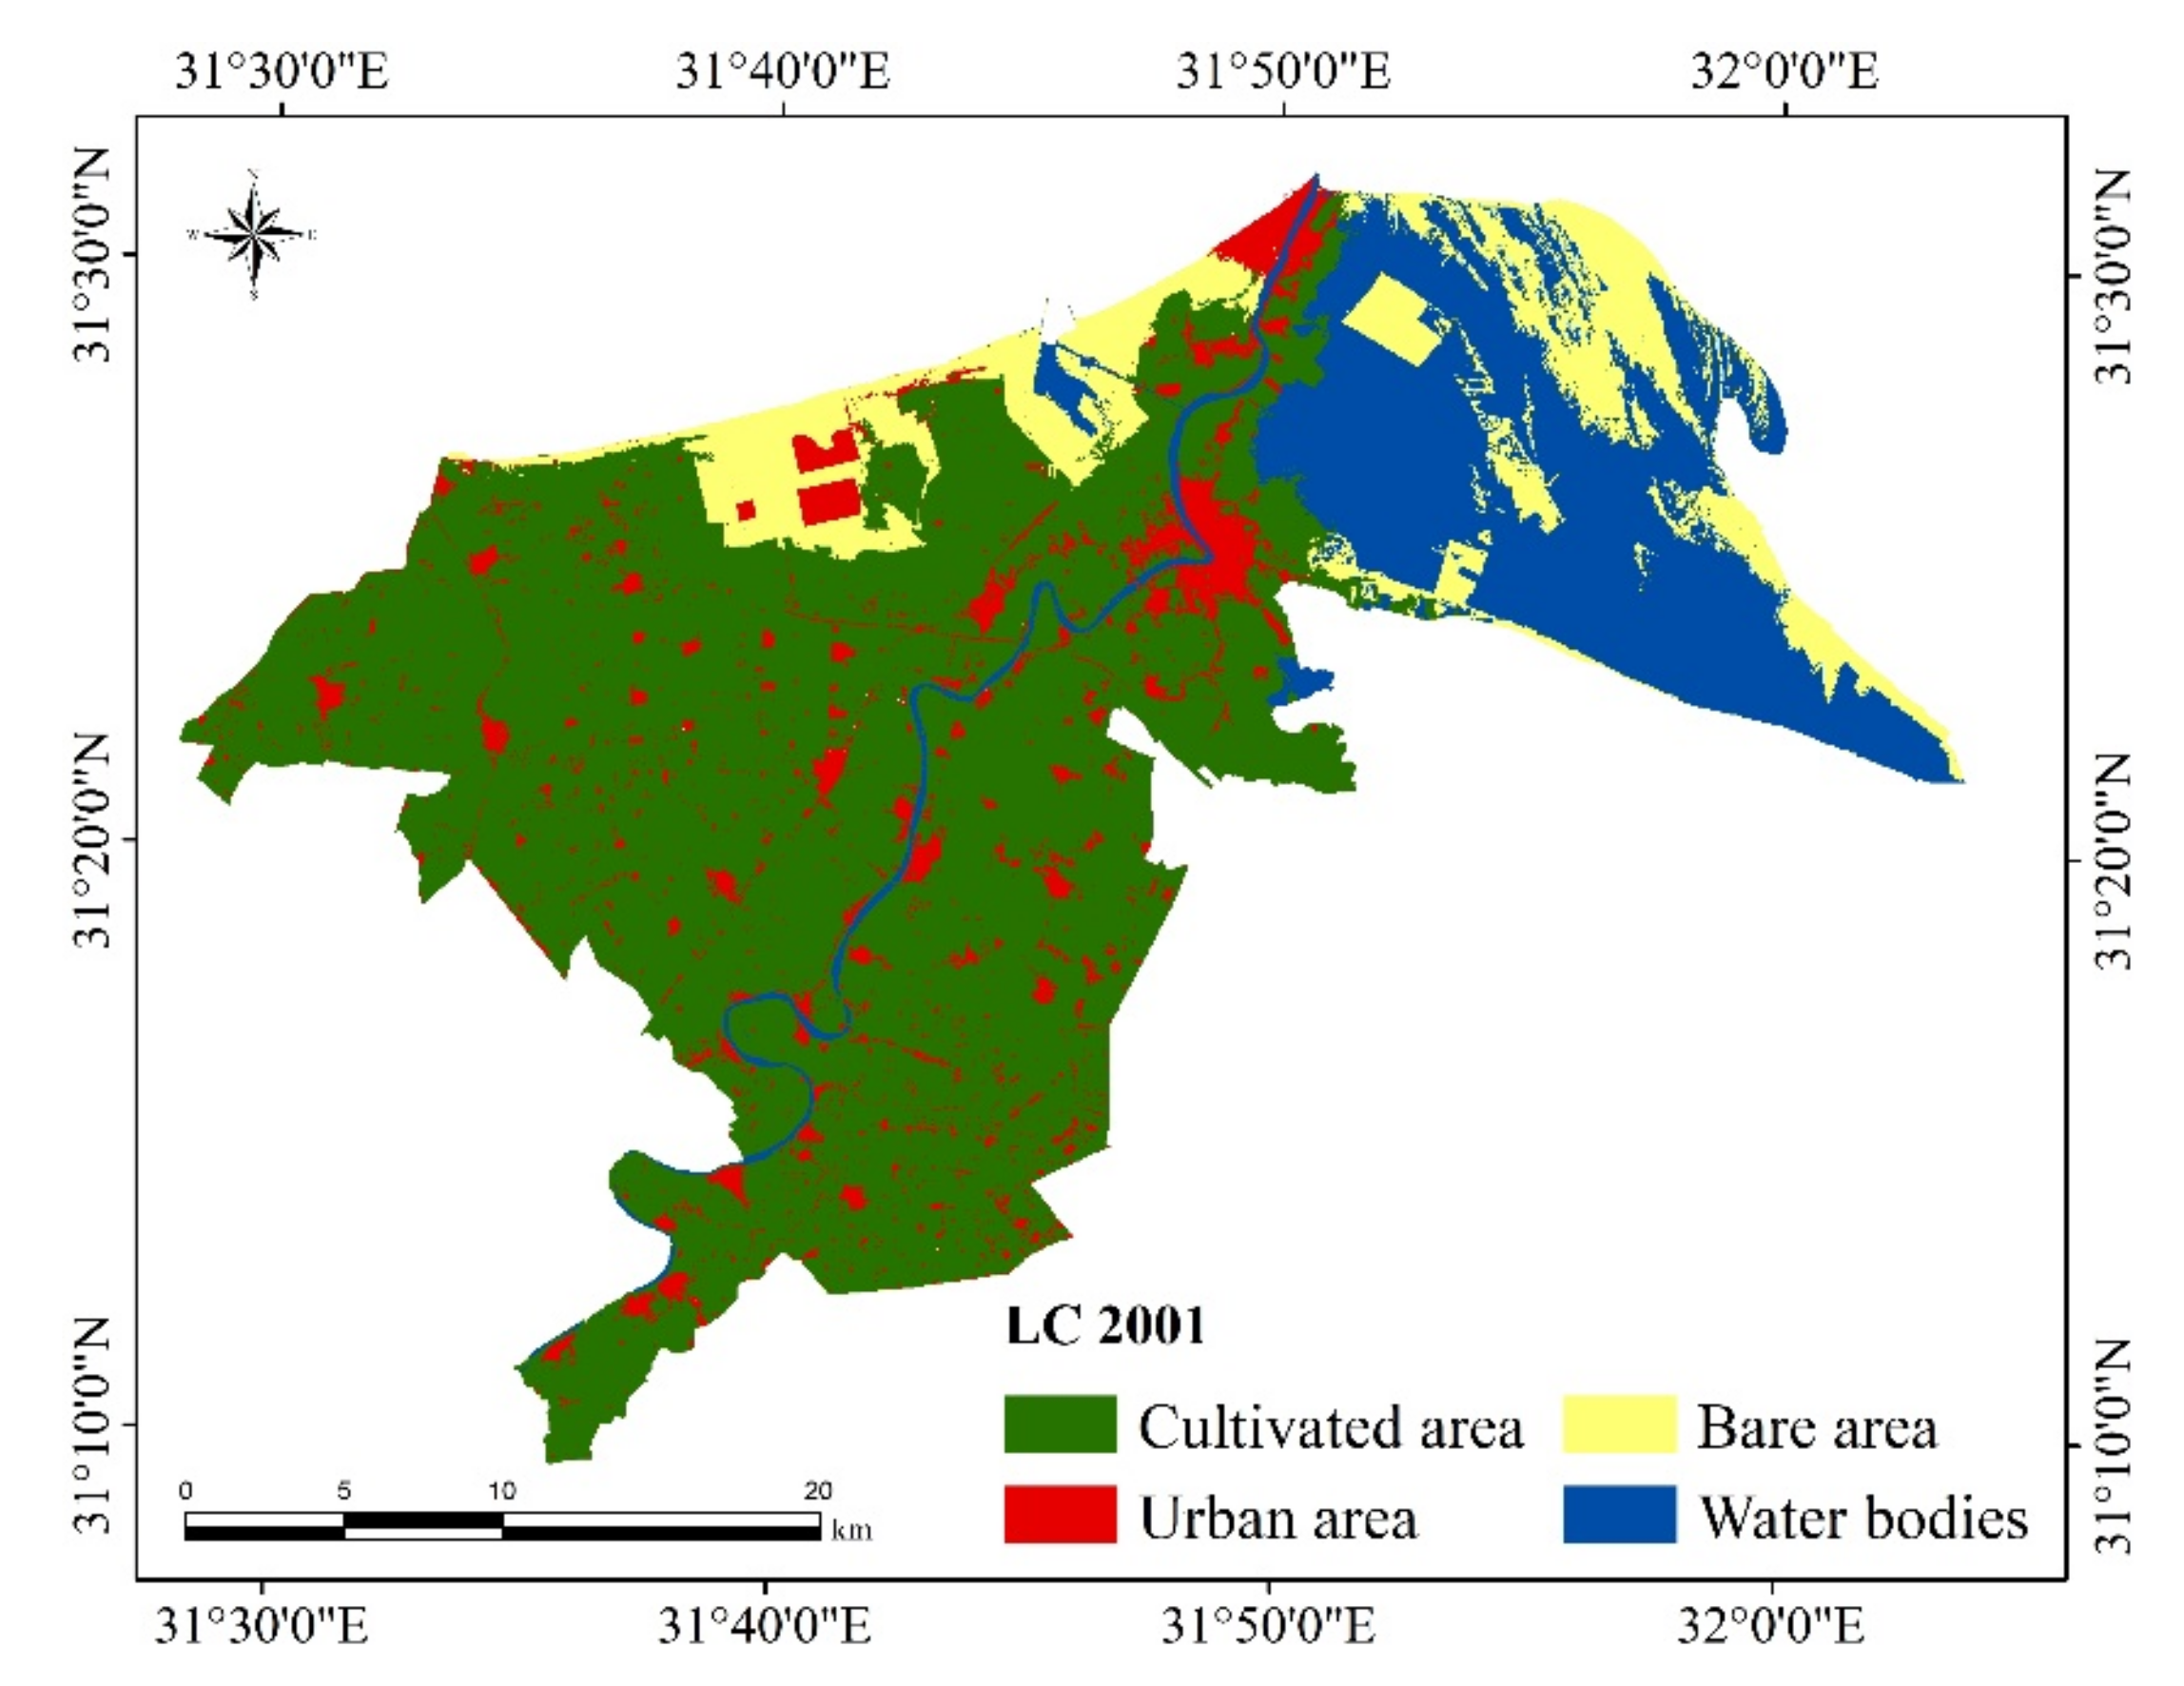
Figure 4,
Figure 5 and
Figure 6 show the land cover of 2001, 2011, and 2021. The prediction of the LULC was achieved using Cellular automata (CA) and the Markov model for 2031 as presented in
Figure 7. The results indicated that there are decreases in the cultivated area and water bodies, while there are increases in the urban area and bare area. The cultivated area will decrease to reach 46.22% of the total area based on the presented results. The urban area will increase to 22.82% of the total area with a non-significant decrease in the water bodies to represent 24.13%.
Table 4 showed the changes in LU/LC from 2001 to 2031.
3.2. Probability and Transition of LU/LC Using Markov Chain
The probability of LULC (%) from 2001 to 2021 shows that water bodies have no or very little probability of changing into another class because it has an 80% probability to remain as water bodies, where bare lands class represents a high probability of changing into another class because it has a 33% probability to remain as bare lands.
The transition probability from 2011 to 2031 shows the cultivated has no or very little probability of changing into another class because it has a 63% probability to remain as cultivated. However, the urban lands show a high probability of changing into another class because it has a 24% probability to remain as urban (
Table 5).
Table 6,
Table 7,
Table 8 and
Table 9 show the transition (km
2) where the highest constant areas were observed as follows; 471.20 and 38.34 km
2 for cultivated land and bare land that remained constant from 2001–2011. Further, an area of 112.46 km
2 for the urban area will be constant from 2021–2031. However, for water, 206.34 km
2 will be constant from 2011–2021.
3.3. Validation of the CA-Markov
The present study used the CA-Markov model to forecast the future Land Use/Land Cover. The IDRISI Selva was used for both prediction and validation of predicted LULC. The predicted 2031 LULC was compared with the actual 2031 LULC map using the VALIDATE tool. The kappa index values are mentioned in
Table 10, where Kno is 0.9527, Klocation is 0.9969, Klocation strata is 0.9969, and Kstandard values is 0.9331. All the K values are greater than 0.80, which shows a strong agreement between simulated and predicted LULC Maps [
30,
31].
3.4. Land Use Dynamic
The dynamic change of the LULC of Damietta Governorate is presented in
Table 11. The comprehensive index of Damietta Governorate ranges from 100 to 400. This means that the land use of Damietta Governorate is reasonably developed. It was shown that the comprehensive index was 258.24, 259.89, 268.96, and 267.74 for 2001, 2011, 2021 and 2031, respectively.
3.5. ESV Changes in Damietta Governorate
The value and importance of each ecosystem function that was considered in this study are presented in
Table 12. The ranks and contributions of recreation and culture (C & R), waste treatment (WT), and hydrological regulation (HR) are high when compared with other ecosystem functions in Damietta Governorate. The contribution and rank of other functions are minimal. Moreover, the total value of ESV
f was as follows: 2031 > 2011 > 2021 > 2001, respectively. The rank of production and raw materials production (RMP) of Damietta Governorate are not significant, and the contribution of climate regulation (CR), gas regulation (GR) and soil conservation (SC) are small compared with other values of ESV
f as shown in
Table 12.
The total ESV of functions showed that Damietta Governorate had the same trend over the three study periods, while the trend changed from a year to another. The contribution of water in the ecosystem valuation was increased from 2001 to 2021. The contribution of cultivated and bare lands decreased from 2001 to 2021.
The values of ecosystem service (ESV) and the associated changes in total ESV were evaluated in Damietta Governorate for the years 2001, 2011, 2021, and 2031 using modified coefficients (
Table 13). In general, the total ESVs of the entire study landscape were about USD 1,727,934, USD 1,153,482, USD 1,664,119, and USD 1,521,274.74 in 2001, 2011, 2021, and 2031, respectively.
Consequently, the ecosystem services value in Damietta Governorate lost USD −574,452 from 2001 to 2011 and USD −142,844 from 2021 to 2031. However, it gained USD 510,637.1 from 2011 to 2021 despite the loss in the agricultural lands which might be due to the increase in the development rate in Damietta governorate as shown in
Table 13.
4. Discussions
The Maximum Likelihood Classifier was used in this investigation to produce LULC maps because it is the most accurate classifier and the most important type of supervised classification [
32,
33]. The planned urbanization and the unplanned urban sprawl represented the main processes inducing the increase in the residential area. Thus, urban sprawl in the study area occurred on account of the agricultural land. However, the development that considered the conservation of the land resources was planned on the available bare lands that are not utilized [
34]. Water bodies attained a non-significant increase during the investigated period. According to [
35,
36], due to the developmental projects, agricultural lands can increase the value of the ecosystem.
The transition matrix shows the number of cells is predictable to alter from one land use class to another over a period. This shows a negative effect on the economy results from the change of cultivation to other classes [
37,
38]. The significant loss of vegetation cover has ecological effects on the hydrologic cycle, biodiversity, soil erosion, altered physicochemical properties, climate change and degradation.
The results confirm an increase in the comprehensive index from 2001 to 2021 but it may decrease in 2031. The increase in this index reflects the state of development in Damietta Governorate where the high value was observed in 2021. The social economy may also lead to improving the results of Damietta Governorate development. Further, the value of R reflects the development in all periods of the study. Major changes were made in the LULC due to the pressure of migrant workers under unexpected management from south Egypt to north Egypt, particularly to Damietta, which had a negative impact on the community and national income [
39].
There are some driving factors that are regulating the loss and gain of the land use dynamic in the current study. A major factor in the increase in the provisioning services of ESV was the increase in food production brought on by the expansion of vegetation areas. Increased agricultural lands have a similar positive impact on provisioning services. An increase in provisioning services that continues to come at the expense of regulating and supporting services is unsustainable because it interferes with the future flow of these two vital ES. In such situations, regulating and supporting services need to be protected.
The decrease in cultivated valuation reflects the anthropogenic activities in Damietta Governorate. Based on the prediction map in 2031, the valuation was reasonable and contributes to the progress of the region. The values without inflation adjustment provide a better understanding of the changes in the ESV for a temporal comparison of those changes. Instead of using the adjusted inflation to compare the ESV for various time periods, we advise that new ESV coefficients be derived to represent the actual ESV in a given time.
This indicates that the ES evaluation can help in identifying the direction for development and management of land use in Damietta Governorate. Future land planning should therefore emphasize the close connection between ecosystems and people by emphasizing the application of both ESV assessment and landscape measurement analysis, promoting the development of multi-center cities taking into account the supply of ecosystem services and the spatial interaction of ecological land. Therefore, change in ESV resulted from the transformation of land use type to another.
5. Conclusions
Understanding the processes causing the global environmental transformations depends on the analysis of LULC and the detection of change. In the present study, LULC changes were monitored from the years 2001 to 2021 and were predicted for 2031 with indication to the ecosystem values in Damietta governorate. The results showed that there are decreases in the cultivated area and water bodies, while there are increases in the urban area and bare area. The kappa index values are Kno 0.9527, Klocation 0.9969, Klocation 0.9969, and Kstandard 0.9331 which shows a strong agreement between simulated and predicted LULC Maps. The comprehensive index was 258.24, 259.89, 268.96, and 267.74 for 2001, 2011, 2021 and 2031, respectively. The increase in this index reflects the state of development in Damietta Governorate. The ecosystem service values (ESV) and changes in total ESV for the years 2001, 2011, 2021, and 2031 of the entire study landscape were about USD 1,727,934, USD 1,153,482, USD 1,664,119, and USD 1,521,274.74 in 2001, 2011, 2021 and 2031, respectively. As a result, the value of ecosystem services in Damietta Governorate lost USD −574,452 from 2001 to 2011, gained USD 510,637.1 from 2011 to 2021, and then USD −142,844 from 2021 to 2031. This ES evaluation can help in identifying the direction for development and management of land use in Damietta Governorate. The spatio-temporal data had a significant advantage over the conventional approach as well as the development and contraction of the ESV in Damietta Governorate.
Understanding the spatio-temporal dynamics of LUCC and changes in ESV is made easier with the help of the spatial distribution of LUCC and changes in ESV. The present findings will serve as a scientific benchmark for developing ecological policy.
Limitation of the Study
Due to the complex pattern change of LULC in Damietta at a local scale, we first evaluated the LULC patterns using free and open-source Landsat images and a customized classification method. However, this was improved by using Google Earth image archives and ground truth points. Moreover, prediction estimation of ESV depends on LULC using the Markov chain. Additionally, more specific biophysical factors for sensitivity analysis will be considered. High-resolution satellite images can provide better classification results, improving the estimation of ESV, which can support regional and local adaptations of ecosystem services and sustainable management of natural resources
Author Contributions
H.T.A.E.-H., H.N.-E., N.Y.R., and A.M.E.-Z. contributed significantly to the manuscript preparation. H.T.A.E.-H., H.N.-E., and A.M.E.-Z. processed the satellite images, generated the spatial distribution maps, performed the statistical analyses, and tabulated the study results. H.T.A.E.-H., H.N.-E. and A.M.E.-Z. wrote the first draft of the manuscript. H.T.A.E.-H., H.N.-E., N.Y.R. and A.M.E.-Z. revised the final version of the manuscript. All authors have read and agreed to the published version of the manuscript.
Funding
This paper has been supported by the RUDN University Strategic Academic Leadership Program.
Data Availability Statement
All data generated or analyzed during this study are included and available in this article.
Acknowledgments
The authors express their appreciation to the USGS (
http://glovis.usgs.gov/) accessed on 3 March 2022 for the availability of freely downloadable Landsat images that were used in the present study.
Conflicts of Interest
The authors declare that they have no competing interests.
References
- Dickinson, R.E. Land processes in climate models. Remote Sens. Environ. 1995, 51, 27–38. [Google Scholar] [CrossRef]
- Gupta, M.; Srivastava, P.K. Integrating GIS and remote sensing for identification of groundwater potential zones in the hilly terrain of Pavagarh, Gujarat, India. Water Int. 2010, 35, 233–245. [Google Scholar] [CrossRef]
- Patel, D.; Dholakia, M.; Naresh Nand Srivastava, P. Water harvesting structure positioning by using geo-visualization concept and prioritization of mini-watersheds through morphometric analysis in the lower Tapi Basin. J. Indian Soc. Remote Sens. 2012, 40, 299–312. [Google Scholar] [CrossRef]
- Lambin, E.F.; Geist, H.J.; Lepers, E. Dynamics of land-use and landcover change in tropical regions. Annu. Rev. Environ. Resour. 2003, 28, 205–241. [Google Scholar] [CrossRef]
- Liou, Y.A.; Nguyen, A.K.; Li, M.H. Assessing spatiotemporal eco-environmental vulnerability by Landsat data. Ecol. Indic. 2017, 80, 52–65. [Google Scholar] [CrossRef]
- Nguyen, K.A.; Liou, Y.A. Mapping global eco-environment vulnerability due to human and nature disturbances. MethodsX 2019, 6, 862–875. [Google Scholar] [CrossRef] [PubMed]
- Talukdar, S.; Pal, S. Effects of damming on the hydrological regime of Punarbhaba river basin wetlands. Ecol. Eng. 2019, 135, 61–74. [Google Scholar] [CrossRef]
- Talukdar, S.; Singha, P.; Mahato, S.; Praveen, B.; Rahman, A. Dynamics of ecosystem services (ESs) in response to land use land cover (LU/LC) changes in the lower Gangetic plain of India. Ecol. Indic. 2020, 112, 106121. [Google Scholar] [CrossRef]
- Nguyen, K.A.; Liou, Y.A.; Tran, H.P.; Hoang, P.P.; Nguyen, T.H. Soil salinity assessment by using near-infrared channel and Vegetation Soil Salinity Index derived from Landsat 8 OLI data: A case study in the Tra Vinh Province, Mekong Delta, Vietnam. Prog. Earth Planet. Sci. 2020, 7, 1. [Google Scholar] [CrossRef]
- Mas, J.F.; Lemoine-Rodríguez, R.; González-López, R.; López-Sánchez, J.; Piña-Garduño, A.; Herrera-Flores, E. Land use/land cover change detection combining automatic processing and visual interpretation. Eur. J. Remote Sens. 2017, 50, 626–635. [Google Scholar] [CrossRef]
- Dutta, D.; Rahman, A.; Paul, S.K.; Kundu, A. Changing pattern of urban landscape and its effect on land surface temperature in and around Delhi. Environ. Monit. Assess. 2019, 191, 551. [Google Scholar] [CrossRef]
- Kumari, B.; Tayyab, M.; Hang, H.T.; Khan, M.F.; Rahman, A. Assessment of public open spaces (POS) and landscape quality based on per capita POS index in Delhi, India. SN Appl. Sci. 2019, 1, 368. [Google Scholar]
- Stefanidis, S.; Alexandridis, V.; Mallinis, G. A cloud-based mapping approach for assessing spatiotemporal changes in erosion dynamics due to biotic and abiotic disturbances in a Mediterranean Peri-Urban forest. Catena 2022, 218, 106564. [Google Scholar] [CrossRef]
- Rimal, B.; Sharma, R.; Kunwar, R.; Keshtkar, H.; Stork, E.N.; Rijal, S.; Ajijur, R.S.; Baral, H. Effects of land use and land cover change on ecosystem services in the Koshi River Basin, Eastern Nepal. Ecosyst. Serv. 2019, 38, 100963. [Google Scholar] [CrossRef]
- Dewan, A.M.; Yamaguchi, Y. Land use and land cover change in Greater Dhaka, Bangladesh: Using remote sensing to promote sustainable urbanization. Appl. Geogr. 2009, 29, 390–401. [Google Scholar] [CrossRef]
- Wang, Y.; Zhang, X. A dynamic modeling approach to simulating socioeconomic effects on landscape changes. Ecol. Model. 2001, 140, 141–162. [Google Scholar] [CrossRef]
- Hussain, S.; Mubeen, M.; Ahmad, A.; Majeed, H.; Qaisrani, S.A.; Hammad, H.M.; Amjad, M.; Ahmad, I.; Fahad, S.; Ahmad, N.; et al. Assessment of land use/land cover changes and its effect on land surface temperature using remote sensing techniques in Southern Punjab, Pakistan. Environ. Sci. Pollut. Res. 2022. [Google Scholar] [CrossRef]
- Hussain, S.; Mubeen, M.; Karuppannan, S. Land use and land cover (LULC) change analysis using TM, ETM+ and OLI Landsat images in district of Okara, Punjab, Pakistan. Phys. Chem. Earth Part A/B/C 2022, 126, 103117. [Google Scholar] [CrossRef]
- Hu, H.-B.; Liu, H.-Y.; Hao, J.-F.; An, J. Analysis of land use change characteristics based on remote sensing and gis in the Jiuxiang River watershed. Int. J. Smart Sens. Intell. Syst. 2012, 5, 811–823. [Google Scholar] [CrossRef]
- Kumar, S.; Radhakrishnan, N.; Mathew, S. Land use change modelling using a Markov model and remote sensing. Geomat. Nat. Hazards Risk 2014, 5, 145–156. [Google Scholar] [CrossRef]
- Zhang, R.; Tang, C.; Ma, S.; Yuan, H.; Gao, L.; Fan, W. Using Markov chains to analyze changes in wetland trends in arid Yinchuan Plain, China. Math. Comput. Model. 2011, 54, 924–930. [Google Scholar] [CrossRef]
- Ghosh, P.; Mukhopadhyay, A.; Chanda, A.; Mondal, P.; Akhand, A.; Mukherjee, S.; Nayak, S.K.; Ghosh, S.; Mitra, D.; Ghosh, T.; et al. Application of Cellular automata and Markov-chain model in geospatial environmental modeling—A review. Remote Sens. Appl. Soc. Environ. 2017, 5, 64–77. [Google Scholar] [CrossRef]
- Du, Y.-K.; Yan, Q.; Luo, C.-F. Monitoring and predicting the changes of vegetation coverage in Shijiazhuang from 1995 to 2015. In Proceedings of the 2016 IEEE International Geoscience and Remote Sensing Symposium IGARSS 2016, Beijing, China, 10–15 July 2016; pp. 2324–2327. [Google Scholar]
- Halmy, M.W.A.; Gessler, P.E.; Hicke, J.A.; Salem, B.B. Land use/land cover change detection and prediction in the north-western coastal desert of Egypt using Markov-CA. Appl. Geogr. 2015, 63, 101–112. [Google Scholar] [CrossRef]
- Gong, W.; Yuan, L.; Fan, W.; Stott, P. Analysis and simulation of land use spatial pattern in Harbin prefecture based on trajectories and cellular automata—Markov modelling. Int. J. Appl. Earth Obs. Geoinf. 2015, 34, 207–216. [Google Scholar] [CrossRef]
- Lillesand, T.W.; Kiefer, R.W.; Chipman, J.W. Remote Sensing and Image Interpretation, 5th ed.; John Wiley & Sons: New York, NY, USA, 2003; p. 70. [Google Scholar]
- Di- Gregaria, A.; Jonsen, L.J. Land Cover Classification System. Concepts and User Manual; FAO: Rome, Italy, 2005. [Google Scholar]
- He, D.; Zhou, J.; Gao, W.; Guo, H.Y.U.S.; Liu, Y. An integrated CA–markov model for dynamic simulation of land use change in Lake Dianchi watershed. Beijing Daxue Xuebao (Ziran Kexue Ban). Acta Sci. Nat. Univ. Pekin. 2014, 50, 1095–1105. [Google Scholar]
- Guan, D.; Li, H.; Inohae, T.; Su, W.; Nagaie, T.; Hokao, K. Modeling urban land use change by the integration of cellular automaton and Markov model. Ecol. Model. 2011, 222, 3761–3772. [Google Scholar] [CrossRef]
- Fang, J.; Liao, Z.D. Forestry landscape patterns changes and dynamic simulation of Nanling National Nature Reserve, Guangdong. Sciatica Geogr. Sin. 2014, 34, 1099–1107. [Google Scholar]
- El-Hamid, H.T.A.; Caiyong, W.; Yongting, Z. Geospatial analysis of land use driving force in coal mining area: Case study in Ningdong, China. GeoJournal 2019, 86, 605–620. [Google Scholar] [CrossRef]
- Abu-Hashim, M.; Mohamed, E.; Belal, A.E. Identification of potential soil water retention using hydric numerical model at arid regions by land-use changes. Int. Soil Water Conserv. Res. 2015, 3, 305–315. [Google Scholar] [CrossRef]
- Luo, G.; Amuti, T.; Zhu, L.; Mambetov, B.T.; Maisupova, B.; Zhang, C. Dynamics of landscape patterns in an inland river delta of Central Asia based on a cellular automata-Markov model. Reg. Env. Change 2015, 15, 277–289. [Google Scholar] [CrossRef]
- Gasmi, A.; Masse, A.; Ducrot, D.; Zouari, H. Teledetection Et Photogrammetrie Pour L’etude De La Dynamique De L’occupation Du Sol Dans Le Bassin Versant De L’oued Chiba (Cap-Bon, Tunisie). Rev. Fr. Photogramm. Télédétect. 2017, 215, 43–51. [Google Scholar] [CrossRef]
- Costanza, R.; d’Arge, R.; de Groot, R.; Farber, S.; Grasso, M.; Hannon, B.; Limburg, K.; Naeem, S.; O’Neill, R.V.; Paruelo, J.; et al. The value of the world’s ecosystem services and natural capital. Nature 1997, 387, 253–260. [Google Scholar] [CrossRef]
- El-Zeiny, A.M.; Effat, H.A. Environmental monitoring of spatiotemporal change in land use/land cover and its impact on land surface temperature in El-Fayoum governorate, Egypt. Remote Sens. Appl. Soc. Environ. 2017, 8, 266–277. [Google Scholar] [CrossRef]
- Mohamed, E.S.; Baroudy, A.A.E.; El-beshbeshy, T.; Emam, M.; Belal, A.A.; Elfadaly, A.; Lasaponara, R. Vis-nir spectroscopy and satellite landsat-8 oli data to map soil nutrients in arid conditions: A case study of the northwest coast of Egypt. Remote Sens. 2020, 12, 3716. [Google Scholar] [CrossRef]
- Said, M.E.S.; Ali, A.M.; Borin, M.; Abd-Elmabod, S.K.; Aldosari, A.A.; Khalil, M.M.; Abdel-Fattah, M.K. On the use of multivariate analysis and land evaluation for potential agricultural development of the northwestern coast of Egypt. Agronomy 2020, 10, 1318. [Google Scholar] [CrossRef]
- Abd El-Hamid, H.T.; El-Alfy, M.A.; Elnaggar, A. Prediction of future situation of land use/cover change and modeling sensitivity to pollution in Edku Lake. Egypt based on geospatial analyses. GeoJournal 2020, 86, 1895–1913. [Google Scholar] [CrossRef]
Figure 1.
The location map showing Damietta governorate.
Figure 1.
The location map showing Damietta governorate.
Figure 2.
Flow chart illustrates methods of LULC and ESV assessment.
Figure 2.
Flow chart illustrates methods of LULC and ESV assessment.
Figure 3.
Increase/decrease in land cover (km2).
Figure 3.
Increase/decrease in land cover (km2).
Figure 4.
LULC of Damietta governorate at 2001.
Figure 4.
LULC of Damietta governorate at 2001.
Figure 5.
LULC of Damietta governorate at 2011.
Figure 5.
LULC of Damietta governorate at 2011.
Figure 6.
LULC of Damietta governorate at 2021.
Figure 6.
LULC of Damietta governorate at 2021.
Figure 7.
LULC prediction of Damietta governorate at 2031.
Figure 7.
LULC prediction of Damietta governorate at 2031.
Table 1.
The accuracy (%) for all images of (2001, 2011, and 2021).
Table 1.
The accuracy (%) for all images of (2001, 2011, and 2021).
| Class | Producer’s Accuracy | User’s Accuracy |
|---|
2001
Cultivated area
Water bodies
Urban area
Bare land |
100
99.07
100
91.36 |
99.83
99.07
90
100 |
2011
Cultivated area
Water bodies
Urban area
Bare land |
99.67
98.00
98.33
99.33 |
99.34
100.00
99.66
99.34 |
2021
Cultivated area
Water bodies
Urban area
Bare land |
100
95.24
100
92.86 |
100
95.24
95.12
100 |
Table 2.
Levels/categories of land-use intensity.
Table 2.
Levels/categories of land-use intensity.
| Intensity Level | Land-Use Type | Value |
|---|
| Unused level | Unused land and intertidal zone/bare | 1 |
| Light utilization level | Water bodies | 2 |
| Strong utilization level | Cultivated | 4 |
| High-strength utilization level | Construction land/urban | 5 |
Table 3.
Ecosystem services value per unit area (ESVK) of land types (USD ha−1 y−1).
Table 3.
Ecosystem services value per unit area (ESVK) of land types (USD ha−1 y−1).
| Ecosystem Services | Sub-Types | Value Coefficients |
|---|
| Water Bodies | Cultivated | Built Up | Unused Land |
|---|
| Provisioning Services | FP | 30.99 | 27.4 | 0 | 1.17 |
| RMP | 20.47 | 247.45 | 0 | 2.34 |
| Regulation services | GR | 29.82 | 358.72 | 0 | 3.51 |
| CR | 120.46 | 337.96 | 0 | 7.6 |
| HR | 1097.61 | 339.62 | 0 | 4.09 |
| WT | 868.38 | 142.82 | 0 | 15.2 |
| Regulation services | SC | 23.98 | 333.81 | 0 | 9.94 |
| BC | 200.57 | 374.5 | 0 | 23.39 |
| Cultural services | R & C | 259.64 | 17,272 | 0 | 14.03 |
| Total | 2651 | 2334.99 | 0 | 81.28 |
Table 4.
Changes in LU/LC (km2) and percentage (%) from 2001–2031.
Table 4.
Changes in LU/LC (km2) and percentage (%) from 2001–2031.
| LU/LC | 2001 | 2011 | 2021 | 2031 |
|---|
| km2 | % | km2 | % | km2 | % | km2 | % |
|---|
| Bare land | 102.43 | 11.61 | 52.35 | 5.93 | 22.52 | 2.55 | 60.21 | 6.83 |
| Urban | 65.69 | 7.45 | 124.57 | 14.12 | 176.67 | 20.03 | 201.31 | 22.82 |
| Water | 165.81 | 18.8 | 213.03 | 24.15 | 213.99 | 24.26 | 212.85 | 24.13 |
| Cultivated area | 548.2 | 62.15 | 492.17 | 55.79 | 468.96 | 53.16 | 407.76 | 46.22 |
Table 5.
Probability matrix of LU/LC transition from 2001–2031.
Table 5.
Probability matrix of LU/LC transition from 2001–2031.
| LULC | Water | Urban | Bare | Cultivated |
|---|
| 2001–2011 |
| Water | 0.802 | 0.022 | 0.135 | 0.039 |
| Urban | 0.016 | 0.654 | 0.026 | 0.303 |
| Bare | 0.5 | 0.144 | 0.339 | 0.018 |
| Cultivated | 0.025 | 0.219 | 0.02 | 0.734 |
| 2011–2021 |
| Water | 0.0544 | 0.22 | 0.32 | 0.399 |
| Urban | 0.0078 | 0.75 | 0.18 | 0.05 |
| Bare | 0.022 | 0.56 | 0.288 | 0.125 |
| Cultivated | 0.0611 | 0.29 | 0.34 | 0.297 |
| 2021–2031 |
| Water | 0.252 | 0.363 | 0.065 | 0.318 |
| Urban | 0.136 | 0.241 | 0.022 | 0.598 |
| Bare | 0.409 | 0.328 | 0.044 | 0.217 |
| Cultivated | 0.073 | 0.275 | 0.011 | 0.639 |
Table 6.
Transition of LU/LC (km2) from 2001–2011.
Table 6.
Transition of LU/LC (km2) from 2001–2011.
| LULC | Bare | Cultivated | Urban | Water | Grand Total |
|---|
| Bare | 38.34 | 5.54 | 1.15 | 6.56 | 51.58 |
| Cultivated | 1.57 | 471.20 | 12.85 | 1.72 | 487.35 |
| Urban | 12.69 | 60.48 | 51.83 | 0.89 | 125.89 |
| Water | 44.76 | 6.57 | 0.61 | 162.33 | 214.26 |
| Grand Total | 97.36 | 543.78 | 66.44 | 171.50 | 879.08 |
Table 7.
Transition of LU/LC (km2) from 2011–2021.
Table 7.
Transition of LU/LC (km2) from 2011–2021.
| LULC | Water | Urban | Cultivated | Bare | Grand Total |
|---|
| Bare | 4.5 | 0.18 | 0.8 | 14.69 | 20.17 |
| Cultivated | 1.32 | 29.02 | 428.48 | 1.34 | 460.16 |
| Urban | 2.21 | 95.66 | 53.3 | 30.66 | 181.83 |
| Water | 206.34 | 1.05 | 3.95 | 4.97 | 216.32 |
| Grand Total | 214.38 | 125.91 | 486.53 | 51.66 | 878.48 |
Table 8.
Transition of LU/LC (km2) from 2001–2021.
Table 8.
Transition of LU/LC (km2) from 2001–2021.
| LULC | Water | Urban | Cultivated | Bare | Grand Total |
|---|
| Bare | 5.48 | 0.42 | 2.52 | 11.55 | 19.97 |
| Cultivated | 0.98 | 11.76 | 446.66 | 1.02 | 460.43 |
| Urban | 2.49 | 53.68 | 85.98 | 39.73 | 181.87 |
| Water | 162.42 | 0.61 | 8.14 | 44.95 | 216.12 |
| Grand Total | 171.38 | 66.47 | 543.30 | 97.24 | 878.40 |
Table 9.
Transition of LU/LC (km2) from 2021–2031.
Table 9.
Transition of LU/LC (km2) from 2021–2031.
| LULC | Water | Urban | Cultivated | Bare | Grand Total |
|---|
| Bare | 7.12 | 31.13 | 5.66 | 14.99 | 58.91 |
| Cultivated | 2.3 | 35.63 | 367.66 | 0.07 | 405.65 |
| Urban | 2.88 | 112.46 | 83.84 | 0.61 | 199.79 |
| Water | 203.19 | 1.95 | 2.15 | 4.02 | 211.31 |
| Grand Total | 215.49 | 181.17 | 459.31 | 19.69 | 875.66 |
Table 10.
Result of Kappa index for model validation.
Table 10.
Result of Kappa index for model validation.
| Kappa Indices | CA-Markov |
|---|
| Kno | 0.9527 |
| Klocation | 0.9969 |
| KlocationStrata | 0.9969 |
| Kstandard | 0.9331 |
Table 11.
Land use Dynamic of LU/LC.
Table 11.
Land use Dynamic of LU/LC.
| LU/LC | 2001 | 2011 | 2021 | 2031 |
| Bare land | 23.22 | 11.87 | 5.11 | 13.65 |
| Urban | 29.79 | 56.49 | 80.11 | 91.28 |
| Water | 18.8 | 24.15 | 24.26 | 24.13 |
| Cultivated land | 186.44 | 167.38 | 159.49 | 138.67 |
| L | 258.24 | 259.89 | 268.96 | 267.74 |
| Δ L | 2001–2011 | 2011–2021 | 2001–2021 | 2021–2031 |
| 11.65 | 19.07 | 30.72 | 8.78 |
| R (%) | 0.0051 | 0.0083 | 0.0134 | 0.0038 |
Table 12.
The changes in the values of different ES functions in Damietta Governorate during 2001–2031.
Table 12.
The changes in the values of different ES functions in Damietta Governorate during 2001–2031.
| ES Functions | 2001 | 2011 | 2021 | 2031 |
|---|
| FP | 5.253941 | 25.34326 | 10.9005 | 29.14788 |
| RMP | 23.84033 | 114.9978 | 49.4624 | 132.2617 |
| GR | 34.58374 | 166.8204 | 71.7522 | 191.8641 |
| CR | 41.10882 | 198.2952 | 85.29 | 228.0641 |
| HR | 127.1425 | 613.2932 | 263.787 | 705.3631 |
| WT | 90.54138 | 436.7414 | 187.849 | 502.3067 |
| SC | 32.43841 | 156.4721 | 67.3012 | 179.9622 |
| BC | 52.79169 | 254.6495 | 109.529 | 292.8785 |
| R& C | 446.9969 | 7465.823 | 3211.17 | 8586.621 |
Table 13.
Ecosystem Service Values (ESVs; USD) for each LULC type of Damietta Governorate.
Table 13.
Ecosystem Service Values (ESVs; USD) for each LULC type of Damietta Governorate.
| ESV | 2001 | 2011 | 2021 | 2031 | 2001–2011 | 2011–2021 | 2021–2031 |
|---|
| Water | 439,556.3 | 453,805.9 | 567,282.9 | 564,265.35 | −439,552 | 567,278.4 | −3017.58 |
| Cultivated | 1,280,052 | 1,149,222 | 1,095,006 | 952,115.52 | −130,830 | −54,216.4 | −142,890 |
| Bare lands | 8325.121 | 4255.083 | 1830.177 | 4893.8688 | −4070.04 | −2424.91 | 3063.692 |
| Built up | 0 | 0 | 0 | 0 | 0 | 0 | 0 |
| Total | 1,727,934 | 1,153,482 | 1,664,119 | 1,521,274.7 | −574,452 | 510,637.1 | −142,844 |
| Publisher’s Note: MDPI stays neutral with regard to jurisdictional claims in published maps and institutional affiliations. |
© 2022 by the authors. Licensee MDPI, Basel, Switzerland. This article is an open access article distributed under the terms and conditions of the Creative Commons Attribution (CC BY) license (https://creativecommons.org/licenses/by/4.0/).


