Article

Equity Study on Urban Park Accessibility Based on Improved 2SFCA Method in Zhengzhou, China

1
Institute of Landscape Architecture, Urban Planning and Garden Art, Hungarian University of Agriculture and Life Sciences, 1118 Budapest, Hungary
2
College of Landscape Architecture and Art, Henan Agricultural University, Zhengzhou 450002, China
*
Author to whom correspondence should be addressed.
Land 2022, 11(11), 2045; https://doi.org/10.3390/land11112045
Submission received: 10 October 2022 / Revised: 7 November 2022 / Accepted: 10 November 2022 / Published: 15 November 2022
(This article belongs to the Special Issue Urban Regeneration and Local Development)

Abstract

:
The distribution of urban parks is closely related to the opportunities of daily use by residents as well as the performance of the park system. The question as to whether parks are distributed equitably within cities is therefore becoming the focus of attention. However, only a few studies have explored a comprehensive and systematic procedure for urban park accessibility analysis and equity evaluation. In this study, by applying an improved two-step floating catchment area (2SFCA) method and K-means cluster analysis, based on the application of multi-source data, we provide insights into an equity study on park accessibility at the neighborhood scale and urban ring scale in the central urban area of Zhengzhou. These results suggest that the spatial access to parks in Zhengzhou is generally unevenly distributed among neighborhoods, and both the mean and standard deviation of accessibility show an increase from the center to the periphery. The cluster analysis reveals a set of four types of neighborhoods, including a high-supply medium-demand medium-accessibility type (HMM), a low-supply medium-demand low-accessibility type (LML), a high-supply low-demand high-accessibility type (HLH), and a medium-supply high-demand low-accessibility type (MHL), each with different characteristics and causes. The spatial distribution of the accessibility types exhibits both similarities and differences between the urban rings. The findings of this study could serve as a tool for identifying areas in which parks are underserved and the ways in which they differ from other areas, which can guide urban planning to address specific inequities.

1. Introduction

In addressing the social differentiation and spatial segregation in the process of urbanization, spatial equity during the process of urban regeneration among cities around the world has been receiving increasing attention [1,2,3,4,5,6,7,8,9,10]. Especially in China, most cities have experienced extremely rapid urbanization in recent decades. Urban social space is characterized by heterogeneity and complexity [11,12], and presents a series of conflicts, in particular, serious residential segregation problems and inequitable availability of public resources. With growing concerns about this issue, promoting social equity and justice has become crucial for Chinese governments in formulating urban development policies.
Parks are an important part of urban landscapes, providing environmental, social, and economic benefits to urban areas [13,14,15,16]. In addition, they are widely recognized to play a vital role in enhancing the quality of urban life by providing significant public health and sustainability benefits to urban communities [14,17,18,19]. The distribution of urban parks is closely related to the daily access opportunities of residents, as well as the performance of park systems [20]. The question as to whether parks, as essential public facilities and services, are equitably distributed in the urban space has therefore always been a focus of attention.
Plenty of studies have examined the equity of urban parks by measuring accessibility [10,21,22,23,24], which considers spatial distribution of supply and demand as well as the impact of individual mobility. However, the general geographic approach usually uses park size and proximity to represent the supply of parks, ignoring general preference for different kinds of parks [19,23,25]. Only a few studies have incorporated park quality indicators including features and conditions in the assessment of park services [10,24,26]. Additionally, most of the literature on equity has emphasized the identification of distributional disparity and underserved areas within the study area, while failing to examine the causes behind the spatial differences. To advance comprehensive and systematic equity research and targeted strategy development, it is necessary to investigate spatial patterns of supply, demand, and accessibility.
Our study aims to perform a comprehensive analysis of spatial accessibility of parks at multiple scales based on an improved 2SFCA method, combined with multi-source big data and site survey data, while incorporating K-means cluster analysis for a systematic evaluation of park equity in the central urban area of Zhengzhou. This paper is structured as follows. Section 2 reviews the existing literature on equity and accessibility measures in order to develop our theoretical framework. Section 3 describes the study area, and the data source and processing. Section 4 explains the improved 2SFCA method and K-means cluster analysis adopted for equity evaluation. Section 5 presents the analysis and results of spatial accessibility and equity. Section 6 summarizes the main contributions and discusses the limitations. Finally, we conclude and outline practical implications in Section 7.

2. Literature Review

2.1. Accessibility Measurements

Spatial accessibility has gradually become one of the key conceptual approaches to examining urban patterns and processes, especially public resource allocation [22,27,28,29,30]. The concept of spatial accessibility was first proposed by Hansen [31] and defined as “the potential of opportunities for interaction”. Basically, accessibility measures mainly involve the interaction of four spatial and non-spatial components: the spatial distribution of potential destinations, the ease and time of reaching each destination, the type and force of attractiveness of services, as well as individual needs and preferences for services [32,33]. For public facilities and services such as parks and green spaces, hospitals, and schools, the concept of accessibility is of great significance in terms of spatial equity. By effectively correlating the locations of public facilities with population groups, accessibility can intuitively reflect individuals’ use opportunities with respect to public facilities. Therefore, accessibility is an important metric for measuring equity [34,35,36]. Various models and methods have been developed to evaluate access to public facilities and services, which can generally be divided into three main types:
  • Buffer analysis method [37] and network-constrained service area method [38], using a predefined distance/time as the search radius to identify the population covered by a particular public facility or to calculate the number/size of public facilities accessible to a specific location. They implicitly assume that public facilities are equally enjoyed within the covering range, which is not true. In addition, it has difficulty determining the threshold distance/time, especially when distinguishing between different types of public facilities. Furthermore, these accessibility measures lack consideration of residents’ demand.
  • The nearest distance method and the minimum cost method [20,25] assume that residents always choose the closest or most convenient public facilities to visit. However, accessibility is not necessarily better, the shorter the distance is from a given area to public facilities. Since residents have other considerations besides proximity, such as a likely preference for parks of better quality and with larger spaces that may nevertheless be further away, the supply factors of public facilities are not properly considered in accessibility measurements.
  • Gravity-based model [26,28,39] and two-step floating catchment area method [24,40,41] measure the spatial accessibility by the sum of the possibility of multiple facility choices at each demand location. They incorporate the effects of the size/attraction and spatial friction, but this needs to be estimated based on empirical access behavior. The larger the sum of the potentials, the better the accessibility. Compared with the other two types of methods, such models take into account both supply and demand sides, and thus can more comprehensively reflect residents’ access to public facilities.
As a special case of the gravity-based model [42], a two-step floating catchment area method improved by Luo and Wang [40] has become one of the most commonly employed and developed methods. Subsequently, through a series of explorations in the aspects of spatial scale, search radius, distance decay, supply and demand estimation, travel modes, user groups, etc., the rationality of this accessibility measurement is gradually enhanced [24,29,30,35,43].

2.2. Measuring Access to Parks

While extensive research on park accessibility suggests inequitable access in cities around the world, significant gaps remain in how park access is defined. There are many studies that highlight only one aspect of park accessibility or a single park attribute, such as examining travel distance/time cost to the nearest park, and the number of parks covered or the total park area available within a certain travel range. The validity of the findings is limited, since such approaches disregard what kind of parks are available to the residents of the surrounding areas. In addition to access cost and size, park quality is also a key parameter, including recreational opportunities, landscape features, maintenance etc., that has a large impact on park visits and use [10,18,26,44]. Additionally, park category needs to be considered, as it determines different values of per capita park area from a design perspective, and thus affects actual park accessibility. Developing an integrated approach to model park access, incorporating park proximity, size, category, and quality, has important implications for objectively evaluating urban park accessibility.
The difficulty of current accessibility research lies in obtaining high-precision demand data. Estimates of population demand from existing accessibility studies in China rely primarily on census data. However, the census data are aggregated on a relatively rough scale, such as at the district and sub-district level, which is difficult to match with the actual layout scale of urban parks, thus affecting the accurate assessment of accessibility differences and identification of underserved areas in cities. Therefore, population data of small-scale units (e.g., communities and neighborhoods) are needed to more effectively reveal the details of variations in park accessibility.
Travel cost is one of the key factors in measuring park accessibility [8,45]. Traditionally, it is mainly measured by travel distance based on the road network analysis through GIS. However, this approach ignores actual traffic conditions and thus may lead to deviations from reality. To address this limitation, the Application Programming Interface (API) of open map service was introduced to provide real-time navigation data on travel time. On the one hand, focusing on travel time rather than travel distance is more in line with social reality. In this way, on the other hand, travel cost measurement between origin and destination points can reflect factors that affect actual travel time and speed, such as traffic congestions, speed limits, turn restrictions, and other conditions [34,46,47]. Given more accurate and convenient measurement compared to traditional methods, it has gradually been applied to collect travel cost data in recent park accessibility studies [11,19,48].

2.3. Research Purpose and Contributions

To fill the conceptual and methodological limitations of the above reviews, we focus on three specific questions in this study: (1) How to effectively measure the accessibility of urban parks? (2) What are the characteristics of accessibility distribution both at the neighborhood scale and the urban ring scale? (3) What is the accessibility pattern across the city and how do accessibility types differ? First, this study applies an improved 2SFCA method to measure park accessibility, combining park quality with size and category to comprehensively describe park supply, and considering selection probability of residents among multiple available parks. Additionally, residents’ demand is refined by population estimation for neighborhood-scale units. In addition, the measurement of travel cost is improved by applying real-time navigation data. Second, park accessibility is analyzed spatially and statistically both at the neighborhood scale and urban ring scale, so that the characteristics of accessibility distribution can be examined. Lastly, by using K-means cluster analysis, we reveal the accessibility patterns as well as causes behind the spatial accessibility differences. Accordingly, targeted improvement decisions can be made. The findings of this study could serve as a tool for identifying areas of urban park shortage and how they differ from other areas, which can guide urban planning and landscape design to address specific inequities. The research framework is shown in Figure 1.

3. Study Area and Data Preparation

3.1. Study Area

Zhengzhou is the capital of Henan Province in central China, located on the North China Plain and the south bank of the Yellow River. In 2016, the city was designated as a “National Central City” and became a new first-tier city in China. During the rapid urbanization process in recent decades, the central urban area of Zhengzhou has gradually expanded from the center to the periphery in the form of concentric rings. By the end of 2019, there were five rings, defined by four main urban ring roads (Figure 2), with an area of about 1010.3 km2 and a population of 5.22 million (Zhengzhou Municipal Bureau of Statistics). Compared with the outer rings, the inner two rings have higher population density, building density and urban functions. In 2019, Zhengzhou’s per capita park area reached 14.5 m2 (Zhengzhou Municipal Bureau of Statistics), which was at a relatively high level compared with Shanghai’s per capita park area of 8.4 m2 (Shanghai Municipal Bureau of Statistics). Zhengzhou was approved as one of the National Ecological Garden Cities in 2020. However, previous studies have shown that park allocation varies widely in our study area [48,49,50].

3.2. Data Source and Processing

3.2.1. Data on Supply of Parks

Regarding supply, the attributes of parks, including size, category and quality were applied to comprehensively consider the supply effect of parks. We extracted the AOI (Area of Interest) of parks through a widely used map platform in China, Amap (https://ditu.amap.com/ (accessed on 9 October 2022)). A total of 163 urban public parks in the central urban area of Zhengzhou were included, ranging from 1 ha to 374 ha in size. As specified in the Standard for Classification of Urban Green Space (CJJ/T85-2017), there were 41 urban parks, 31 theme parks, 19 community parks, and 72 linear parks (Figure 3). Urban parks and theme parks are designed to attract citizens from the entire city. Community parks and linear parks are mainly built to meet the demand of the surrounding residential areas. Given that actual entrances can affect the scope of services provided by parks, multiple entrances to each park were used as supply points rather than geographic centroids [20,37,51]. Through Google Earth image recognition combined with on-site investigations, a total of 864 entrances of these parks were identified. To measure park quality, we assessed the facilities and amenities within each park, and also the presence or absence of water bodies, based on fieldwork and Google Earth imagery. The ratio of tree coverage was derived from high-spatial-resolution GF-2 satellite imagery (2017), classified and calculated in ArcGIS 10.8.

3.2.2. Data on Demand of Population

For demand, the centroid of each neighborhood was used to reflect the demand location of potential visitor population of parks. The neighborhood population was calculated and aggregated at residential building level. The AOI data of neighborhoods and residential buildings were obtained through Baidu Maps, one of the most popular Chinese map platforms (https://map.baidu.com/ (accessed on 9 October 2022)). In the central urban area of Zhengzhou, a total of 4180 neighborhoods and 49,397 residential buildings were identified after data screening and cleaning. The residential building data includes the footprint area and the number of floors. According to the 2019 Zhengzhou Statistical Yearbook, the per capita living area is 31 m2. Thus, the number of residents in each neighborhood were estimated as follows. The calculated total population of each district has been verified to be roughly in line with the 2019 demographic data.
P = l = 1 n S l N l R
where P denotes the potential population of the neighborhood; Sl is the footprint area of each residential building l in the neighborhood; Nl is the number of floors corresponding to each residential building l; R is the per capita living area; and n is the number of residential buildings in the neighborhood.

3.2.3. Data on Travel Cost
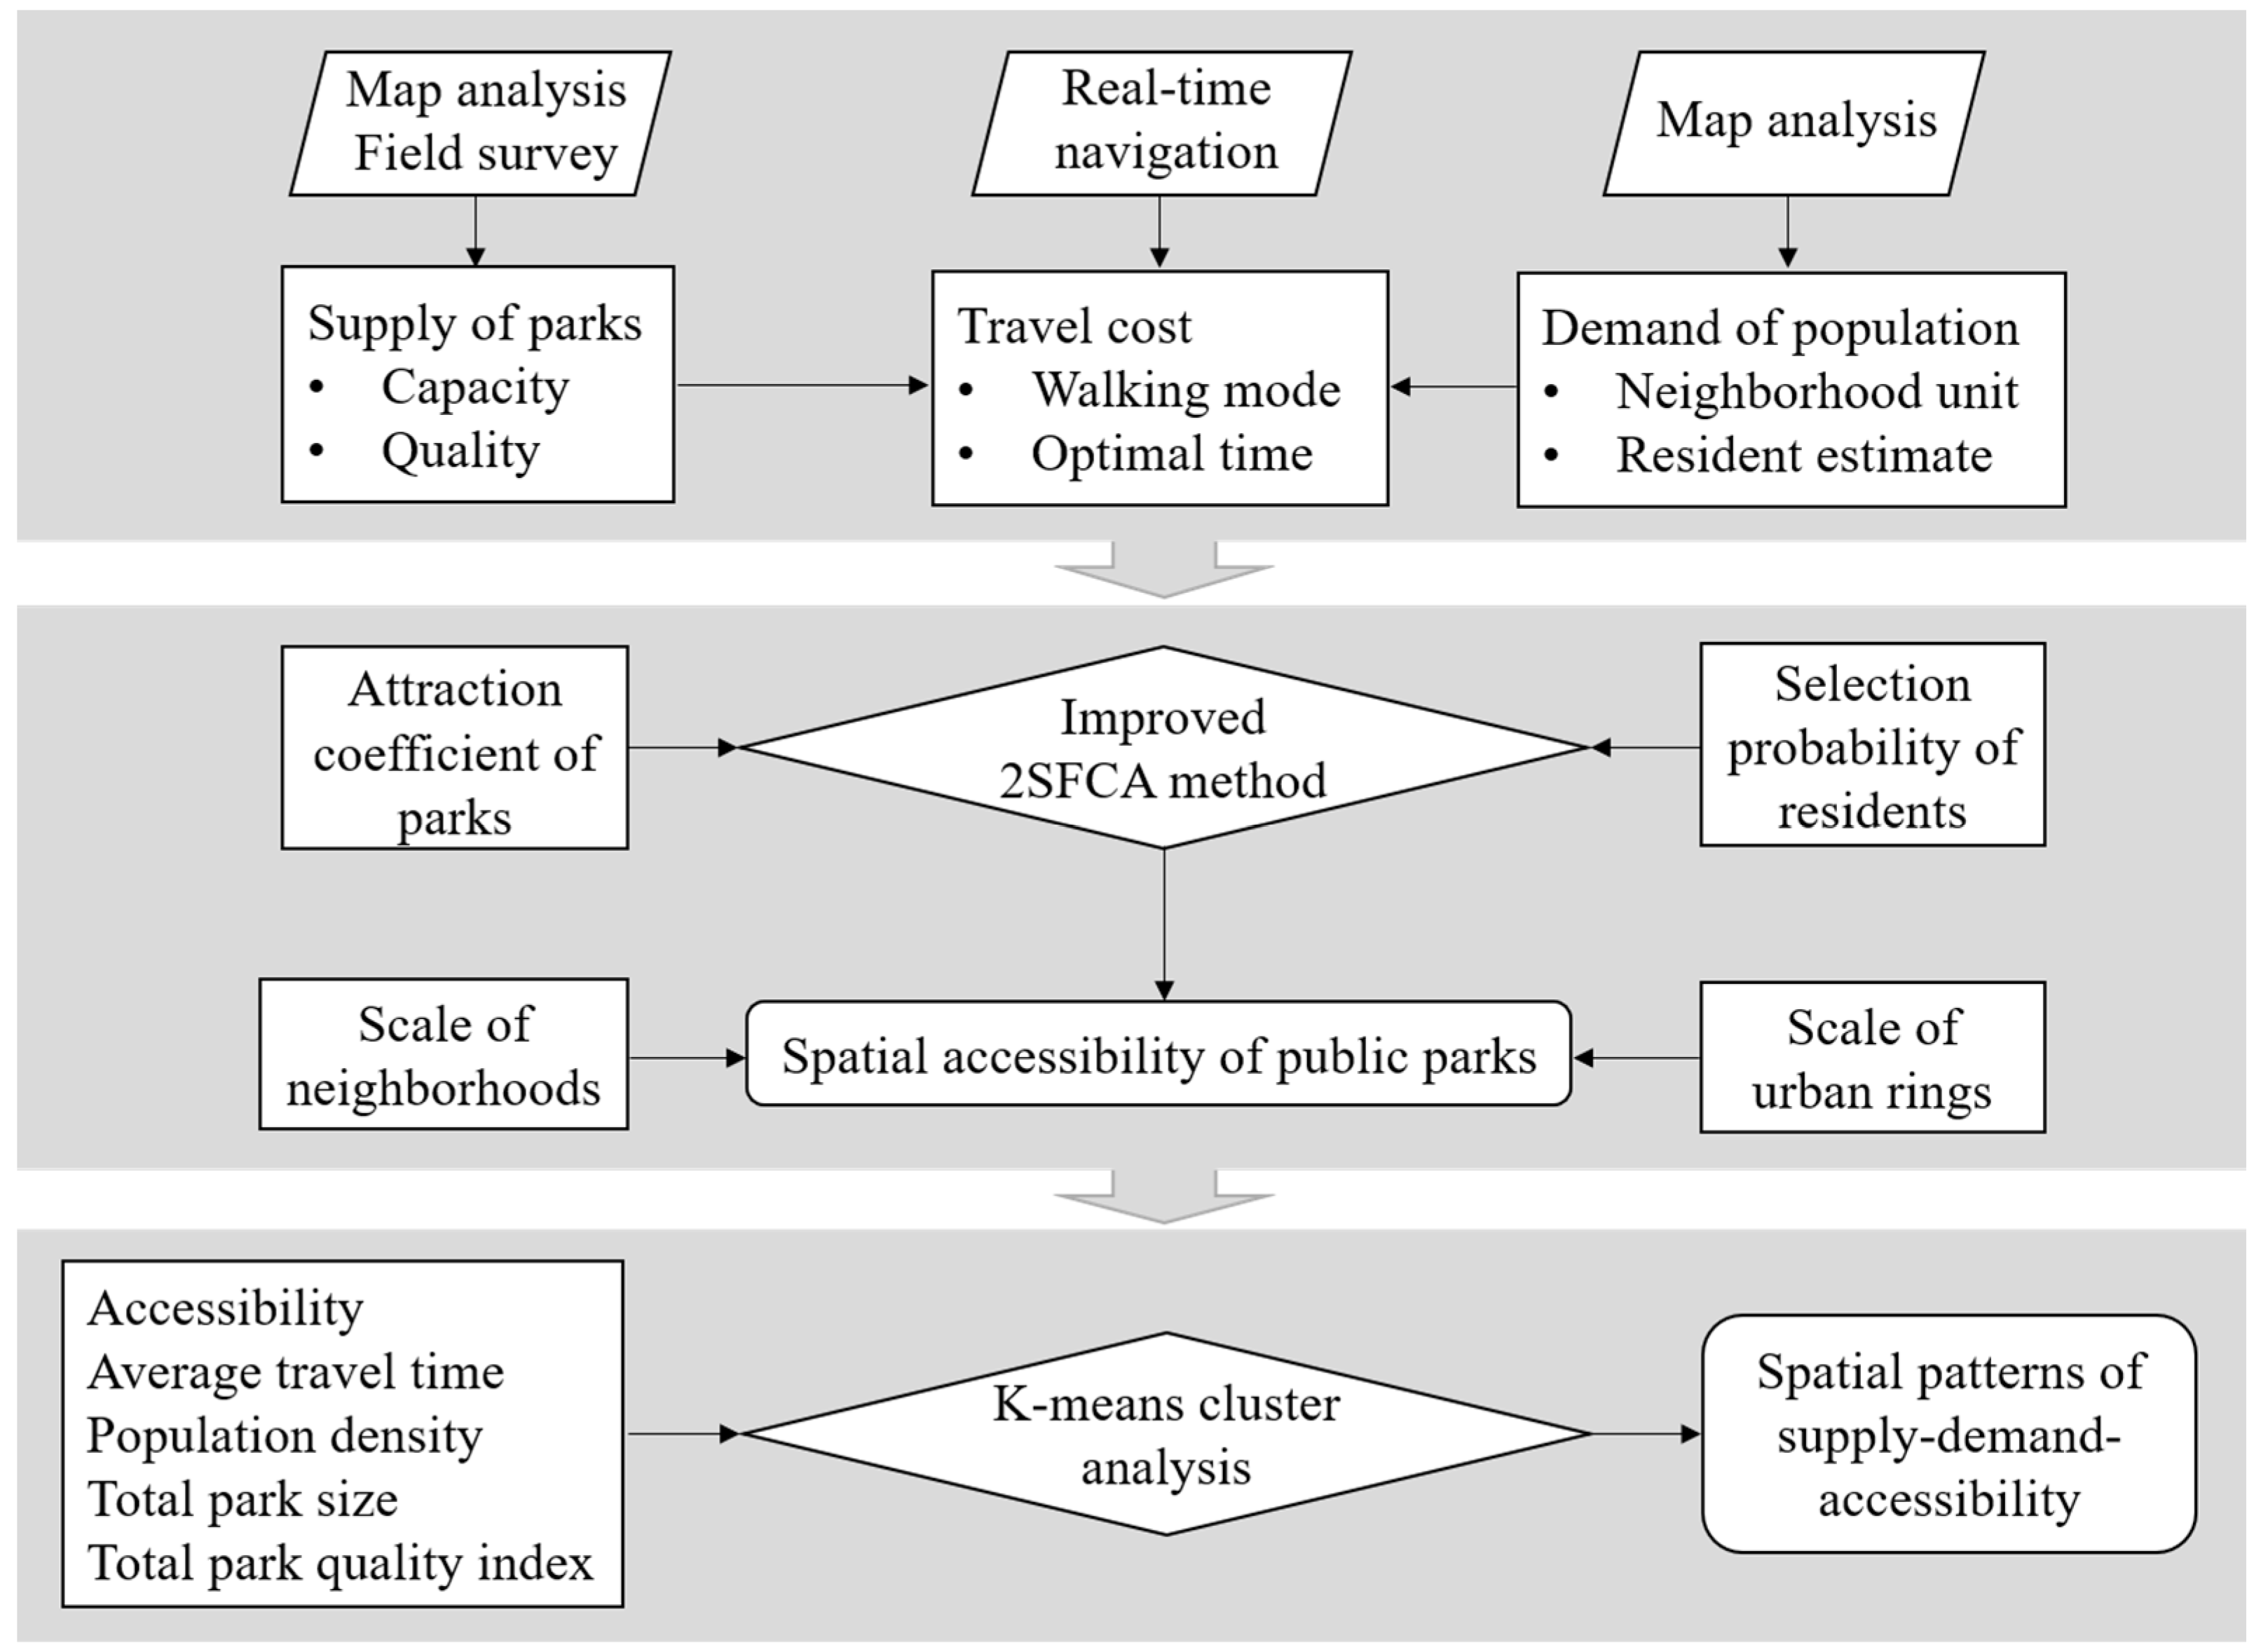
The travel time was obtained using the API service of Baidu Maps based on the actual travel situation between two geographic locations within the study area. Taking the entrances of 163 parks as destination points and the centroids of 4180 neighborhoods as origin points, we collected the optimal time cost of several travel paths from each neighborhood to the different entrances to each park in walking mode. Figure 4 presents an example visualization where path 1 takes the shortest time from the neighborhood to the park, and thus 9 min is filtered into the database. Walking is the main mode for urban residents to reach the parks on a daily basis. The travel time threshold, t0, was designated as 30 min, since this represents the maximum time that can be widely accepted for routine park visits [11,24]. While real-time traffic conditions can affect the travel time by public transport and driving even on the same travel route, the actual time cost is less affected when walking on sidewalks. Therefore, the variation in acquisition time due to the large amount of data made little difference for our results.

4. Methodology

4.1. Improved 2SFCA Method

The classic two-step floating catchment area (2SFCA) model takes into account both supply and demand factors. It has been extensively applied to evaluate access to public facilities and services, thus providing an important foundation for our study. In terms of supply, urban parks of higher quality levels and greater service capacity are positively correlated with higher rates of park access and use. Therefore, several studies have introduced park quality and park capacity to assess park supply [18,24].
For park quality, we described residents’ destination parks on the basis of facilities and amenities, water features, and tree canopy. According to previous studies [44,52,53], these are the major characteristics of park quality that influence park visits. Facilities and amenities were assessed regarding the presence and condition of three aspects, specified in “Code for the design of public parks (GB51192-2016)”: recreational amenities, service amenities, and management facilities. During on-site investigations, all selected parks were classified into five grades, from 0 to 1, representing the amenities provided as from excellent to bad facilities (Table 1). Water features and tree canopy were scored separately, based on the presence of water bodies and the ratio of tree coverage. Additionally, the weights of the three variables were calculated using the AHP (Analytical Hierarchy Process) method. The park quality index is the sum of three weighted variable values for each park, expressed as follows.
        Q j = i = 1 n W i V i
where Qj denotes the quality index of park j; Wi is weight of variable i; Vi is the value of variable i corresponding to park j; and n is the number of variables.
Regarding park capacity, this is affected by park category in addition to park size. Park capacity was expressed as the ratio of park size to per capita park area. According to “Code for the design of public parks (GB 51192-2016)”, the per capita park area varies by park category, with urban parks and linear parks set to 60 m2, and theme parks and community parks set to 30 m2. We applied the attraction coefficient Sj to substitute park size by combining park quality and park capacity to comprehensively reflect the supply effect of parks. This enhanced model is expressed as follows.
S j = A A m Q j
where Sj denotes the attraction coefficient of park j; A is the park size of park j; Am is the per capita park area corresponding to the category of park j; and Qj is the quality index of park j.
The Gaussian decay function [54] was developed to solve spatial friction problems. It can reflect the law that the relationship between supply and demand weakens with the increase in spatial distance. In addition, it is widely used in spatial accessibility measurement of parks, expressed as follows.
G ( t i j ) = { e ( 1 / 2 ) × ( t i j / t 0 ) 2 e ( 1 / 2 ) 1 e ( 1 / 2 ) ( t i j t 0 )                       0                       ( t i j > t 0 )
Given the competition among multiple available parks, recent improved models have only considered the impact of travel impedance on both demand of population and supply of parks [51,55].However, in addition to travel cost, differences in supply effects among multiple available parks can also affect residents’ selection probability. Residents may prefer to visit parks with not only shorter travel time, but also greater appeal. To address this issue, Luo [56] drew on a Huff model to improve the selection weights by introducing park capacity together with travel impedance, without considering park quality. Xing [24] developed the selection probability involving park attractiveness, travel cost, and travel impedance, while the impact of distance decay was doubled into account. We refined the selection probability Probkj of residents in a neighborhood among multiple available parks to improve the weighted estimation of potential demand and supply, as shown below.
P r o b k j = S j G ( t i j ) k { t k j t 0 } S j G ( t i j )
Therefore, in the first step, through travel impedance coefficient G(tij) and selection probability coefficient Probkj, the population of neighborhoods within the travel time threshold of each park was adjusted, and then summed to represent each park’s potential visitors. The supply demand ratio Rj for each park is defined as follows.
R j = S j k { t k j t 0 } P r o b k j P k G ( t i j )
In the second step, the supply demand ratio corresponding to the parks within the travel time threshold of each neighborhood was calculated and weighted by travel impedance coefficient G(tij) and selection probability coefficient Probkj. These weighted supply demand ratios were then summed to obtain park accessibility Ai for each neighborhood, as shown below.
A i = j { t t 0 } P r o b k j R j G ( t i j )
In Formulas (4)–(7), above, Probkj denotes the selection probability of population at k visiting park j; Sj is the attractiveness of park j; tkj is the travel time from k to j; t0 represents the travel time threshold; G(tij) is the travel impedance coefficient; Rj denotes the supply/demand ratio of park j; Pk is the population of neighborhood k; and Ai denotes the park accessibility in neighborhood i.
The improved model is expected to provide an overall evaluation of park accessibility by comprehensively considering the supply of public parks (including park size, category and quality), the demand of neighborhood residents, travel costs, and residents’ selection probability.

4.2. K-Means Cluster Analysis

Based on neighborhood-scale spatial accessibility, a cluster analysis was performed to identify various accessibility types and regions and explore spatial similarities and differences in park accessibility. In various cluster analysis methods, K-means is extensively applied because of its simplicity and efficiency. We adopted it to cluster the major factors with respect to supply, demand, and accessibility, including accessibility, average travel time, population density, total park size, and total park quality index (Table 2). By trying different clustering schemes for three to eight categories, respectively, in SPSS 27, the appropriate number of clusters was determined. Then, the results were imported into ArcGIS 10.8 for spatial visualization. The clusters can reflect accessibility patterns as well as explain the causes behind spatial accessibility differences.

5. Results

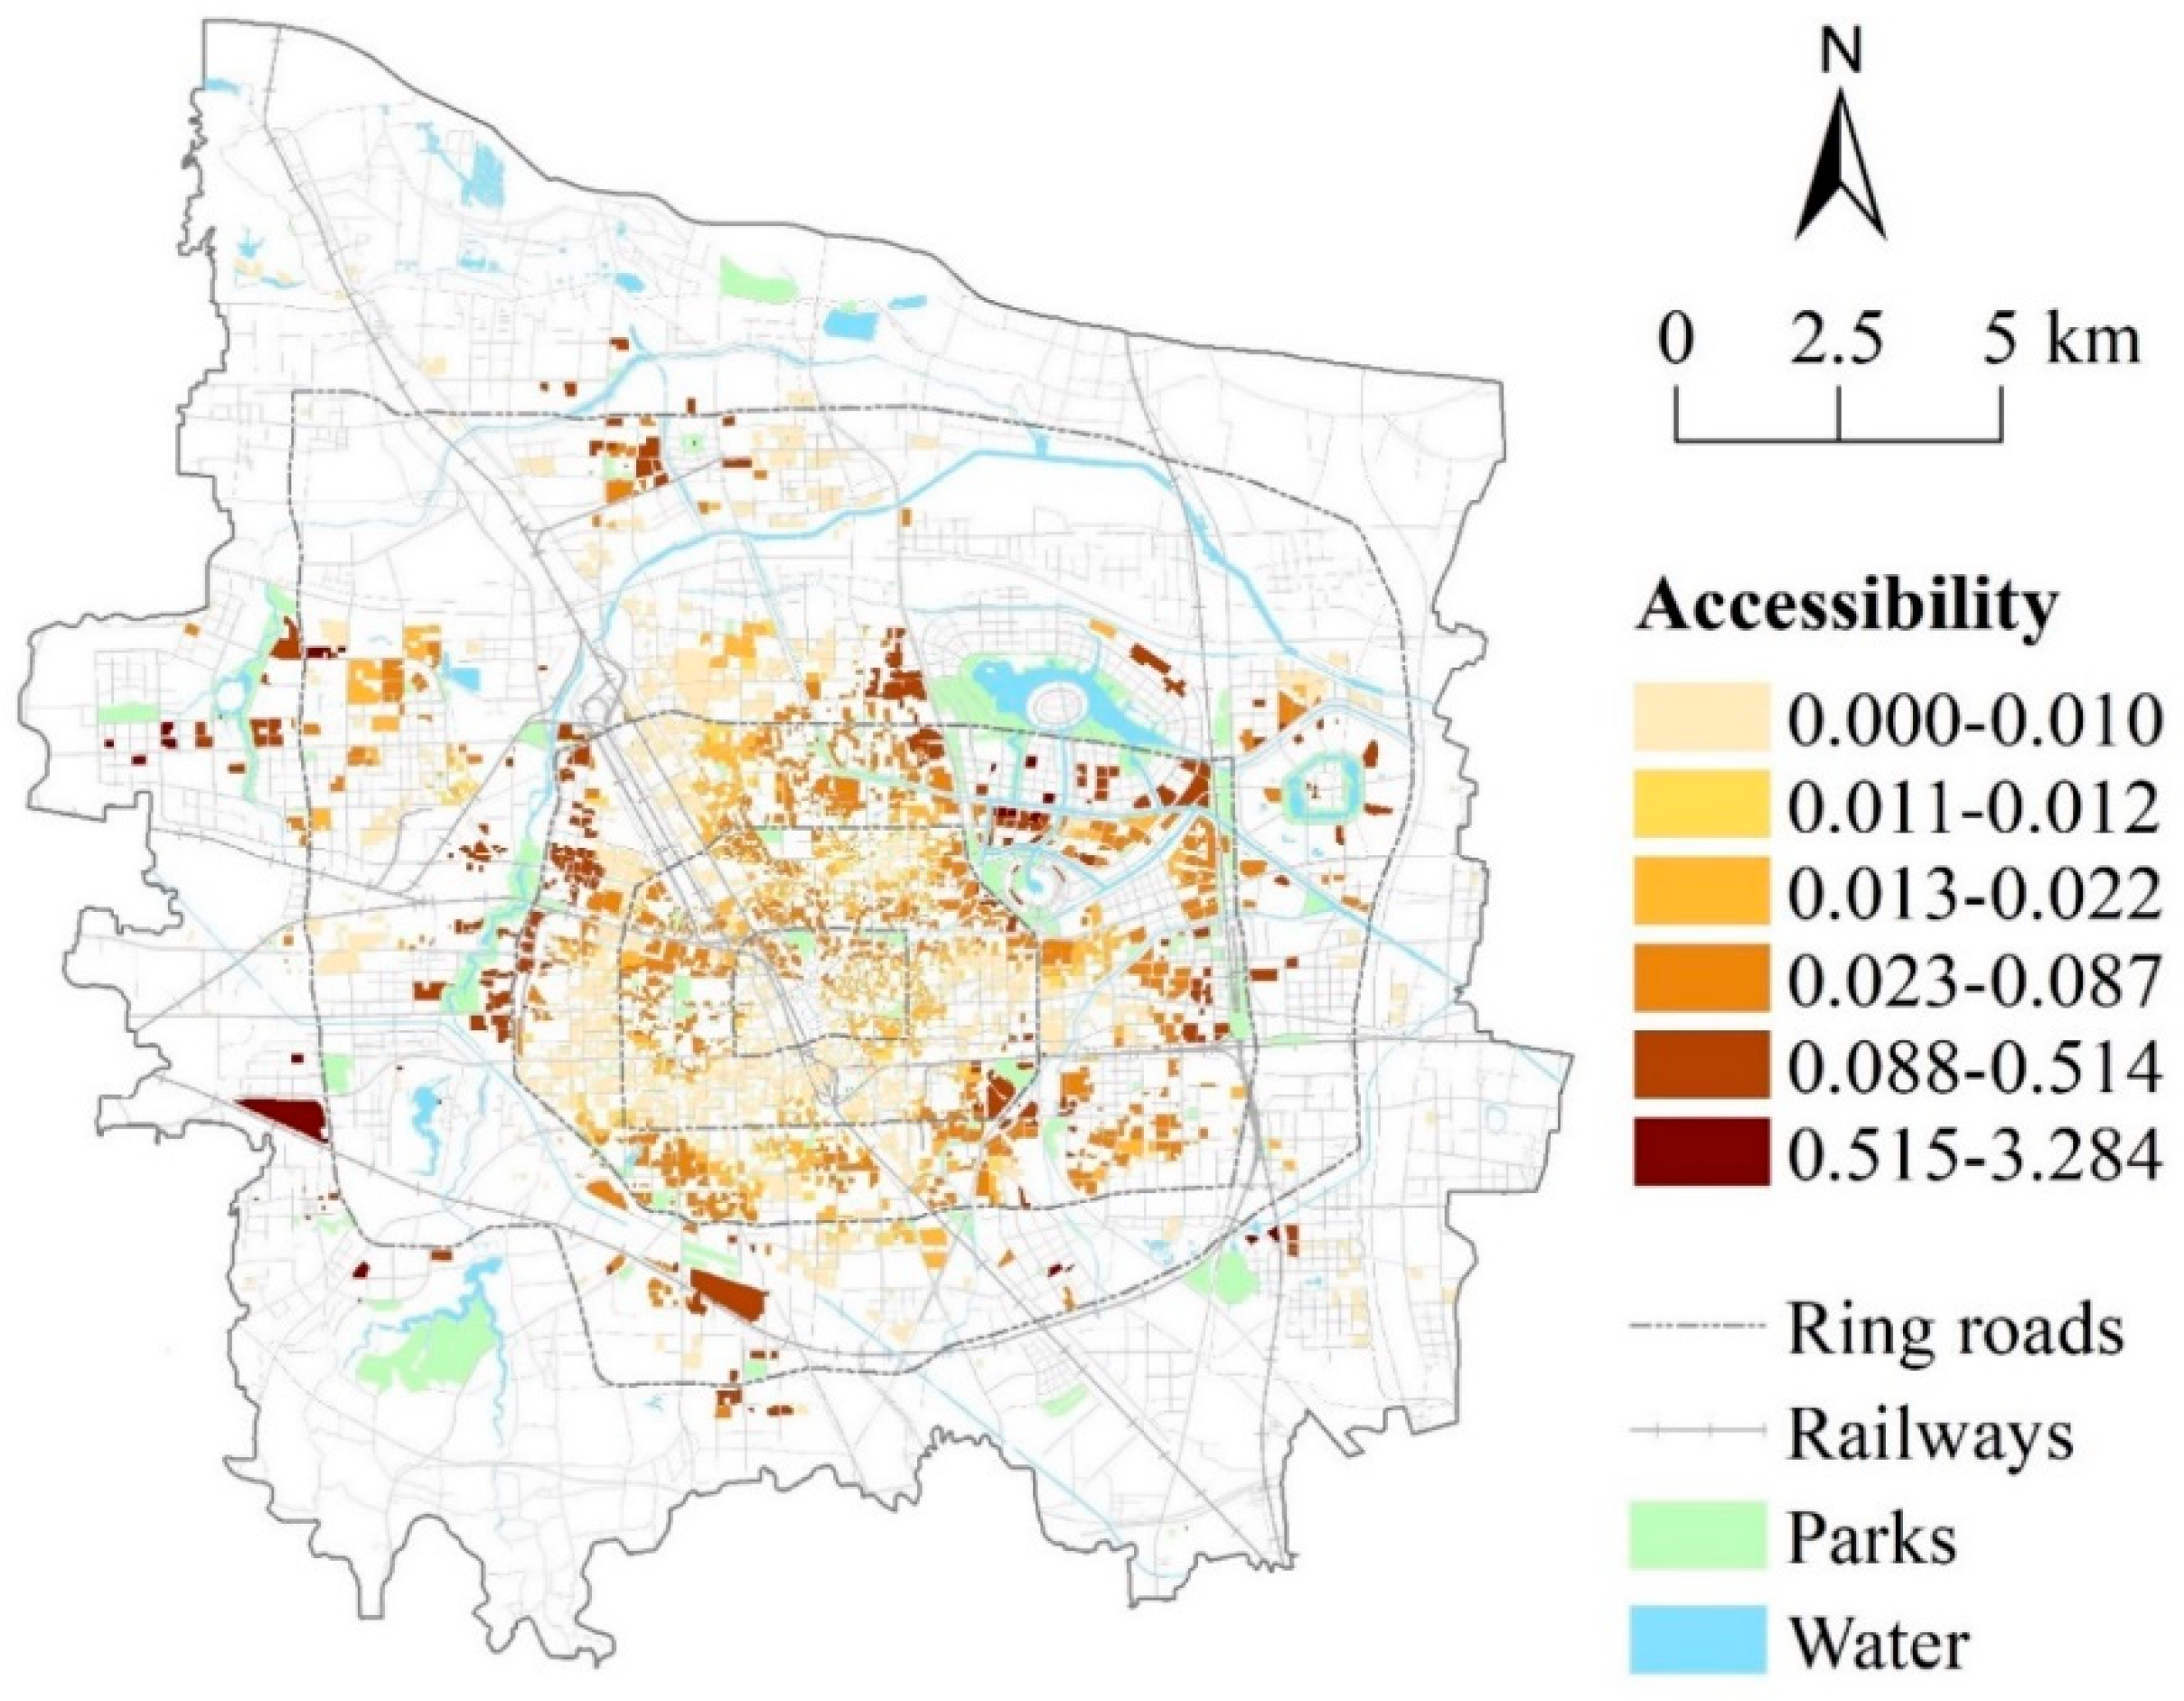
5.1. Spatial Accessibility based on Improved 2SFCA Method

Statistical analysis indicated significant differences in accessibility distribution among neighborhoods (Table 3), with a mean of 0.038 and a standard deviation of 0.119. A total of 82.18% of the neighborhoods have lower accessibility than the city average. Additionally, the proportion of underserved neighborhoods (<0.01) is significantly high, with a value of about 32.78%.
The graphs (Figure 5) show that the park accessibility of each ring is obviously different, and thus it is a demonstration of unfairness. From the city center to the city fringe, both the average accessibility and the standard deviation of neighborhoods increases. The inner rings have lower average accessibility due to dense population and relatively insufficient parks. The outer rings have a higher standard deviation of accessibility, which is related to the imbalanced distribution of parks. In terms of neighborhoods with below-average accessibility, the inner rings have a significantly higher share than the outer rings, while the outer rings have an apparently higher percentage of underserved neighborhoods than the inner rings, which is also consistent with the change in standard deviation.
According to the classification of the geometric interval method, the accessibility value of the overall neighborhoods was grouped into six grades (Figure 6). Overall, the map highlight that park accessibility is not equally distributed across the city. The areas with high accessibility are relatively agglomerated around large lakes and major rivers due to a few large waterfront parks such as Xiliu Lake Park and Dongfeng Canal Park. Several neighborhoods with extremely low accessibility are primarily distributed in the southwest of the first ring, the south and east of the second ring, the west of the third ring, and the north of the fourth ring, where parks are generally lacking and far from large and high-quality parks. Additionally, there is an apparent linear extension trend of low accessibility from northwest to southeast within the third ring road affected by the main railway line. Since areas along the railway line has been dominated by industrial and warehouse land in the historical development of the city, there are few urban parks planned around. As the population increased during urbanization, residential land expanded along the railway line, yet away from parks.

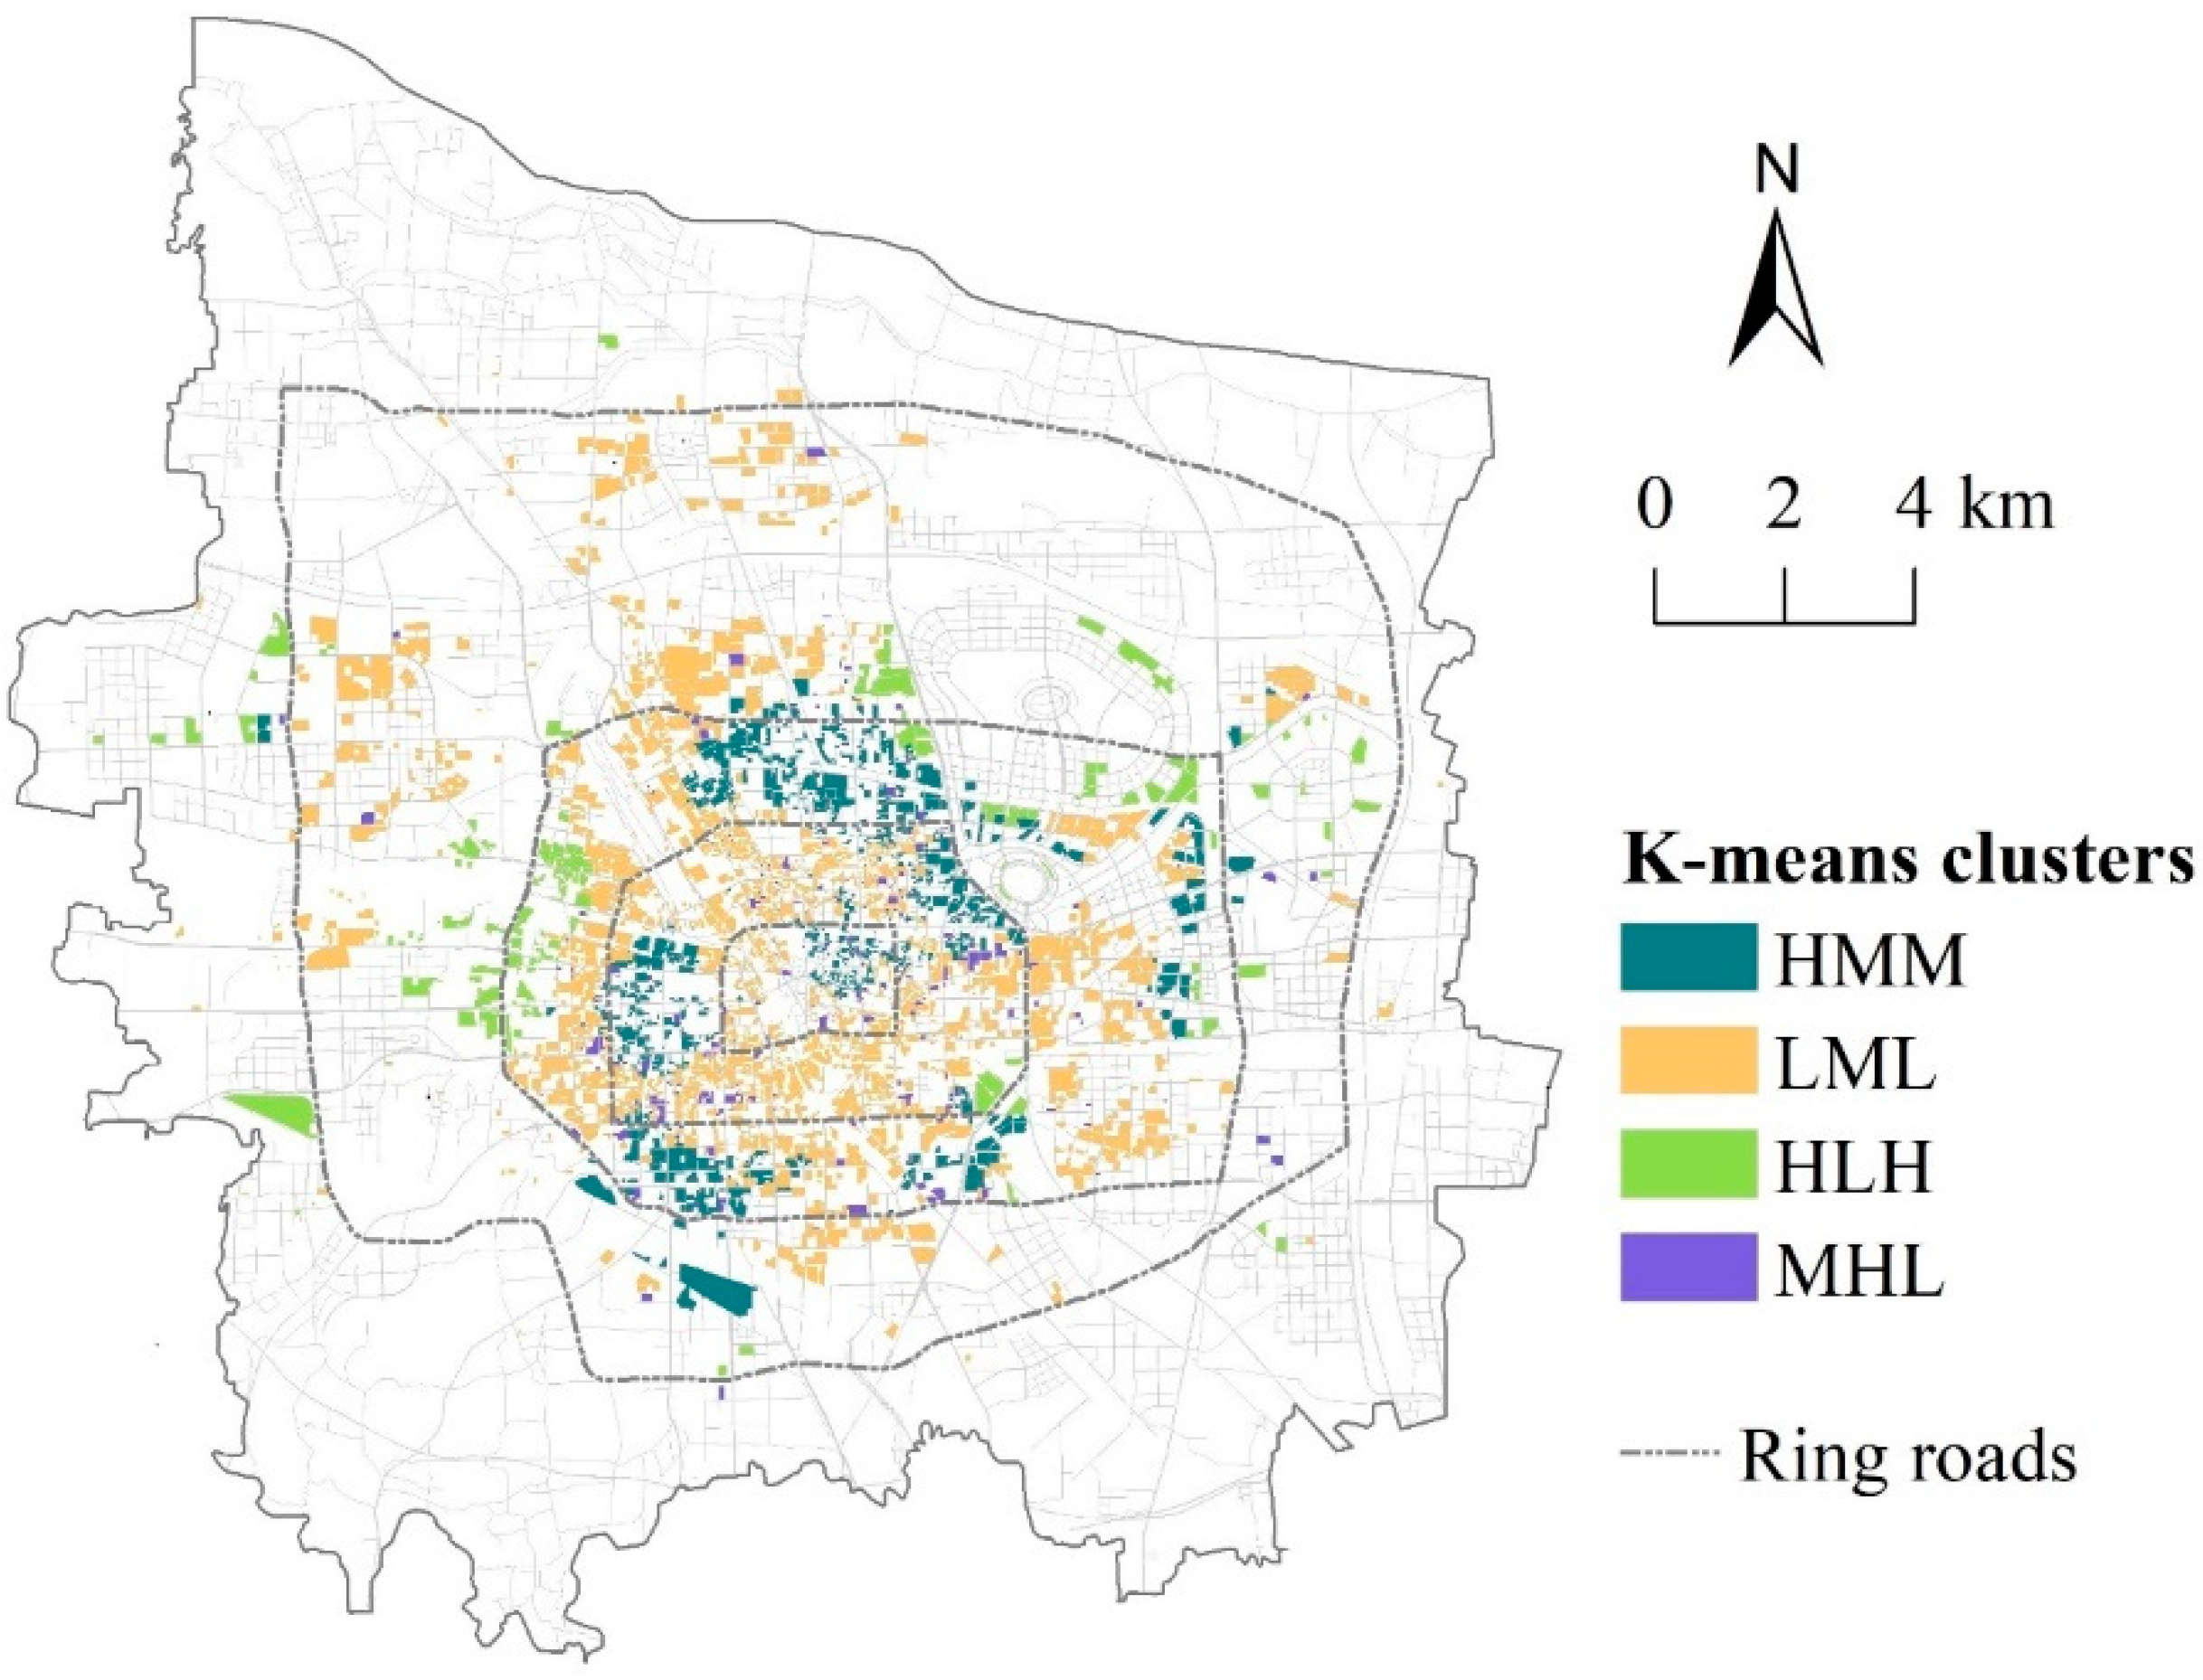
5.2. Equity Evaluation Based on K-Means Cluster Analysis

K-means cluster analysis was performed on 4030 neighborhoods after deducting neighborhoods with no data and extremely high accessibility. We identified the optimal clusters of four accessibility types based on five major factors (accessibility, average travel time, population density, total park size, and total park quality index). Table 4 shows the final cluster centers. By comparing the mean values of each factor of the clusters, typical attributes of each accessibility type and the way these types differ from each other were revealed. Each cluster was named separately for factor characteristics (high, medium, or low) in terms of supply, demand, and accessibility.
The distinguished accessibility regions were mapped in Figure 7, revealing accessibility patterns across the city. The high-supply medium-demand medium-accessibility type (HMM) is mainly distributed within the third ring, comprising 997 neighborhoods and 20% of the population. The total park quality index of these neighborhoods is the highest due to their proximity to urban parks and theme parks in good conditions. However, the supply of total park size is relatively not high, so the accessibility level is moderate. The low-supply medium-demand low-accessibility type (LML) is primarily located within the fourth ring. This cluster has the majority of neighborhoods (2494) and population (56%) of all the clusters. However, both total park size and total park quality index in cluster LML are the lowest, and the average travel time is the longest. Consequently, these neighborhoods have the lowest accessibility among the four categories. The high-supply low-demand high-accessibility type (HLH) is mostly situated around city lakes both in the eastern and western areas of the city. This is the smallest group, with only 228 neighborhoods and 11% of the population. It has the lowest population density but the highest total park size. Furthermore, the average travel time is the shortest, so the accessibility is the highest of all the clusters. Due to proximity to large waterfront parks, these neighborhoods have become livable places on the periphery of the central urban area. The medium-supply high-demand low-accessibility type (MHL) is spread across the city, with 311 neighborhoods and 13% of the population. These neighborhoods have the highest population density. In contrast, the supply of total park size and quality is relatively insufficient, thus the corresponding level of accessibility is low.
The graph (Figure 8) shows that the spatial distribution of accessibility types has both similarities and differences between urban rings. The low-supply medium-demand low-accessibility type (LML) is the most widely distributed, with more than half of the neighborhoods in each ring. This indicates that the low accessibility of neighborhoods within each ring is mainly affected by park supply shortages. The second-highest proportion of neighborhoods is high-supply medium-demand medium-accessibility type (HMM) in the inner rings, and high-supply low-demand high-accessibility type (HLH) in the outer rings. This suggests that for neighborhoods with a high supply of parks, the outer rings have higher accessibility due to a lower demand than in the inner rings. In addition, the proportion of neighborhoods in the medium-supply high-demand low-accessibility type (MHL) showed an overall decreasing trend from the city center to the city fringe. This shows that, compared to the outer rings, the inner rings have more low-accessibility neighborhoods because of the high demand.

6. Discussion

The output of this study is primarily threefold. One is the improved modeling of urban park accessibility combined with the application of multi-source big data and site survey data, the second is to explore a comprehensive and systematic procedure for urban park accessibility analysis and equity evaluation and the third is the empirical findings and solutions for decision making at multiple urban scales in Zhengzhou.
We used a supply–demand improved 2SFCA method to evaluate spatial accessibility and equity, particularly introducing the attraction coefficient of parks and selection probability of residents, which has been statistically validated against empirical results based on traditional 2SFCA methods [24]. Specifically, for our study, the attraction coefficient of parks combined the park size, category and quality based on efficient big data and on-site investigation data. Selection probability of residents among multiple available parks was quantified by combining the park attractiveness and travel impedance. This was applied as selection weights to both steps of the model to fit possible supply and demand relationship. In terms of the demand, the population of the neighborhood-scale unit was estimated based on residential building attributes (including footprint area and floors) derived from map service platform, rather than rough administrative unit demographics. Additionally, we used travel time instead of travel distance to measure travel cost based on real-time navigation data, which can more accurately reflect the actual travel situation of residents and is relatively more convenient than traditional data collection. Overall, the accuracy of the park accessibility measurement has been improved in terms of both the model and data. Then, the spatial patterns, differences, and causes of park accessibility were further examined by K-means cluster analysis. By clustering the results of five main factors (accessibility, average travel time, population density, total park size, and total park quality index), we got integrated spatial patterns of supply, demand, and accessibility for neighborhoods and thus revealed how these regions differ from each other. This study illustrates the feasibility and limitations of the research framework for park accessibility and equity evaluation in the central urban area of Zhengzhou, which can be flexibly applied to other cities with the use of appropriate data following the approach.
The results reveal, both spatially and statistically, that the access to parks in Zhengzhou is generally unevenly distributed among neighborhoods and between urban rings. Additionally, the cluster analysis identified four types of neighborhoods as well as causes behind the spatial accessibility differences. Specific to different types of regions, the following solutions may help reduce spatial disparity in urban park accessibility. First, parks should be increased or expanded for underserved neighborhoods. Regarding neighborhoods in crowded built environments, surrounding underused and neglected land can be efficiently used to increase pocket parks while reducing travel time [57]. Second, for densely populated neighborhoods, limited opening of nearby high-quality green enclosures or the application of dual-use parks on certain types of open spaces (such as schoolyards and rooftops) can well balance the supply and demand of parks [58]. Third, as the quality of a park can significantly impact visitor numbers [17,26,59], unpopular parks should be improved by involving community members in the park development process with regard to renovation and management [57], including increasing the diversity of facilities and amenities, enhancing the appeal of landscape features, and paying attention to maintenance. Fourth, in areas with higher travel time, road connectivity between parks and surrounding neighborhoods can be improved by increasing sidewalk density and adding entrances to large parks. Specifically, better connections over the railway axes could facilitate improved park accessibility. Finally, residential area planning should be integrated with urban park allocation to manage land use patterns around parks from the perspective of urban planning, so that parks can fully serve the nearby residents.
This research has several limitations that may be addressed in the future. First, it uses a unified indicator system to characterize park attractiveness to the whole population, regardless of the visitor preferences of different groups in terms of park quality and type. With the help of a detailed social survey, a pre-analysis of residents’ park usage behavior and opinions of various groups can better reflect their subjective needs for parks. Second, numerous studies have shown that the distribution of urban parks tends to differ between different social groups [10,17,54,60]. Therefore, combined with detailed demographic data, comparative studies of park accessibility across age or income groups can be conducted to reveal underserved groups and then develop proper strategies to achieve social equity in parks. Third, transit to parks by other modes, including public transport and personal cars, was not considered, while several related studies have confirmed different results [11,50,55]. Additionally, with the exception of walking in the walkable concept, access to parks on bicycles, skates, etc., may be appreciated, but was rarely discussed, which can be incorporated into studies to match the specific situation of park visits in different cities. Finally, based on survey data or urban big data, such as mobile phone data and social media data, of residents’ actual park visits, the match between calculated accessibility and actual access can be measured to further verify the accuracy of our accessibility evaluation.

7. Conclusions

In this study, an attempt was made to establish a comprehensive and systematic procedure for urban park accessibility analysis and equity evaluation by applying a supply- demand improved 2SFCA model and K-means cluster analysis, based on multi-source data. Accordingly, we conducted a case study at the neighborhood scale and urban ring scale in the central urban area of Zhengzhou. The results show that access to parks is not equitable among neighborhoods across the city. In addition, the mean and standard deviation of accessibility both show an increasing trend from the center to the periphery. All the neighborhoods are broadly clustered into four accessibility types, each with different characteristics and causes. The spatial distribution of accessibility types has both similarities and differences between urban rings. An equity study on park accessibility could guide decision makers and urban planners to target underserved neighborhoods and formulate effective policies and strategies aimed at urban park equity.

Author Contributions

Conceptualization, Y.Y.; methodology, Y.Y.; software, Y.Y. and R.H.; formal analysis, Y.Y. and A.F.; investigation, Y.Y. and Z.S.; resources, Y.Y., R.H., G.T. and X.W.; data curation, Y.Y. and G.T.; writing—original draft preparation, Y.Y.; writing—review and editing, Y.Y., A.F. and R.H.; visualization, Y.Y.; supervision, A.F., Z.S. and X.W. All authors have read and agreed to the published version of the manuscript.

Funding

This research received no external funding.

Data Availability Statement

The data presented in this study are available on request from the first author.

Acknowledgments

The authors would like to thank the reviewers and the editor, whose suggestions greatly improved the manuscript. In addition, I would also like to thank the China Scholarship Council and the Stipendium Hungaricum Programme for supporting some authors’ study and research.

Conflicts of Interest

The authors declare no conflict of interest.

References

  1. Fekete, A. Budapesti Nagyparkok akadálymentes kialakításának és biztonságos használatának vizsgálata (Népliget, Városliget, Margitsziget). 4d J. Landsc. Archit. Gard. Art 2012, 69–79. [Google Scholar]
  2. Nesbitt, L.; Meitner, M.J.; Girling, C.; Sheppard, S.R.; Lu, Y.H. Who has access to urban vegetation? A spatial analysis of distributional green equity in 10 US cities. Landsc. Urban Plan. 2019, 181, 51–79. [Google Scholar] [CrossRef]
  3. Raffestin, C. Territoriality: A reflection of the discrepancies between the organization of space and individual liberty. Int. Political Sci. Rev. 1984, 5, 139–146. [Google Scholar] [CrossRef]
  4. Ruggeri, D.; Young, D. Community in the information age: Exploring the social potential of web-based technologies in landscape architecture and community design. Front. Archit. Res. 2016, 5, 15–26. [Google Scholar] [CrossRef] [Green Version]
  5. Sharifi, F.; Nygaard, A.; Stone, W.M.; Levin, I. Accessing green space in Melbourne: Measuring inequity and household mobility. Landsc. Urban Plan. 2021, 207, 104004. [Google Scholar] [CrossRef]
  6. Van Melik, R.; Van Aalst, I.; Van Weesep, J. Fear and fantasy in the public domain: The development of secured and themed urban space. J. Urban Des. 2007, 12, 25–42. [Google Scholar] [CrossRef]
  7. Wang, C.; Burris, M.A. Photovoice: Concept, methodology, and use for participatory needs assessment. Health Educ. Behav. 1997, 24, 369–387. [Google Scholar] [CrossRef] [Green Version]
  8. Weiss, D.J.; Nelson, A.; Gibson, H.; Temperley, W.; Peedell, S.; Lieber, A.; Hancher, M.; Poyart, E.; Belchior, S.; Fullman, N. A global map of travel time to cities to assess inequalities in accessibility in 2015. Nature 2018, 553, 333–336. [Google Scholar] [CrossRef]
  9. Zhang, J.X.; Hu, Y. A Critique On China’s Urban Renewal From Social Space Justice Viewpoint. Planners 2012, 28, 5–9. [Google Scholar]
  10. Zhang, R.; Peng, S.J.; Sun, F.Y.; Deng, L.Z.; Che, Y. Assessing the social equity of urban parks: An improved index integrating multiple quality dimensions and service accessibility. Cities 2022, 129, 103839. [Google Scholar] [CrossRef]
  11. Yang, L.J.; Yang, P.F.; Chen, L. Quantitative Evaluation on the Equity of Park Green Space Provision: A Case Study of Central District of Chongqing. Chin. Landsc. Archit. 2020, 36, 108–112. [Google Scholar] [CrossRef]
  12. Lefebvre, H. The Production of Space; Blackwell Publishing: Oxford, UK, 1991. [Google Scholar]
  13. Carmona, M. Place value: Place quality and its impact on health, social, economic and environmental outcomes. J. Urban Des. 2019, 24, 1–48. [Google Scholar] [CrossRef]
  14. Chiesura, A. The role of urban parks for the sustainable city. Landsc. Urban Plan. 2004, 68, 129–138. [Google Scholar] [CrossRef]
  15. Forsyth, A. What is a healthy place? Models for cities and neighbourhoods. J. Urban Des. 2020, 25, 186–202. [Google Scholar] [CrossRef]
  16. Kullmann, K. Grounding landscape urbanism and new urbanism. J. Urban Des. 2015, 20, 311–313. [Google Scholar] [CrossRef] [Green Version]
  17. Rigolon, A. A complex landscape of inequity in access to urban parks: A literature review. Landsc. Urban Plan. 2016, 153, 160–169. [Google Scholar] [CrossRef]
  18. Rigolon, A.; Németh, J. A QUality INdex of Parks for Youth (QUINPY): Evaluating urban parks through geographic information systems. Environ. Plan. B Urban Anal. City Sci. 2016, 45, 275–294. [Google Scholar] [CrossRef]
  19. Tu, X.Y.; Huang, G.L.; Wu, J.G.; Guo, X. How do travel distance and park size influence urban park visits? Urban For. Urban Green. 2020, 52, 126689. [Google Scholar] [CrossRef]
  20. Boone, C.G.; Buckley, G.L.; Grove, J.M.; Sister, C. Parks and people: An environmental justice inquiry in Baltimore, Maryland. Ann. Assoc. Am. Geogr. 2009, 99, 767–787. [Google Scholar] [CrossRef]
  21. Fetzer, E.; Ruggeri, D. Landscape Education for Democracy: Methods and Methodology. Landsc. Educ. Democr. 2019, 10, 18–33. [Google Scholar] [CrossRef]
  22. Sharma, G.; Patil, G.R. Spatial and social inequities for educational services accessibility-A case study for schools in Greater Mumbai. Cities 2022, 122, 103543. [Google Scholar] [CrossRef]
  23. Xiao, Y.; Wang, Z.; Li, Z.; Tang, Z. An assessment of urban park access in Shanghai—Implications for the social equity in urban China. Landsc. Urban Plan. 2017, 157, 383–393. [Google Scholar] [CrossRef]
  24. Xing, L.J.; Liu, Y.F.; Wang, B.S.; Wang, Y.H.; Liu, H.J. An environmental justice study on spatial access to parks for youth by using an improved 2SFCA method in Wuhan, China. Cities 2020, 96, 102405. [Google Scholar] [CrossRef]
  25. Yu, S.Q.; Zhu, X.G.; He, Q. An Assessment of Urban Park Access Using House-Level Data in Urban China: Through the Lens of Social Equity. Int. J. Env. Res. Public Health 2020, 17, 2349. [Google Scholar] [CrossRef] [Green Version]
  26. McCormack, G.R.; Rock, M.; Toohey, A.M.; Hignell, D. Characteristics of urban parks associated with park use and physical activity: A review of qualitative research. Health Place 2010, 16, 712–726. [Google Scholar] [CrossRef] [PubMed]
  27. Ben-Elia, E.; Benenson, I. A spatially-explicit method for analyzing the equity of transit commuters’ accessibility. Transp. Res. Part A Policy Pract. 2019, 120, 31–42. [Google Scholar] [CrossRef]
  28. Chang, H.S.; Liao, C.H. Exploring an integrated method for measuring the relative spatial equity in public facilities in the context of urban parks. Cities 2011, 28, 361–371. [Google Scholar] [CrossRef]
  29. Dony, C.C.; Delmelle, E.M.; Delmelle, E.C. Re-conceptualizing accessibility to parks in multi-modal cities: A Variable-width Floating Catchment Area (VFCA) method. Landsc. Urban Plan. 2015, 143, 90–99. [Google Scholar] [CrossRef]
  30. Luo, W.; Qi, Y. An enhanced two-step floating catchment area (E2SFCA) method for measuring spatial accessibility to primary care physicians. Health Place 2009, 15, 1100–1107. [Google Scholar] [CrossRef]
  31. Hansen, W.G. How accessibility shapes land use. J. Am. Inst. Plan. 1959, 25, 73–76. [Google Scholar] [CrossRef]
  32. Geurs, K.T.; Van Wee, B. Accessibility evaluation of land-use and transport strategies: Review and research directions. J. Transp. Geogr. 2004, 12, 127–140. [Google Scholar] [CrossRef]
  33. Vandenbulcke, G.; Steenberghen, T.; Thomas, I. Mapping accessibility in Belgium: A tool for land-use and transport planning? J. Transp. Geogr. 2009, 17, 39–53. [Google Scholar] [CrossRef]
  34. Rong, P.J.; Zheng, Z.C.; Kwan, M.-P.; Qin, Y.C. Evaluation of the spatial equity of medical facilities based on improved potential model and map service API: A case study in Zhengzhou, China. Appl. Geogr. 2020, 119, 102192. [Google Scholar] [CrossRef]
  35. Xing, L.J.; Liu, Y.F.; Liu, X.J. Measuring spatial disparity in accessibility with a multi-mode method based on park green spaces classification in Wuhan, China. Appl. Geogr. 2018, 94, 251–261. [Google Scholar] [CrossRef]
  36. Xu, M.Y.; Xin, J.; Su, S.L.; Weng, M.; Cai, Z.L. Social inequalities of park accessibility in Shenzhen, China: The role of park quality, transport modes, and hierarchical socioeconomic characteristics. J. Transp. Geogr. 2017, 62, 38–50. [Google Scholar] [CrossRef]
  37. Nicholls, S. Measuring the accessibility and equity of public parks: A case study using GIS. Manag. Leis. 2001, 6, 201–219. [Google Scholar] [CrossRef]
  38. Miyake, K.K.; Maroko, A.R.; Grady, K.L.; Maantay, J.A.; Arno, P.S. Not just a walk in the park: Methodological improvements for determining environmental justice implications of park access in New York City for the promotion of physical activity. Cities Environ. 2010, 3, 1–17. [Google Scholar] [CrossRef]
  39. Hillsdon, M.; Panter, J.; Foster, C.; Jones, A. The relationship between access and quality of urban green space with population physical activity. Public Health 2006, 120, 1127–1132. [Google Scholar] [CrossRef]
  40. Luo, W.; Wang, F.H. Measures of spatial accessibility to health care in a GIS environment: Synthesis and a case study in the Chicago region. Environ. Plan. B Plan. Des. 2003, 30, 865–884. [Google Scholar] [CrossRef] [Green Version]
  41. Radke, J.; Mu, L. Spatial decompositions, modeling and mapping service regions to predict access to social programs. Geogr. Inf. Sci. 2000, 6, 105–112. [Google Scholar] [CrossRef]
  42. Wang, F.H. Quantitative Methods and Applications in GIS; CRC Press: Boca Raton, FL, USA, 2006. [Google Scholar]
  43. Luo, W.; Whippo, T. Variable catchment sizes for the two-step floating catchment area (2SFCA) method. Health Place 2012, 18, 789–795. [Google Scholar] [CrossRef] [PubMed]
  44. Ibes, D.C. A multi-dimensional classification and equity analysis of an urban park system: A novel methodology and case study application. Landsc. Urban Plan. 2015, 137, 122–137. [Google Scholar] [CrossRef]
  45. García-Albertos, P.; Picornell, M.; Salas-Olmedo, M.H.; Gutiérrez, J. Exploring the potential of mobile phone records and online route planners for dynamic accessibility analysis. Transp. Res. Part A Policy Pract. 2018, 125, 294–307. [Google Scholar] [CrossRef]
  46. Chen, B.Y.; Yuan, H.; Li, Q.Q.; Wang, D.G.; Shaw, S.-L.; Chen, H.-P.; Lam, W.H. Measuring place-based accessibility under travel time uncertainty. Int. J. Geogr. Inf. Sci. 2017, 31, 783–804. [Google Scholar] [CrossRef]
  47. Hao, F.L.; Wang, S.J.; Xie, D.C.; Yu, T.T.; Feng, Z.X. Space-Time Accessibility of Commercial Centers in Changchun Urban Area Based on Internet Map Service. Econ. Geogr. 2017, 37, 68–75. [Google Scholar] [CrossRef]
  48. Li, S.J.; Ma, S.; Zhang, Y.M. Spatial Patterns of the Mismatch Degree between the Accessibility and the Visiting Preference for All Parks in the Main City of Zhengzhou. Areal Res. Dev. 2019, 38, 79–85. [Google Scholar] [CrossRef]
  49. Shi, Z.; Xing, L.H.; Zheng, L.L.; Mu, B.; Tian, G.H. Evaluations and optimization strategies of synergy degree of park green space based on balance of supply and demand for recreation. J. Nanjing For. Univ. 2021, 45, 197–204. [Google Scholar] [CrossRef]
  50. Xing, L.H.; Wang, Y.Q.; Liu, M.S.; Duan, Y.B.; Tian, G.H. Evaluation on balance of park greenspace and residential population distribution in the major urban area of Zhengzhou city. J. Northwest For. Univ. 2020, 35, 258–265. [Google Scholar] [CrossRef]
  51. Niu, Q.; Zhang, Y.X.; Zhang, W.M.; Wu, L. Accessibility evaluation of large parks in Wuhan based on open map access via network map API and Gaussian two-step mobile search method. In Proceedings of the Smart Planning, Ecological Habitat, Quality Space—2019 China Urban Planning Informatization Annual Conference, Shenzhen, China, 15–19 June 2019; pp. 322–328. [Google Scholar]
  52. Lyu, F.N.; Zhang, L. Using multi-source big data to understand the factors affecting urban park use in Wuhan. Urban For. Urban Green. 2019, 43, 126367. [Google Scholar] [CrossRef]
  53. Zhai, Y.J.; Li, D.Y.; Wu, C.Z.; Wu, H.B. Urban park facility use and intensity of seniors’ physical activity—An examination combining accelerometer and GPS tracking. Landsc. Urban Plan. 2021, 205, 103950. [Google Scholar] [CrossRef]
  54. Dai, D. Racial/ethnic and socioeconomic disparities in urban green space accessibility: Where to intervene? Landsc. Urban Plan. 2011, 102, 234–244. [Google Scholar] [CrossRef]
  55. Tong, D.; Sun, Y.Y.; Xie, M.M. Evaluation of green space accessibility based on improved Gaussian two-step floating catchment area method: A case study of Shenzhen City, China. Prog. Geogr. 2021, 40, 1113–1126. [Google Scholar] [CrossRef]
  56. Luo, J. Integrating the huff model and floating catchment area methods to analyze spatial access to healthcare services. Trans. GIS 2014, 18, 436–448. [Google Scholar] [CrossRef]
  57. Yang, Y.; He, R.Z.; Ning, D.G.; Wang, G.F.; Liu, M.S.; Fekete, A. An Overview of Urban Park Development in Zhengzhou, China. Acta Biol. Marisiensis 2021, 4, 1–13. [Google Scholar] [CrossRef]
  58. Harnik, P. Urban Green: Innovative Parks for Resurgent Cities; Island Press: Washington, DC, USA, 2010. [Google Scholar]
  59. Hughey, S.M.; Walsemann, K.M.; Child, S.; Powers, A.; Reed, J.A.; Kaczynski, A.T. Using an environmental justice approach to examine the relationships between park availability and quality indicators, neighborhood disadvantage, and racial/ethnic composition. Landsc. Urban Plan. 2016, 148, 159–169. [Google Scholar] [CrossRef]
  60. Rigolon, A.; Browning, M.; Jennings, V. Inequities in the quality of urban park systems: An environmental justice investigation of cities in the United States. Landsc. Urban Plan. 2018, 178, 156–169. [Google Scholar] [CrossRef]
Figure 1. Research framework for accessibility analysis and equity evaluation of urban parks.
Land 11 02045 g001
Figure 2. Geography, topography and the five rings of development in Zhengzhou, Henan Province.
Land 11 02045 g002
Figure 3. Spatial distribution of parks and population density in the central urban area of Zhengzhou.
Land 11 02045 g003
Figure 4. Example of travel path and time cost visualization in walking mode of Baidu Maps Navigation.
Land 11 02045 g004
Figure 5. Statistical analysis across urban rings: (a) neighborhood accessibility; (b) proportion of below-average and underserved neighborhoods. Error bars indicate standard deviation.
Land 11 02045 g005
Figure 6. Spatial distribution of park accessibility value.
Land 11 02045 g006
Figure 7. Neighborhood clusters in terms of supply, demand, and accessibility (based on accessibility, average travel time, population density, total park size, and total park quality index).
Land 11 02045 g007
Figure 8. Statistical analysis across urban rings of the proportion of four accessibility types of neighborhoods.
Land 11 02045 g008
Table 1. Variables of the park quality index.
VariablesDescriptionScoreWeights
Facilities and amenitiesRecreational amenities;
Service amenities;
Management facilities
Excellent as 1;
Good as 0.75;
Fair as 0.5;
Poor as 0.25;
Bad as 0
0.8421
Water featuresPresence of water bodiesYes as 1;
No as 0
0.1053
Tree canopyThe ratio of tree coverage≥50% as 1;
<50% as 0.5
0.0526
Table 2. Factors involved in clustering.
FactorsDescription
AccessibilityAccessibility value calculated for each neighborhood by improved 2SFCA method
Average travel timeAverage travel time to parks within a 30-min walk of each neighborhood
Population densityThe ratio of the population of each neighborhood to the corresponding neighborhood area
Total park sizeTotal area of parks within a 30-min walk of each neighborhood
Total park quality indexTotal quality index of parks within a 30-min walk of each neighborhood
Table 3. Statistical analysis of neighborhood accessibility.
MeanStandard DeviationBelow-Average NeighborhoodsUnderserved Neighborhoods
Accessibility0.0380.11982.18%32.78%
The underserved neighborhoods are defined as those with an accessibility value below 0.01.
Table 4. Final cluster centers.
HMMLMLHLHMHL
Neighborhood (numbers)9972494228311
Population ratio (%)20%56%11%13%
Accessibility−0.00866−0.252723.0144−0.15549
Average travel time−0.16290.11978−0.41835−0.13161
Population density−0.20521−0.18257−0.341332.3722
Total park size0.39058−0.423913.03554−0.07804
Total park quality index1.19771−0.46355−0.15096−0.01162
Except for the number of neighborhoods and population ratios, the above data were transformed to standard normal distribution by means of Z-score normalization.
Publisher’s Note: MDPI stays neutral with regard to jurisdictional claims in published maps and institutional affiliations.

