
Local Sparse Principal Component Analysis for Exploring the Spatial Distribution of Social Infrastructure


Abstract
:1. Introduction
2. PCA in Urban and Regional Studies
3. Data and Method
3.1. Social Infrastructure Data of Korea
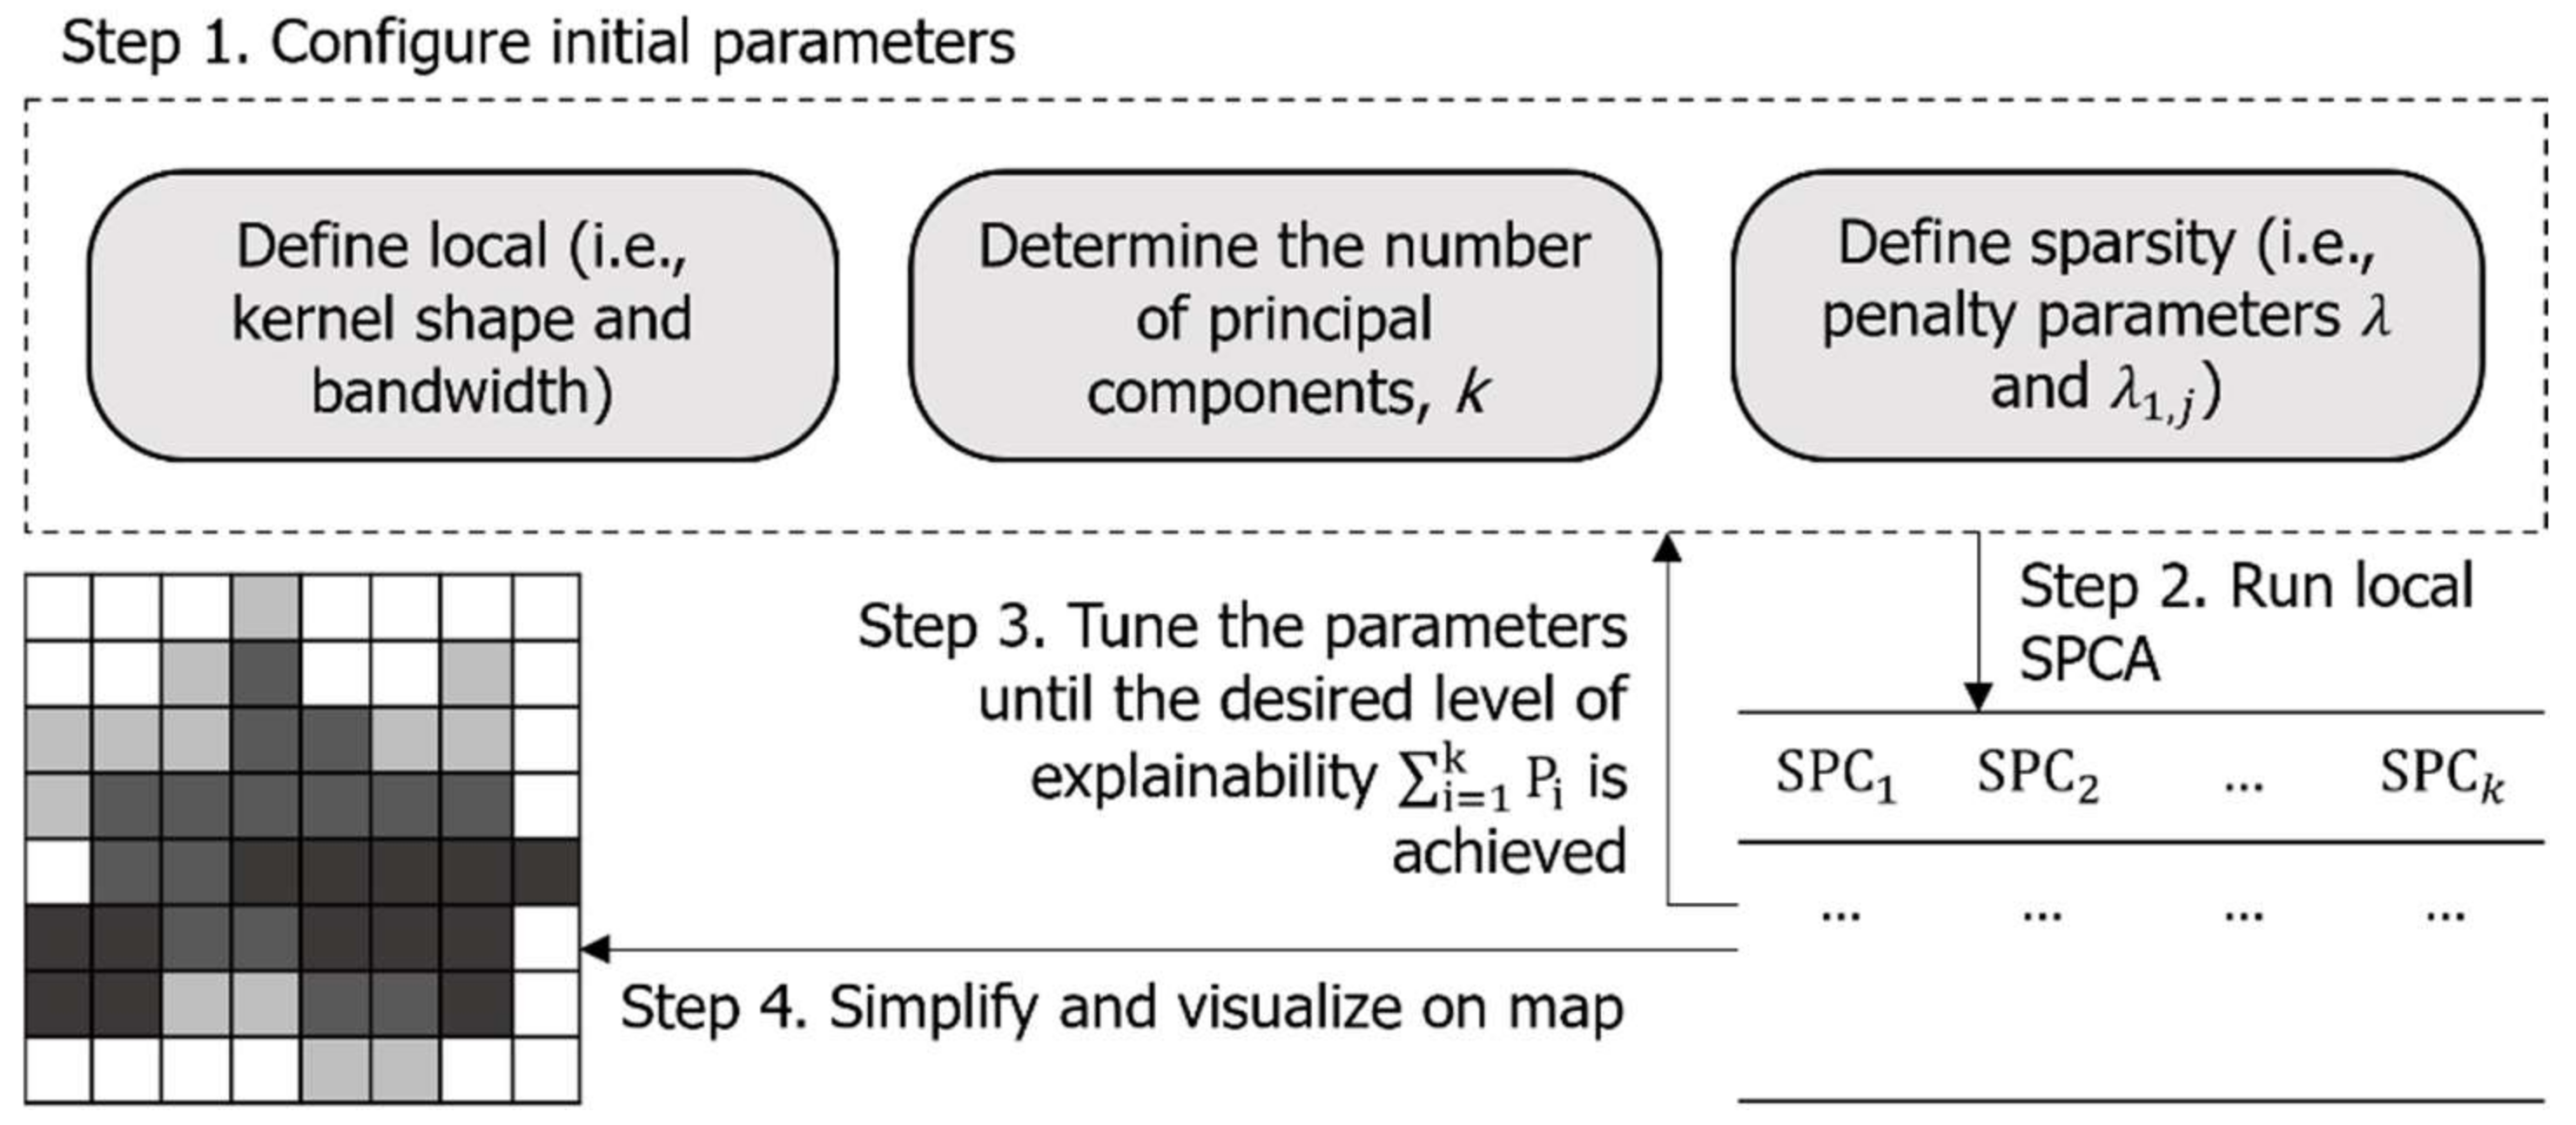
3.2. Method
4. Results and Discussion
4.1. Standard PCA
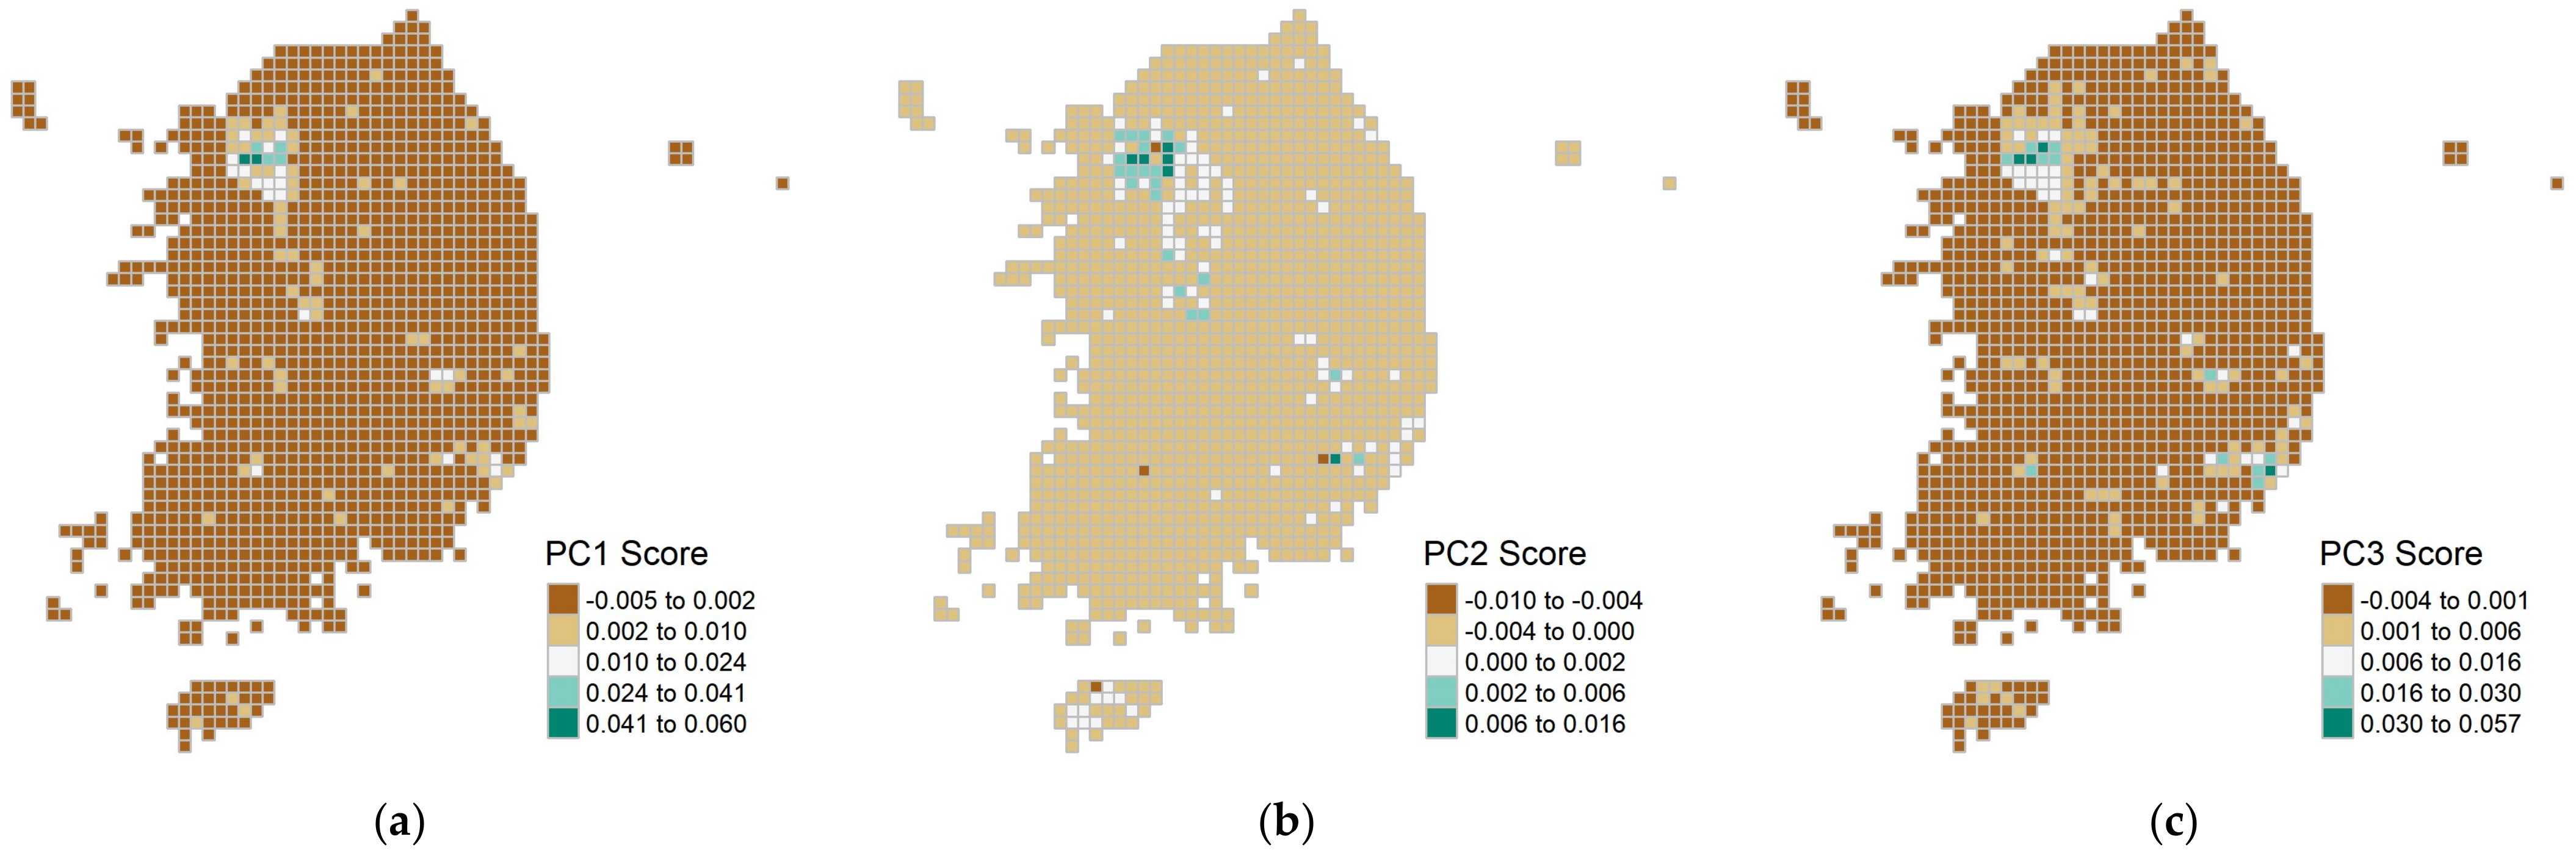
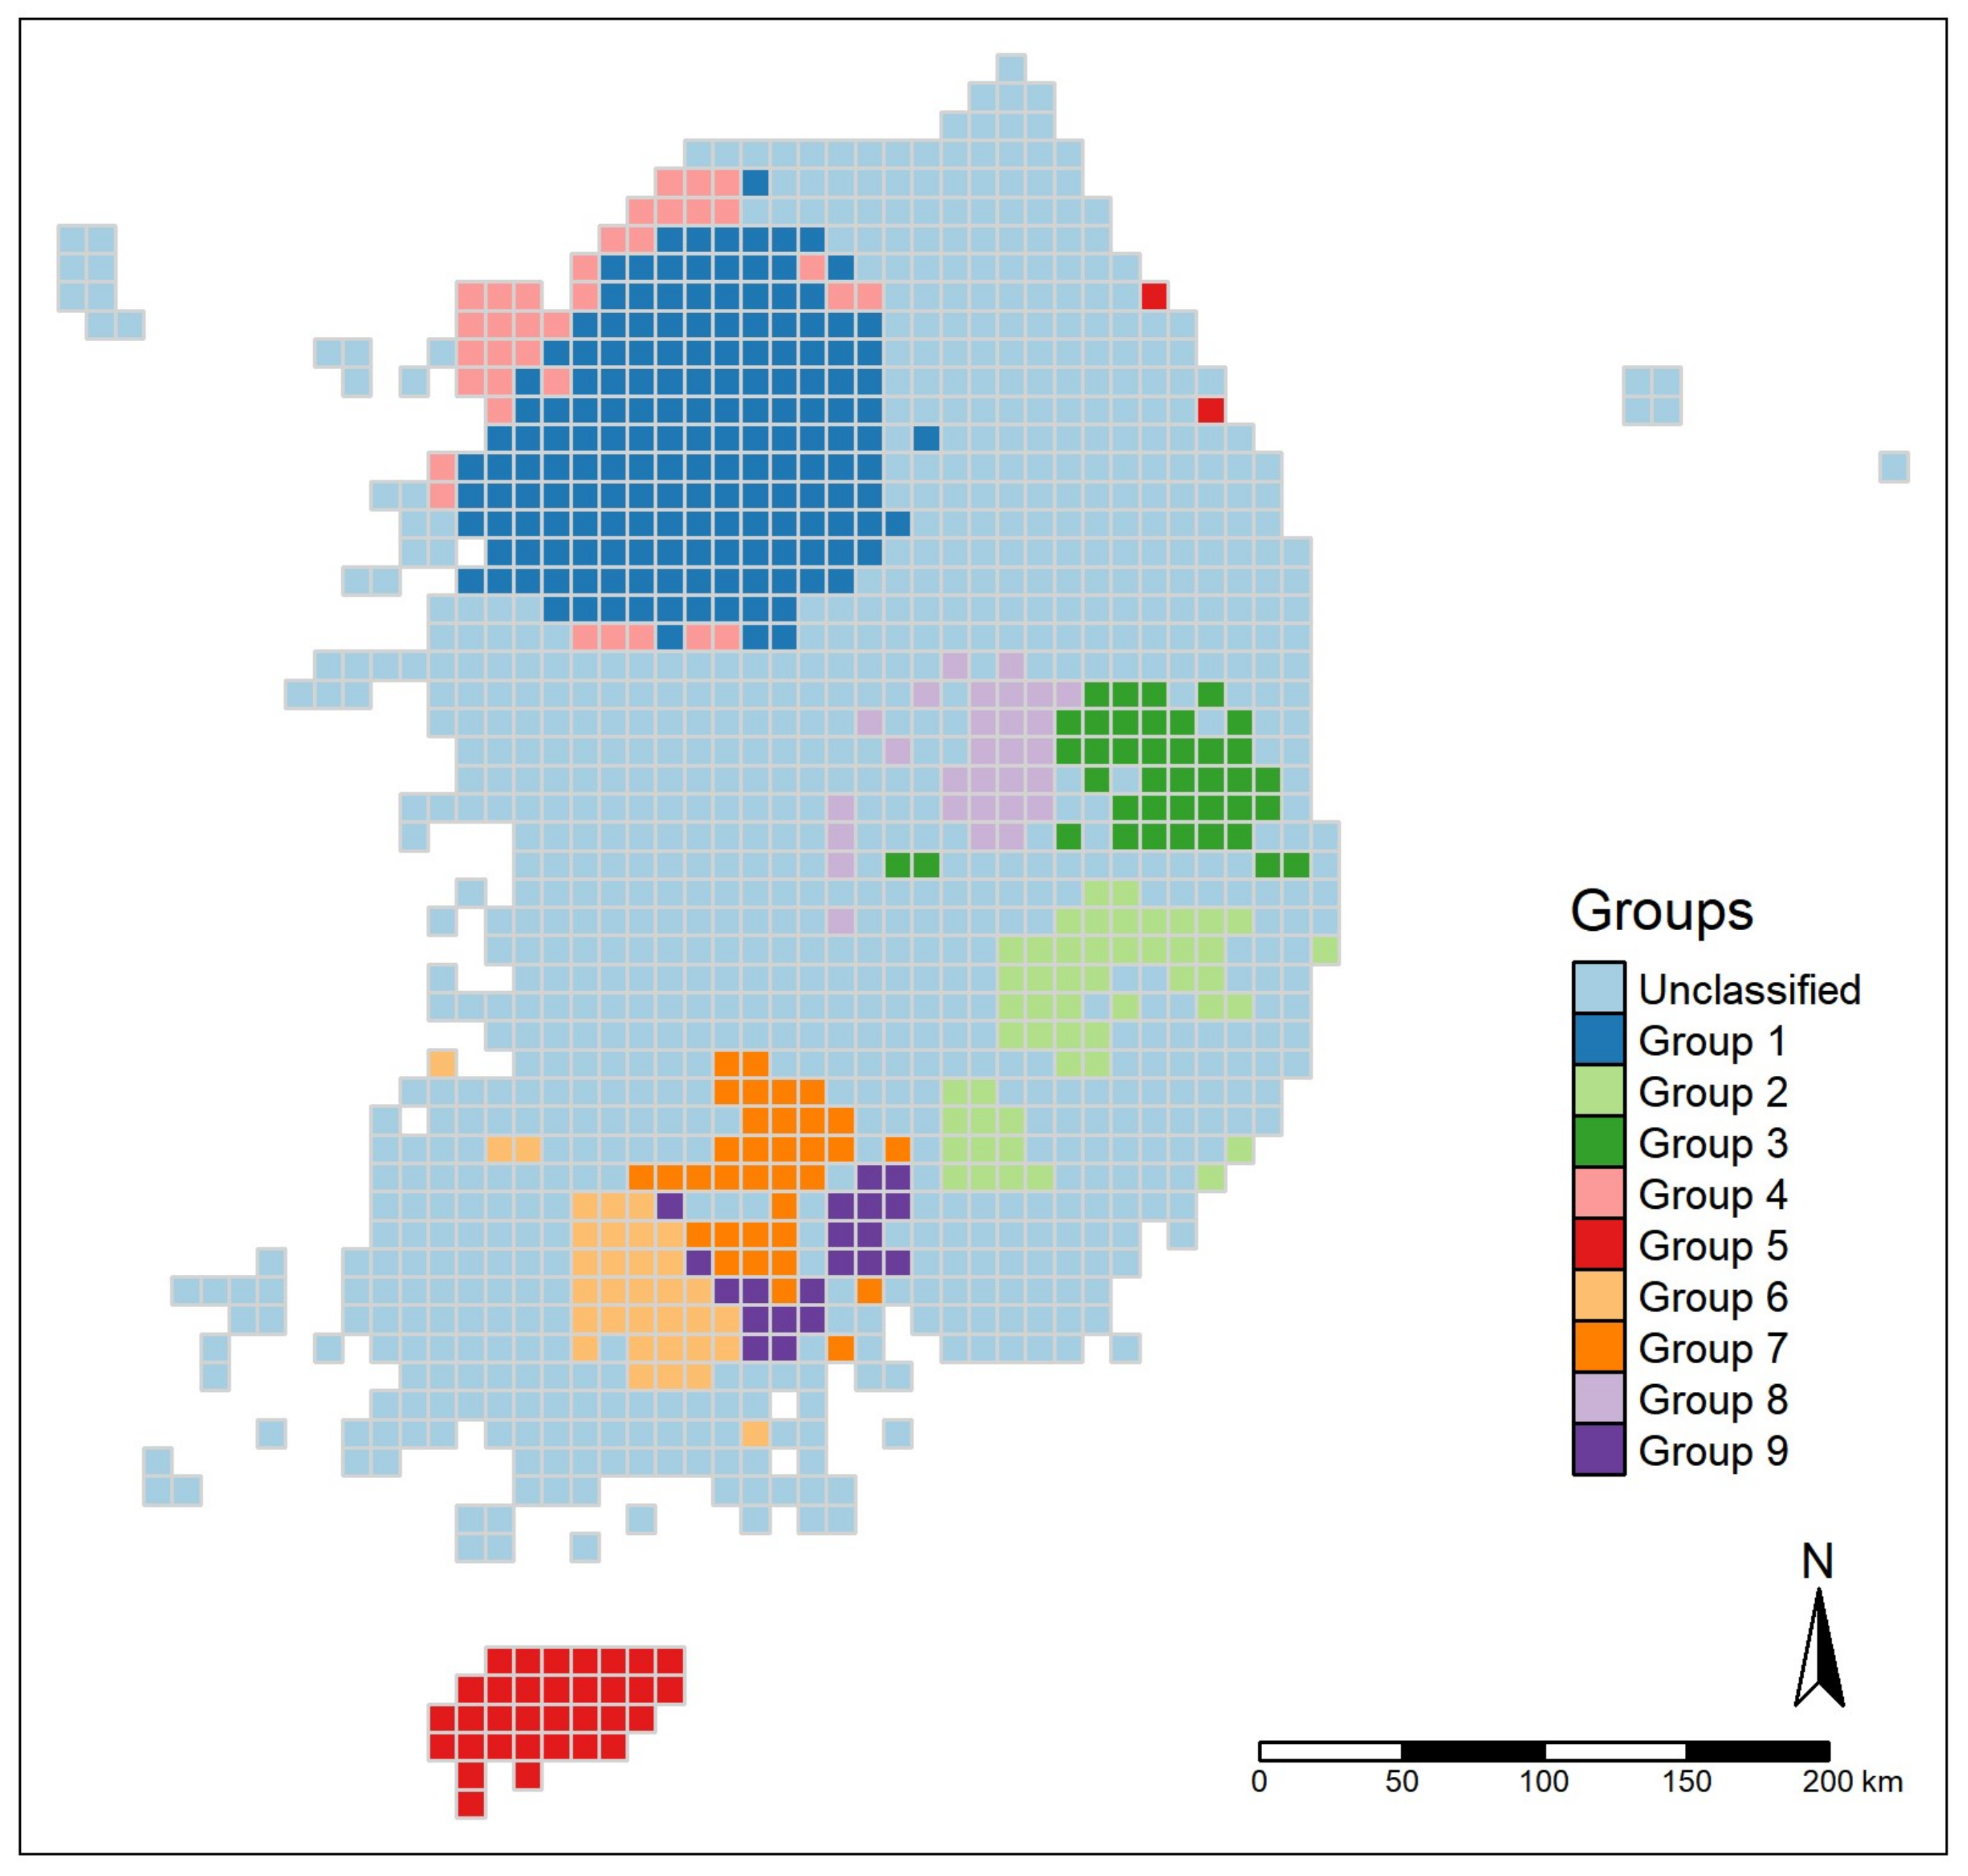
4.2. Local Sparse PCA
5. Conclusions
5.1. Summary and Implications
5.2. Limitations and Future Recommendations
Author Contributions
Funding
Institutional Review Board Statement
Informed Consent Statement
Data Availability Statement
Conflicts of Interest
References
- Smith, N. Gentrification and uneven development. Econ. Geogr. 1982, 58, 139–155. [Google Scholar] [CrossRef]
- Li, Z.; Wang, X.; Zarazaga, J.; Smith-Colin, J.; Minsker, B. Do infrastructure deserts exist? Measuring and mapping infrastructure equity: A case study in Dallas, Texas, USA. Cities 2022, 130, 103927. [Google Scholar] [CrossRef]
- Bissonnette, L.; Wilson, K.; Bell, S.; Shah, T.I. Neighbourhoods and potential access to health care: The role of spatial and aspatial factors. Health Place 2012, 18, 841–853. [Google Scholar] [CrossRef] [PubMed] [Green Version]
- Landry, S.M.; Chakraborty, J. Street trees and equity: Evaluating the spatial distribution of an urban amenity. Environ. Plan. A Econ. Space 2009, 41, 2651–2670. [Google Scholar] [CrossRef]
- Rigolon, A.; Németh, J. What shapes uneven access to urban amenities? Thick injustice and the legacy of racial discrimination in Denver’s parks. J. Plan. Educ. Res. 2021, 41, 312–325. [Google Scholar] [CrossRef]
- Klinenberg, E. Palaces for the People: How Social Infrastructure Can Help Fight Inequality, Polarization, and the Decline of Civic Life; Crown: New York, USA, 2018. [Google Scholar]
- Latham, A.; Layton, J. Social infrastructure and the public life of cities: Studying urban sociality and public spaces. Geogr. Compass 2019, 13, e12444. [Google Scholar] [CrossRef] [Green Version]
- Everitt, B.; Dunn, G. Applied Multivariate Data Analysis, 2nd ed.; John Wiley & Sons, Ltd.: London, UK, 2001; p. 342. [Google Scholar]
- Greyling, T.; Tregenna, F. Construction and analysis of a composite quality of life index for a region of South Africa. Soc. Indic. Res. 2017, 131, 887–930. [Google Scholar] [CrossRef]
- Manitiu, D.N.; Pedrini, G. Urban smartness and sustainability in Europe. An ex ante assessment of environmental, social and cultural domains. Eur. Plan. Stud. 2016, 24, 1766–1787. [Google Scholar] [CrossRef]
- Bourassa, S.C.; Hamelink, F.; Hoesli, M.; MacGregor, B.D. Defining housing submarkets. J. Hous. Econ. 1999, 8, 160–183. [Google Scholar] [CrossRef]
- Wu, C.; Sharma, R. Housing submarket classification: The role of spatial contiguity. Appl. Geogr. 2012, 32, 746–756. [Google Scholar] [CrossRef]
- Wiersma, S.; Just, T.; Heinrich, M. Segmenting German housing markets using principal component and cluster analyses. Int. J. Hous. Mark. Anal. 2022, 15, 548–578. [Google Scholar] [CrossRef]
- Zou, H.; Hastie, T.; Tibshirani, R. Sparse principal component analysis. J. Comput. Graph. Stat. 2006, 15, 265–286. [Google Scholar] [CrossRef] [Green Version]
- Shen, H.; Huang, J.Z. Sparse principal component analysis via regularized low rank matrix approximation. J. Multivar. Anal. 2008, 99, 1015–1034. [Google Scholar] [CrossRef] [Green Version]
- Demšar, U.; Harris, P.; Brunsdon, C.; Fotheringham, A.S.; McLoone, S. Principal component analysis on spatial data: An overview. Ann. Assoc. Am. Geogr. 2013, 103, 106–128. [Google Scholar] [CrossRef]
- Cartone, A.; Postiglione, P. Principal component analysis for geographical data: The role of spatial effects in the definition of composite indicators. Spat. Econ. Anal. 2021, 16, 126–147. [Google Scholar] [CrossRef]
- Harris, P.; Brunsdon, C.; Charlton, M. Geographically weighted principal components analysis. Int. J. Geogr. Inf. Sci. 2011, 25, 1717–1736. [Google Scholar] [CrossRef]
- Kaiser, H.F. The varimax criterion for analytic rotation in factor analysis. Psychometrika 1958, 23, 187–200. [Google Scholar] [CrossRef]
- Jeffers, J.N.R. Two case studies in the application of principal component analysis. J. R. Stat. Society. Ser. C (Appl. Stat.) 1967, 16, 225–236. [Google Scholar] [CrossRef]
- Everitt, B.; Hothorn, T. An Introduction to Applied Multivariate Analysis with R; Springer Science & Business Media: New York, USA, 2011. [Google Scholar]
- Bitter, C.; Mulligan, G.F.; Dall’erba, S. Incorporating spatial variation in housing attribute prices: A comparison of geographically weighted regression and the spatial expansion method. J. Geogr. Syst. 2007, 9, 7–27. [Google Scholar] [CrossRef] [Green Version]
- Tahmasbi, B.; Haghshenas, H. Public transport accessibility measure based on weighted door to door travel time. Comput. Environ. Urban Syst. 2019, 76, 163–177. [Google Scholar] [CrossRef]
- Labetski, A.; Vitalis, S.; Biljecki, F.; Arroyo Ohori, K.; Stoter, J. 3D building metrics for urban morphology. Int. J. Geogr. Inf. Sci. 2022, 1–32. [Google Scholar] [CrossRef]
- Felipe-Sotelo, M.; Gustems, L.; Hernàndez, I.; Terrado, M.; Tauler, R. Investigation of geographical and temporal distribution of tropospheric ozone in Catalonia (North-East Spain) during the period 2000-2004 using multivariate data analysis methods. Atmos. Environ. 2006, 40, 7421–7436. [Google Scholar] [CrossRef]
- Zhang, C. Using multivariate analyses and GIS to identify pollutants and their spatial patterns in urban soils in Galway, Ireland. Environ. Pollut. 2006, 142, 501–511. [Google Scholar] [CrossRef] [PubMed]
- Kazemi, Z.; Jonidi Jafari, A.; Farzadkia, M.; Kazemnezhad Leyli, E.; Shahsavani, A.; Kermani, M. Assessment of the risk of exposure to air pollutants and identifying the affecting factors on making pollution by PCA, CFA. Int. J. Environ. Anal. Chem. 2022, 1–20. [Google Scholar] [CrossRef]
- Uddin, M.P.; Mamun, M.A.; Hossain, M.A. PCA-based feature reduction for hyperspectral remote sensing image classification. IETE Technol. Rev. 2021, 38, 377–396. [Google Scholar] [CrossRef]
- Zhao, H.; Liu, F.; Zhang, H.; Liang, Z. Convolutional neural network based heterogeneous transfer learning for remote-sensing scene classification. Int. J. Remote Sens. 2019, 40, 8506–8527. [Google Scholar] [CrossRef]
- Zhao, B.; Dong, X.; Guo, Y.; Jia, X.; Huang, Y. PCA dimensionality reduction method for image classification. Neural Process. Lett. 2022, 54, 347–368. [Google Scholar] [CrossRef]
- Zou, H.; Hastie, T. Regularization and variable selection via the elastic net. J. R. Stat. Soc. Ser. B (Stat. Methodol.) 2005, 67, 301–320. [Google Scholar] [CrossRef] [Green Version]
- Brunsdon, C.; Fotheringham, A.S.; Charlton, M.E. Geographically weighted regression: A method for exploring spatial nonstationarity. Geogr. Anal. 1996, 28, 281–298. [Google Scholar] [CrossRef]
- Lepski, O.V.; Mammen, E.; Spokoiny, V.G. Optimal spatial adaptation to inhomogeneous smoothness: An approach based on kernel estimates with variable bandwidth selectors. Ann. Stat. 1997, 25, 929–947. [Google Scholar] [CrossRef]
- Fotheringham, A.S.; Yu, H.; Wolf, L.J.; Oshan, T.M.; Li, Z. On the notion of ‘bandwidth’ in geographically weighted regression models of spatially varying processes. Int. J. Geogr. Inf. Sci. 2022, 36, 1485–1502. [Google Scholar] [CrossRef]
- Chiu, S.-T. An automatic bandwidth selector for kernel density estimation. Biometrika 1992, 79, 771–782. [Google Scholar] [CrossRef]
- Kaiser, H.F. The application of electronic computers to factor analysis. Educ. Psychol. Meas. 1960, 20, 141–151. [Google Scholar] [CrossRef]
- Ferré, L. Selection of components in principal component analysis: A comparison of methods. Comput. Stat. Data Anal. 1995, 19, 669–682. [Google Scholar] [CrossRef]
- Griffith, D.A.; Chun, Y.; Lee, M. Deeper spatial statistical insights into small geographic area data uncertainty. Int. J. Environ. Res. Public Health 2021, 18, 231. [Google Scholar] [CrossRef] [PubMed]
- Kang, J.-Y.; Lee, S. Exploring food deserts in Seoul, South Korea during the COVID-19 pandemic (from 2019 to 2021). Sustainability 2022, 14, 5210. [Google Scholar] [CrossRef]


| Variable | Description | |||
|---|---|---|---|---|
| ho_area1 | Houses 40 m2 gross floor area | 1591.4 | 7583.1 | 3.68 |
| ho_area2 | Houses 60 m2 gross floor area | 3867.9 | 14,116.7 | 2.82 |
| ho_area3 | Houses 85 m2 gross floor area | 5193.6 | 17,094.3 | 2.55 |
| ho_area4 | Houses 130 m2 gross floor area | 2382.4 | 8034.8 | 2.61 |
| ho_area5 | Houses 130 m2 gross floor area | 676.6 | 2799.7 | 3.20 |
| ho_type1 | Multi-household houses | 1601.8 | 10,542.8 | 5.08 |
| ho_type2 | Detached houses | 2867.3 | 5730.3 | 1.56 |
| ho_type3 | Apartments | 8728.5 | 32,413.0 | 2.87 |
| ho_type4 | Townhouses | 360.3 | 1465.1 | 3.14 |
| ho_yr79 | Houses built in or before 1979 | 950.2 | 2618.5 | 2.14 |
| ho_yr80_89 | Houses built in the 1980s | 1338.5 | 6366.9 | 3.68 |
| ho_yr90_99 | Houses built in the 1990s | 4068.2 | 14,690.0 | 2.79 |
| ho_yr00_09 | Houses built in the 2000s | 3502.6 | 13,854.4 | 3.06 |
| ho_yr10_20 | Houses built in or after 2010 | 3853.0 | 13,209.1 | 2.65 |
| schools | Primary and secondary schools | 19.1 | 47.7 | 1.93 |
| hagwon | Hagwon providing extracurricular lessons | 104.5 | 434.1 | 3.20 |
| hospitals | Hospitals with at least 30 staffed beds | 5.5 | 21.8 | 3.07 |
| clinics_gp | Hospitals with less than 30 staffed beds | 88.1 | 449.4 | 3.92 |
| pharmacies | Retailing pharmaceuticals | 49.1 | 248.9 | 3.90 |
| postnatal | Postnatal care services | 0.7 | 3.7 | 3.77 |
| performing_venues | Performing arts venues | 1.9 | 18.4 | 7.30 |
| museums | Museums, including art museums | 0.9 | 2.3 | 2.01 |
| theatres | Movie theatres | 3.8 | 16.4 | 3.31 |
| culture_centres | Community culture centers | 0.1 | 0.4 | 2.37 |
| accommodation | Accommodations, including hotels and motels | 39.8 | 123.5 | 2.39 |
| camp_grounds | Caravan parks and camping grounds | 2.2 | 4.1 | 1.44 |
| temples | Temples (religious services) | 1.3 | 2.7 | 1.59 |
| bars | Licensed bars | 30.4 | 153.8 | 3.89 |
| clubs | Hospitality clubs | 39.9 | 146.1 | 2.82 |
| cctv | Closed circuit televisions | 209.0 | 697.2 | 2.57 |
| supermarkets | Supermarkets 3000 m2 gross floor area | 2.9 | 14.3 | 3.85 |
| Variable | PC1 | PC2 | PC3 |
|---|---|---|---|
| ho_area1 | 0.221 | −0.032 | 0.220 |
| ho_area2 | 0.166 | 0.104 | 0.016 |
| ho_area3 | 0.150 | 0.111 | −0.085 |
| ho_area4 | 0.152 | 0.083 | −0.095 |
| ho_area5 | 0.190 | 0.069 | 0.001 |
| ho_type1 | 0.287 | 0.064 | 0.540 |
| ho_type2 | 0.086 | 0.019 | −0.149 |
| ho_type3 | 0.168 | 0.128 | −0.081 |
| ho_type4 | 0.188 | −0.013 | 0.091 |
| ho_yr79 | 0.113 | −0.052 | −0.148 |
| ho_yr80_89 | 0.205 | 0.190 | 0.038 |
| ho_yr90_99 | 0.162 | 0.114 | −0.078 |
| ho_yr00_09 | 0.183 | 0.078 | 0.022 |
| ho_yr10_20 | 0.151 | 0.086 | 0.020 |
| schools | 0.114 | 0.071 | −0.085 |
| hagwon | 0.188 | 0.130 | −0.014 |
| hospitals | 0.158 | 0.155 | −0.317 |
| clinics_gp | 0.234 | 0.021 | 0.067 |
| pharmacies | 0.239 | −0.071 | 0.041 |
| postnatal | 0.213 | 0.162 | 0.180 |
| performing_venues | 0.335 | −0.877 | −0.109 |
| museums | 0.051 | 0.110 | −0.224 |
| theatres | 0.196 | 0.021 | −0.138 |
| culture_centres | 0.044 | 0.091 | −0.448 |
| accommodation | 0.130 | −0.006 | −0.227 |
| camp_grounds | 0.001 | 0.001 | 0.023 |
| temples | 0.034 | −0.021 | −0.136 |
| bars | 0.227 | −0.020 | 0.063 |
| clubs | 0.140 | 0.088 | −0.262 |
| cctv | 0.147 | 0.043 | 0.047 |
| supermarkets | 0.234 | 0.014 | −0.054 |
| 77.611 | 9.520 | 3.349 |
| Variable 1 | PC1 | PC2 | PC3 |
|---|---|---|---|
| ho_type1 | 0.152 | 0.578 | |
| ho_type3 | −0.294 | ||
| ho_yr80_89 | 0.405 | −0.006 | |
| hagwon | 0.235 | ||
| hospitals | −0.844 | ||
| clinics_gp | 0.207 | 0.198 | |
| pharmacies | 0.179 | ||
| postnatal | 0.638 | ||
| performing_venues | 0.861 | ||
| culture_centres | −0.202 | ||
| bars | 0.124 | ||
| clubs | −0.360 | ||
| supermarkets | 0.382 | 0.013 | −0.175 |
| 28.04 | 7.26 | 2.16 |
| Group | Variables with Non-Zero Loadings | |
|---|---|---|
| 1 | clinics_gp, ho_type1, performing_venues, pharmacies, postnatal, supermarkets | 172 |
| 2 | bars, clubs, hagwon, ho_yr80_89, hospitals, supermarkets | 50 |
| 3 | ho_area5, ho_yr80_89, hospitals, performing_venues, supermarkets, theatres | 39 |
| 4 | bars, clinics_gp, ho_type1, performing_venues, pharmacies, supermarkets | 35 |
| 5 | accommodation, bars, clubs, culture_centres, ho_type4, postnatal | 35 |
| 6 | accommodation, clubs, ho_type3, ho_yr90_99, hospitals, theatres | 34 |
| 7 | accommodation, clubs, hagwon, ho_yr80_89, hospitals, theatres | 34 |
| 8 | clubs, ho_area5, ho_yr80_89, performing_venues, supermarkets, theatres | 29 |
| 9 | accommodation, clubs, hagwon, ho_type3, hospitals, theatres | 20 |
| 448 |
Publisher’s Note: MDPI stays neutral with regard to jurisdictional claims in published maps and institutional affiliations. |
© 2022 by the authors. Licensee MDPI, Basel, Switzerland. This article is an open access article distributed under the terms and conditions of the Creative Commons Attribution (CC BY) license (https://creativecommons.org/licenses/by/4.0/).
Share and Cite
Hong, S.-Y.; Moon, S.; Chi, S.-H.; Cho, Y.-J.; Kang, J.-Y. Local Sparse Principal Component Analysis for Exploring the Spatial Distribution of Social Infrastructure. Land 2022, 11, 2034. https://doi.org/10.3390/land11112034
Hong S-Y, Moon S, Chi S-H, Cho Y-J, Kang J-Y. Local Sparse Principal Component Analysis for Exploring the Spatial Distribution of Social Infrastructure. Land. 2022; 11(11):2034. https://doi.org/10.3390/land11112034
Chicago/Turabian StyleHong, Seong-Yun, Seonggook Moon, Sang-Hyun Chi, Yoon-Jae Cho, and Jeon-Young Kang. 2022. "Local Sparse Principal Component Analysis for Exploring the Spatial Distribution of Social Infrastructure" Land 11, no. 11: 2034. https://doi.org/10.3390/land11112034
APA StyleHong, S.-Y., Moon, S., Chi, S.-H., Cho, Y.-J., & Kang, J.-Y. (2022). Local Sparse Principal Component Analysis for Exploring the Spatial Distribution of Social Infrastructure. Land, 11(11), 2034. https://doi.org/10.3390/land11112034