Article

Species Distribution Modeling of the Breeding Site Distribution and Conservation Gaps of Lesser White-Fronted Goose in Siberia under Climate Change

1
School of Ecology and Nature Conservation, Beijing Forestry University, Beijing 100083, China
2
Center for East Asian-Australasian Flyway Studies, Beijing 100083, China
*
Author to whom correspondence should be addressed.
Land 2022, 11(11), 1946; https://doi.org/10.3390/land11111946
Submission received: 6 September 2022 / Revised: 24 October 2022 / Accepted: 26 October 2022 / Published: 31 October 2022

Abstract

:
Climate change has become an important cause of the loss of bird habitat and changes in bird migration and reproduction. The lesser white-fronted goose (Anser erythropus) has a wide range of migratory habits and is listed as vulnerable on the IUCN (International Union for Conservation of Nature) Red List. In this study, the distribution of suitable breeding grounds for the lesser white-fronted goose was assessed in Siberia, Russia, using a combination of satellite tracking and climate change data. The characteristics of the distribution of suitable breeding sites under different climate scenarios in the future were predicted using the Maxent model, and protection gaps were assessed. The analysis showed that under the background of future climate change, temperature and precipitation will be the main climatic factors affecting the distribution of breeding grounds, and the area associated with suitable breeding habitats will present a decreasing trend. Areas listed as an optimal habitat only accounted for 3.22% of the protected distribution; however, 1,029,386.341 km2 of optimal habitat was observed outside the protected area. Obtaining species distribution data is important for developing habitat protection in remote areas. The results presented here can provide a basis for developing species-specific habitat management strategies and indicate that additional attention should be focused on protecting open spaces.

1. Introduction

Bird species’ distribution changes in the context of global climate change are complex issues that require species-specific analyses [1,2]. Research suggests that global warming and increased atmospheric CO2 will eventually destroy or completely alter existing habitats for the world’s waterfowl species [3]. Overall, global warming can lead to a significant range contraction in bird populations, although some will expand or remain unaffected by climate change [4]. Nevertheless, studies have shown that range contraction occurs more commonly than range expansion [5]. By analyzing breeding bird survey data (1971–2000), Steen et al. [6] predicted that the total range of five common waterbird species in the Prairie Pothole Region (PPR) of the U.S. will be reduced by 64%. Among these species, Botaurus lentiginosus would lose 71% of its current range while Porzana carolina would lose a higher proportion (up to 100%). Specifically, increases in temperature and CO2 concentration would favor various plant types [7], leading to competition and then a gradual equilibrium between plants due to different tolerances, thereby changing the composition and structure of plant communities [8]. These newly formed plant communities will, in turn, affect the distribution of waterbirds through a series of chain reactions, thus eventually reshaping the distribution range of waterbirds. Boerger [9] simulated the distribution shifts of 14 waterbirds using a spatially explicit model and found that climate change was the main driver of changes in bird distribution. Stralberg et al. [10] also found that climate change might limit forest growth and succession, resulting in dramatic reductions in suitable habitats over the next century that would strongly affect the future distribution of boreal forest birds. Information on new bird records indicates that the range of many birds has shifted northward during recent decades, both on breeding and wintering sites [11].
In response to climate change, many birds have expanded their breeding range northward [12], although some species have changed their non-breeding range and moved closer to their breeding sites [13,14]. In Europe, Thomas and Lennon [15] studied changes in the distribution of bird breeding sites in the UK and found that species in the northern region had shifted an average of 18.9 km northward. In Finland, some breeding birds have also shifted their range margins poleward due to global warming [16]. In addition to the historical evidence, model predictions have indicated similar future habitat changes. Peterson [17] predicted changes in the distribution of 26 bird species in the Rocky Mountains of West-Central North America and 19 species in the Great Plains by 2055, thus showing that climate change is causing significant changes in the distribution and movement of birds in the plains. Virkkala et al. [18] projected changes in the distribution of 27 species of land birds in the boreal zone during the 21st century under two future climate scenarios, A2 and B1 (which represent a global mean temperature increase of 3.8 °C and 2.0 °C by 2100, respectively), and found a severe reduction in the range of the birds by 2080 (A2, 83.6% reduction; B1, 73.6% reduction). The modeling results showed that changes in the distribution of birds were more dependent on the breeding sites than non-breeding sites, and different outcomes were found for breeding and non-breeding sites. Doswald [19] predicted changes in the range of breeding and non-breeding sites of European forest warblers and showed that the range of breeding sites expanded northward, while non-breeding sites did not present a directional shift. Doswald also found that climate change affects migratory species more severely than resident birds. Hu et al. [20] predicted changes in the wintering range of Platalea minor and found that its distribution would expand northward under the influence of future climate change. For vertical distribution, Maggini et al. [21] found that 35% of the species distribution would shift toward higher altitudes under a warming climate. Buermann [22] evaluated changes in five Andean hummingbird species along an elevational gradient under two climate change scenarios and found that in addition to habitat loss and fragmentation factors, shifts in bird distribution along an elevational gradient of 300–700 m are mainly attributed to climate change.
The Russian Far East is a globally important breeding site for migratory waterbirds, including geese, ducks, cranes, and shorebirds [23]. Waterbirds that breed in the region are numerous and diverse, and many are globally threatened, such as the lesser white-fronted goose (Anser erythropus), a small-sized bird with an extensive distribution in the northernmost Palearctic. Four sub-populations of A. erythropus are recognized, three of which remain within its former extensive distribution: the Fennoscandian population (breeds in the Nordic countries and the Kola Peninsula in Russia); the Western Asian population (breeds in Northern Russian tundra to the center of the Taimyr Peninsula); and the Eastern Asian population (breeds in Southern Taimyr and areas north of Eastern Siberia and Chukotka) [24]. The most recent total population estimate is 24,000–40,000 individuals, which is decreasing [25]. The population of this species has declined sharply since 1950 [26]. Some of the original breeding habitats of lesser white-fronted geese are gradually disappearing due to climate-change-induced declines in habitat quality and other effects. The significant uncertainty in the rate, extent, and ensuing ecological implications of climate change makes it difficult to conserve species. However, habitat areas where species migrate in regions that are affected by climate change can be prioritized in conservation planning. Analyses of such changes assume that there will be no change in human activities under present and future conditions, and they only consider the effects of climate change on the habitat. Such analyses allow for in-depth evaluations of changes in suitable breeding sites under the combined effects of climate change, hydrological conditions, plant dynamics, and human activities. A model analysis by Zöckler [27] showed that the destruction of breeding sites will continue to affect the population of lesser white-fronted geese.
This study focuses on the East Asia population of the lesser white-fronted goose, which winters in the middle to lower Yangtze River region in China, the Korean Peninsula, and Japan. Recently, studies have focused on the wintering grounds and migratory paths of the species in Eastern Asia [28,29,30,31]. However, due to the remoteness and low accessibility of their breeding habitats, very few historical observations are available on the summer range of the eastern population [32,33,34]. Moreover, systematic survey data are insufficient to cover the entire geographic area. Therefore, data on the summer distribution and habitat preferences are very limited [35,36,37], thus representing a significant knowledge gap that prevents the effective conservation of this endangered goose.
Built on our previous study that investigated the summer range of the eastern population of lesser white-fronted geese [38], this study explores the current conservation gaps of this species. Additionally, a species distribution model (SDM) is developed to predict the future breeding range of this goose under climate change scenarios to compare the potential impacts on breeding habitat distributions in Northeastern Siberia. The findings of this research could support the development of effective habitat conservation management strategies to mitigate the adverse impact of climate change on the survivorship of waterfowl species.

2. Materials and Methods

2.1. Study Area

The breeding range of the eastern species of lesser white-fronted goose extends from the Taimyr Peninsula eastward to the Chukotka region [28,33].
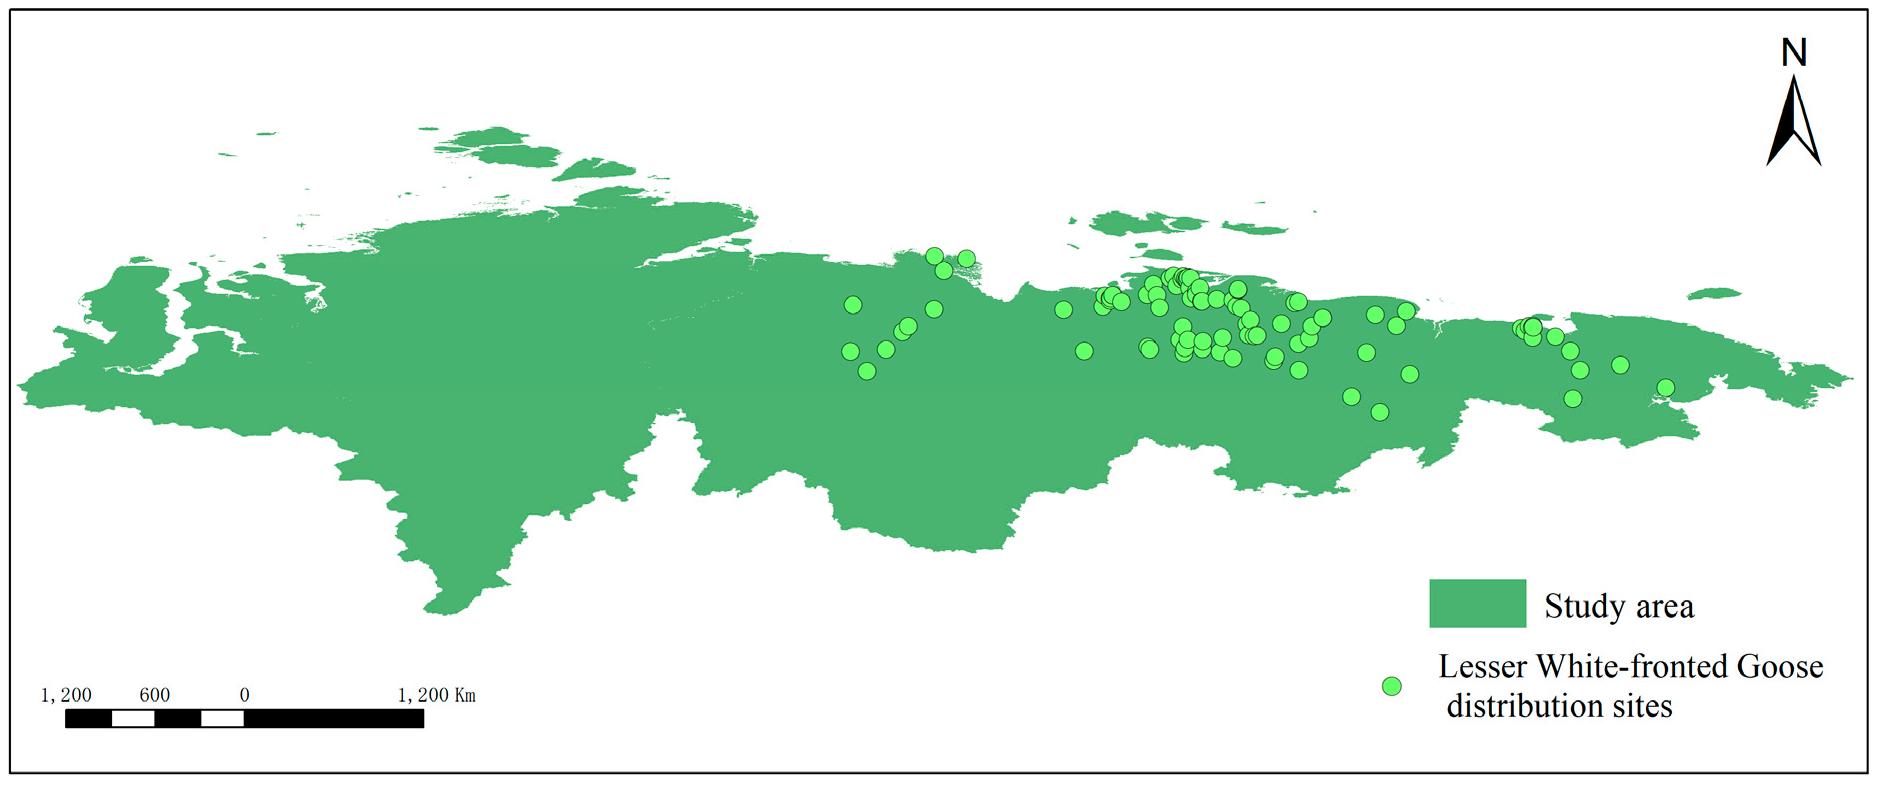
The summer activity and distribution area in this study is located in a vast area of Northeastern Siberia, starting from the Yamal-Nenets Autonomous Okrug and extending eastward to the Chukotka Autonomous Okrug, including the Tyumen Oblast, Krasnoyarsk Kray, Yakutia, and Magadan Oblast of the Russian Federation Republic (Figure 1).

2.2. Data Collection

2.2.1. Species Distribution Data

The distribution data of lesser white-fronted goose used in the present study were collected and screened by H. Tian et al. [38] in an analysis of potential distribution areas of summer breeding sites for birds, and the data used in the current analysis are consistent with predicted future changes in the breeding site distribution and more convincing. The data used in the analyses were obtained from long-term field surveys, observation records, and satellite tracking data in Western Chukchi, Russia.
Field investigations: Russian research teams performed long-term population surveys of breeding and molting lesser white-fronted geese along river and lake habitats in the Western Chukchi region of Russia [36,38]. Observations related to the summer habitat of the lesser white-fronted goose date back to 1998. As of August 2019, these field surveys and observational records cumulatively provided 33 valuable breeding or molt records of the lesser white-fronted geese. Satellite tracking: Using a previously described technique [28], trackers were placed on 88 lesser white-fronted geese (Hunan Global Messenger Technology, Changsha, China) by experienced hunters in the East Dongting Lake National Nature Reserve. The transmitters were solar powered and enabled the Global System for Mobile Communications (GSM) to transmit data via Short Message Service (SMS). The transmitters were placed in backpacks designed to weigh 22 g, which is approximately 1.6% of the bird’s body weight; thus, the transmitters did not interfere with the normal movement of the animals [28]. GPS position and speed data were recorded every 1–3 h, depending on the battery condition; however, tracking data for 77 birds were lost due to equipment failure or personal injury. On 27 November 2019, the trackers from a total of 11 small white-fronted geese were obtained (Table 1). Complete migration data were recorded over the wintering, summer, and migration periods. The devices sent a total of 90,441 valid positioning records, with an average of 8222 records per device. From these data, we selected the complete summer breeding site data of small white-fronted geese for further screening. This study grouped the birds’ GPS records for all dates into monthly data by filtering the summer records (accuracy < 1000 m), and only one record was selected for analysis from pixels with multiple GPS records to avoid false duplication. If the bird stayed at a site for more than four days, then the site was classified as a suitable breeding site data point. Based on a review of the literature [35,39,40] that includes historical surveys along the river [36] in the survey area since 1998, this study extracted a total of 13 historical distribution point records of breeding or feathered small white-fronted geese for Maxent modeling. Among them, 11 observation records provided a description of geographical indicators near the recorded location and an approximate position reference; however, clear geographical coordinates were not provided. Therefore, this study calibrated the recorded locations without clear coordinates based on the name of the river provided in the literature and the distance to the nearest village to determine the distribution. The positions of data points used during modeling are provided in Supplementary Table S1. Summer breeding area GPS records (accuracy < 1000 m) were screened to select data that match the number of stay days, and they were then combined with field survey [41] and literature retrieval data to obtain a total of 97 lesser white-fronted goose distribution data points for the modeling and analysis of the summer habitats under Maxent future climate scenarios. The study uses the same distribution data points for the analyses under future climate change scenarios. The data used in the current analysis are consistent with the predicted future breeding ground distribution change data (Supplementary Table S1).

2.2.2. Boundaries of the Protected Areas

The World Database on Protected Areas (WDPA) has the most comprehensive database of marine and terrestrial protected areas in the world. Among the data applied to this paper is the WDPA released in March 2022, which contains a total of 269,673 protected area records covering 245 countries and territories.

2.2.3. Climatic Data

Environmental climate variables were obtained from Worldclim, and the data stratum was computed by inserting the monthly average climate data from the meteorological stations into a 30 arc-second precision mesh (commonly referred to as “1 km2” resolution). The analyzed variables included the monthly total precipitation, monthly mean, low, and high temperatures, and 19 climate-dependent bioclimatic parameters. The model was constructed by selecting 19 GCM variables for the historical scenario from 1960 to 1990 and future scenarios in 2050 and 2070. Future climate data were obtained from CMIP5 future bioclimatic data with a raw data resolution of 2.5 min and CCSM4 climatic system modeling, and the three representative concentration pathways (RCPs), namely, RCP2.6, RCP4.5, and RCP8.5, were selected to predict the suitable distribution areas of lesser white-fronted geese in Siberia in 2050 and 2070.
The IPCC (Intergovernmental Panel on Climate Change, IPCC) Fifth Assessment Report has introduced a new set of scenarios called RCPs that consider the socio-economic impacts of national policies on greenhouse gas and aerosol emissions and provide a more scientific description of the predicted future changes under climate warming. The four main emission scenarios include RCP2.6, RCP4.5, RCP6.0, and RCP8.5 [42]. The IMAGE modeling group of the PBL Netherlands Environmental Assessment Agency developed RCP2.6. This emission pathway exemplifies scenarios described in the literature that result in extremely low greenhouse gas concentrations. A “peak-and-decline” scenario is included in this pathway, with the radiative forcing level reaching a value of approximately 3.1 W/m2 by 2050 and decreasing to 2.6 W/m2 by 2100. To achieve these levels of radiative forcing, greenhouse gas emissions (and consequently air pollution emissions) must be significantly decreased over time [43]. The GCAM modeling group at the Joint Global Change Research Institute (JGCRI) of the Pacific Northwest National Laboratory in the U.S. created RCP4.5. This stabilization scenario prevents the long-term radiative forcing target level from being exceeded and stabilizes the overall radiative forcing shortly after 2100 [44,45,46]. The AIM modeling group of the National Institute for Environmental Studies (NIES) in Japan created RCP6. It is a normalization scenario in which a variety of technologies and tactics for lowering greenhouse gas emissions are used to stabilize total radiative forcing shortly after 2100 without overshoot [47,48]. The International Institute for Applied Systems Analysis (IIASA), Austria, created RCP8.5 utilizing the MESSAGE model and the IIASA integrated assessment framework. This RCP exhibits rising greenhouse gas emissions over time, which is typical of literature scenarios that result in high carbon dioxide detection limits [49].
In the RCP2.6 scenario, which assumes more aggressive mitigation of climate change and negative GHG emissions in the future, global temperatures would increase by 0.3 °C to 1.7 °C by the end of this century; in the RCP8.5 scenario, which assumes low social and technological innovation and a sharp increase in GHG emissions in the future, global temperatures would increase by 1.4 °C to 4.8 °C by the end of this century; and in the RCP4.5 and RCP6.0 scenarios, which assume that GHG emissions fall in between the above two scenarios, global temperatures would increase from 0.9℃ to 2.6℃ and from 0.8 °C to 3.1 °C by the end of this century, respectively.
The scenarios chosen in this paper, namely, RCP2.6, RCP4.5, and RCP8.5, are called “typical concentration pathways”. In RCP2.6, the radiative forcing decreases to 2.6 W/m2, and the comparable concentration of CO2 reaches approximately 490 × 10−6. In RCP4.5, the radiative forcing stabilizes at 4.5 W/m2, and the CO2 eq concentration reaches roughly 650 × 10−6. In RCP8.5, the CO2 eq concentration increases and remains at approximately 1370 × 10−6, and the radiative forcing reaches 8.5 W/m2.

2.3. Maxent Modeling and Evaluation

2.3.1. Maximum Entropy

The Maxent model is a general method for making predictions or inferences from incomplete information, and it is often used to extract potentially suitable habitats for species and was developed based on statistical mechanics. The model predicts the distribution of species by finding the probable distribution with the highest entropy value (predicting the distribution when the mean value of each variable is close to the mean value of the observed data), although it is subject to the constraint that the actual presence of data must be available [50]. The Maxent model uses the Jackknife method to analyze the weights of environmental variables, and the area under the curve (AUC) of the receiver operating characteristic (ROC) curve is used to evaluate the accuracy of the prediction model. The model overcomes the shortcomings of traditional habitat quality evaluation models by finding the probability distribution of maximum entropy to estimate the probability distribution of the target. Moreover, Maxent has good predictive power and higher predictive accuracy than other ecological niche models and is considered one of the best algorithms in terms of predictive power, especially for small sample points and occurrence-only data [51]. A number of scholars have used the Maxent model to conduct analyses of suitable habitats for species [52], future climate effects on species distribution, and patterns of invasive species. The model results were evaluated using the AUC values. In testing the simulation effect of the model, a larger AUC value corresponded to a stronger model prediction ability and better results. AUC values > 0.7 indicate that the model is credible, AUC values of 0.7~0.8 indicate that the simulation and prediction results are average, AUC values of 0.8~0.9 indicate that the prediction results are good, and AUC values > 0.9 indicate that the model results are excellent.

2.3.2. Bioclimatic Variables

More biologically significant variables are produced by deriving bioclimatic factors from monthly temperature and rainfall readings. Bioclimatic variables represent seasonally extreme or limiting environmental elements, annual trends (e.g., mean annual temperature, annual precipitation), and annual ranges of temperature and precipitation (e.g., temperature of the coldest and warmest month, and precipitation of the wet and dry quarters, with three months (or one-fourth of the year) making up a quarter) (Table 2).

2.3.3. Conservation Area Gap Analysis

The main methods applied for gap analyses performed at home and abroad were adopted here [53,54,55]. In addition, species distribution data were used to establish distribution scatter plots or distribution models, species distribution patterns were superimposed, and then these data were combined with protected area data. Layer overlay and vacancy analyses were based on GIS technology [56].
The ASCII file for the suitable range for lesser white-fronted geese under the current scenario generated by Maxent analysis was opened in ArcGIS 10.7 and transformed into raster data. Existing protected area layers were overlaid with suitable habitats to compare and analyze the conservation gaps of summer breeding sites of lesser white-fronted geese.

2.3.4. Comparison between the Current Distribution and Future Projections

First, the current climate background and suitable distribution area raster layers under the three RCP scenarios in 2050 and 2070 were loaded in ArcGIS 10.7. The suitable distribution area raster data were then merged to generate a new raster layer, and the field calculator function was used to calculate the loss of the current suitable distribution area under the three scenarios in 2050 and 2070 and the newly obtained suitable distribution areas in 2050 and 2070. Under various future climate change scenarios, the change trends of areas with unchanging breeding grounds and those with increases and decreases in suitable breeding grounds were determined and used to propose methods of protecting more breeding grounds.

3. Results

3.1. Distribution of Lesser White-Fronted Goose

According to the satellite tracking results, the main breeding grounds of the lesser white-fronted goose were obtained, and they were mainly distributed in the central and northern parts of the Republic of Yakutia, although a small amount was observed in Krasnoyarsk Kray and Chukotka Autonomous Okrug, and a concentrated distribution was observed. The findings revealed that the current bird distribution exhibited a banding region composed of numerous densely populated distribution areas (Figure 2).

3.2. Model Evaluation

The average AUC of our model was 0.988 (SD = 0.004). The results showed that the AUC values of the habitat suitability model for the summer breeding grounds of lesser white-fronted goose exceeded 0.9 for the current scenario. This indicates that the model simulation accuracy meets the requirements, and the results have high credibility.

3.3. Simulated Suitable Habitats and Associated Shifts under Different Scenarios

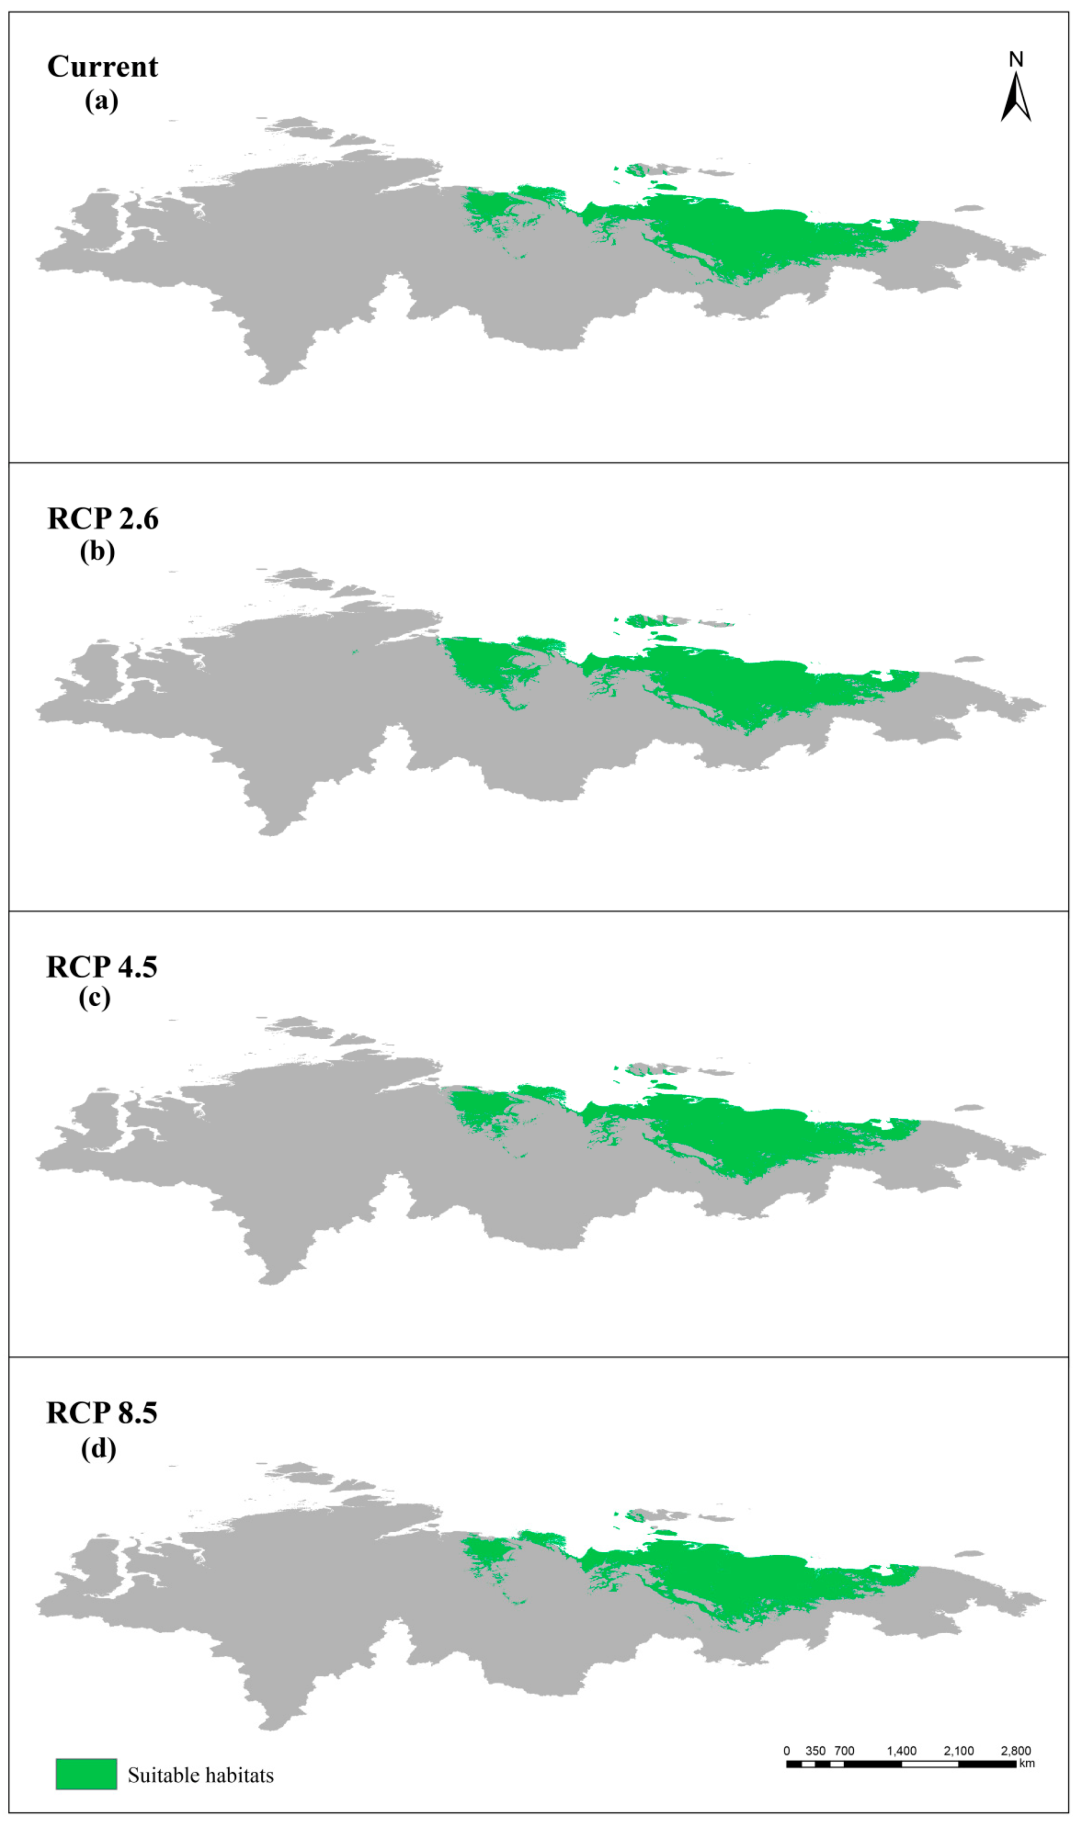
The suitable habitat area for summer breeding of lesser white-fronted goose was calculated, and the results showed that under the RCP2.6, RCP4.5, and RCP8.5 scenarios of the IPCC-CMIP5 climate emission conditions in 2050, the proportion of suitable habitat to the total study area will expand from 14.50% to 15.84% under the current scenario and then decrease to 14.42%. For RCP8.5, the percentage of appropriate habitat for the entire study region will decrease from 14.50% to 13.76%. In the 2050 scenario, the suitability of bird breeding sites will be lower than that of the current scenario (Figure 3).
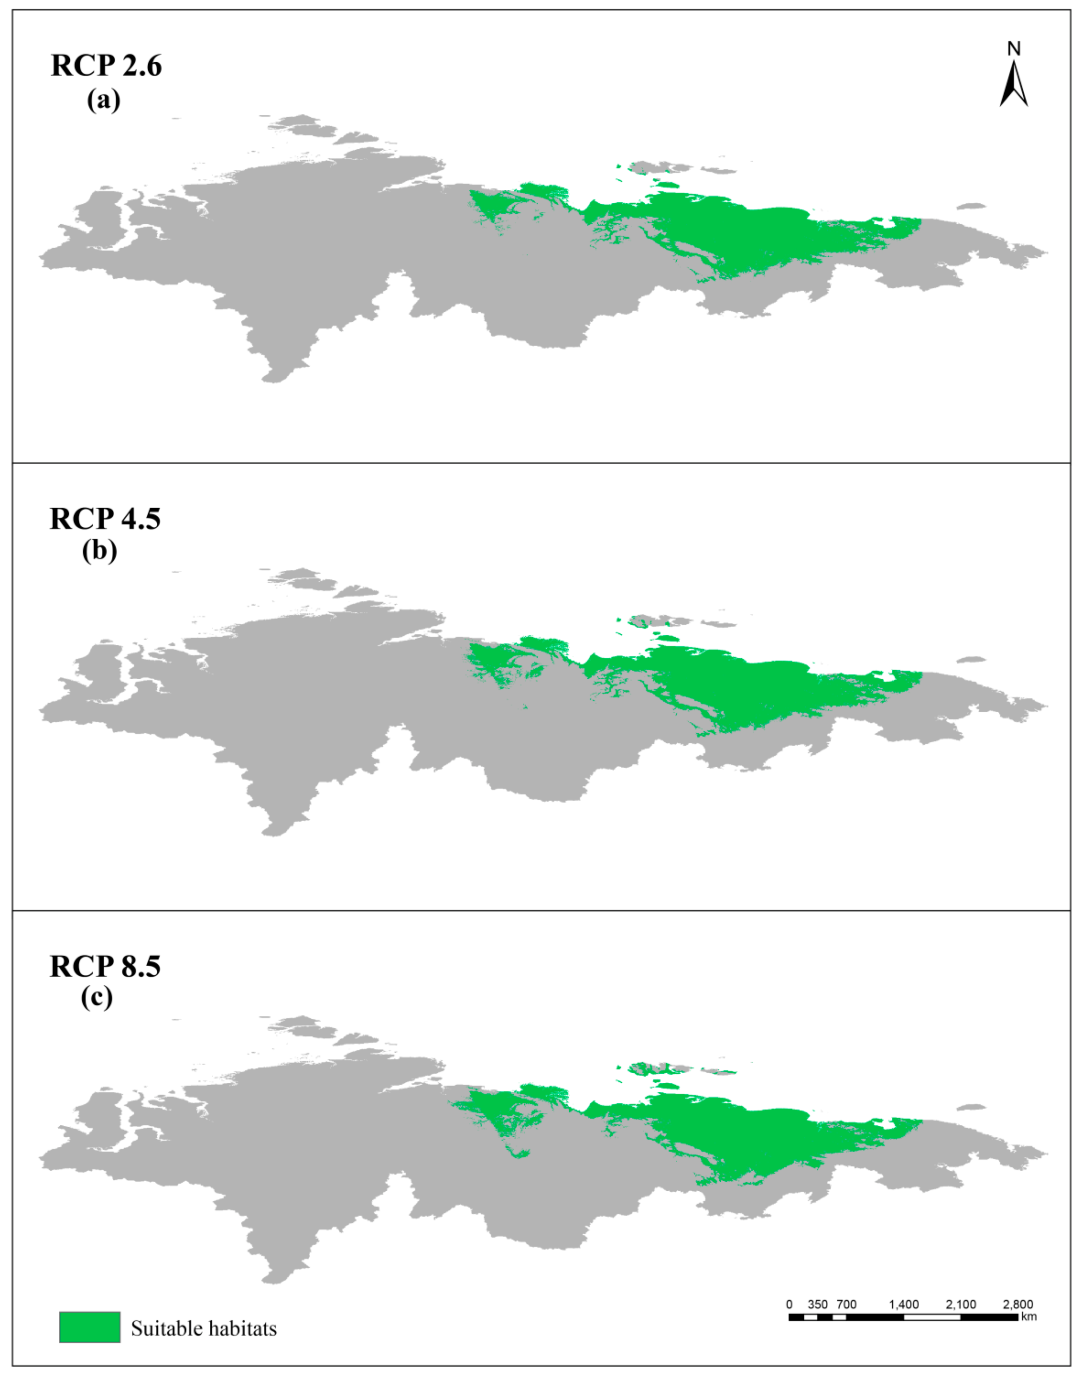
In 2070, the ratio of the total study region that will provide appropriate habitat under the current scenario declined from 14.50% to 13.90% and then increased to 14.41%, while that under the RCP8.5 scenario increased to 14.92%. In the 2070 scenario, the suitability of bird breeding sites will increase (Figure 4).

3.4. Conservation Gaps

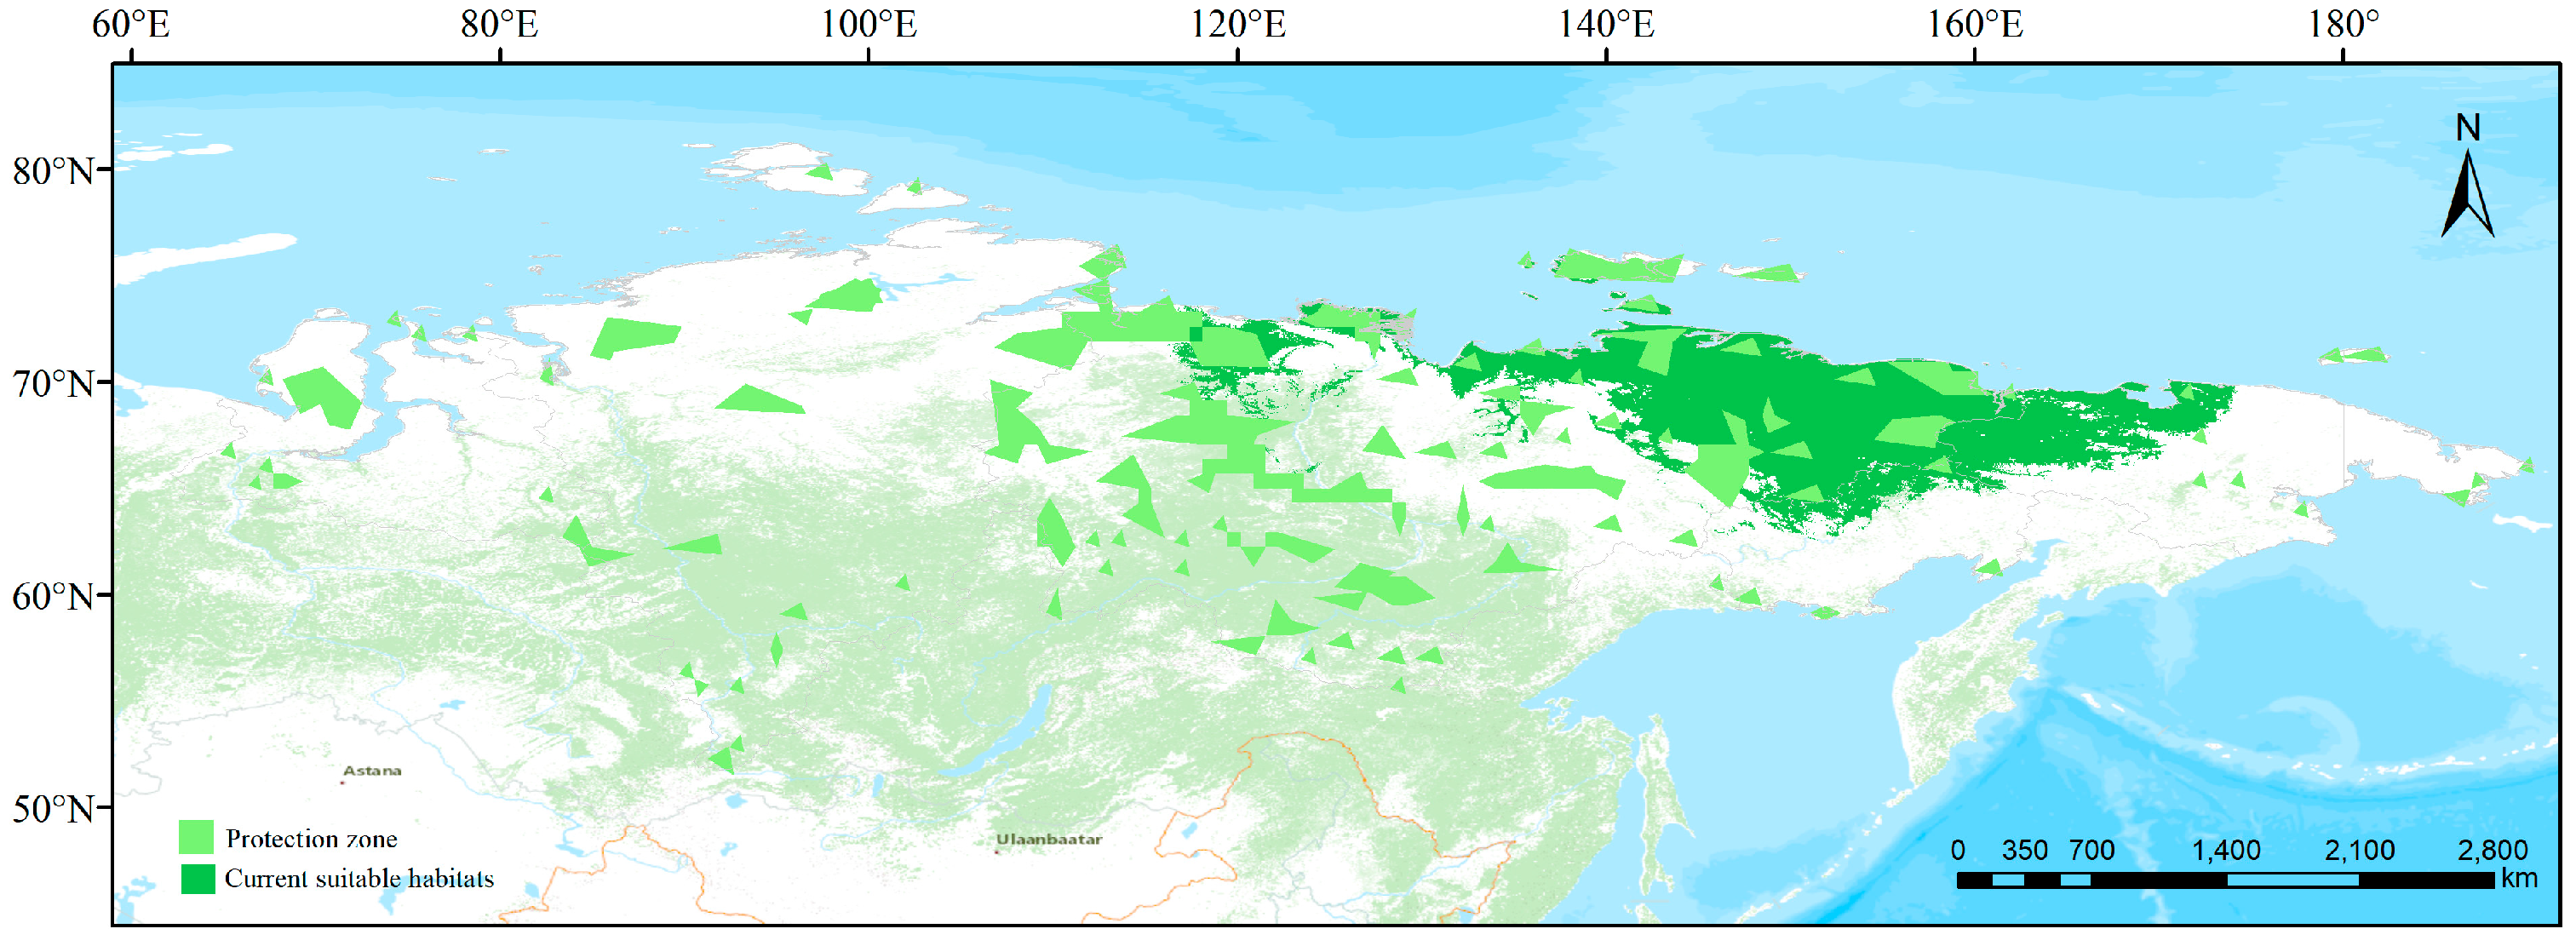
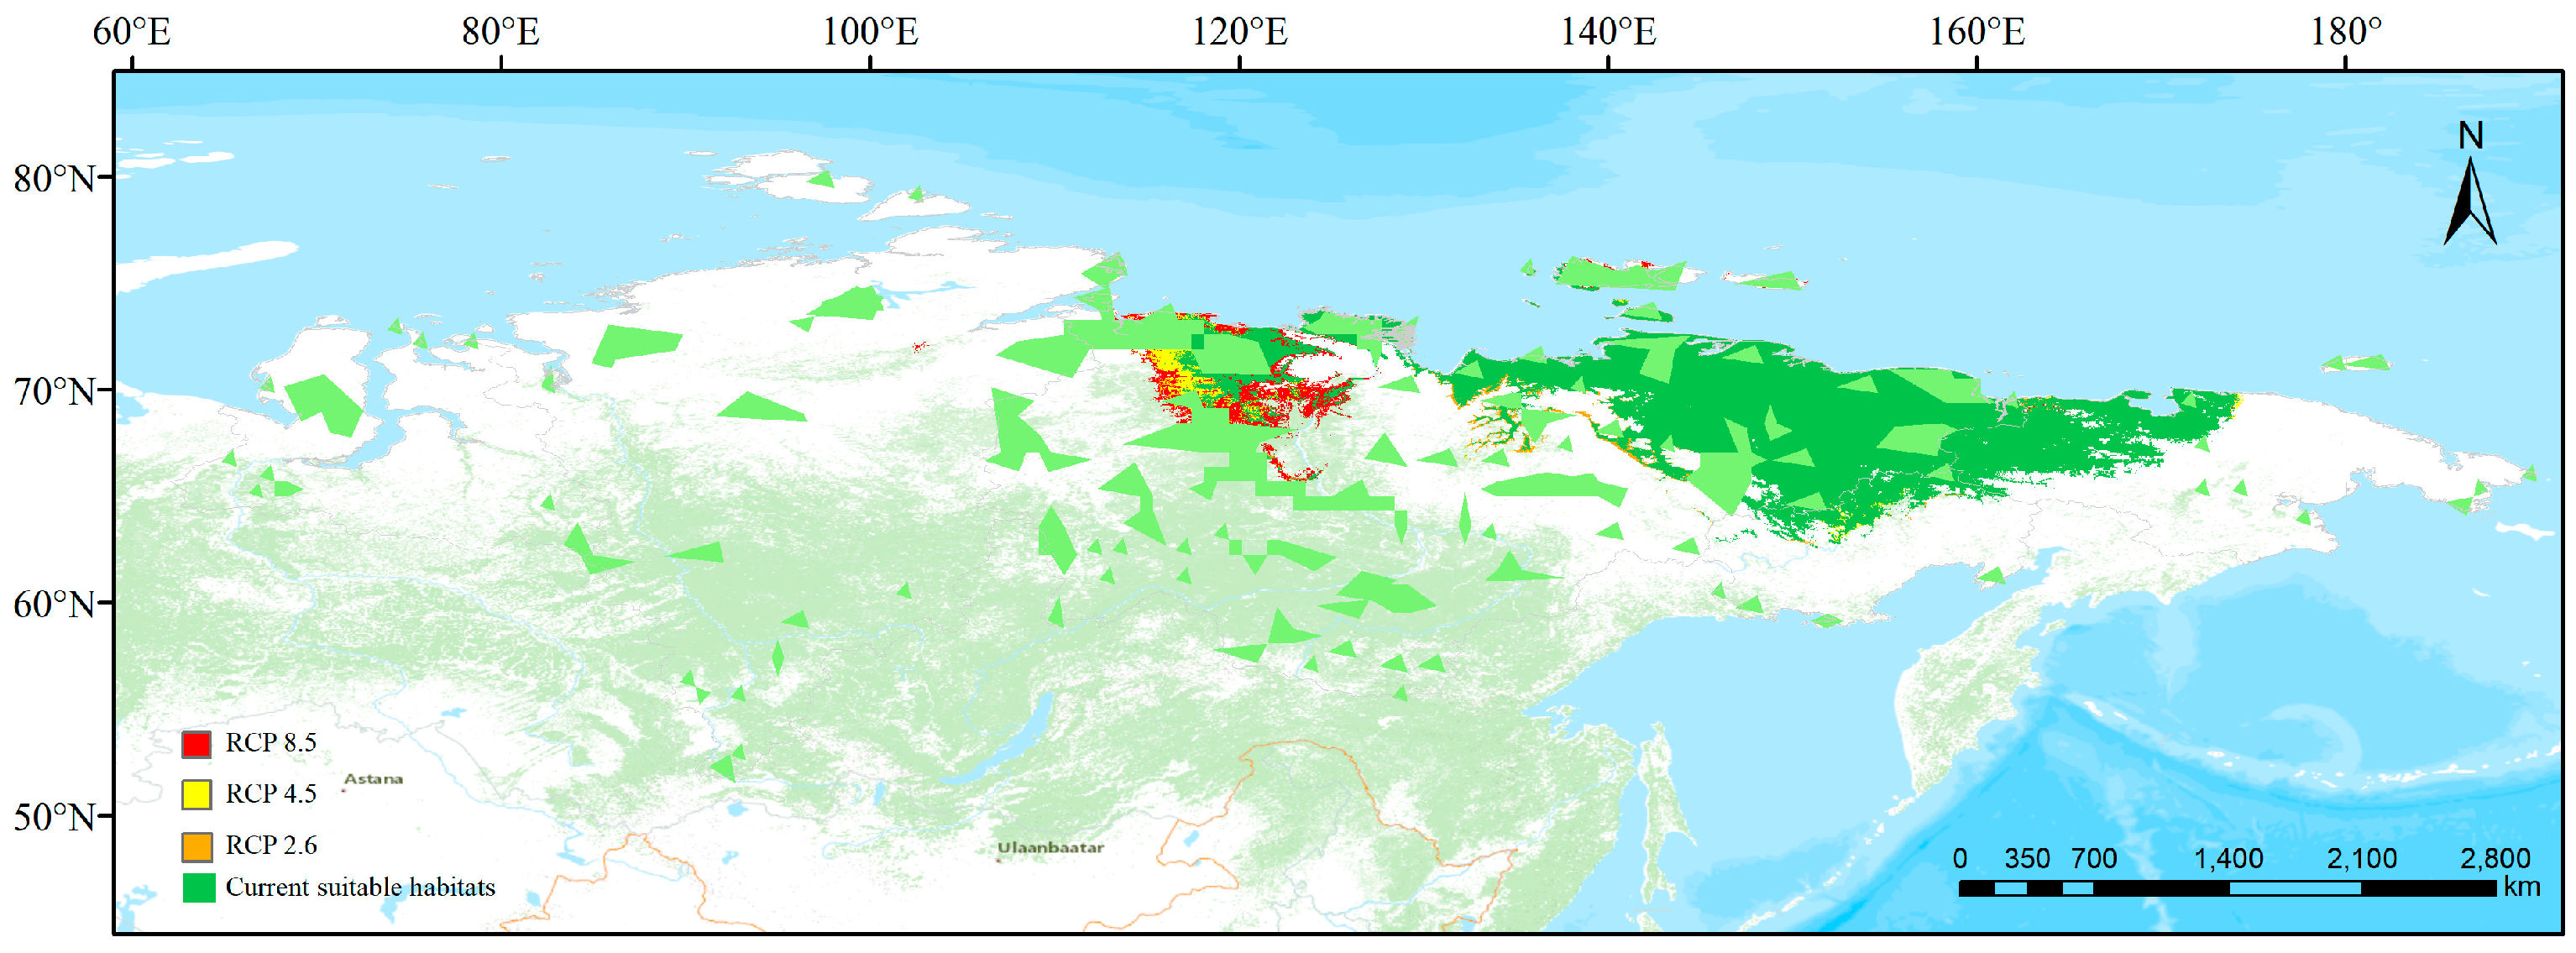
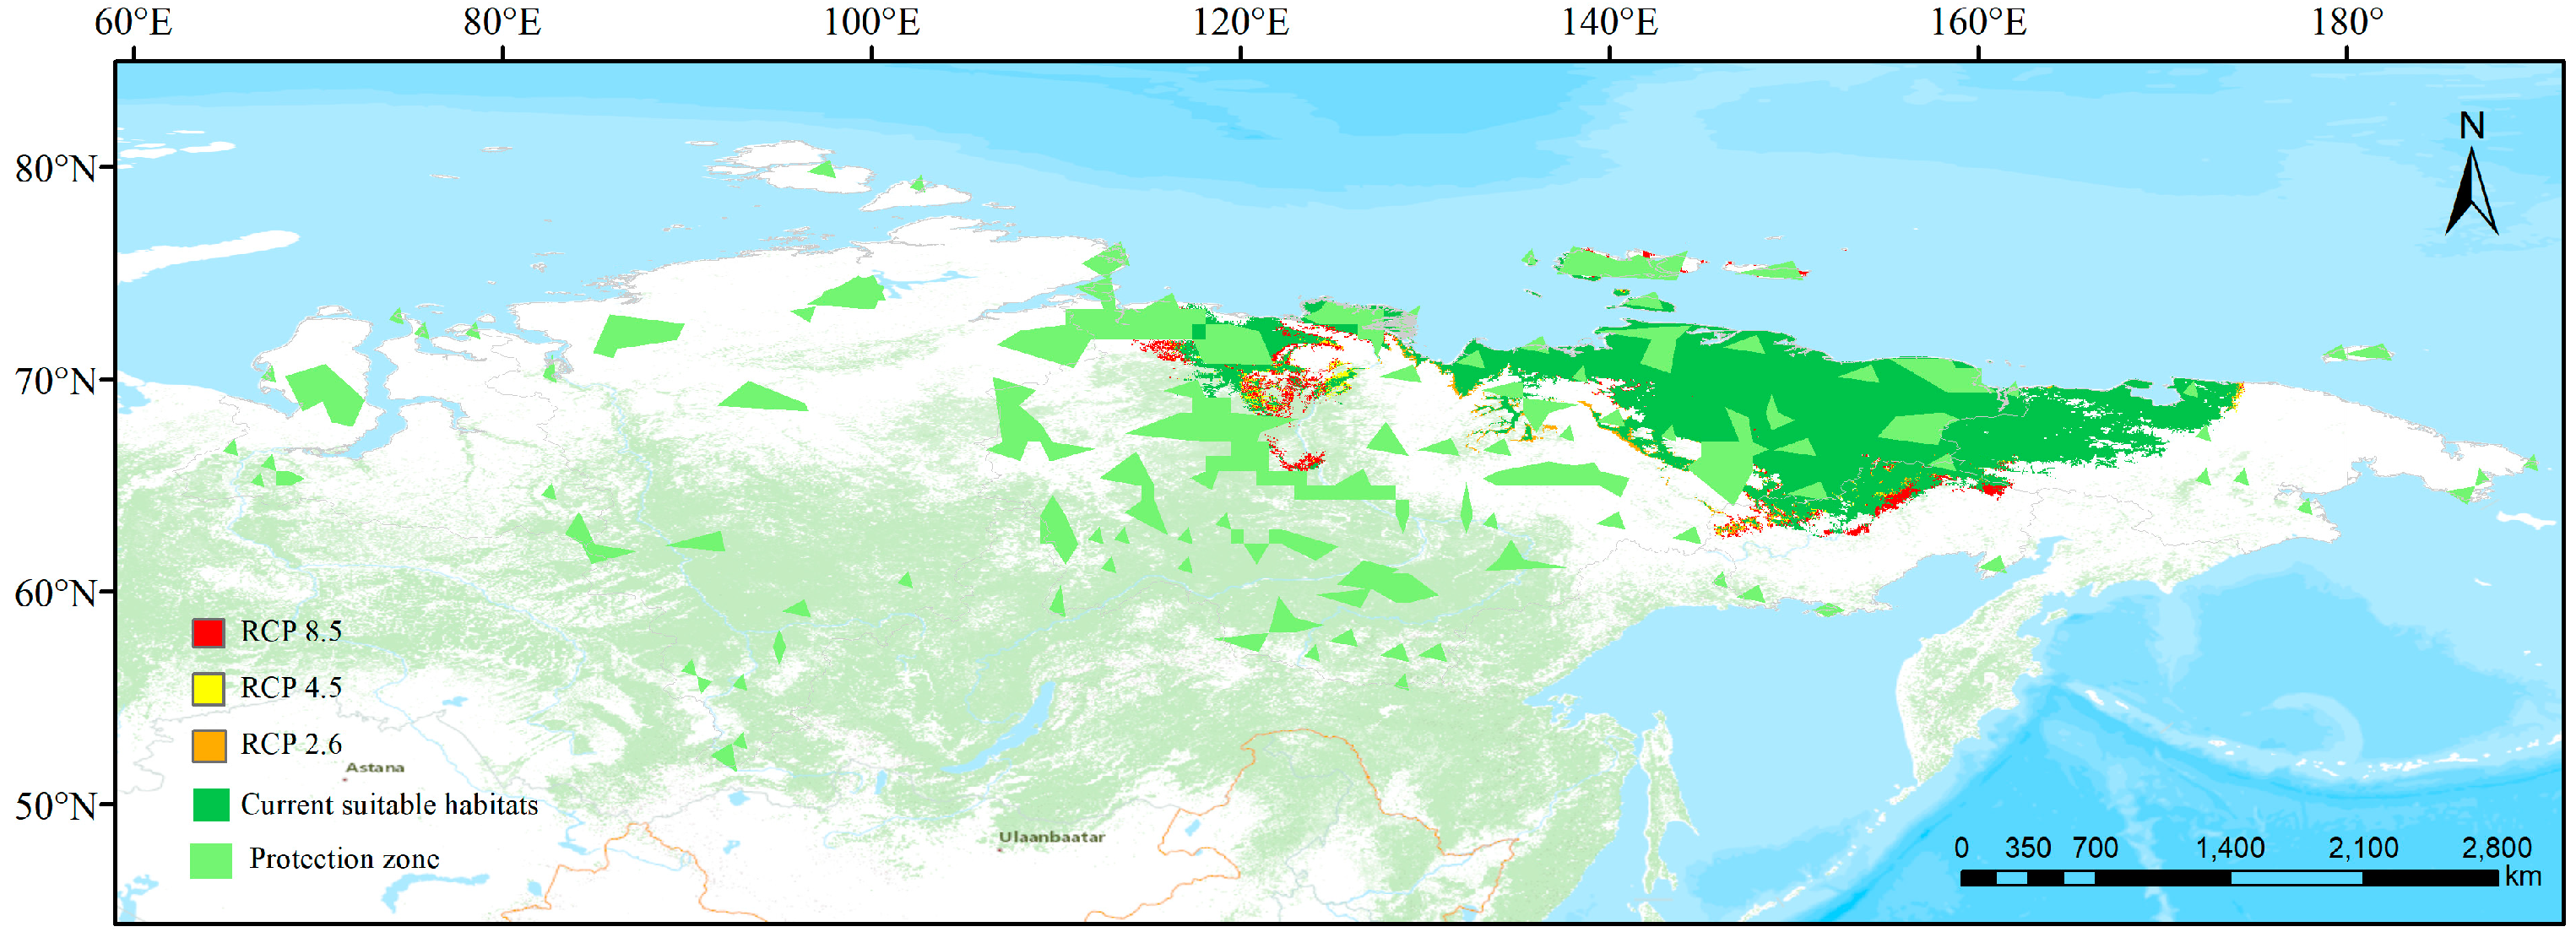
The findings indicate that only 3.22% of the ideal habitat is covered by the existing protected areas; however, over 1,029,386 km2 of optimal habitat is observed outside the conservation boundaries and is therefore threatened (Figure 5; Table 3).
In 2050, the protected area coverage rate for the suitable distribution area of the lesser white-fronted goose under the different scenarios is ordered as RCP8.5 (3.395%) > RCP4.5 (3.242%) > RCP2.6 (2.951%). The protection gaps are mainly concentrated in the northern area of Yakutia (Figure 6; Table 3).
In 2070, the protected area coverage rate for the suitable distribution area of the lesser white-fronted goose under different scenarios is RCP2.6 (3.362%) > RCP4.5 (3.243%) > RCP8.5 (3.132%). The protection gaps are mainly concentrated in the northern area of Yakutia and Magadan Oblast, and effective protection and restoration measures should be taken during protection gaps to avoid further reductions in the suitable habitat for the lesser white-fronted goose (Figure 7; Table 3).

3.5. Comparison between Present and Future Distributions

The findings demonstrate that the entire optimal breeding area for the lesser white-fronted goose will decrease under future climate change relative to the current climate conditions, although the center of the high suitability area will present a limited shift.
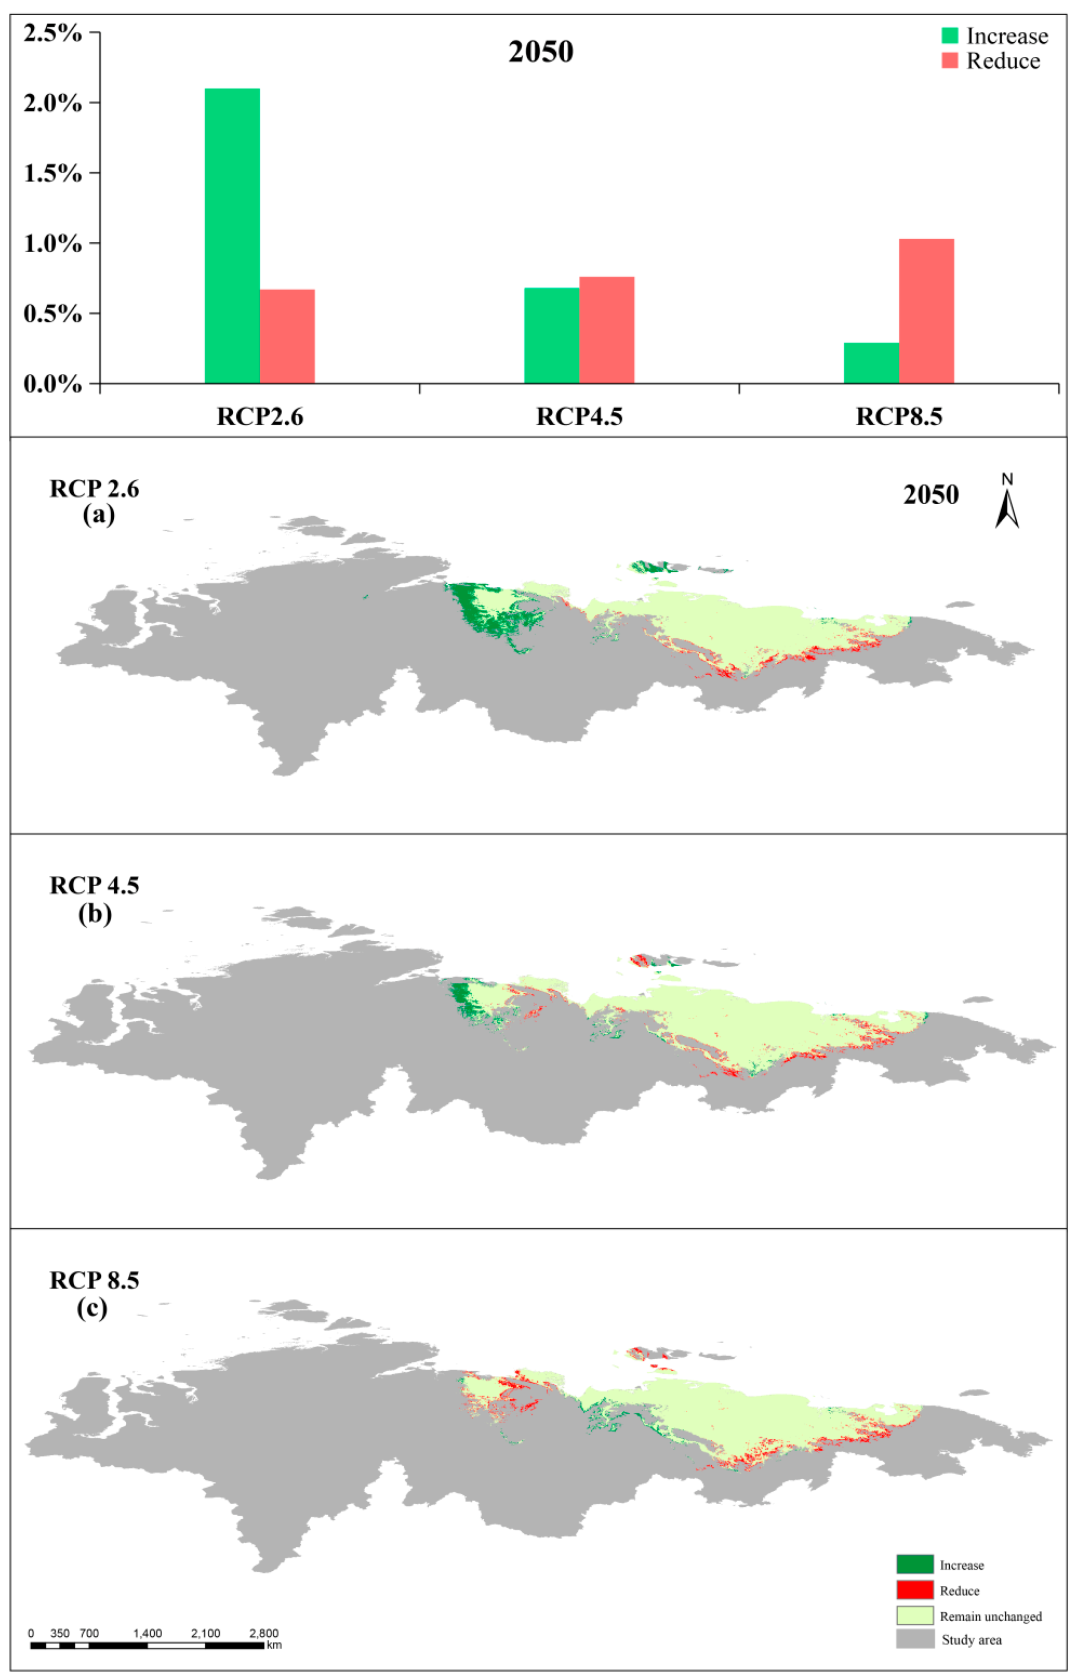
By 2050, according to the results of the binary classification of habitat suitability for lesser white-fronted goose, increases in the area of suitable breeding sites for lesser white-fronted goose will be concentrated in the northern part of the Republic of Yakutia, which is mainly in the southern former suitable habitat region. The greatest increase is observed under the RCP2.6 scenario, and the increased area accounts for 2.10% of the study area. The reduction area is mainly distributed in Krasnoyarsk Kray bordering Yakutia, Russian Federation, and the reduction mainly occurs in the fragmented part of the suitable habitat under the current climatic conditions. The largest reduction is observed in the RCP8.5 scenario, with a reduction of 1.03% of the study area. The reduced area is mainly in the south of the original suitable area; therefore, its future distribution will mainly shift to the north. Under future climate change in terms of temperature and precipitation, the southern range may not represent a suitable breeding ground for the lesser white-fronted goose. If the climate change trend does not change, then the distribution of lesser white-fronted goose breeding grounds will shift northward (Figure 8).
By 2070, the increased areas of suitable breeding sites for the lesser white-fronted goose will mainly be concentrated in the northern region of the Republic of Yakutia and Magadan Oblast around the original suitable habitats. The largest increases are observed in the RCP8.5 scenario, and they account for 1.20% of the study area. The decreased areas are mainly distributed along the border between Krasnoyarsk Kray and Yakutia of the Russian Federation and along the border between Chukotka and Yakutia. The largest reduction is observed under the RCP2.6 scenario, and they account for 0.91% of the study area. Areas west and east of the initial appropriate area primarily account for the reduction in suitable habitat. Therefore, by 2070, the distribution of suitable breeding grounds will continue to move northward (Figure 9).
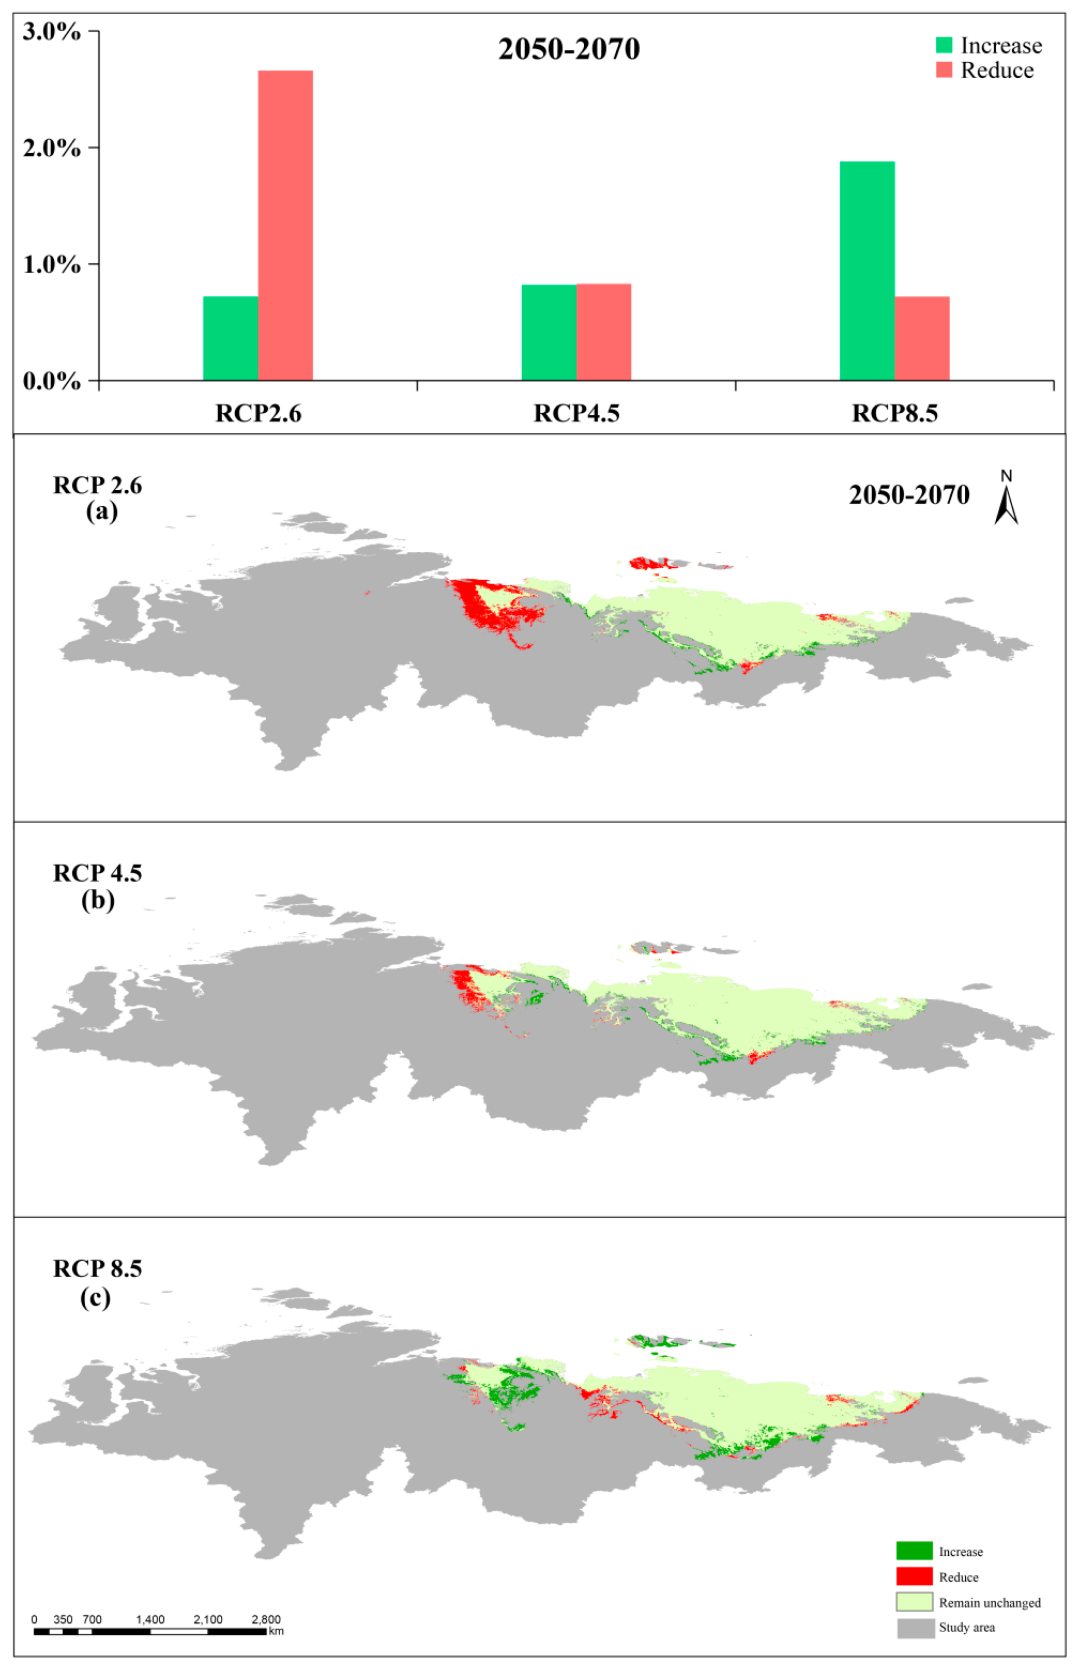
Against the backdrop of future climate change, suitable breeding grounds will continue to move northward. Further comparison of the changes in breeding grounds from 2050 to 2070 shows that under RCP2.6, the suitable distribution area tends to shrink, and the area in the northwest of the Republic of Yakutia is greatly reduced, while under RCP8.5, the appropriate distribution region tends to expand, with significant increases in the northwestern part of the Republic of Yakutia. The reason for these discrepancies may be that in the case of RCP8.5, the sharp increase in greenhouse gas emissions will lead to an increase in global temperature from 1.4 °C to 4.8 °C, and this climate warming will lead to more suitable temperatures for the reproduction and survival of the lesser white-fronted goose, which leads to the expansion of its breeding grounds. This change deserves further attention, especially in the suitable distribution area in the northwestern part of the Republic of Yakutia (Figure 10).

4. Discussion

4.1. Research Innovation and Limitations

Populations of the lesser white-fronted goose have declined rapidly over the past two decades, and it has been classified as a globally vulnerable (VU) species by the IUCN since 1994. There are currently three subspecies of this goose: Fennoscandian (Norway–Kola Peninsula), Mainly Western (Northwestern Russia East White Sea–Tamil Peninsula) and East (Eastern Tamil–Chukotka). The breeding grounds of these populations may be shared and could overlap [24]. As the summer habitat of the eastern species of lesser white-fronted goose is the most remote and has limited accessibility, few historical observations have been performed for the summer retreats of this population [32], and knowledge about the reproductive distribution and conservation rates is unknown [35,36]. In 2021, Tian et al. combined three years of tracking data and historical survey data from 1988 to 2020 to generate the most comprehensive historical distribution points for the eastern population of the lesser white-fronted goose (A. erythropus). Data on the breeding range provide a solid foundation for further studies. Based on the study of Tian et al., we determined the current summer habitat distribution of the eastern population of lesser white-fronted goose using long-term survey distribution sites and the Maxent model [38]. Moreover, we performed a gap analysis to identify habitat change areas and conservation gaps under the current habitat scenario and future carbon emission scenarios. Our model cross-validation results show that both the training and testing AUCs are high (i.e., greater than 0.90) and comparable, indicating that the outputs are highly reliable [57]. Combined with the reliable Maxent model, we predicted a more comprehensive distribution of breeding grounds for the eastern lesser white-fronted goose population under different carbon emission scenarios. Our research indicates that protected area managers should focus on conservation gaps, identify future changes in suitable habitat distribution, and develop timely and effective conservation strategies. Previous studies have shown that the main risk factors for the lesser white-fronted goose include illegal hunting, poisoning, habitat loss, and anthropogenic impacts. A model analysis by Zöckler et al. [27] indicated that the destruction of breeding grounds will continue to affect the lesser white-fronted goose. A comprehensive analysis showed that the contribution of temperature change factors to the distribution of suitable breeding grounds is larger than that of precipitation change factors, and it indicated that global warming will further change the existing habitats. Other goose species have a similar breeding range to the lesser white-fronted goose, including the great white-fronted goose (albino goose), lesser bean goose (fava bean goose), and brent goose (brant white goose), as well as other waterfowl (including ducks and tundra swan). Therefore, the method used in our study can also be generalized to other species and protected areas [58,59,60]. Due to the difficulty of surveying lesser white-fronted goose in the Arctic Circle and the limited data obtained by wearable trackers, the distribution points we used may still be incomplete [35,36]. Future studies should use improved satellite tracking equipment to obtain more summer breeding and molting sites. In addition, our study only focused on the habitat change status of the eastern population of lesser white goose. However, three subspecies of lesser white-fronted goose have been identified, and whether their breeding grounds overlap and whether they have been affected by global warming and human disturbance have not been determined. Future studies can distinguish the habitat overlap and transfer status of the three subspecies under future scenarios.

4.2. Distribution of Future Breeding Grounds and Protection Gaps

Our results show that under the RCP2.6, RCP4.5, and RCP8.5 scenarios for 2050, the proportion of suitable habitats to the total area of the study area expands from 14.50% to 15.84% relative to the current scenario and then decreases to 14.42%. In the case of RCP8.5, the proportion of habitat in the entire study area decreases from 14.50% to 13.76%. In the 2050 scenario, the suitability of bird breeding grounds is lower than in the current scenario. In 2050, under the RCP2.6 and RCP4.5 scenarios, the overall longitude trend of the suitable distribution area moves westward, while under the RCP8.5 scenario, a small eastward trend is observed. In terms of latitude, the changes under different emission scenarios are not consistent, with southward shifts (low latitude) observed under the RCP2.6 and RCP4.5 scenarios and a small northward shift (high latitude) under the RCP8.5 scenario. In 2070, the proportion of the total area of suitable habitat in the study area decreased from the current value of 14.50% to 13.90% and then increased to 14.41%. In the case of RCP8.5, the total area suitable for habitat increased to 14.92%. Thus, in 2070, the suitability of bird breeding grounds will increase. Under the RCP2.6 and RCP4.5 scenarios, the overall longitude trend of the suitable distribution area moves eastward, while under the RCP8.5 scenario, a small westward movement is observed. In terms of latitude, in the RCP2.6 and RCP4.5 scenarios, a shift to the north (high latitudes) is observed, while under the RCP8.5 scenario, a shift to the south (low latitude) is observed. From 2050 to 2070, under the RCP2.6 and RCP4.5 scenarios, an overall eastward longitude trend of suitable distribution area is observed, while under the RCP8.5 scenario, a small trend of westward movement is observed. In terms of latitude, in RCP2.6 and RCP4.5, a shift to the north (high latitudes) is observed, while inRCP8.5, a southward shift (low latitude) is observed. Under the background of future climate change, the different emission scenarios indicate that the small white-fronted goose will present different strategies in terms of their suitable distribution area. The possible reasons for these discrepancies are as follows: (1) the suitable distribution area in the future is relatively fragmented, intermittent, and discontinuous, which increases the difficulty of identifying the centroid position of the suitable distribution area, resulting in errors in the analysis of latitude and longitude changes; (2) different emission scenarios have inconsistent effects on the distribution of lesser white-fronted goose; (3) newly added suitable areas and locations within the distribution area are not fixed; and (4) changes in the suitable habitat distribution of lesser white-fronted goose may also be related to the combined effect of climate and local altitude.
The survey results show that the existing protected areas cover only 3.22% of the ideal habitat; thus, more than 1,029,386 km2 of the optimal habitat is still outside the conservation boundary and under threat. There are two main ways in which climate-induced changes in the habitat area of species occur. First, areas of suitable habitat may shrink within previously larger areas or expand beyond (but still include) previously smaller areas. In this case, long-term management actions need to focus on protecting the species’ continued occupation of habitat by providing climate shelter. Second, even if the size of the habitat remains the same, the habitat may be partially or completely shifted in location. In this case, long-term management actions should focus on promoting dispersal to newly suitable habitats [61]. According to the research results, the climate-induced changes in the habitat area of the lesser white-fronted goose are mainly of the first type; therefore, identifying climate shelters will be beneficial for the protection of the lesser white-fronted goose. In the context of climate change, species climate shelters should be predicted based on niche models while taking into account the scope of existing nature reserves. There is also evidence that protected areas not only protect biodiversity [62] but also provide ecosystem services, such as climate change mitigation [63], and enhance existing protected areas around climate shelters and their linkages to these climate shelters. Thus, regional management can avoid the mass extinction of species [64].
The Maxent model can provide a more comprehensive distribution of breeding sites, and this range can be used to further determine habitat suitability, draw attention to conservation gaps, determine future changes in suitable habitat distribution, and develop timely and effective conservation strategies. The conservation of the lesser white-fronted goose, a critically endangered species, was the most important reason for this study.

4.3. Challenges and Conservation Strategies of Lesser White-fronted Goose

Previous studies have found that the main threats to the population size of the lesser white-fronted goose include the reduction in suitable habitats caused by climate change, phenological mismatches caused by hydrological changes [65], illegal hunting, poisoning, and other disturbances caused by human activities [28], and changes in habitat landscape configuration.
Early studies have shown that climate change is one of the most important factors affecting species distributions in summer habitats, with the most significant effects being changes in temperature and rainfall [66,67,68]. During the wettest season in continental or high-latitude arctic regions, the optimal habitat suitability may be reached when the average summer temperature is 9–14 °C, which represents an important result of earlier studies on the distribution of breeding grounds for lesser white-fronted goose [38]. Our study shows that under a climate scenario with continued carbon emissions in the future (RCP8.5), summer habitat temperatures will increase, and the proportion of suitable habitats for the entire study area in 2050 will decrease from 14.50% to 13.76%. However, the status of summer habitats may be more complicated in the context of climate change.
Many climate models predict higher spring temperatures and earlier snowmelt [69], which will lead to a range of changes, such as flooding and loss of coastal wetlands [70], which will affect breeding grounds. As summer habitats are expected to be concentrated in the lowland coastal zone of the Laptov Sea and East Siberian Sea, the projected sea level rise [69,71] and increased river flow [72] may lead to substantial habitat loss [73]. In addition, tundra plants are an important food source for the lesser white goose, and studies have shown that these birds tend to forage on fresh and tender plants [26]. The changes in plant phenology caused by climate change will lead to mismatches between the arrival time of the lesser white-fronted goose at the breeding grounds and plant growth, which will also affect the individual reproductive success rate and population size of this species [74]. Such issues will affect other migratory waterbirds with a similar breeding range and diet as the lesser white-fronted goose, such as white-fronted, grey, and swan geese and the tundra swan.
Our results also show that in 2070, under the RCP8.5 scenario, the suitability of bird breeding grounds will increase, with the proportion of total area of suitable habitats in the study area increasing to 14.92%. However, this may not be a cause for optimism. Under the continued climate warming scenario, the summer habitat of the eastern population of lesser white goose may face more human disturbance. Russia has established 13,000 nature reserves of various types that cover an area of 600,000 square kilometers, accounting for 2.91% of Russia’s total land area. The land area is approximately 1.96 million square kilometers, accounting for 11.4% of the total land area of Russia. However, according to the current protected area plan, the existing protected area only covers 0.467% of the suitable habitat area of lesser white-fronted goose, while more than 1,058,695 km2 of optimal habitat remains outside the protection boundary and is threatened. Shipping and port development in the tundra habitat could further devastate the habitat of the lesser white-fronted goose in the Arctic Circle.
The coverage of protected areas is insufficient, and Russian protected areas are also faced with overlapping protected areas and overlapping functions. Among the various nature reserves that have been established in Russia, there are 301 special nature reserves at the federal level, including 103 national nature reserves, 50 national parks, and 64 national reserves [75]. Russia has 10 World Natural Heritage Sites, 44 Biosphere Reserves, and 35 Wetlands of International Importance. However, these protected areas established under international conventions have not been established independently but rather overlap and intersect with various existing nature reserves [76], which may lead to insufficient management and protection allocation. Therefore, in the future, according to the suitable distribution areas of some important protected species, the protection range can be appropriately increased to reduce the threat of human interference to endangered species and complete the development of nature reserves. The task of conserving biodiversity and maintaining the natural state of natural ecosystems and their targets must be emphasized.

5. Conclusions

In this paper, climate data and satellite tracking data were input into the Maxent model to forecast the habitat suitability of lesser white-fronted goose in the Siberian region using associated occurrence records and environmental factors. Under the future climate emission scenario, the suitable habitat area will be reduced, compared with the current conditions and concentrated in the core area. These findings may worsen if urban expansion and frequent human activities are not given sufficient attention.
The study’s findings show that the suitable distribution area covered by existing protected areas is small, thus indicating that the conservation gap is still large. To achieve certain conservation goals, protected areas need to be increased from the original base. The land use types in the preferred area are mainly forest land, arable land, and water bodies, and relatively few buildings are observed; therefore, the cost of establishing nature reserves will be relatively low. Combined with the current nature reserves, the protection of migratory birds requires the establishment of additional nature reserves and must consider the species and growth cycle of plants in the reserve to establish a scientific and optimal protection system.
Our findings help provide a better understanding of the distribution of lesser white-fronted goose and the future conservation of this bird. Conservation planning should be based on specific ecological information [77]. The results suggest that the risk of habitat degradation and decline may increase under climate change scenarios because future climate may present rapid warming and disruptive events [78]. The results of various observations and model projections confirm that climate change has an important influence on the distribution of birds, which is shifting to higher heights or latitudes, and the range of most birds will be further reduced. On this basis, targeted conservation plans should be developed to reduce the possibility of climate-change-induced decreases in the population of lesser white-fronted goose, which show a greater preference for natural habitats to agricultural lands compared to other waterbirds. Therefore, management for reasonable plant abundance and proper land use will lower the possibility of changes in plant distribution and permit the steady long-term growth of lesser white-fronted goose in the face of climate change. Our predictions can help protect the summer habitat of the lesser white-fronted goose in the future and could be used to assess the ecological impact of global warming on polar breeding species.

Supplementary Materials

The following supporting information can be downloaded at: https://www.mdpi.com/article/10.3390/land11111946/s1, Table S1: Datapoints for the modelling of the summer range of East Asian lesser white-fronted goose. References [79,80,81] are cited in the supplementary materials.

Author Contributions

Conceptualization, R.F. and E.W.; methodology, R.F.; software, R.F.; validation, R.F., E.W. and J.L.; formal analysis, R.F.; investigation, J.L.; resources, J.L.; data curation, R.F.; writing—original draft preparation, R.F.; writing—review and editing, R.F., E.W., J.L., Q.Z. and G.L.; visualization, R.F.; supervision, C.L.; project administration, C.L.; funding acquisition, C.L. and Y.J. All authors have read and agreed to the published version of the manuscript.

Funding

This research was funded by National Natural Science Foundation of China (No. 31971400) and the National Key Research and Development Program of China (No. 2017YFC0405303). We wish to thank the Fundamental Research Funds for the Central Universities (No. BLX202144).

Conflicts of Interest

The authors declare no conflict of interest.

References

  1. Liu, J.; Wang, E.; Sun, R. Climate adaptation of metabolic heat production in four small bird species in China. J. Zool. 2005, 51, 24–30. [Google Scholar]
  2. Shi, J.; Li, D.; Xiao, W. The impact of climate change on birds: The significance of long-term research. Zool. Res. 2006, 27, 637–646. [Google Scholar]
  3. Li, T.; Ma, Z.; Qiang, W.; Liu, H.; Tang, D.; Ying, W.; Zhou, X. Impacts of Climate Change on Waterbirds and Their Responses. Chin. J. Wildl. 2017, 38, 529–534. [Google Scholar]
  4. Beale, C.M.; Baker, N.E.; Brewer, M.J.; Lennon, J.J. Protected area networks and savannah bird biodiversity in the face of climate change and land degradation. Ecol. Lett. 2013, 16, 1061–1068. [Google Scholar] [CrossRef]
  5. Sorte, F.A.L.; Iii, F.R.T. Poleward shifts in winter ranges of north american birds. Ecology 2007, 88, 1803–1812. [Google Scholar] [CrossRef]
  6. Steen, V.; Powell, A.N. Potential Effects of Climate Change on the Distribution of Waterbirds in the Prairie Pothole Region, U.S.A. Waterbirds 2012, 35, 217–229. [Google Scholar] [CrossRef]
  7. Zhi-Ying, O.U. Progress in Studies on Plant Responses to Elevated CO2. J. Trop. Subtrop. Bot. 2003, 11, 190–196. [Google Scholar]
  8. Bai, J.H.; Ouyang, H.; Yang, Z.F.; Cui, B.S.; Cui, L.J.; Wang, Q.J. Changes in Wetland Landscape Patterns: A Review. Prog. Geogr. 2005, 24, 36–45. [Google Scholar]
  9. Bellisario, B.; Cerfolli, F.; Nascetti, G. Climate effects on the distribution of wetland habitats and connectivity in networks of migratory waterbirds. Acta Oecol. 2014, 58, 5–11. [Google Scholar] [CrossRef]
  10. Stralberg, D.; Bayne, E.M.; Cumming, S.G.; Sólymos, P.; Song, S.J.; Schmiegelow, F.K. Conservation of future boreal forest bird communities considering lags in vegetation response to climate change: A modified refugia approach. Divers. Distrib. 2015, 21, 1112–1128. [Google Scholar] [CrossRef]
  11. Prince, Z. Climate change in our backyards: The reshuffling of North America’s winter bird communities. Glob. Chang. Biol. 2015, 21, 572–585. [Google Scholar] [CrossRef] [PubMed]
  12. Parmesan, C.; Yohe, G. A globally coherent fingerprint of climate change impacts across natural systems. Nature 2003, 421, 37–42. [Google Scholar] [CrossRef] [PubMed]
  13. Austin, G.E.; Rehfisch, M.M. Shifting nonbreeding distributions of migratory fauna in relation to climatic change. Glob. Chang. Biol. 2005, 11, 31–38. [Google Scholar] [CrossRef]
  14. Visser, M.E.; Perdeck, A.C.; van Balen, J.H.; Both, C. Climate change leads to decreasing bird migration distances. Glob. Chang. Biol. 2009, 15, 1859–1865. [Google Scholar] [CrossRef] [Green Version]
  15. Thomas, C.D.; Lennon, J.J. Birds extend their ranges northwards. Nature 1999, 399, 213. [Google Scholar] [CrossRef]
  16. Brommer, J.E. Extent of recent polewards range margin shifts in Finnish birds depends on their body mass and feeding ecology. Ornis Fenn. 2008, 85, 109–117. [Google Scholar]
  17. Peterson, A.T. Projected climate change effects on Rocky Mountain and Great Plains birds: Generalities of biodiversity consequences. Glob. Chang. Biol. 2003, 9, 647–655. [Google Scholar] [CrossRef]
  18. Virkkala, R.; Heikkinen, R.K.; Leikola, N.; Luoto, M. Projected large-scale range reductions of northern-boreal land bird species due to climate change. Biol. Conserv. 2008, 141, 1343–1353. [Google Scholar] [CrossRef]
  19. Doswald, N. Potential Effects of Climate Change on the Distribution and Migration of European Breeding Migratory Birds; Durham University: Durham, UK, 2009. [Google Scholar]
  20. Hu, J.; Hu, H.; Jiang, Z. The impacts of climate change on the wintering distribution of an endangered migratory bird. Oecologia 2010, 164, 555–565. [Google Scholar] [CrossRef]
  21. Maggini, R.; Lehmann, A.; Kery, M.; Schmid, H.; Beniston, M.; Jenni, L.; Zbinden, N. Are Swiss birds tracking climate change? Detecting elevation shifts using response curve shapes. Ecol. Model. 2011, 222, 21–32. [Google Scholar] [CrossRef] [Green Version]
  22. Buermann, W.; Chaves, J.; Dudley, R.; Mcguire, J.A.; Smith, T.; Altshuler, D.L. Projected changes in elevational distributionand flight performance of montane Neotropical hummingbirdsin response to climate change. Glob. Chang. Biol. 2011, 17, 1671–1680. [Google Scholar] [CrossRef]
  23. Pavel, S.T. List of wader species of Chukchi, northern far east of Russia: Their banding and migratory links. Stilt 2003, 44, 29–43. [Google Scholar]
  24. Jones, T.; Martin, K.; Barov, B.; Nagy, S. International single species action plan for the conservation of the Western Palearctic population of the Lesser White-fronted Goose Anser erythropus. J. AEWA Tech. Ser. 2008, 36, 1–130. [Google Scholar]
  25. BirdLife International. Anser Erythropus. The IUCN Red List of Threatened Species 2018: E.T 22679886A132300164. 2018. Available online: https://www.iucnredlist.org/species/22679886/132300164 (accessed on 21 May 2022).
  26. Guan, L. Effects of Changing Hydrological Conditions on Food Resources and Distribution of Geese in Dongting Lake; Beijing Forestry University: Beijing, China, 2015. [Google Scholar]
  27. Lysenko, I.; Zöckler, C. Water Birds on the Edge: First Circumpolar Assessment of Climate Chage Impact of Arctic Breeding Water Birds; WCMC Biodiversity Series; World Conservation Monitoring Center: Cambridge, UK, 2000; pp. 44–60. [Google Scholar]
  28. Lei, J. Response of Migratory Geese to Habitat Change and Conservation Management Measures in East Asia-Australasia; Beijing Forestry University: Beijing, China, 2019. [Google Scholar]
  29. Wang, X.; Fox, A.D.; Cong, P.; Barter, M.; Cao, L. Changes in the distribution and abundance of wintering Lesser White-fronted Geese Anser erythropus in eastern China. Bird Conserv. Int. 2012, 22, 128–134. [Google Scholar] [CrossRef] [Green Version]
  30. Moriguchi, S.; Amano, T.; Ushiyama, K. Creating a potential distribution map for Greater White-fronted Geese wintering in Japan. Ornithol. Sci. 2013, 12, 117–125. [Google Scholar] [CrossRef]
  31. Li, X.; Si, Y.; Ji, L.; Gong, P. Dynamic response of East Asian Greater White-fronted Geese to changes of environment during migration: Use of multi-temporal species distribution model. Ecol. Model. 2017, 360, 70–79. [Google Scholar] [CrossRef]
  32. Ruokonen, M.; Kvist, L.; Aarvak, T.; Markkola, J.; Morozov, V.V.; Øien, I.J.; Syroechkovsky, E.E.; Tolvanen, P.; Lumme, J. Population Genetic Structure and Conservation of the Lesser White-Fronted Goose Anser erythropus. Conserv. Genet. 2004, 5, 501–512. [Google Scholar] [CrossRef] [Green Version]
  33. Morozov, V.V. Status, distribution and trends of the lesser white-fronted goose (Anser erythropus) population in Russia. Bull. Goose Study Group East. Eur. North. Asia 1995, 1, 131–144, (In Russian with English summary). [Google Scholar]
  34. Morozov, V.; Syroechkovski, E., Jr. Lesser White-fronted Goose on the verge of the Millenium. Casarca 2002, 8, 233–276, (In Russian with English summary). [Google Scholar]
  35. Egorov, N.; Okhlopkov, I. New data on nesting of the white-fronted goose (Anser erythropus) from Yakutia. Zool. Zhurnal 2007, 86, 1482–1485, (In Russian with English summary). [Google Scholar]
  36. Solovieva, D.; Sergey, V. Lesser White-Fronted Goose Anser erythropus: Good news about the breeding population in west Chukotka, Russia. Wildfowl 2011, 61, 110–120. [Google Scholar]
  37. Degtyarev, A.G.; Perfilyev, V.I. The Lesser White-fronted Goose (Anser erythropus) in Yakutia. Casarca 1996, 2, 113–124. [Google Scholar]
  38. Tian, H.; Solovyeva, D.; Danilo, V.G.; Vartanyan, S.; Wen, L.; Lei, J.; Zeng, Q. Combining modern tracking data and historical records improves understanding of the summer habitats of the Eastern Lesser White-fronted Goose Anser erythropus. Ecol. Evol. 2021, 11, 4126–4139. [Google Scholar] [CrossRef]
  39. Zwaan, D.R.D.; Scridel, D.; Altamirano, T.A.; Gokhale, P.; Kumar, R.S.; Sevillano-Ríos, S.; Barras, A.G.; Arredondo-Amezcua, L.; Asefa, A.; Carrillo, R.A.; et al. GABB: A global dataset of alpine breeding birds and their ecological traits. Sci. Data 2022, 9, 627. [Google Scholar] [CrossRef]
  40. Marchant, J.H.; Musgrove, A.J. Review of European flyways of the Lesser White-fronted Goose Anser erythropus; BTO Research Report; BTO: Nieuwegein, The Netherlands, 2011. [Google Scholar]
  41. Artiukhov, A.I.; Syroechkovski, E.E., Jr. New data on distribution of Lesser White-fronted Goose in the Abyi Lowland (Eastern Yakutia). Casarka 1999, 5, 136–143, (In Russian with English summary). [Google Scholar]
  42. Tian, Z.; Jiang, D. Analysis of climate simulation capability of CCSM4 for East Asia and China with different resolutions. Atmos. Sci. 2013, 37, 171–186. [Google Scholar]
  43. Vuuren, D.; Stehfest, E.; Elzen, M.; Kram, T.; van Vliet, J.; Deetman, S.; van Ruijven, B. RCP2.6: Exploring the possibility to keep global mean temperature increase below 2 °C. Clim. Chang. 2011, 109, 95. [Google Scholar] [CrossRef]
  44. Clarke, L.E.; Edmonds, J.A.; Jacoby, H.D.; Pitcher, H.; Reilly, J.; Richels, R. Scenarios of Greenhouse Gas Emissions and Atmospheric Concentrations; U.S. Climate Change Science Program: Washington, DC, USA, 2007; Volume 2, pp. 64–81. [Google Scholar]
  45. Aaheim, A.; Godal, F.O. Special Issue: Multi-Greenhouse Gas Mitigation and Climate Policy Costs Savings of a Flexible Multi-Gas Climate Policy. Energy J. 2006, 27, 485–501. [Google Scholar]
  46. Wise, M.; Calvin, K.; Thomson, A.; Clarke, L.; Bond-Lamberty, B.; Sands, R.; Smith, S.J.; Janetos, A.; Edmonds, J. Implications of Limiting CO2 Concentrations for Land Use and Energy. Science 2009, 324, 1183–1186. [Google Scholar] [CrossRef]
  47. Fujino, J.; Nair, R.; Kainuma, M.; Masui, T.; Matsuoka, Y. Multi-gas Mitigation Analysis on Stabilization Scenarios Using Aim Global Model. Energy J. 2006, 27, 343–353. [Google Scholar] [CrossRef]
  48. Hijioka, Y.; Matsuoka, Y.; Nishimoto, H.; Masui, T. Global GHG Emission Scenarios under GHG Concentration Stabilization Targets. J. Glob. Environ. Eng. 2008, 13, 97–108. [Google Scholar]
  49. Riahi, K.; Grübler, A.; Nakicenovic, N. Scenarios of long-term socio-economic and environmental development under climate stabilization. Technol. Forecast Soc. Chang. 2007, 74, 887–935. [Google Scholar] [CrossRef]
  50. Phillips, S.J.; Anderson, R.P.; Schapire, R.E. Maximum entropy modeling of species geographic distributions. Ecol. Model. 2006, 190, 231–259. [Google Scholar] [CrossRef] [Green Version]
  51. Wang, Y.S.; Xie, B.Y.; Wan, F.H.; Xiao, Q.; Dai, L. Application of ROC curve analysis in evaluating the performance of alien species’ potential distribution models. Biodiv. Sci. 2007, 15, 365–372. [Google Scholar] [CrossRef]
  52. Rong, L.I.; Jiao, Y.M.; Liu, X.; Yuan, I.O. Suitability evaluation and corridor design of habitats for Green Peafowl based on MaxEnt Model. Chin. J. Ecol. 2019, 38, 919–926. [Google Scholar]
  53. Jennings, M.D. Gap analysis: Concepts, methods, and recent results. Landsc. Ecol. 2000, 15, 5–20. [Google Scholar] [CrossRef]
  54. Liu, J.; Lü, X. Study on the spatial pattern of wetland bird richness and hotspots in Sanjiang Plain. Acta Ecol. Sin. 2011, 31, 5894–5902. [Google Scholar]
  55. Xiao, H.; Zhao, J.; Jiang, F.; Zeng, H.; Ecology, D.O.; Sciences, C. GAP Analysis and Regional Biodiversity Conservation. Acta Sci. Nat. Univ. Pekin. 2006, 42, 153. [Google Scholar]
  56. Rodrigues, A.; Akçakaya, H.R.; Andelman, S.J.; Bakarr, M.I.; Boitani, L.; Brooks, T.M.; Yan, X. Global gap analysis: Priority regions for expanding the global protected-area network. BioScience 2004, 54, 1092–1100. [Google Scholar] [CrossRef]
  57. Phillips, S.J.; Dudík, M.; Schapire, R.E. Maxent Software for Modeling Species Niches and Distributions. 2006. Available online: https://biodiversityinformatics.amnh.org/open_source/maxent/ (accessed on 25 October 2022).
  58. Hodges, J.I.; Eldridge, W.D. Aerial surveys of eiders and other waterbirds on the eastern Arctic coast of Russia. Wildfowl 2001, 52, 127–142. [Google Scholar]
  59. Krechmar, A.; Kondratiev, A. Anseriformes of Northeast Asia; North-Eastern Scientific Centre, Far-Eastern Branch of the Russian Academy of Sciences: Magadan, Russia, 2006. [Google Scholar]
  60. Pozdnyakov, V.I. Status and breeding ecology of Bewick’s swans in the Lena Delta, Yakutia, Northern Asia. Waterbirds 2002, 25, 95–99. [Google Scholar]
  61. Yasue, M. The Breeding Ecology and Potential Impacts of Habitat Change on the Malaysian Plover Charadrius Peronii in the Gulf of Thailand; University of Victoria (Canada): Victoria, BC, Canada, 2007. [Google Scholar]
  62. Bruner, A.G.; Gullison, R.E.; Rice, R.E.; Fonseca, G.A.B. Effectiveness of parks in protecting tropical biodiversity. Science 2001, 291, 125–128. [Google Scholar] [CrossRef] [PubMed]
  63. Soares-Filhoa, B.; Moutinhob, P.; Nepstadb, D.; Anderson, A.; Rodrigues, H.; Garcia, R.; Maretti, C. Role of Brazilian Amazon protected areas in climate change mitigation. Proc. Natl. Acad. Sci. USA 2010, 107, 10821–10826. [Google Scholar] [CrossRef] [PubMed] [Green Version]
  64. Garden, J.G.; O’Donnell, T.; Catterall, C.P. Changing habitat areas and static reserves: Challenges to species protection under climate change. Landsc. Ecol. 2015, 30, 1959–1973. [Google Scholar] [CrossRef]
  65. Guan, L.; Lei, J.; Zuo, A.; Zhang, H.; Lei, G.; Wen, L. Optimizing the timing of water level recession for conservation of wintering geese in Dongting Lake, China. Ecol. Eng. J. Ecotechnol. 2016, 88, 90–98. [Google Scholar] [CrossRef]
  66. Gaston, K.J. The Structure and Dynamics of Geographic Ranges; Oxford University Press on Demand: Oxford, UK, 2003. [Google Scholar]
  67. Pasquale, G.D.; Saracino, A.; Bosso, L.; Russo, D.; Moroni, A.; Bonanomi, G.; Allevato, E. Coastal Pine-Oak glacial refugia in the Mediterranean basin: A biogeographic approach based on charcoal analysis and spatial modelling. Forests 2020, 11, 673. [Google Scholar] [CrossRef]
  68. Zhang, Z.; Xu, S.; Capinha, C.; Weterings, R.; Gao, T. Using species distribution model to predict the impact of climate change on the potential distribution of Japanese whiting Sillago japonica. Ecol. Indic. 2019, 104, 33–340. [Google Scholar] [CrossRef]
  69. IPCC. Climate Change 2013: The Physical Science Basis: Working Group I Contribution to the Fifth Assessment Report of the Intergovernmental Panel on Climate Change; Cambridge University Press: Cambridge, UK, 2014. [Google Scholar]
  70. Prowse, T.D.; Wrona, F.J.; Reist, J.D.; Hobbie, J.E.; Lévesque, L.M.; Vincent, W.F. General features of the Arctic relevant to climate change in freshwater ecosystems. AMBIO A J. Hum. Environ. 2006, 35, 330–338. [Google Scholar] [CrossRef] [Green Version]
  71. Wrona, F.J.; Johansson, M.; Culp, J.M.; Jenkins, A.; Mård, J.; Myers-Smith, I.H.; Prowse, T.D.; Vincent, W.F.; Wookey, P.A. Transitions in Arctic ecosystems: Ecological implications of a changing hydrological regime. J. Geophys. Res. Biogeosci. 2016, 121, 650–674. [Google Scholar] [CrossRef] [Green Version]
  72. Karlsson, J.M.; Lyon, S.W.; Destouni, G. Thermokarst lake, hydrological flow and water balance indicators of permafrost change in Western Siberia. J. Hydrol. 2012, 464–465, 459–466. [Google Scholar] [CrossRef]
  73. Merow, C.; Allen, J.M.; Aiello-Lammens, M.; Silander, J.A., Jr. Improving niche and range estimates with Maxent and point process models by integrating spatially explicit information. Glob. Ecol. Biogeogr. 2016, 25, 1022–1036. [Google Scholar] [CrossRef]
  74. Lei, J.; Jia, Y.; Wang, Y.; Lei, G.; Lu, C.; Saintilan, N.; Wen, L. Behavioural plasticity and trophic niche shift: How wintering geese respond to habitat alteration. Freshw. Biol. 2019, 64, 1183–1195. [Google Scholar] [CrossRef]
  75. Government of the Russian Federation. Environmental Protection Report of the Russian Federation [EB/OL]. Available online: http://www.mnr.gov.ru/regulatory/list.php?part=1101 (accessed on 1 August 2018).
  76. Yu, Y.; Persherev; Wang, F. Russia’s ecological protection framework: System of special nature reserves. Wildlife 2007, 28, 39–41. [Google Scholar]
  77. Ellis, C.J. Lichen epiphyte diversity: A species, community and traitbased review. Perspect. Plant Ecol. Evol. Syst. 2012, 14, 131–152. [Google Scholar] [CrossRef]
  78. Yi, Y.J.; Cheng, X.; Yang, Z.F.; Zhang, S. Maxent modeling for predicting the potential distribution of endangered medicinal plant (H. riparia lour) in Yunnan, China. Ecol. Eng. 2016, 92, 260–269. [Google Scholar] [CrossRef]
  79. Degtyaryev, V.G.; Sleptsov, S.M.; Pshennikov, A.E. Piscivory in eastern population of Siberian Crane (Grus leucogeranus). Zool. Zhurnal 2013, 92, 588. [Google Scholar] [CrossRef]
  80. Bysykatova, I.P.; Krapu, G.L.; Germogenov, N.I.; Buhl, D.A. Distribution, Densities, and Ecology of Siberian Cranes in the Khroma River Region of Northern Yakutia in Northeastern Russia. 2016. Available online: chrome-extension://oemmndcbldboiebfnladdacbdfmadadm/https://digitalcommons.unl.edu/cgi/viewcontent.cgi?article=1377&context=nacwgproc (accessed on 25 October 2022).
  81. Andreev, A. Summary of Wetlands International Asian Waterfowl Census results for Perennou et al. 1994. Unpublished. [Google Scholar]
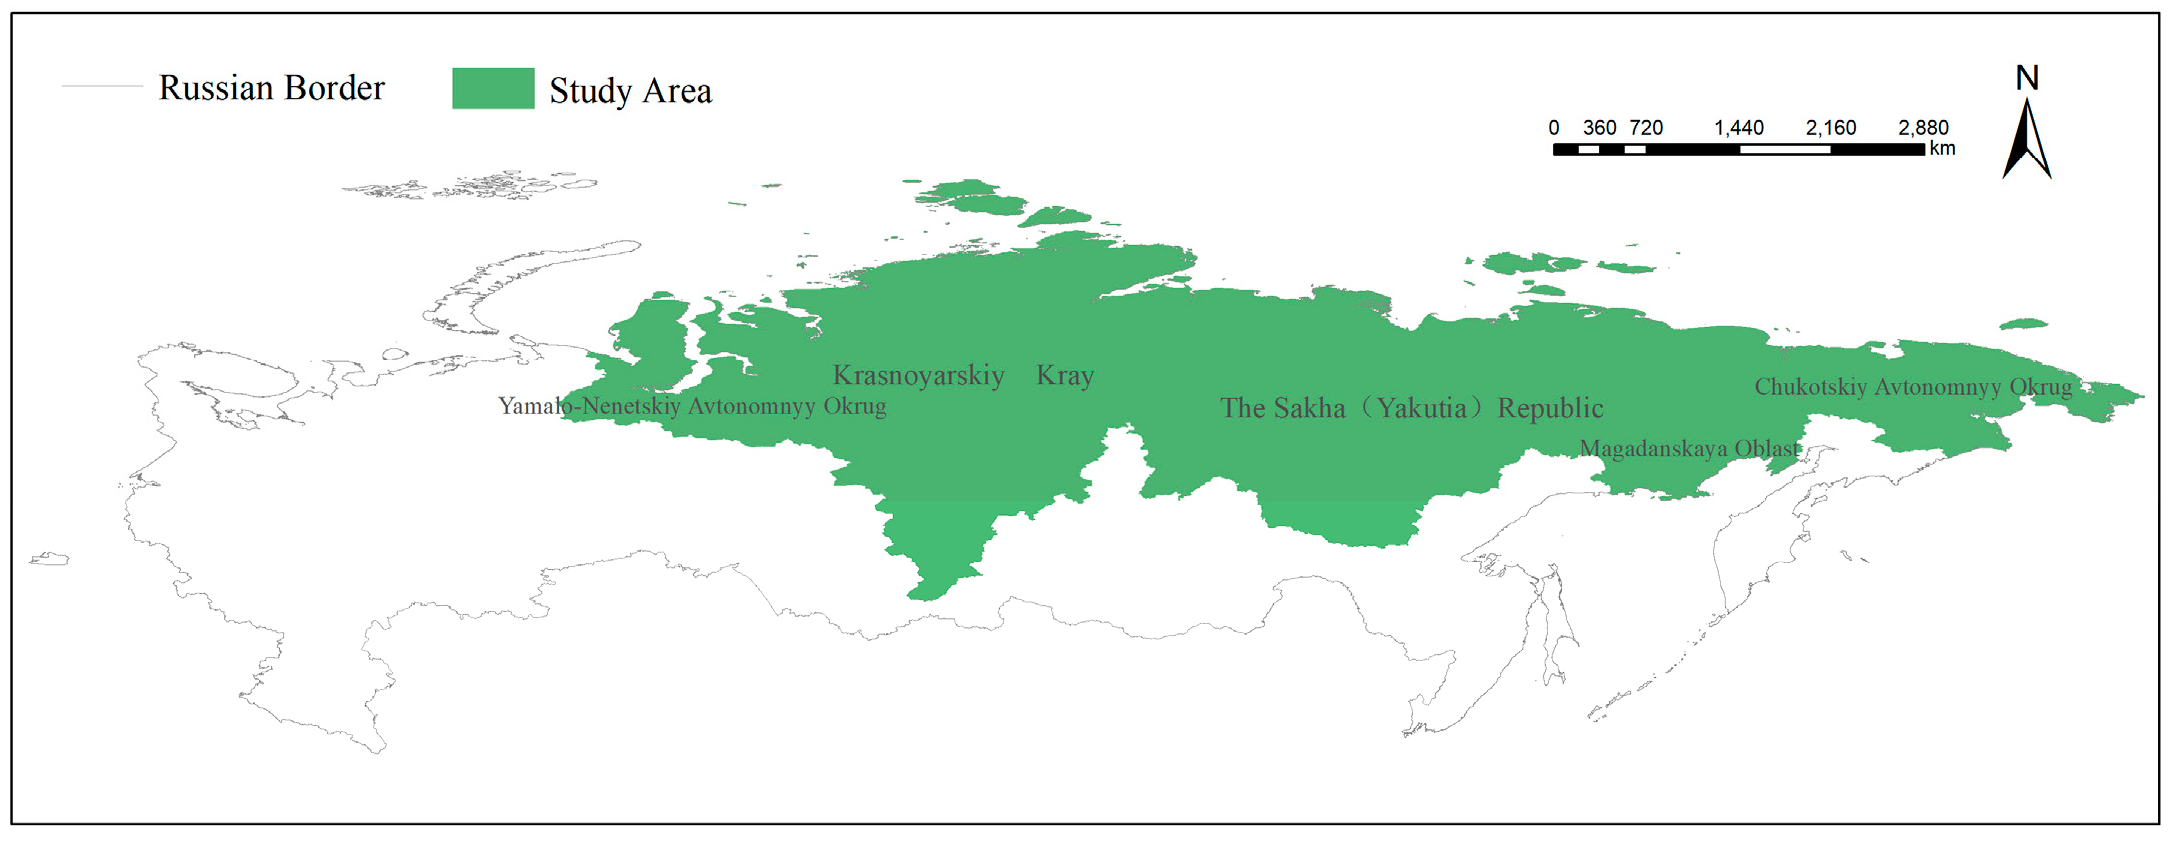
Figure 1. Study area in Siberia, Russia (Yamal-Nenets Autonomous Okrug, Krasnoyarsk Kray, Yakutia, Magadan Oblast, and Chukotka Autonomous Okrug).
Land 11 01946 g001
Figure 2. Distribution point data for lesser white-fronted goose obtained by satellite tracking and field verification in the study area.
Land 11 01946 g002
Figure 3. Distribution of appropriate habitat and breeding sites for lesser white-fronted goose in 2050 under (a) current conditions, (b) RCP2.6, (c) RCP4.5, and (d) RCP8.5.
Land 11 01946 g003
Figure 4. Distribution of appropriate habitat and breeding sites for lesser white-fronted goose in 2070 under current conditions, (a) RCP2.6, (b) RCP4.5, and (c) RCP8.5.
Land 11 01946 g004
Figure 5. Protection gaps. The existing protected areas are overlaid with the current suitable distribution areas for the conservation vacancy analysis, and the remaining dark green part represents areas that are not under conservation management.
Land 11 01946 g005
Figure 6. Conservation gaps under different climate scenarios in 2050: red indicates the protection gaps in the case of RCP2.6; yellow represents the protection gaps in the case of RCP4.5; and orange represents the protection gaps in the case of RCP8.5.
Land 11 01946 g006
Figure 7. Conservation gaps under different climate scenarios in 2070: red indicates the protection gaps in the case of RCP2.6; yellow represents the protection gaps in the case of RCP4.5; and orange represents the protection gaps in the case of RCP8.5.
Land 11 01946 g007
Figure 8. Increases and decreases in suitable breeding sites for lesser white-fronted goose under different climate change scenarios in 2050: (a) 2.10% increase and 0.67% decrease under the RCP2.6 scenario; (b) 0.68% increase and 0.76% decrease under the RCP4.5 scenario; and (c) 0.29% increase and 1.03% decrease under the RCP8.5 scenario. Red indicates the decreased area, and green represents the increased area.
Land 11 01946 g008
Figure 9. Increases and decreases in suitable breeding sites for lesser white-fronted goose under different climate change scenarios in 2070: (a) 0.31% increase and 0.91% decrease under the RCP2.6 scenario; (b) 0.48% increase and 0.57% decrease under the RCP4.5 scenario; and (c) 1.20% increase and 0.78% decrease under the RCP8.5 scenario. Red represents the decreased area, and green represents the increased area.
Land 11 01946 g009
Figure 10. Increases and decreases in suitable breeding sites for lesser white-fronted goose under various climate change scenarios between 2050 and 2070: (a) 0.72% increase and 2.66% decrease under the RCP2.6 scenario; (b) 0.82% increase and 0.83% decrease under the RCP4.5 scenario; and (c) 1.88% increase and 0.72% decrease under the RCP8.5 scenario. Red represents the decreased area, and green represents the increased area.
Land 11 01946 g010
Table 1. Summary of 11 tagged lesser white-fronted geese used for this study (including the wintering, summer, and migration periods).
IDMark TimeReceipt DateTerminus ad QuemTracking Time (Date)Number of Times of Summer Observations
BFUL04120 November 201623 November 201616 April 20185091
BFUL04430 November 20162 December 20169 June 20185541
BFUL05025 November 201627 November 201619 May 20185381
BFUL05730 November 20162 December 201617 July 20185921
BFUL05930 November 20162 December 201629 December 20173921
BFUL0655 December 20167 December 20165 September 20172721
BFUL06815 December 201616 December 201628 May 20185281
BFUL05125 November 201628 November 201625 December20187572
BFUL06130 November 20162 December 201612 May 20198912
BFUL07415 January 201719 January 201714 May 20198452
BFUL0628 December 201611 December 201627 November 201710813
Table 2. Nineteen global climate variables.
NumberTypeVariableUnits
Bio1BioclimaticAnnual Mean Temperature°C
Bio2BioclimaticMean Diurnal Range (mean of monthly (maxtemp-min temp))°C
Bio3BioclimaticIsothermality (BIO2/BIO7) (* 100) (“*” is the multiplication sign.)°C
Bio4BioclimaticTemperature Seasonality (standard deviation * 100)°C
Bio5BioclimaticMax Temperature of Warmest Month°C
Bio6BioclimaticMin Temperature of Coldest Month°C
Bio7BioclimaticTemperature Annual Range (BIO5-BIO6)°C
Bio8BioclimaticMean Temperature of Wettest Quarter°C
Bio9BioclimaticMean Temperature of Driest Quarter°C
Bio10BioclimaticMean Temperature of Warmest Quarter°C
Bio11BioclimaticMean Temperature of Coldest Quarter°C
Bio12BioclimaticAnnual Precipitationmm
Bio13BioclimaticPrecipitation of Wettest Monthmm
Bio14BioclimaticPrecipitation of Driest Monthmm
Bio15BioclimaticPrecipitation Seasonality (Coefficient of Variation)-
Bio16BioclimaticPrecipitation of Wettest Quartermm
Bio17BioclimaticPrecipitation of Driest Quartermm
Bio18BioclimaticPrecipitation of Warmest Quartermm
Bio19BioclimaticPrecipitation of Coldest Quartermm
Table 3. Summary of currently protected areas and distribution of occupied breeding grounds.
PeriodClimate ScenarioHabitat Area (km2)Protected Habitat Area (km2)Unprotected Habitat Area (km2)Protection Rate (%)
Current1,063,66734,2801,029,3863.22%
2050RCP2.61,161,77534,2801,127,4952.95%
RCP4.51,057,33634,2801,023,0563.24%
RCP8.51,009,60334,280975,3223.40%
2070RCP2.61,019,54434,280985,2643.36%
RCP4.51,057,13734,2801,022,8573.24%
RCP8.51,094,53134,2801,060,2503.13%
Publisher’s Note: MDPI stays neutral with regard to jurisdictional claims in published maps and institutional affiliations.