Article

“The 20 July 2021 Major Flood Event” in Greater Zhengzhou, China: A Case Study of Flooding Severity and Landscape Characteristics

1
College of Landscape Architecture and Art, Henan Agricultural University, Zhengzhou 450002, China
2
College of Food, Agricultural, and Environmental Sciences South Centers, The Ohio State University, 1864 Shyville Road, Piketon, OH 45661, USA
3
Henan Water & Power Engineering Consulting Co., Ltd., Zhengzhou 450017, China
4
Institute of Landscape Architecture, Urban Planning and Garden Art, Hungarian University of Agriculture and Life Sciences, 29-43 Villányi út, 1118 Budapest, Hungary
*
Authors to whom correspondence should be addressed.
Land 2022, 11(11), 1921; https://doi.org/10.3390/land11111921
Submission received: 12 September 2022 / Revised: 10 October 2022 / Accepted: 24 October 2022 / Published: 28 October 2022
(This article belongs to the Section Land–Climate Interactions)

Abstract

:
Climate change and rapid urbanization are two global processes that have significantly aggravated natural disasters, such as drought and flooding. Urbanization without resilient and sustainable planning and execution could lead to undesirable changes in landscapes and stormwater regulation capacity. These changes have exacerbated the effects of extreme climatic events with disastrous consequences in many cities worldwide. Unfortunately, the major storm in Zhengzhou, China on 20 July 2021 was one of these examples. This event provided a rare opportunity to study the key roles of green infrastructures (GI) in mitigating flooding risks in a major urban center after a devasting flood event. Using the data from high-resolution images collected via two satellites, a comprehensive study of the Jialu System in Greater Zhengzhou was conducted to systematically compare how far the river water had reached before and after the 20 July 2021 major storm in order to identify the main weak links in the city’s GI and stormwater management system. A flood inundation intensity index (FI) in the Upper (UJLR), Middle (MJLR), and Lower (LJLR) Regions of the Jialu River System was generated. Bivariate Moran’s I, a correlation coefficient between FI and landscape characteristics, was calculated and used to identify problem areas for future improvements. Our results showed that the MJLR had the severest flooding impacts. LJLR had the biggest change in how far the river water reached after flooding, ranging from 4.59 m to 706.28 m. In UJLR, the percentages of mine, crop land, and green space had the highest global bivariate Moran’s I correlation coefficients. In MJLR, the percentages of vacant land, impervious surfaces, and water body had the highest global bivariate Moran’s I correlation coefficients. In LJLR, the percentages of vacant land, water body, and crop land had the highest global bivariate Moran’s I correlation coefficients. The total percentages of both high landscape characteristics indices-high flood inundation intensity indices and low landscape characteristics indices-high flood inundation intensity indices areas are 12.96%, 13.47%, and 13.80% in UJLR, MJLR, and LJLR, respectively. These land cover composition types identified for each region can be treated as areas of primary focus. However, GeoDector Model (GDM) analyses showed that our eight variables of landscape characteristics were not independent. Hence, a more comprehensive approach integrating all eight variables is still necessary in future flood mitigation efforts.

1. Introduction

Climate change [1,2] and rapid urbanization [3] are two global processes that have significantly aggravated natural disasters, such as drought and flooding [4]. Climate change has been reported to cause more and more extreme weather patterns [5,6] and may require more coordinated efforts among many different countries to lessen its global effects [7,8,9,10]. From 2000 to 2019, floods accounted for 44% of all disaster events, affecting 1.6 billion people worldwide [11]. The country that was most affected by flooding during the past two decades was China [11]. These flooding events affected a total of 900 million people or 55% of the population in China. From 2006 to 2016, more than 100 cities flooded each year in China [12]. Several cities, such as Beijing [13], Wuhan [14] and Guangzhou [15], have been hit by repeated flood events triggered by intense rainstorms. According to a report entitled “Billion-Dollar Weather and Climate Disasters” in the United States from 1980 to 2021, flooding events in the river basin or urban flooding from excessive rainfall have caused USD 164.2 billion (CPI adjusted) in property damages [16]. Another report predicted a 26.4% (24.1–29.1%) increase in US flood risk by 2050 due to climate change alone under RCP4.5 [17]. European countries have been hit by pluvial and fluvial floods, such as in Germany, where there have been extreme floods events with regard to magnitude and spatial extent in August 2002, June 2013 and July 2021 [18]. As climate patterns change, the intensity and frequency of future floods in Central and Eastern Europe are likely to increase based on the analysis of historical flood events as well as projections into the future [19].
Urbanization, when not well planned, has been linked to more frequent and more disastrous flooding events since it can drastically reduce greenspace, wetland area, surface water infiltration, and stormwater absorption/regulation capacity [13,20,21]. On the other hand, well-planned urban centers using the concepts of the “sponge city” or low impact development has yielded some successful examples all over the world [22,23]. “The 20 July 2021 Major Flood Event” along the Jialu River System in Zhengzhou, China, provided a unique opportunity to systematically classify the degrees of destruction based on landscape characteristics. This historical flooding event resulted from a daily rainfall of 650.77 mm and caused 380 deaths and missing cases and a huge socioeconomic loss in Zhengzhou [24]. Jialu River is the main waterway that originates from mountains northwest of Zhengzhou, enters the city from the northwest side, runs through it, then flows through a large area of farmland. Jialu River is a flood drainage channel in Greater Zhengzhou, Henan Province in China [25].
Common flood control measures include gutters, storm sewers, tunnels, culverts, detention basins, pipes, and other mechanical devices [26]. Some of the runoff control measures also use sophisticated gray infrastructure to guide excess surface flow into storage and disposal sites [27]. In a climate system with extreme weather events, these measures are not nimble enough to deal effectively with large volumes of runoff [28,29]. To enhance urban flood resilience, different alternative concepts and technologies on stormwater, such as low impact development (LID) in the US [30], sustainable urban drainage systems (SUDS) in the UK [31], water sensitive urban design (WSUD) in Australia [32], and the “sponge city” in China [33], have been introduced and implemented.
Green infrastructure (GI) is an innovate tool for stormwater management since it mimics the natural hydrological cycles of water infiltration, storage, evaporation, and reuse [34,35]. GI refers to an interconnected network of natural areas (e.g., wetlands, forests, and green space), and semi-natural areas (e.g., rainwater tanks, raingardens, and green roofs) [36]. GI may play an important role in reducing stormwater runoff and subsequent flood risks [37,38]. There have been many studies on the benefits of GI on stormwater mitigation in a city or a section of a city [39,40]. Very few studies have taken a systematic approach to examine an ecosystem that includes a large city, and the associated areas both upstream and downstream. Many hydrological models have been developed to simulate the potential effects of GI on stormwater management [41,42]. However, it is hard to know how accurately these models are at predicting flooding events in the real world. Specific structures or functions of GI in relation to stormwater control and other ecological services have been well studied. However, there have been few reports on how to optimize both the landscape structure [43] and function [44,45] of GI in a large ecosystem that includes a hilly area with extensive forest cover, a heavily populated metropolitan area with lots of impervious space, and a diverse suburban to the farming community.
“The 20 July 2021 Major Flood Event” in Zhengzhou, China is used to study the relationship between landscape characteristics [46,47] and flooding severity [48,49]. Systematic analysis of major segments of the Jialu River can reveal how well the existing GI have worked and the major weaknesses of GI structures and functions. A case study based on a historical flood should help Zhengzhou and other similar cities in their comprehensive GI planning to reduce the severity of future flooding events. The study aimed to identify priority areas for green infrastructure planning to optimize both the structure and the function of green infrastructure along the 137 km stretch of the Jialu River System in greater Zhengzhou, China.
The objectives of this work were to: (1) describe the rainfall amounts and flood distribution patterns of the “The 20 July 2021 Major Flood Event” along the upper, middle and lower regions of the Jialu River System; (2) identify the possible landscape characteristics for possible flood mitigation efforts using bivariate Moran’s I statistic; (3) identify potential sites for GI planning based on the spatial analysis of the local interactions between landscape characteristics and flood inundation intensity; and (4) develop an effective tool to help city planners in drafting flood mitigation strategies.

2. Materials and Methods
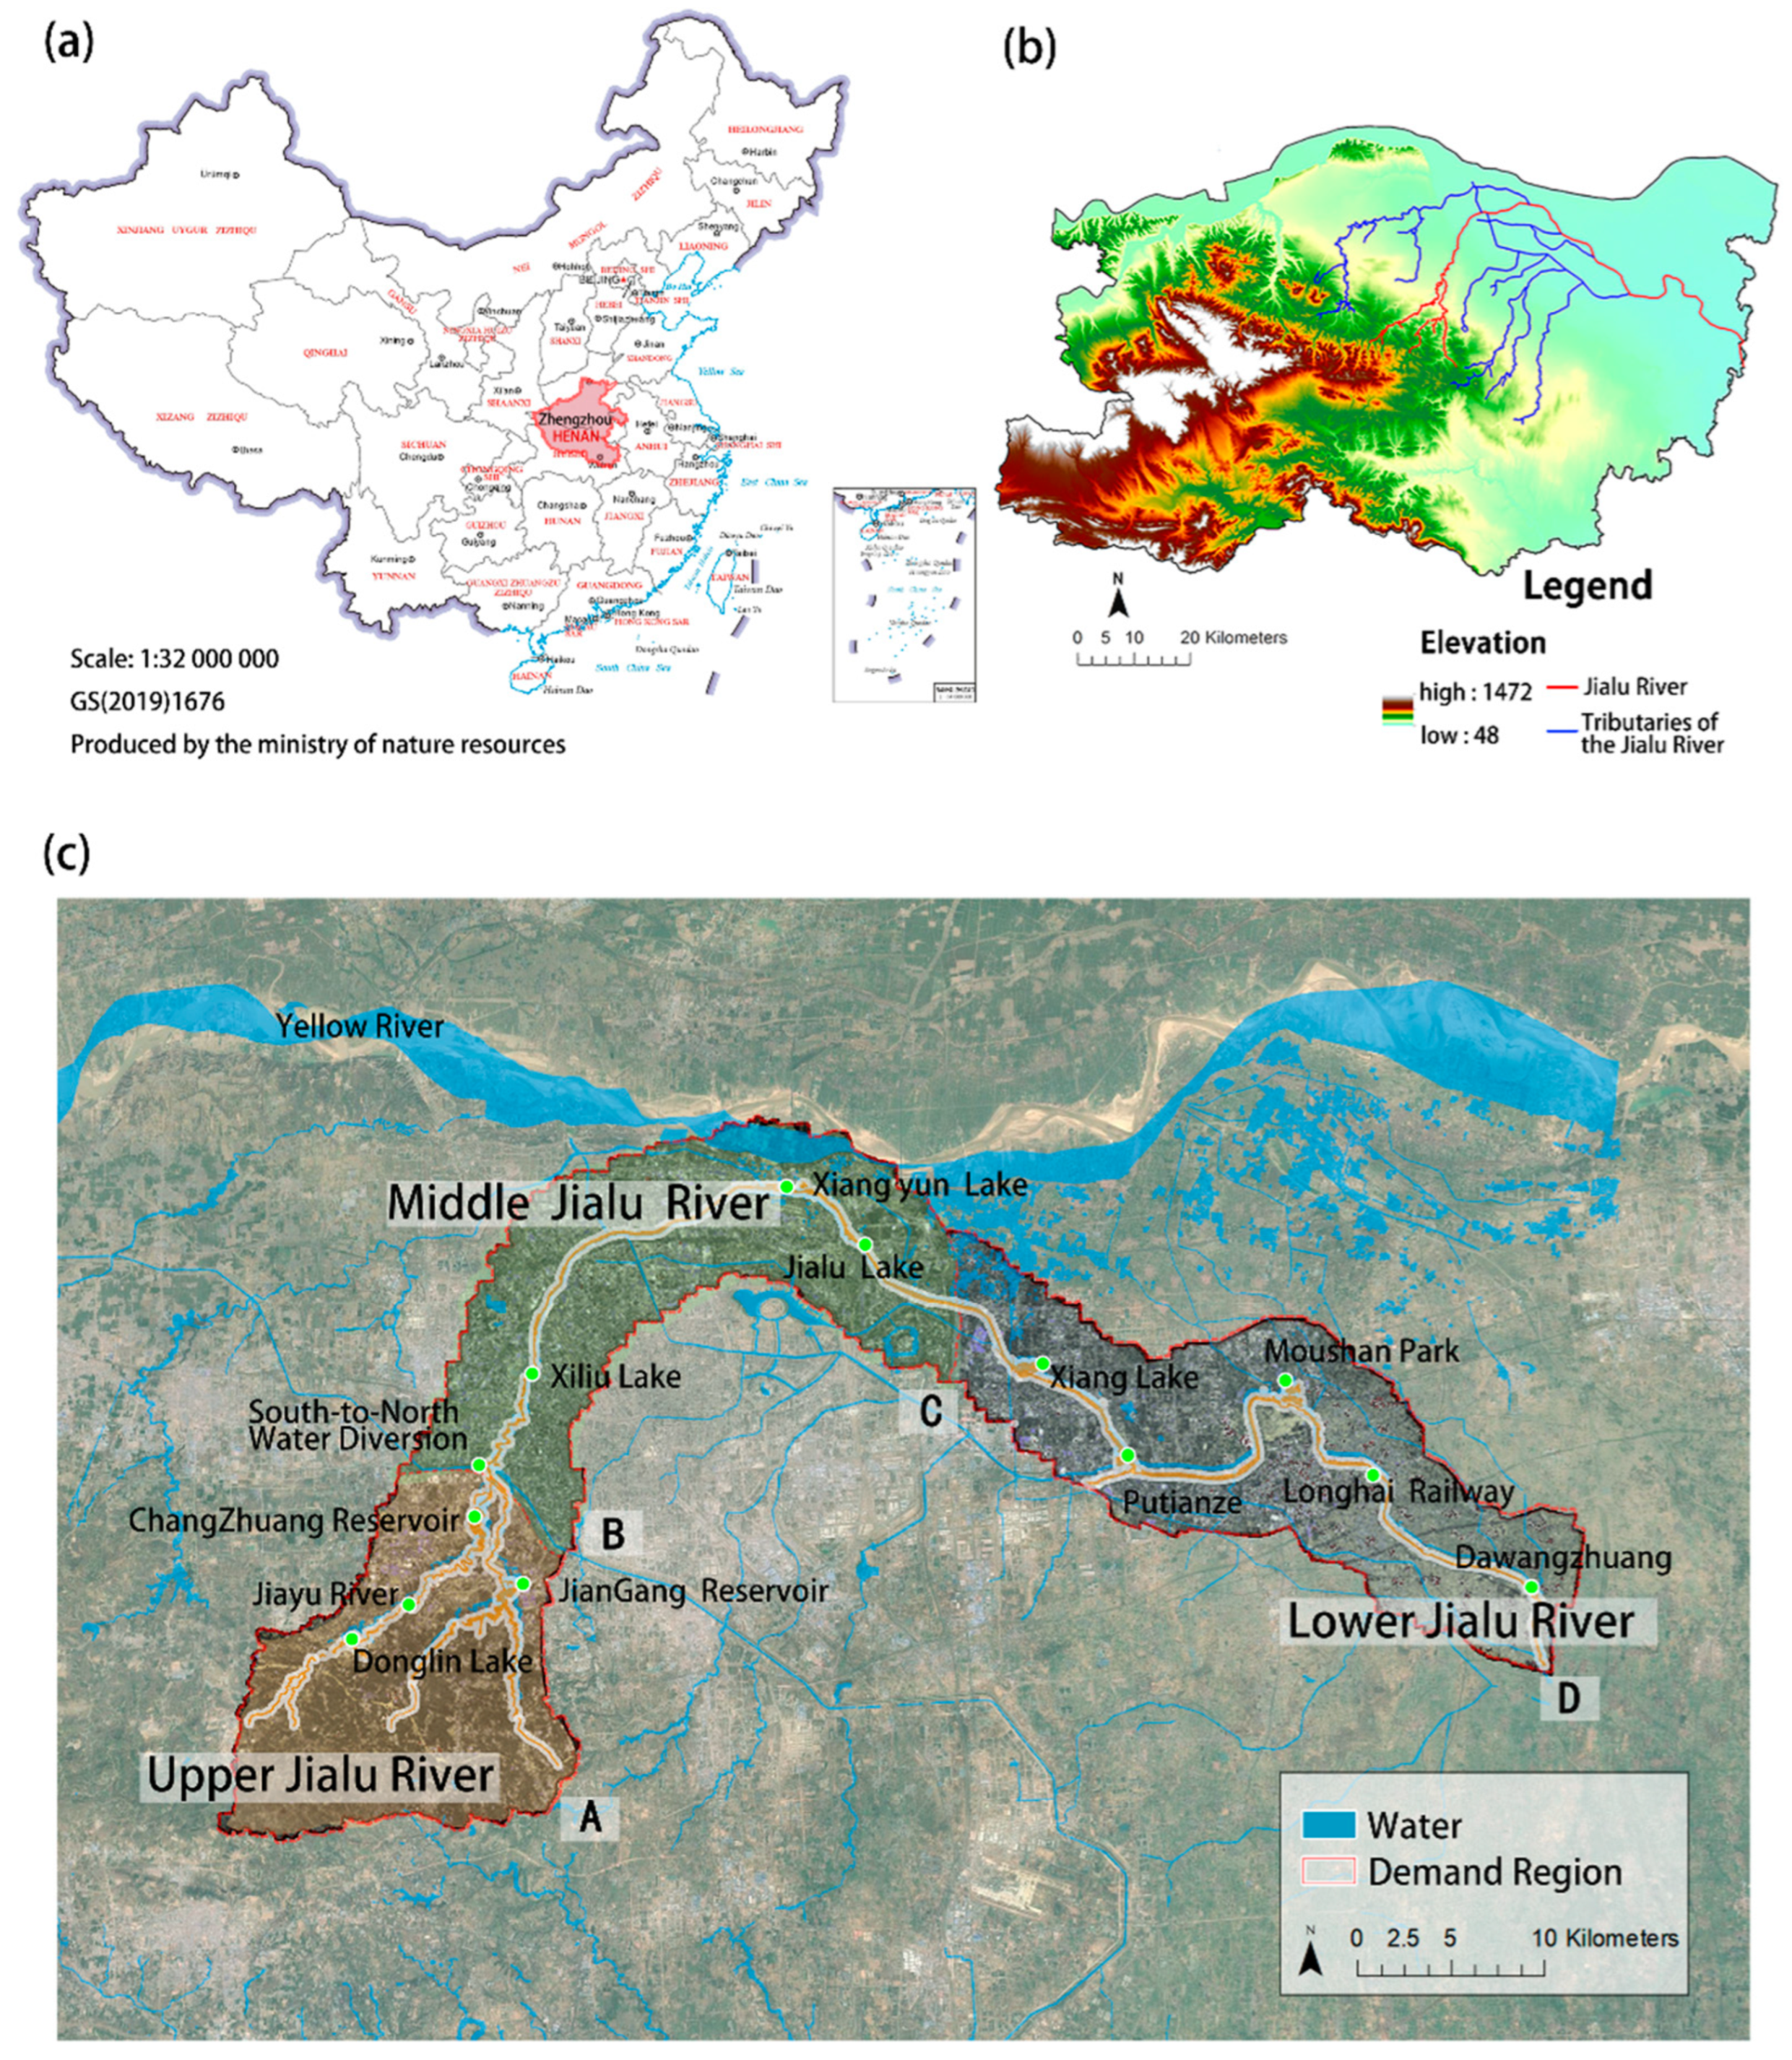
2.1. Study Area

The study area includes the 137 km stretch of the Jialu River System in the Greater Zhengzhou, China. Zhengzhou is situated in north-central China at latitude from 34°16′ N to 34°58′ N and longitude from 112°42′ E to114°14′ E [50] (Figure 1a). It is the capital city of Henan Province and has a total area of approximately 7446 km2 and a population of 12.74 million [51]. Greater Zhengzhou encompasses urban areas and substantial rural areas. It is west of Songshan Mountain and north of the Yellow River. Zhengzhou has a temperate continental monsoon climate with four distinctive seasons. Zhengzhou has an elevation range of 48–1472 m (Figure 1b), an annual air average temperature of 15.6 °C [52] and annual precipitation of 624.3 mm [53].
Our study divided the 137 km stretch into upper, middle, and lower regions along the Jialu River System based several criteria. The starting point of Jialu River System is labeled as A and is traditionally regarded as its origin. The dividing point between the upper the middle regions is labelled as B, is where a major water diversion duct system meets Jialu River, and a major change in elevation occurs. The dividing point between the MJLR and LJLR is labelled as C and is the where the eastern administrative boundary of Zhengzhou City. D is the eastern edge of Greater Zhengzhou The overall study area is approximately 775.38 km2 (Figure 1c). The Upper Region of the Jialu River System (UJLR) starts from point A and ends at point B and covers approximately 51 km. UJLR includes the west tributary of the Jalu River (Jiayu River) which flows into the Changzhuang Reservoir, and the east tributary of the Jialu River that flows into the Jiangang Reservoir. The river channel above Donglin Lake and Jiangang Reservoir is mostly dry year-round and is mainly used for crop production with irrigation. The Middle Region of the Jialu River System (MJLR) starts from point B, ends at point C, and covers approximately 38 km. MJLR includes Xiangyun Lake and Jialu Lake, and the backfilled Xiliu Lake. The Lower Region of the Jialu River System (LJLR) starts from point C and ends at point D. LJLR covers approximately 48km and includes Xiang Lake, Putian Lake, and Moushan Lake.

2.2. Data Sources

The data source for the daily rainfall amounts was acquired from Zhengzhou Meteorological Bureau (ZMD), which has 150 meteorological stations throughout Greater Zhengzhou. The rainfall data from 0600 UTC on 19 July 2021 to 0600 UTC 21 July 2021 were used to describe the rainfall patterns and their effects during the flood event on 20 July 2021. The major rainfall event started on 0500 UTC on 18 July 2021, reached the highest perception rate at 1700 UTC on 20 July 2021, dropped to a very low rate at 0600 UTC on 21 July 2021, and completely stopped at 0900 UTC on 22 July 2021. Hence, 88.34% of the total rainfall amounts was captured between 0600 UTC on 19 July 2021 and 0600 UTC 21 July 2021.
The data source for mapping the flood inundation intensity in the above-mentioned study area was acquired from China Centre for Resources Satellite Data and Application (CRESDA., http://www.cresda.com/EN/, accessed on 25 July 2021). We obtained the Gaofen-3 (GF-3) Synthetic Aperture Radar (SAR) images of dual-polarized (VV and VH) that were taken at 10:38 pm on 15 July 2021 to show the study area before the major flooding event, and at 10:31 pm on 20 July 2021 to show the aftermath of the devastating flood. Images from other periods were not used since our images represented the open water stretch or river widths before and after the flooding. We also used the images from 21 July 2021 in our preliminary analysis. However, there were no significant difference between those images taken on 20 July and 21 July 2021. The GF-3 satellite is the first high spatial self-developed C-band multi-polarization SAR satellite in China and is known to be free of interference from poor weather conditions.
The data sources for describing landscape characteristics were CRESDA and ALOS- PALSAR DEM (ASF, https://asf.alaska.edu/, accessed on 26 July 2021). The images collected through CRESD with Gaofen-6 on 13 May 2020 had a spatial resolution of 2 m and were used for examining the impact of land cover composition on flood inundation. Digital elevation model (DEM) obtained through ALOS PALSAR DEM was utilized as base data for examining the impacts of topography on flood inundation.

2.3. Data Processing for Mapping Flood Inundation Intensity

The flood extend map was generated based on GF-3 SAR data using the thresholding method [54]. The images were pre-processed in ENVI SARscape5.2.1 software [55] using the following steps: (1) thermal noise removal (removes additive noise in sub-swaths); (2) radiometric calibration (computes backscatter intensity using sensor calibration parameters); (3) speckle filter (removes granular noise); (4) terrain-correction (orthorectification); (5) conversion of the backscatter coefficient (σ0) into decibels (dB). To separate water and non-water pixels in these processed images, the binarization method was applied by selecting an appropriate threshold through a trial-and-error technique [56].
The total surface area covered with water after 20 July 2021 flooding event was measured with GF-3 SAR at 10:31 pm on 20 July 2021. The permanent/seasonal water bodies map before flooding was developed from GF-3 SAR on at 10:38 pm 15 July 2021. The flood inundation intensity extent map was developed by removing the area identified as the permanent/seasonal water bodies (15 July 2021) from the total surface area covered with water (20 July 2021) using the clipping tool in ArcGIS. The daily rainfall data from 1 June to 15 July in 2018–2021 based on seven national meteorological stations throughout Greater Zhengzhou were collected and analyzed. No extreme rainfall events were observed from 1 June to 15 July in 2021. Hence, the satellite images collected on 15 July 2021 was an accurate representation of permanent/seasonal water bodies. Second, boundaries of permanent/seasonal water bodies were verified visually on computer by comparing our images to those obtained through Gaofen-6 on 13 May 2020 (a spatial resolution of 2 m).To identify flood hotspots, this study introduced flood inundation intensity (FI) [57] using Equation (1). The flood inundation map for the study area was divided into 100 m × 100 m grids with the ArcGIS platform and the fishnet.
F I = F A
F indicates the total area of flood inundation extent in each 100 m × 100 m grid while A is the total area of a 100 m × 100 m grid or 10,000 m2.
To compare changes in the open water stretch [58] along the main channel of the Jialu River before and after the flooding event, we calculated pre-and post-flood river widths. The widths of the river were measured using ArcGIS in edit mode. The centerline was identified using a Collapse Dual Lines to Centerline function in ArcGIS. The entire center line was then divided into 1 km segments using the Equidistance Segmentation Tool. The widths of the river were calculated by creating a cross-sectional line perpendicular to the river centerline at the end points using the Construction Tool in ArcGIS.

2.4. Analyses of Landscape Characteristics along Jialu River

Two categories of metrics to describe landscape characteristics along the Jialu River were used following a common method [59,60,61]. All the analyses are based on a spatial grid of metrics at 100 m × 100 m grid scale.

2.4.1. Land Cover Composition

The land cover data are classified from Gaofen-6 optical remote sensing images based on a multi-layer perception (MLP) classification method [62,63]. The images were first pre-processed with ENVI5.3 software for radiometric calibration, atmospheric correction, geometric correction and orthorectification. The texture features of the images were then extracted with “Co-occurrence Measures” tools. The four spectral features as well as eight texture features were normalized to obtain a new fused image for the classification of land covers. Then, classification samples of land cover types were extracted using the ROIS tool of ENVI5.3. Finally, according to the sample dataset, the fused images were used as the input data of the MLP classifier, the MLP classification model of the study area was trained, and the GF-6 remote sensing images of the study area were classified according to the trained model performed in RStudio [64]. There were 5622 image segments, representing six different land cover types (greenspace (1688 samples), water body (370 samples), impervious surfaces (1587 samples), crop land (897samples), vacant land (793 samples), and mine (287 samples)) in the training dataset. Seventy percent (3936) of the sample points were used for training and 30% (1686 samples) were used for validation. The accuracy was shown in Table 1. The land cover types were divided into 5 categories, which include green infrastructure, impervious surface, crop land, vacant land, and mine (Table 2). Green infrastructure (GI) [65], which refers to a network of natural or semi-natural areas spaces, including greenspaces and water bodies. The Tabulate Area Tool in ArcGIS was used to calculate the area percentage of greenspace (GSP), water body (WATERP), impervious surfaces (ISP), crop land (CROPP), vacant land (VACANTP), and mine (MINEP) in each 100 m × 100 m grid scale.

2.4.2. Topographic Metrics

The relative elevation (RE) [59] was selected to reveal the degree of elevation change within a grid cell. RE was calculated as in Equation (2):
R E = E m a x E m i n
where E m a x represents the maximum elevation in the grid unit i and E m i n represent the minimum elevation in the grid unit i. A higher R E value indicates greater elevation fluctuation in each gride.
Topographic wetness index (TWI) [69] is a geomorphometric parameter used to quantify local relief and quantitatively evaluate runoff in flood studies. It was calculated using Equation (3) below:
T W I = ln ( α / tan β )
T W I were extracted through the hydrological analysis Tools from ArcGIS, where α is the total upslope catchment area draining downward from a point with a slope angle of β . The higher value of T W I indicates a higher potential of runoff generation.

2.5. Spatial Correlation Analysis

Bivariate Moran’s I statistic [70] is commonly used to provide an indication of the degree of linear association between one variable and another variable in nearby regions. Global bivariate Moran’s I and local bivariate Moran’s I (also known as bivariate LISA) were used in this study to calculate the spatial correlation between landscape characteristics and flood inundation intensity in UJLR, MJLR, and LJLR, respectively. The method is shown in Equations (4) and (5).
                                                                        I   L , F = N i N j 1 N W i j Z i L Z j F ( N 1 ) i N j 1 N W i j
I L , F = Z i L j = 1 N W i j Z j F
where I L , F and I L , F refer to the global and local bivariate Moran’s I, respectively, N refers to the total number of grid squares, W i j is the spatial weight matrix for measuring the spatial correlation between grid square i and j , Z i L refers to the standardized value of landscape characteristics indexes, and Z j F refers to the standardized value of flood inundation intensity in the grid square.
The range of global bivariate Moran’s I value is −1 to 1, with −1 indicating the strongest negative spatial autocorrelation, 0 implying no spatial autocorrelation, and 1 indicating positive spatial autocorrelation. The results of local bivariate Moran’s I were used to visualize local spatial correlations by generating cluster maps (bivariate LISA map) [71], which helped to identify four types of spatial correlations: H-H, the high value of landscape characteristics metrics surrounded by high flood inundation intensity; L-L, the low value of landscape characteristics metrics surrounded by low flood inundation intensity; H-L, the high value of landscape characteristics metrics surrounded by low flood inundation intensity; and L-H, the low value of landscape characteristics metrics surrounded by high flood inundation intensity. “Non-significance” means that the grid has no significant local spatial correlation association with surrounding surroundings grids. We calculated bivariate Moran’s I and drew LISA maps using GeoDa 1.14 [72] with the significance level set at 0.01.

2.6. GeoDector Model Spatial Correlation Analysis

GeoDector was originally proposed by Wang et al. [73] to detect spatial hetero-geneity and key factors and has been adopted in quite few studies since then [74,75].This statistical tool has a factor detector, a risk detector, an interaction detector, and an ecological detector. GeoDetector q statistic is used to measure the spatial differentiation of geographical phenomenon and to detect interactions between explanatory factors and analytical variables since it was shown to be effective method for such a purpose in a recent paper. More details on the theory and calculation process of q statistic can be found in previous studies [76]. In this study, we applied interaction detection, to explore whether the effects of two factors on FI are independent, mutually enhancive, or mutually inhibitory. The process can be understood by Table 3.
The q value of factors f 1 and f 2 calculated from the interaction detector can be described as q ( f 1 ) and q ( f 2 ) , respectively. The symbol denotes the interaction between factors f 1 and f 2 , and f 1 f 2 is implemented by overlaying the two variables using GIS tools. The symbol q ( f 1 f 2 ) denotes the q value of f 1 f 2 .

3. Results

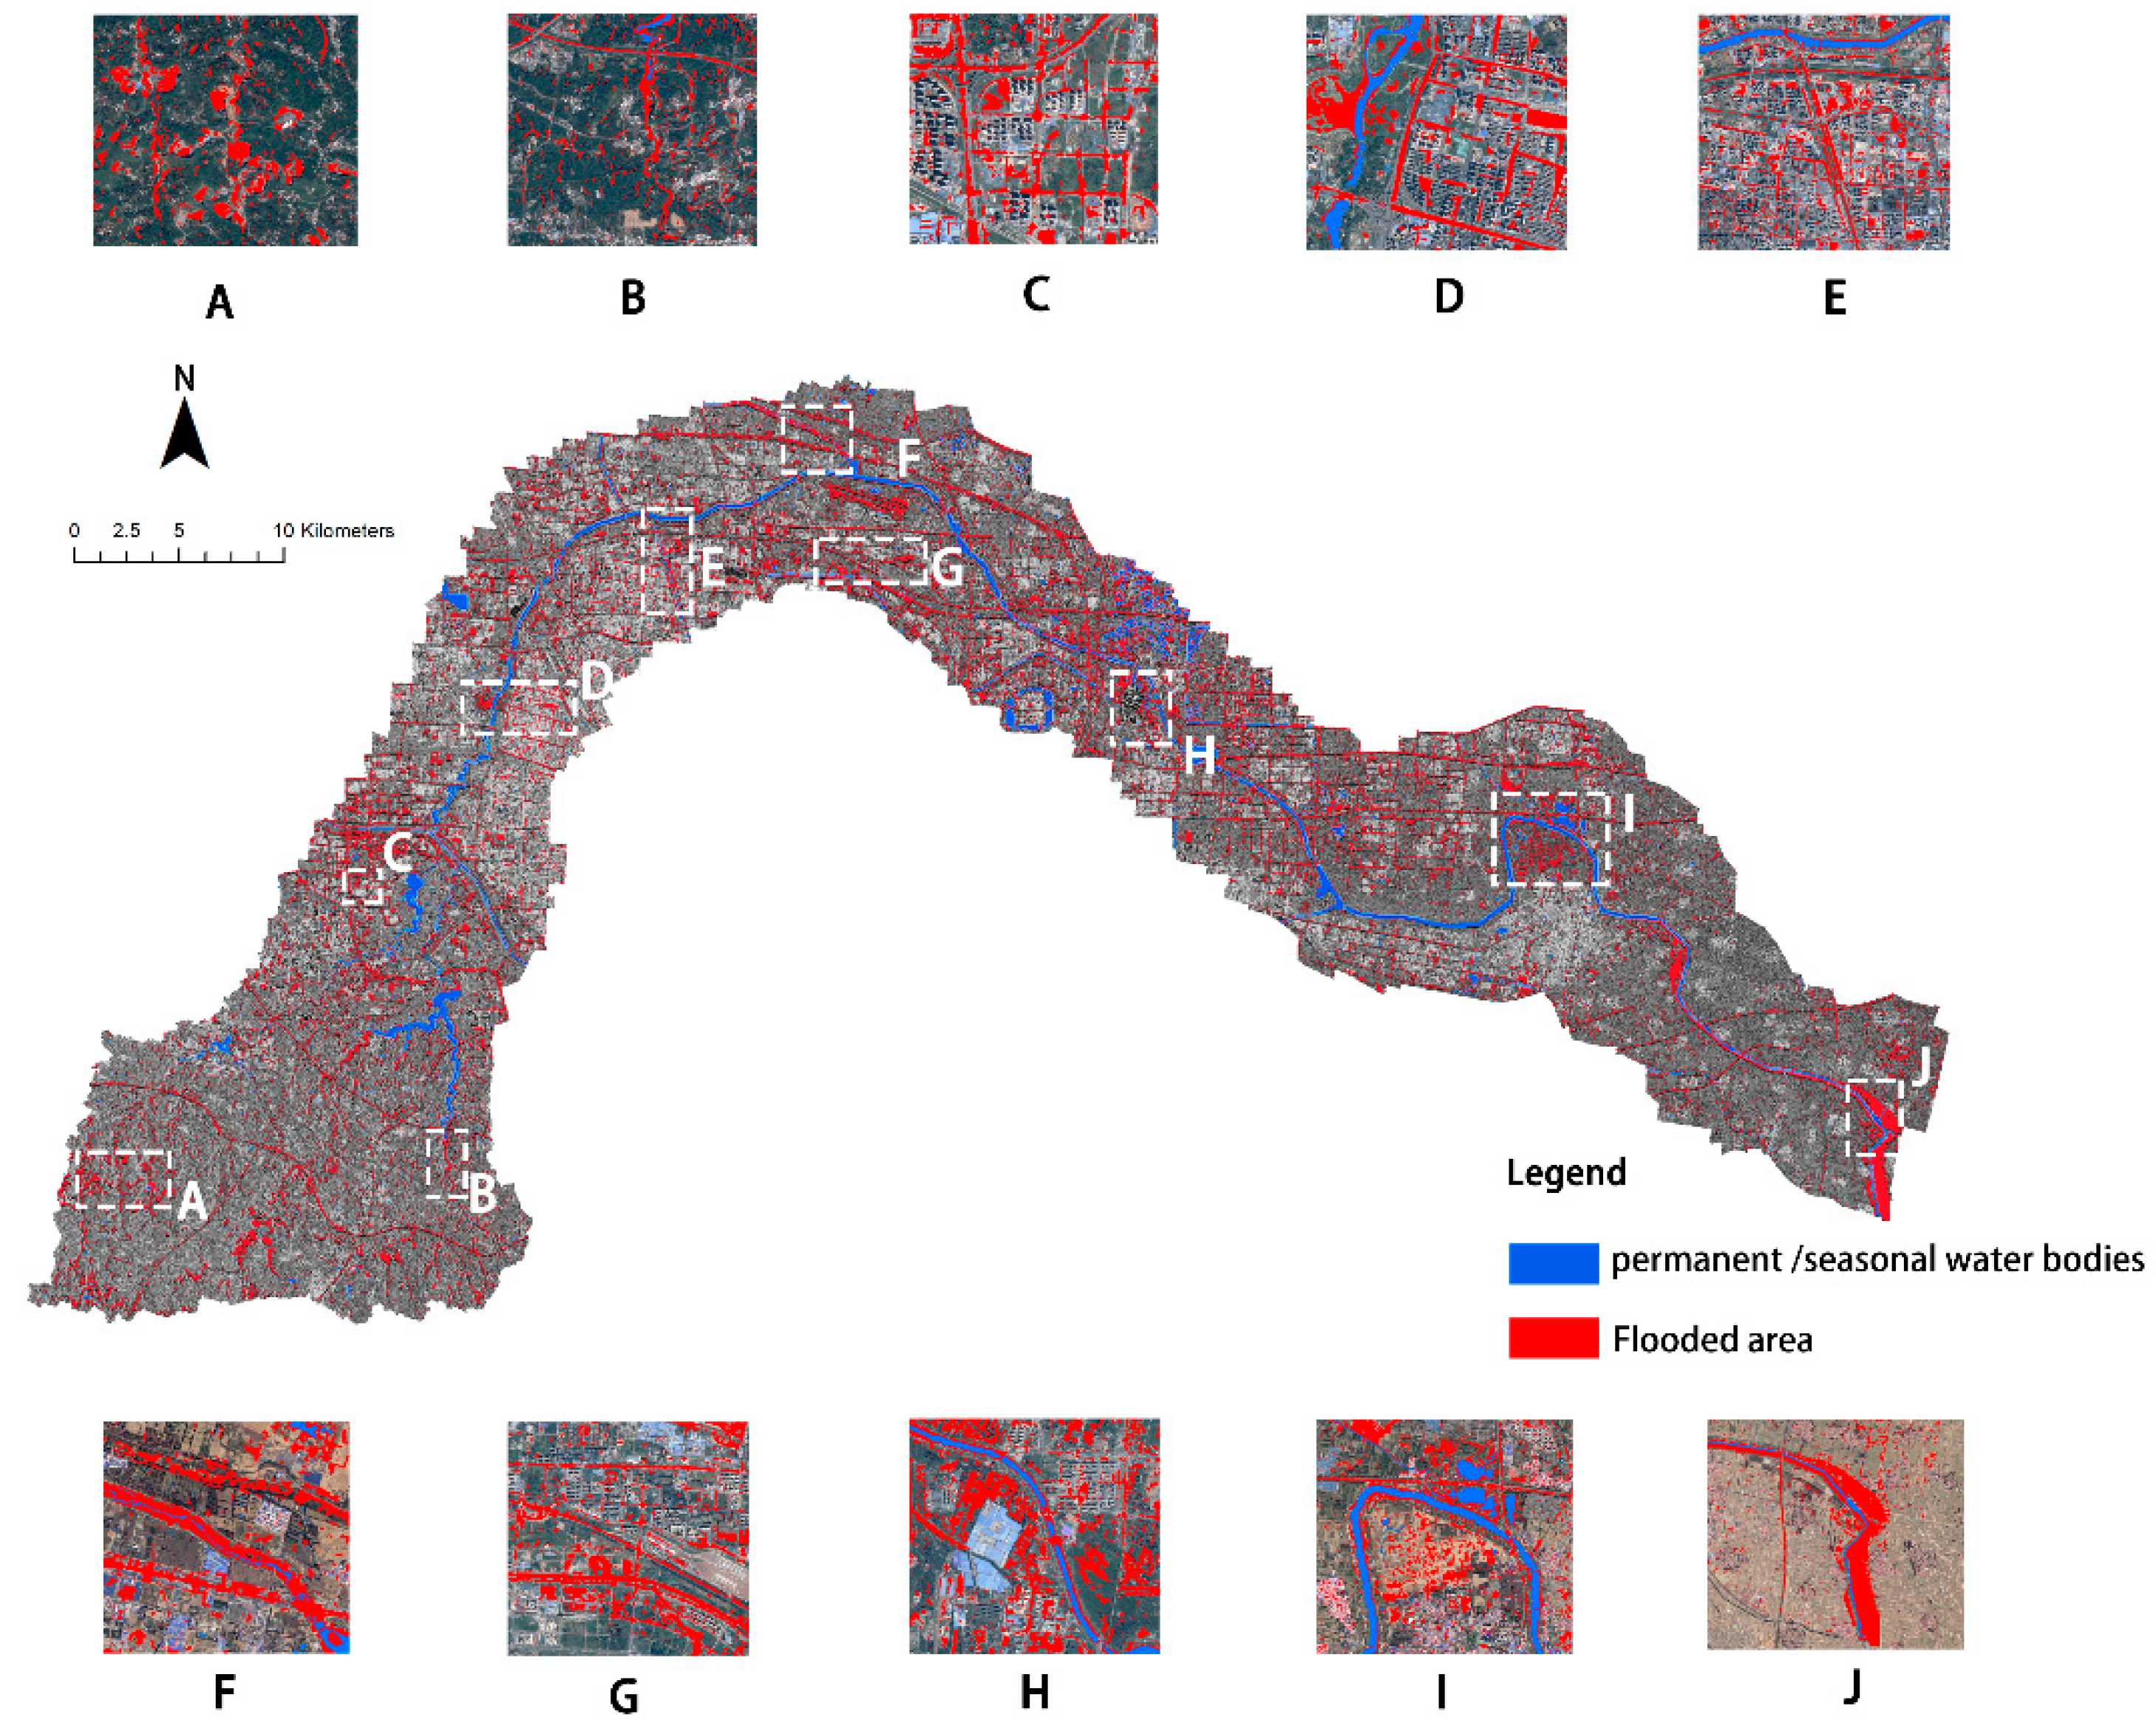
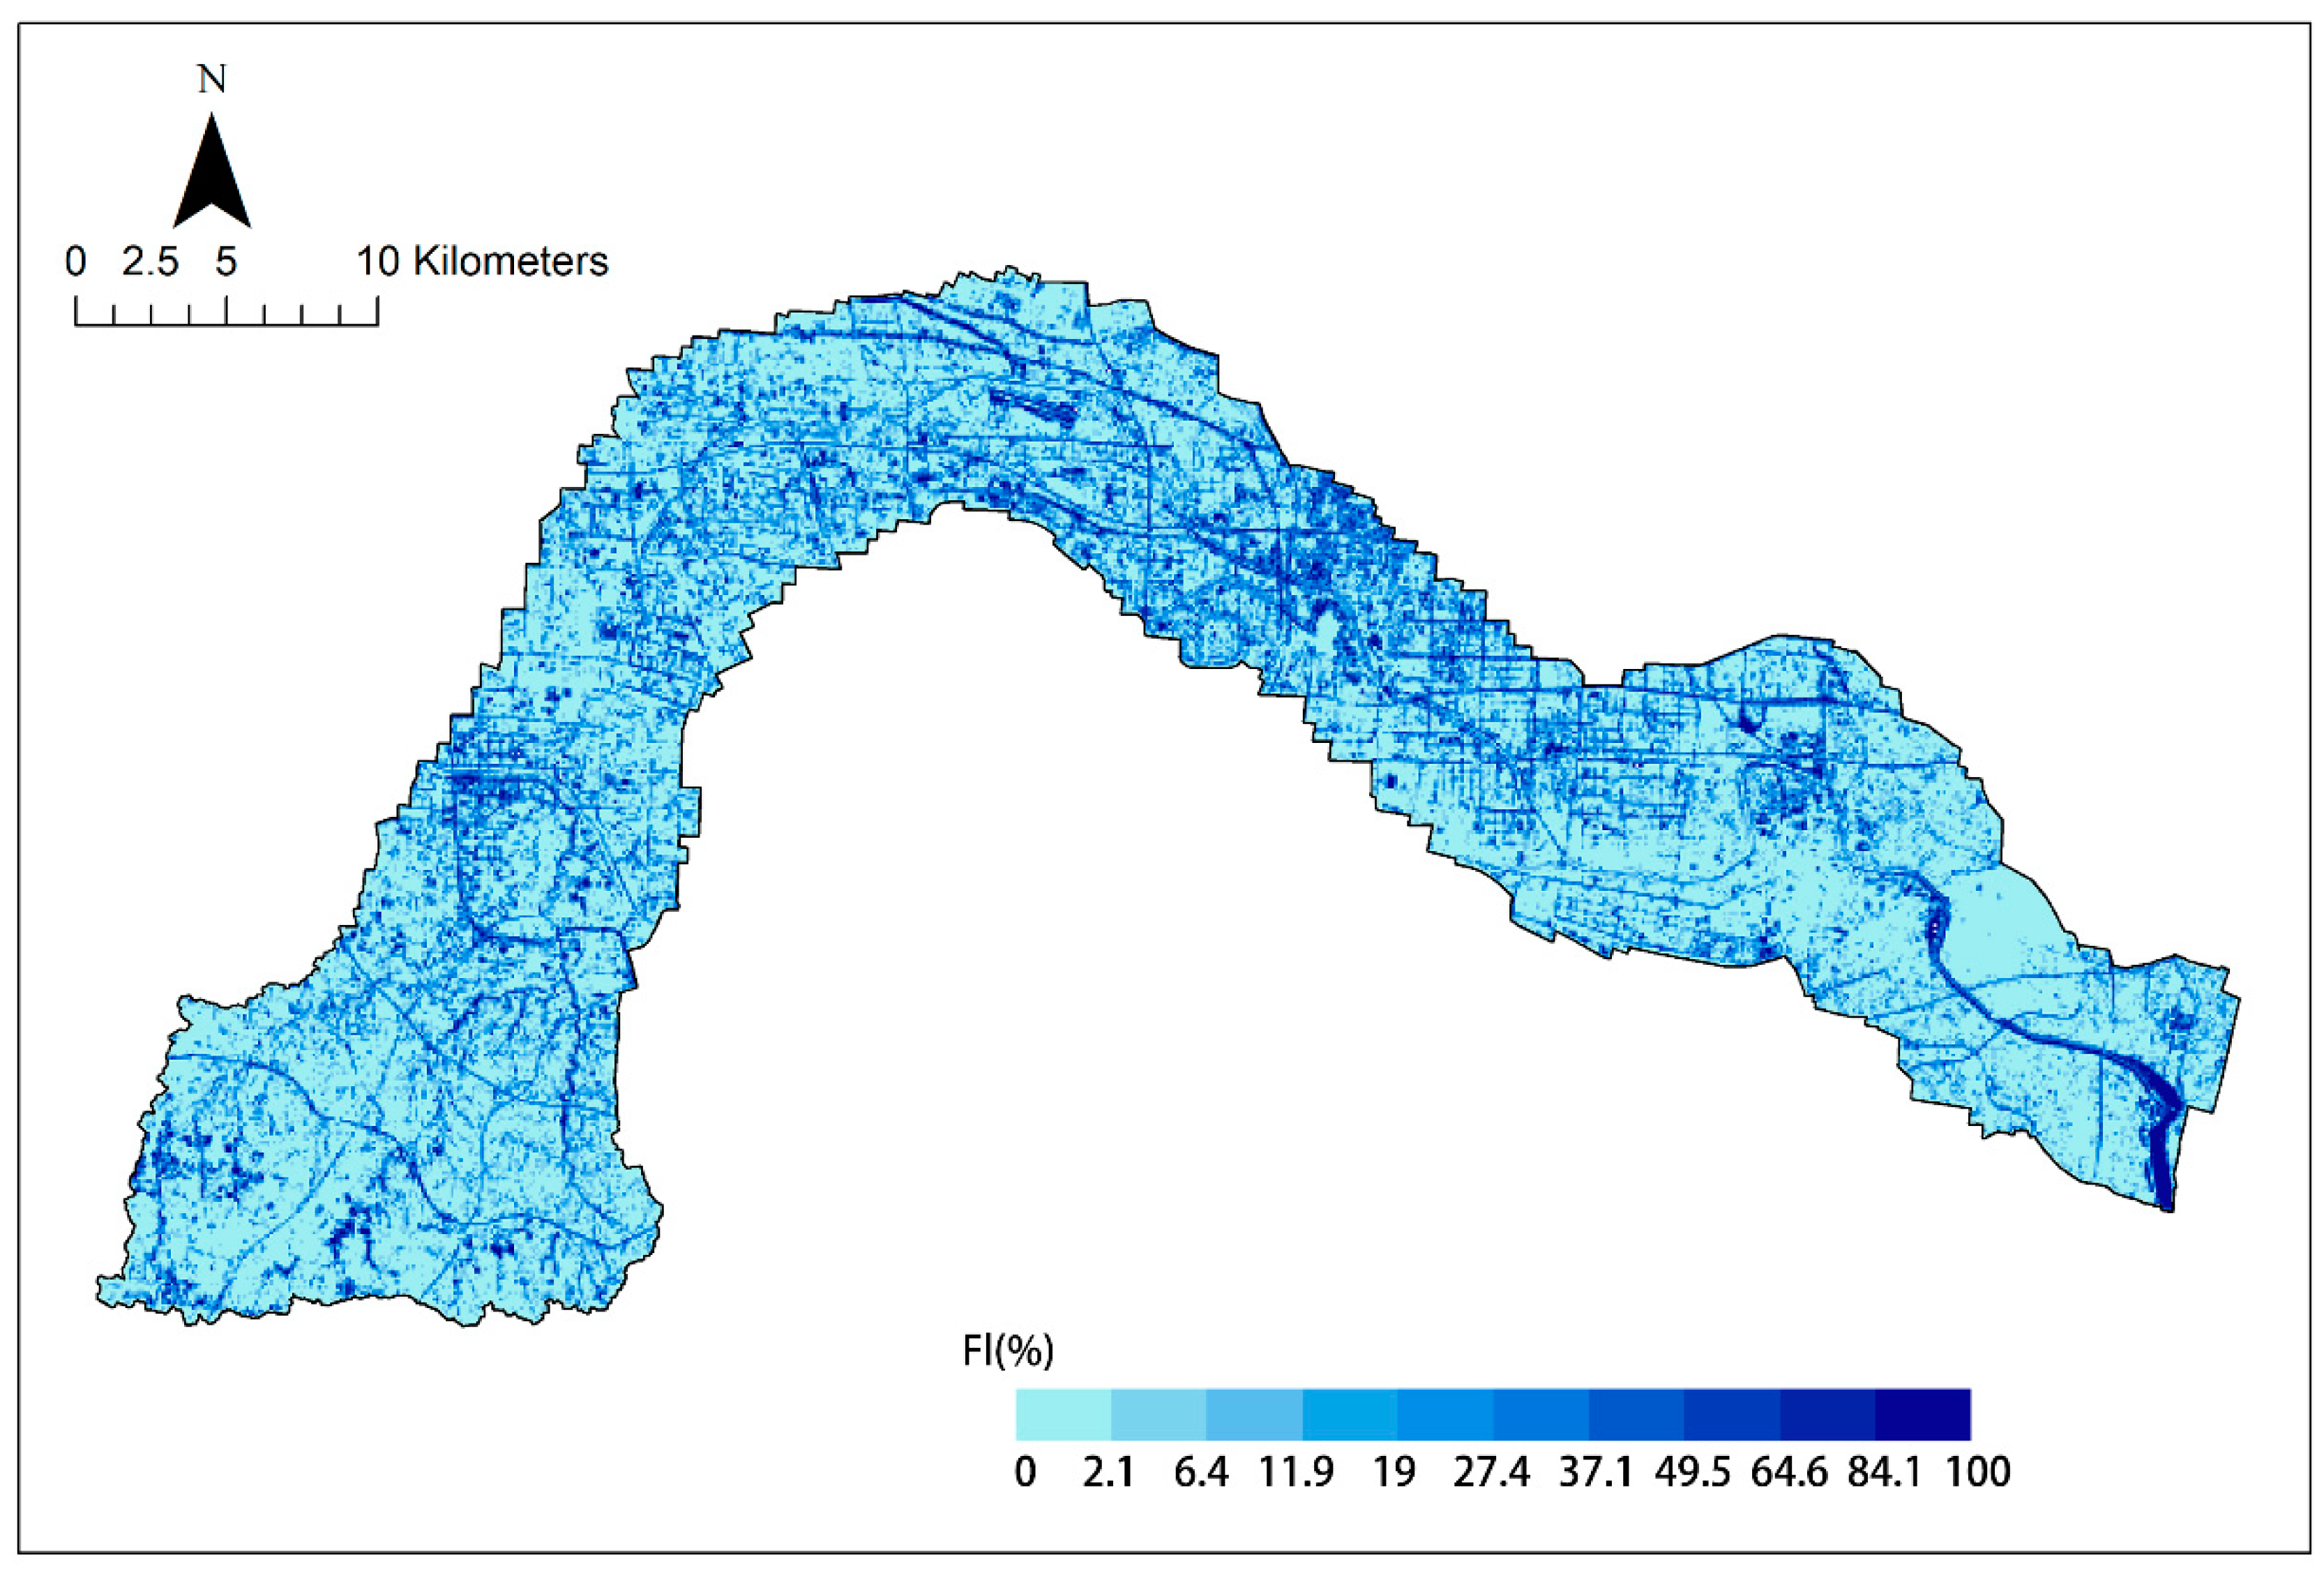
3.1. Rainfall and Flooding Distribution during the 20 July 2021 Flood Event

The daily rainfall data from ZMD from 19 to 21 July 2021 were used to describe changes in precipitation causing extreme floods in Zhengzhou. The rainfall patterns in Zhengzhou from 0600 UTC 19 to 0600 UTC 21 July 2021 at an interval of 24 h are shown in Figure 2. Among three regions of the Jialu River System, the highest rainfall amounts were recorded in UJLR with 187.1 mm in Xinmi Meteorological Station and 140.7 mm in the Xingyang Meteorological Station. In MJLR, the total recorded rainfall was 94.5 mm as reported by Zhengzhou Meteorological Station while the total rainfall amount in the LJLR was 81.8 mm as recorded by Zhongmou Meteorological Station during 0600 UTC 19 to 0600 UTC on 20 July 2021. These historically high precipitation levels caused the Changzhuang Reservoir in UJLR to reach emergency water level at approximately 1000 UTC on 20 July 2021 prompting the release of excess water from the Changzhuang reservoir. The water released from the reservoir entered the Jialu River that was already at capacity, resulting in overflows onto the surrounding banks and neighboring land in the middle and lower regions and causing severe backflow effects on the city’s stormwater drainage system. From 0600 UTC 20 to 0600 UTC on 21 July 2021 a daily total rainfall amount of 630 mm was recorded in MJLR. This amount nearly equals to the total annual average rainfall 624.3 mm in Zhengzhou. In addition, the maximum one-hour rainfall was 201.9 mm from 1600 UTC 20 to 1700 UTC on 20 July 2021 in MJLR. Moreover, UJLR and LJLR also recorded extreme daily rainfalls amounts of 412.3 and 229.1 mm, respectively.
This historical flood caused widespread devastation along the Jialu River System. Among three regions along the Jialu river, the severest flooding impact was observed in the MJLR representing 13.64% of the total and covering 35.27km2, followed by the LJLR representing 12.75% and covering 36.96 km2, whereas the UJLR was least impacted, representing 10.48% and covering 23.78 km2 (Figure 3).
The natural breaks (Jenks) grading method in ArcGIS was used to divide the flood inundation intensity index (FI) into 10 relative severity levels (Figure 4), where FI values between 84.1% to 100% were classified into the severest flood level. The 84.1% was the result of 10 levels and overall data distribution. In UJLR, the FI values ranged from 84.1% to 100% (Figure 4), corresponding to the areas around mines (Figure 3A), streams (Figure 3B), gullies in mountainous, hilly areas (Figure 3C), and Changzhuang Reservoir (Figure 3D). In MJLR, the urban drainage system was completely overwhelmed where floodwater flowed into the streets all over the city, underground infrastructures such as the metro subway systems and tunnels, buildings and their underground spaces. Xiliu Lake in the main river channel (Figure 3E) and the tributaries of Dongfeng Channel (Figure 3F), Wei River constitute the major zones (Figure 3G) of high FI (84.1–100%). In LJLR, FI values ranged from 84.1% to 100%, representing the areas around Dongsihuan Road (Figure 3H), Moushan Park (Figure 3I), and Dawangzhuang (Figure 3J).
Changes in the open water stretch within the main channel of Jialu River before and after the flooding event are used to show the relative flooding severity along the three regions of Jialu River (Figure 5). In UJLR, the width differences of the open water stretch after flooding ranged from 24.01 m to 160.00 m. The areas with the greatest fluctuation in the width of open water stretch were recorded in the upstream of Jiangang Reservoir, as marked in Section 5. In MJLR, the width difference of the open water stretch after flooding ranged from 3.43 m to 439.34 m. The greatest change in the width of the open water stretch was recorded where Xiliu Lake used to be located and was currently completed filled, as marked in section 21. In LJLR, the width difference of the open water stretch after flooding ranged from 4.59 m to 706.28 m, and the greatest change in the width of the open water stretch was recorded in Dawangzhuang as marked in section 87.

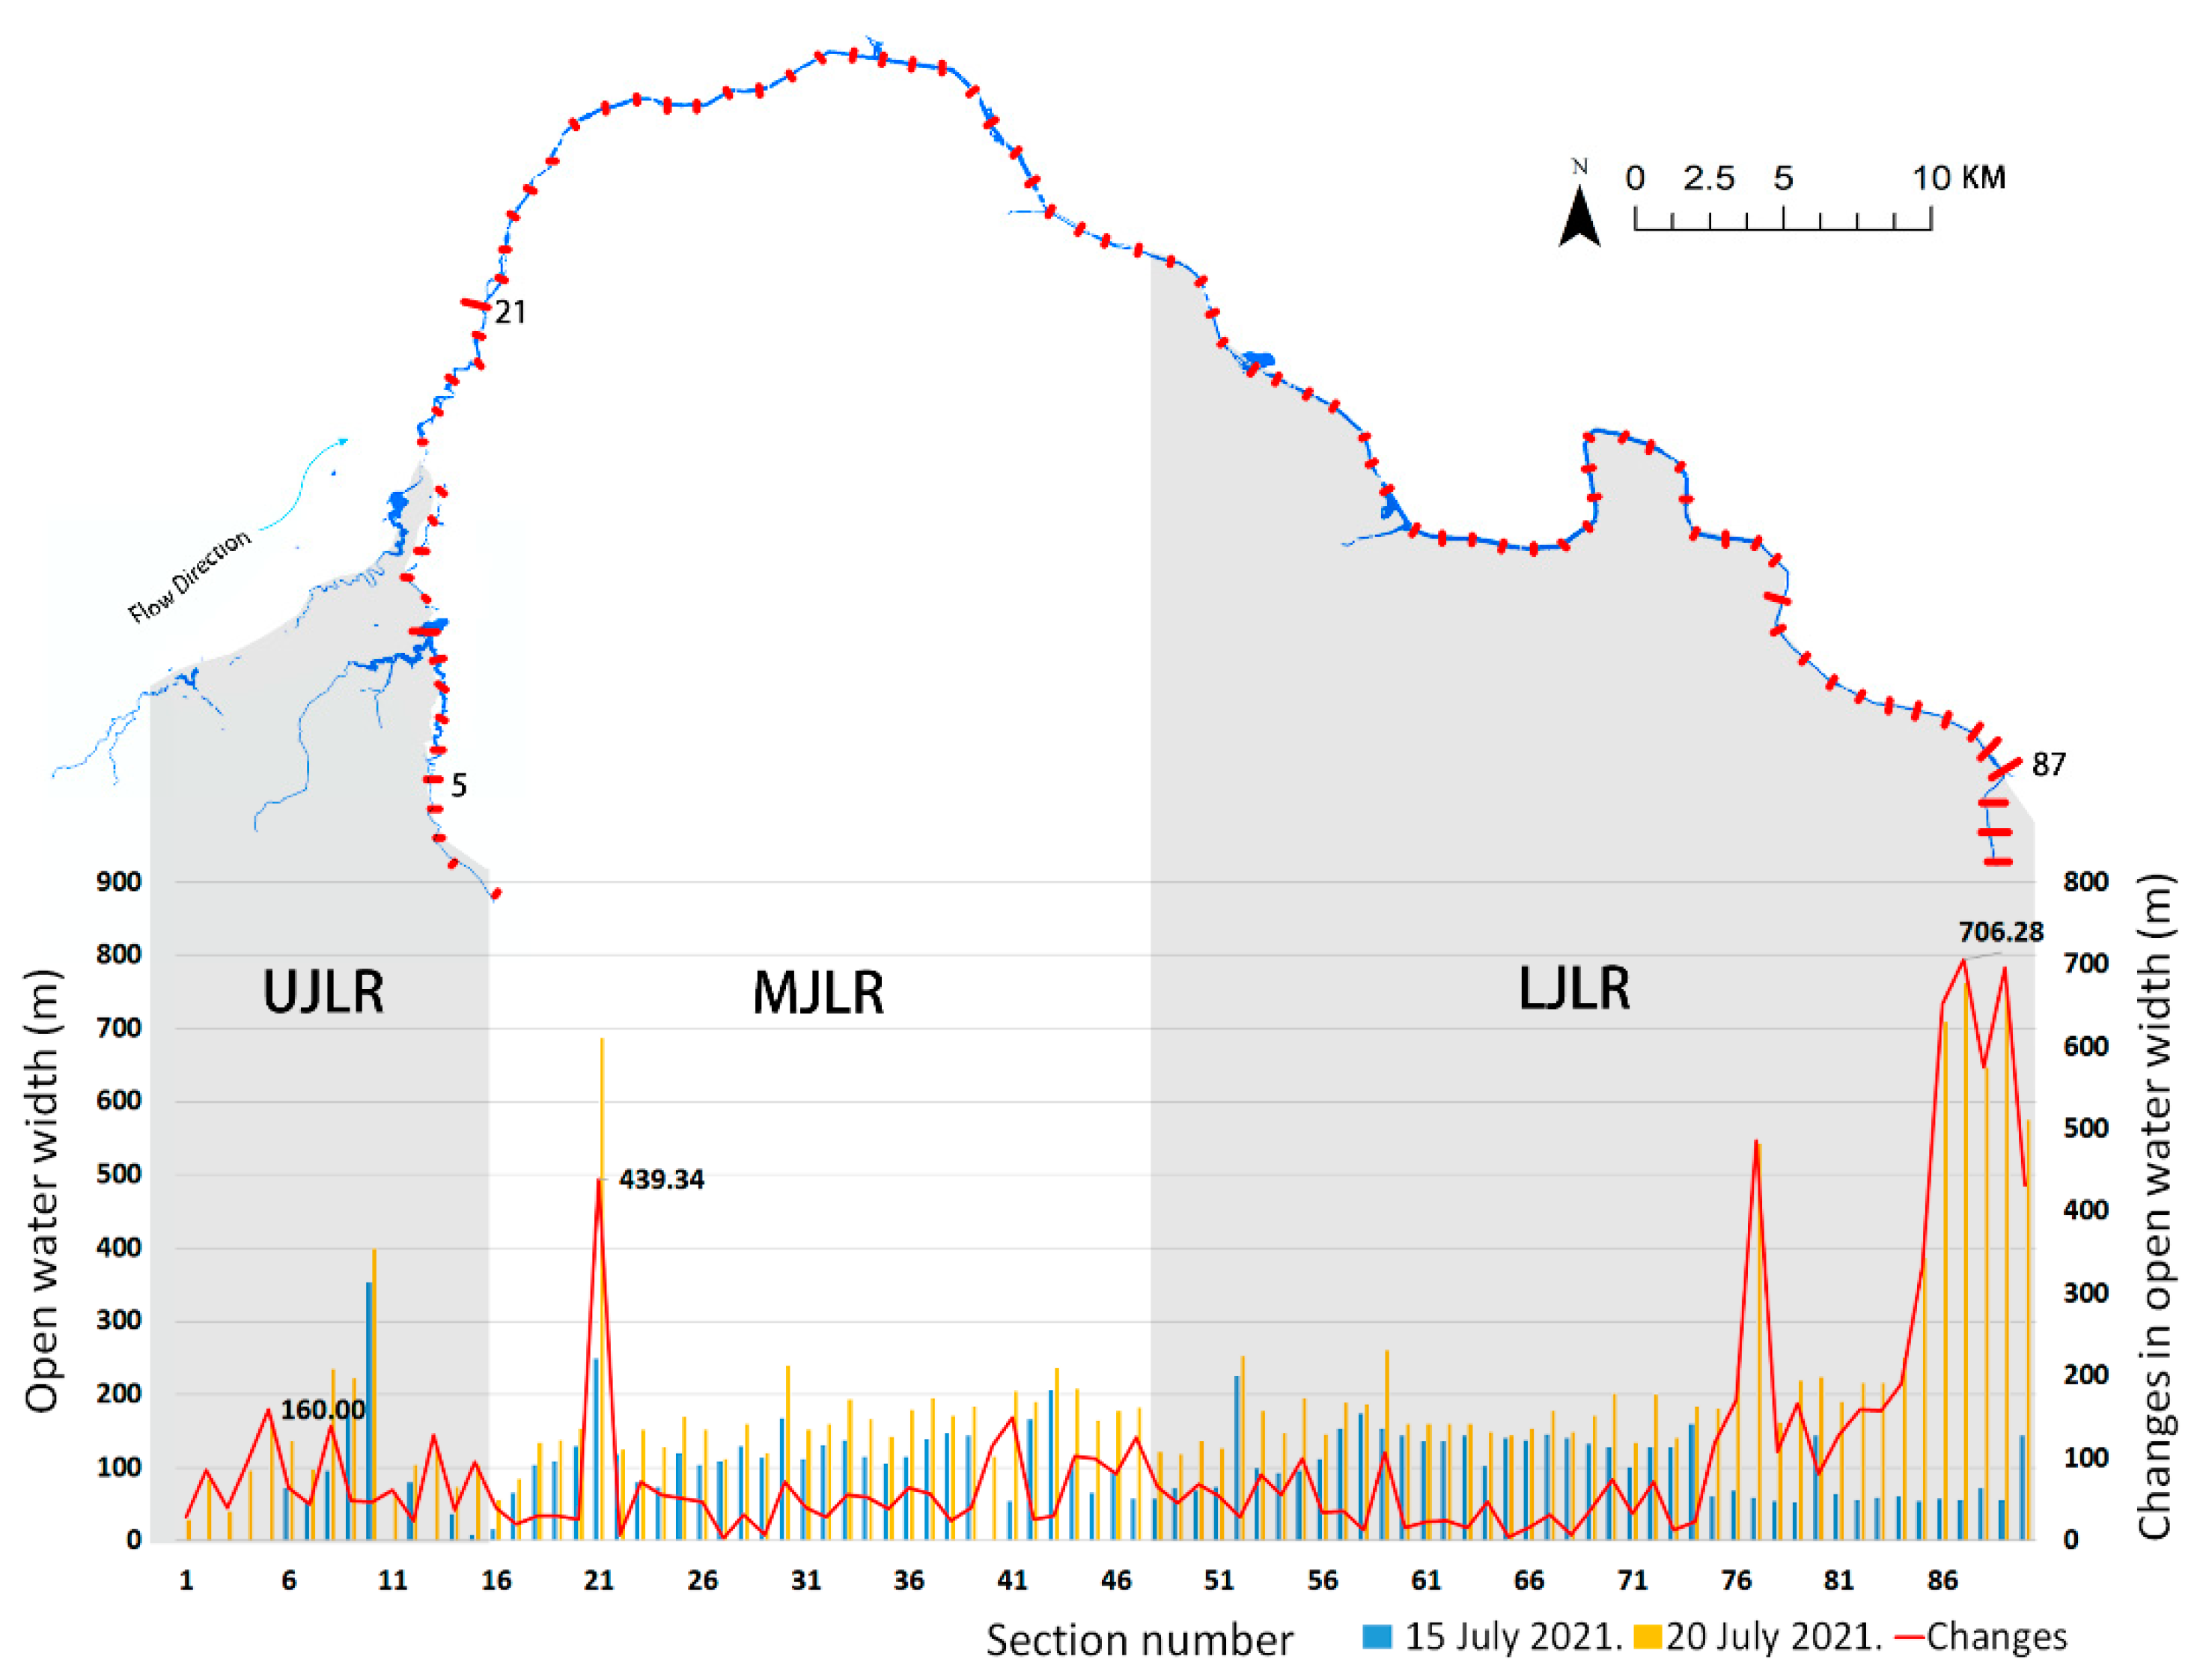
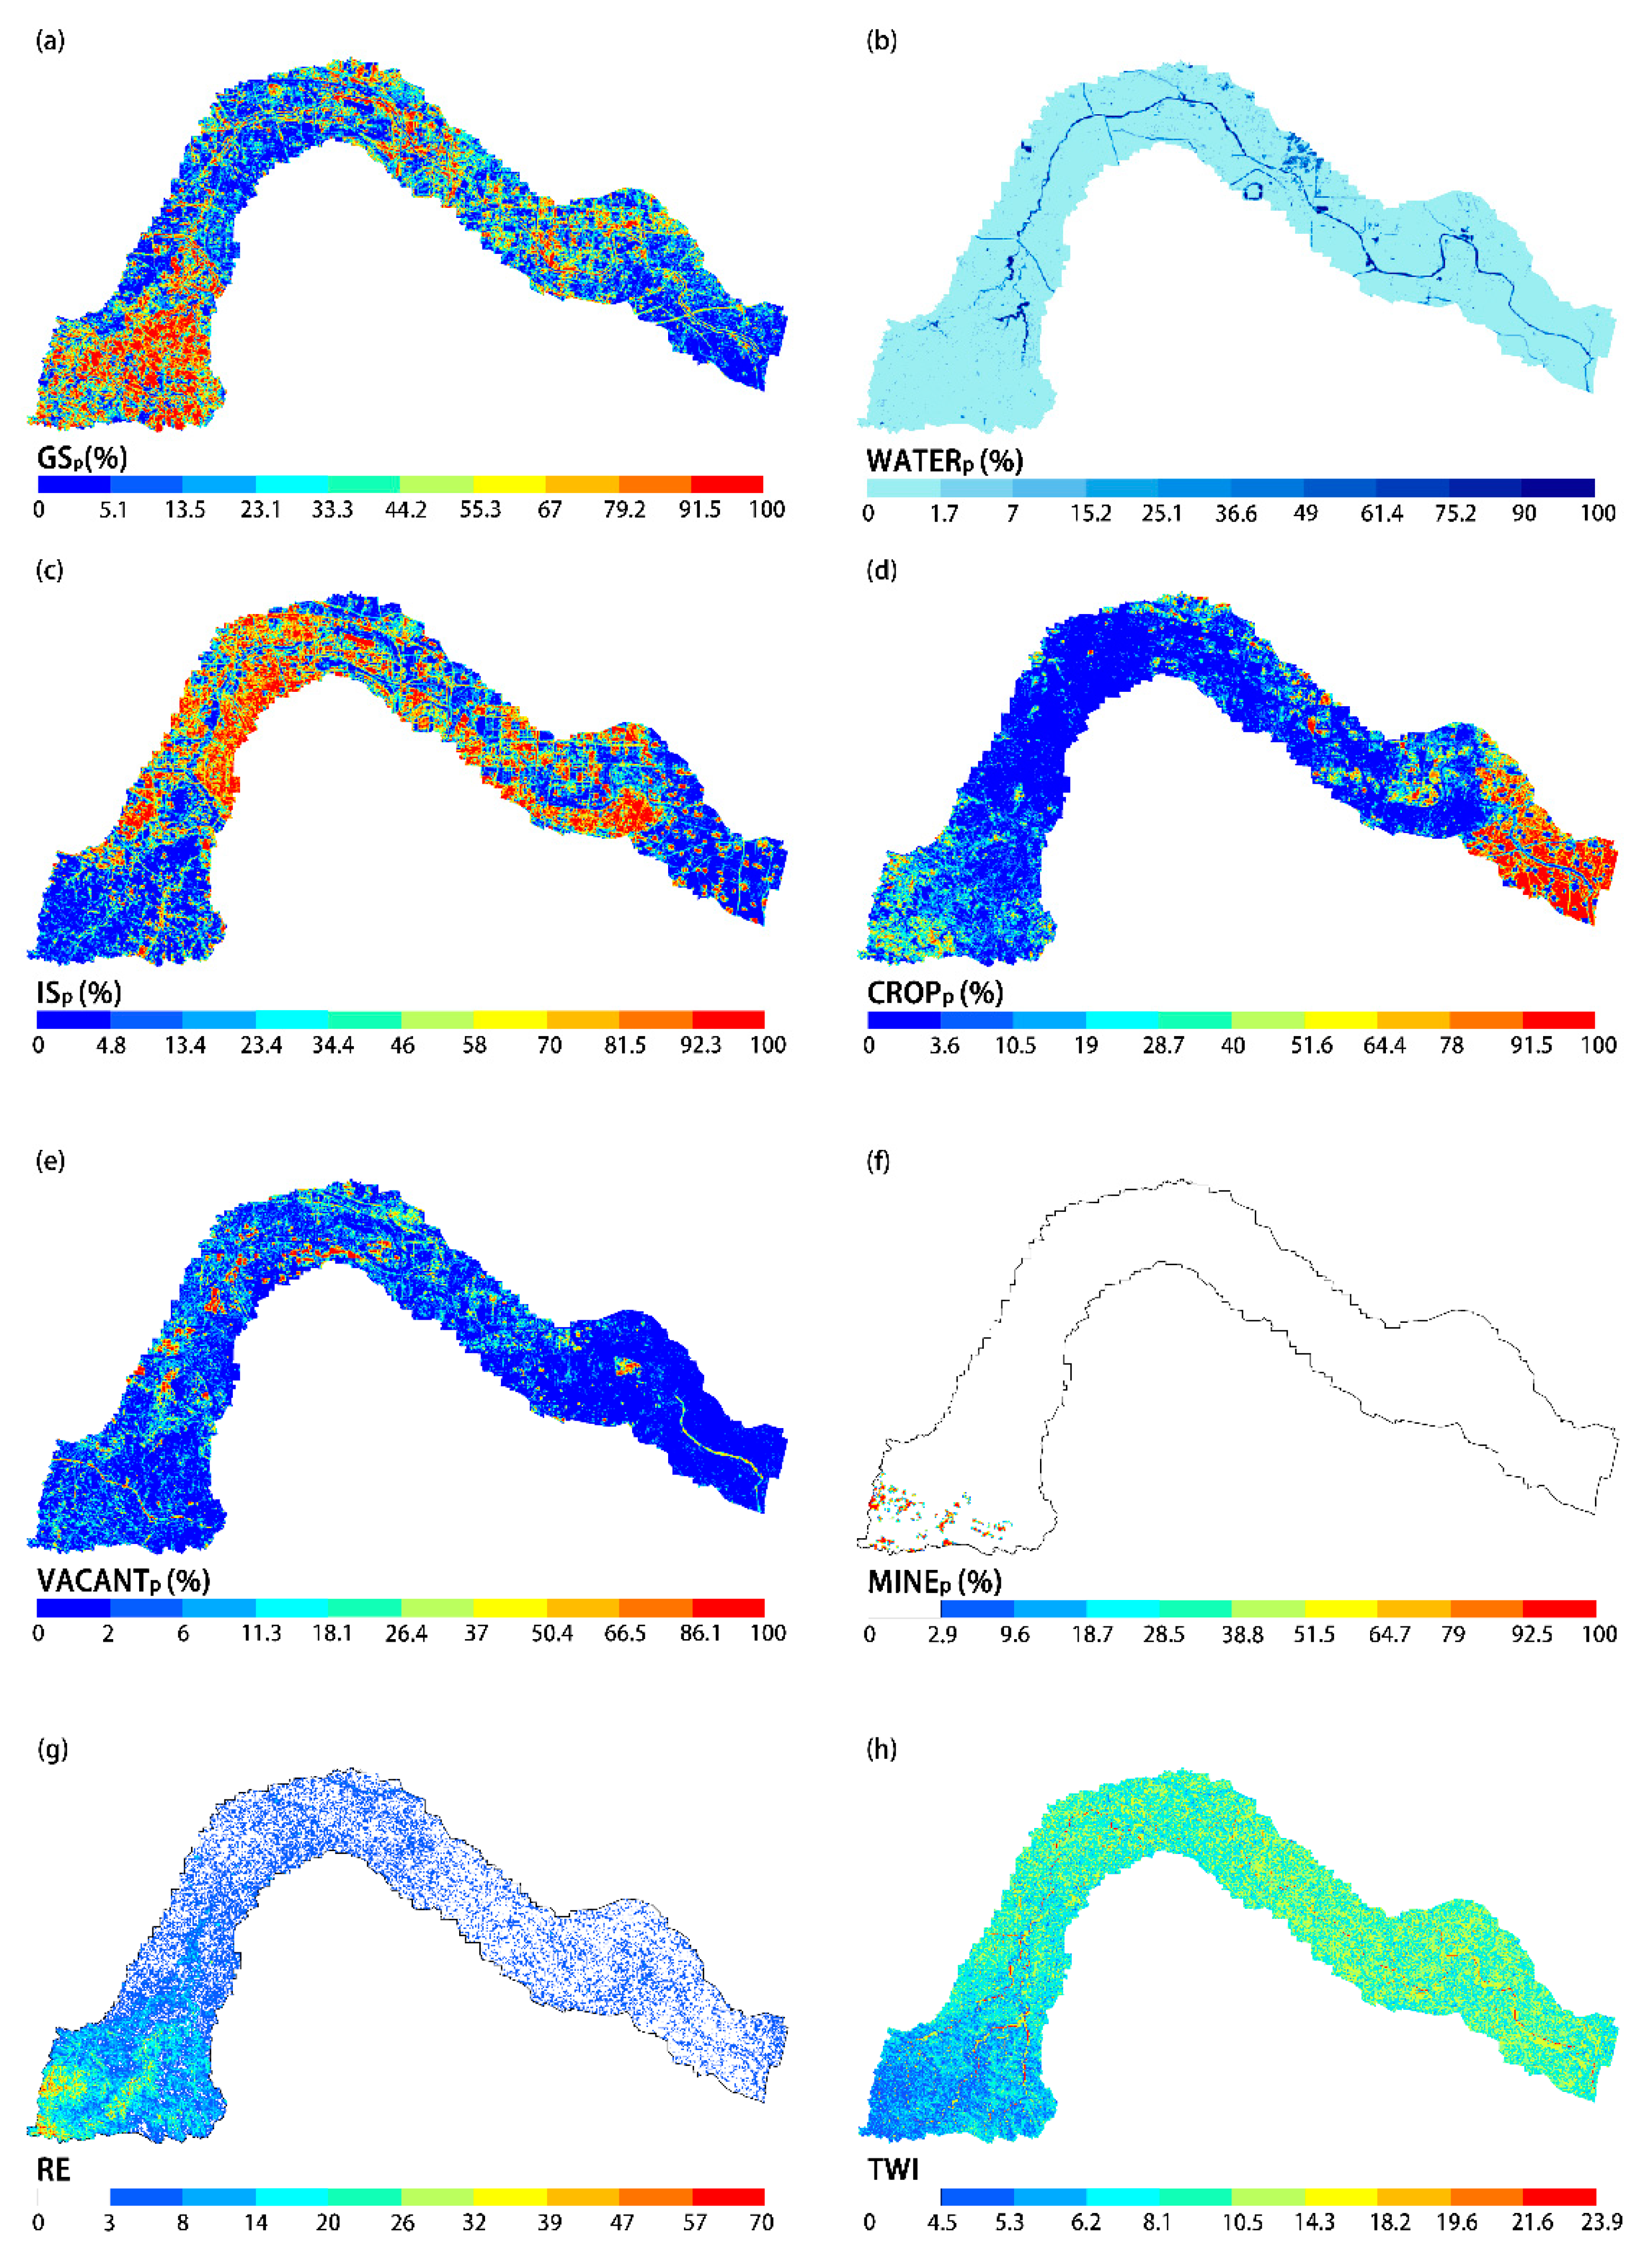
3.2. Landscape Characteristics of the Jialu River System

The landscape characteristics metrics showed distinctive spatial heterogeneity among UJLR, MJLR, and LJLR (Figure 6). The average values of GSP in UJLR, MJLR, and LJLR were 50.81%, 29.01%, and 25.57%, respectively. UJLR had more agglomerated greenspace patches with the highest GSP values occurring in forests in mountainous and hilly areas. MJLR and LJLR had smaller, more fragmented, and irregularly shaped greenspace patches with the highest GSP values occurring in the form of riverfront green spaces and urban parks. The average values of WATERP in UJLR, MJLR and LJLR were 1.77%, 3.11%, and 3.48%, respectively. The highest WATERP values were concentrated in the form of reservoirs and rivers in UJLR, artificial lakes and rivers in MJLR, and agriculture ponds and rivers in LJLR, respectively.
The average values of ISP in UJLR, MJLR, and LJLR were 26.68%, 52.87%, and 34.79%, respectively. MJLR exhibited significant spatial continuous distribution patterns while UJLR and LJLR exhibited discrete distribution features. Higher ISP values in UJLR were mainly concentrated around Changzhuang Reservoir and Donglin Lake, which markedly changed the functions (e.g., flood storage and discharge) of river systems.
The average values of VACANTP in UJLR, MJLR, and LJLR were 6.66%, 9.24%, and 3.60%, respectively. Urban expansion in MJLR is turning some of eco-land, farmland, and rural residential land into vacant land for future development. The average value of MINEP was only calculated in the UJLR and was 15% since mine land was only found there. The agglomeration development of mine land also led to increased forest landscape segmentation and degradation of water bodies as shown in reduced surface water area and loss of river branches. The average values of CROPP in UJLR, MJLR, and LJLR were 13.99%, 5.66%, and 32.42%, respectively. Crop land appeared as the dominant landscape of LJLR with a high CROPP value.
The average values of RE in UJLR, MJLR, and LJLR were 11.84, 3.63, and 2.91, respectively. These differences indicate that the elevation within the grid unit fluctuate more significantly in UJLR than in MJLR and LJLR. The average values of TWI in UJLR, MJLR, and LJLR were 6.08, 8.14, and 8.75, respectively. These results indicated a higher runoff potential in both MJLR and LJLR than in UJLR.

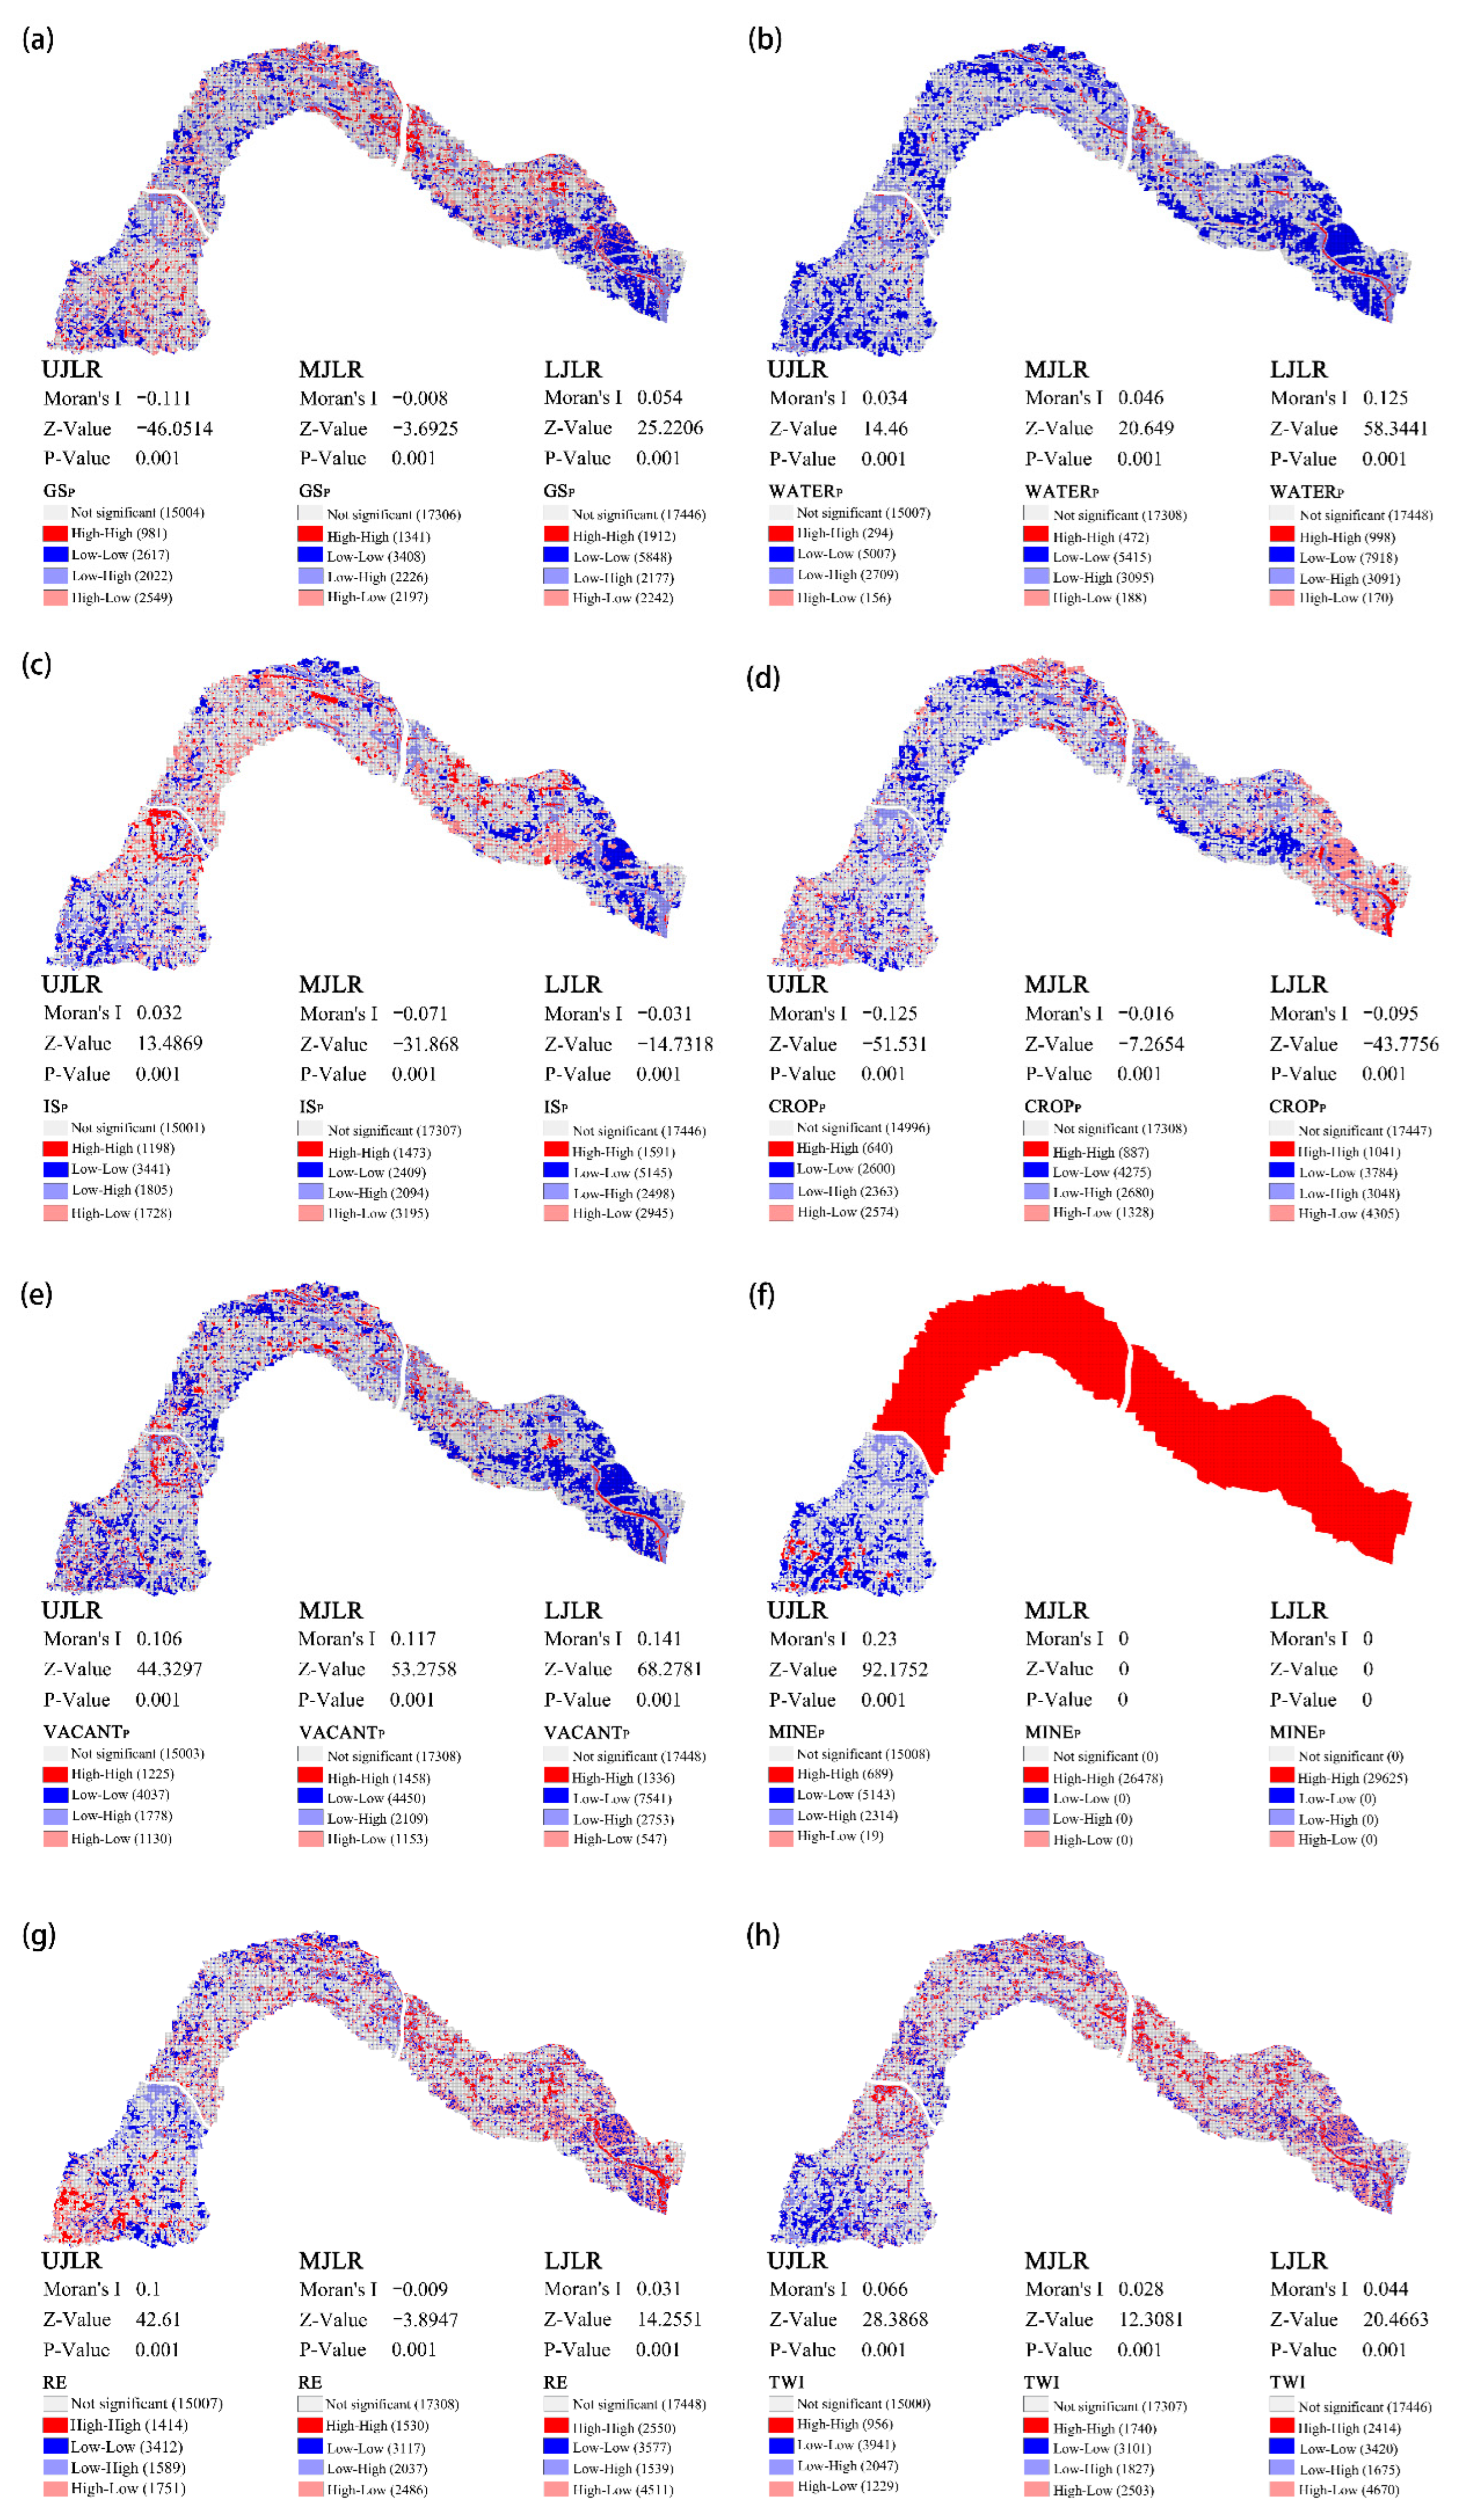
3.3. Correlations between Landscape Characteristics Metrics and Flood Inundation Intensity

Changes in global bivariate Moran’s I values along the entire Jialu River System showed that there were significant positive spatial correlations between WATERP, VACANTP, MINEP, TWI, and FI (all Moran’s I > 0, p-values < 0.01, Table 4), and significant negative spatial correlations between CROPP and FI (all Moran’s I < 0, p-values < 0.01, Table 4). Significant p values were set at 0.01.
ISP, GSP and RE showed a variable correlation with FI along the three regions of the Jialu River. ISP in UJLR showed a significant positive spatial correlation with FI (Moran’s I: 0.032), while significant negative correlations were found in MJLR (Moran’s I: −0.071) and LJLR (Moran’s I: −0.031). Similarly, GSP was negatively correlated with FI at UJLR and MJLR, while it presented a positive correlation at LJLR. RE in MJLR showed a negative correlation with the flood (Moran’s I: −0.009), while a positive correlation was found in UJLR (Moran’s I: 0.1) and LJLR (Moran’s I: 0.031).
Overall, the correlation was strongest between land cover composition and FI (average absolute Moran’s I: 0.106 in UJLR, 0.043 in MJLR, 0.074 in LJLR), followed by those between topographic and FI (average absolute Moran’s I: 0.083 in UJLR, 0.019 in MJLR, 0.038 in LJLR). Moreover, compared the effects of individual landscape characteristics factors on FI based on the Moran’s I values of each land cover type, MINEP, CROPP, GSP, and FI had a relatively stronger correlation than other indexes and FI in UJLR. VACANTP, ISP, WATERP, and FI had a relatively stronger correlation than other indexes and FI in MJLR. VACANTP, WATERP, CROPP, and FI had a relatively stronger correlation than other indexes and FI in LJLR.

3.4. Effects of interactions between Landscape Characteristics Metrics on Flood Inundation Intensity

The “interaction detection” module in GeoDector Model (GDM) was used to determine if all eight variables are independent of each other. Our results showed different degrees of interactions based on the q values generated with GDM (Table 5) The degrees and types of interactions among the variables were shown to be different in UJLR, MJLR, and LJLR. Eventually, bivariate enhancement or nonlinear enhancement were observed for all relationships among the eight metrics, which shows the interaction effect of two factors was greater than the independent effects of either one on flood mitigation.
In UJLR, nonlinear enhancements were observed in 20 pairs out of 28 possible combinations. The top 10 pairs with nonlinear enhancements are VACANTP∩MINEP (0.129), WATERP∩MINEP (0.111), ISP∩MINEP (0.100), CROPP∩GSP (0.082), CROPP∩VACANTP (0.076), GSP∩RE (0.073), VACANTP∩RE (0.068), WATERP∩VACANTP (0.066), VACANTP∩TWI (0.065), and GSP∩TWI (0.063), respectively. Bivariate enhancements were observed in six pairs of 28 possible combinations. The q values of these eight pairs are CROPP∩MINEP (0.104), TWI∩MINEP (0.101), GS∩MINEP (0.099), RE∩MINEP (0.088), GSP∩VACANTP (0.055), CROPP∩WATERP (0.047), CROPP∩TWI (0.046) and WATERP∩TWI (0.042), respectively.
In MJLR, nonlinear enhancements were observed in 19 pairs of out of 21 possible combinations. The top 10 pairs with nonlinear enhancements are WATERP∩VACANTP (0.046), GSP∩WATERP (0.032), ISP∩WATERP (0.031), GSP∩VACANTP (0.030), GSP∩ISP (0.026), CROPP∩WATERP (0.025), VACANTP∩TWI (0.024), VACANTP∩RE (0.023), WATERP∩RE (0.023), and WATERP∩TWI (0.023), respectively. Bivariate enhancements were observed in two pairs of 21 possible combinations. The q values of these two pairs are CROPP∩VACANTP (0.024) and ISP∩VACANTP (0.028), respectively.
In LJLR, nonlinear enhancements were observed in 12 pairs of out of 21 possible combinations. The top 10 pairs with nonlinear enhancements are ISP∩WATERP (0.084), ISP∩VACANTP (0.065), GSP∩VACANTP (0.048), CROPP∩GSP (0.048), ISP∩RE (0.037), ISP∩TWI (0.036), VACANTP∩RE (0.033), CROPP∩TWI (0.032), CROPP∩RE (0.027), and GSP∩TWI (0.023), respectively. Bivariate enhancements were observed in nine pairs of 21 possible combinations. The q values of these nine pairs are WATERP∩VACANTP (0.078), CROPP∩WATERP (0.070), GSP∩WATERP (0.066), WATERP∩TWI (0.055), WATERP∩RE (0.053), CROPP∩ISP (0.049), CROPP∩VACANTP (0.046), GSP∩ISP (0.036), and VACANTP∩TWI (0.034), respectively.

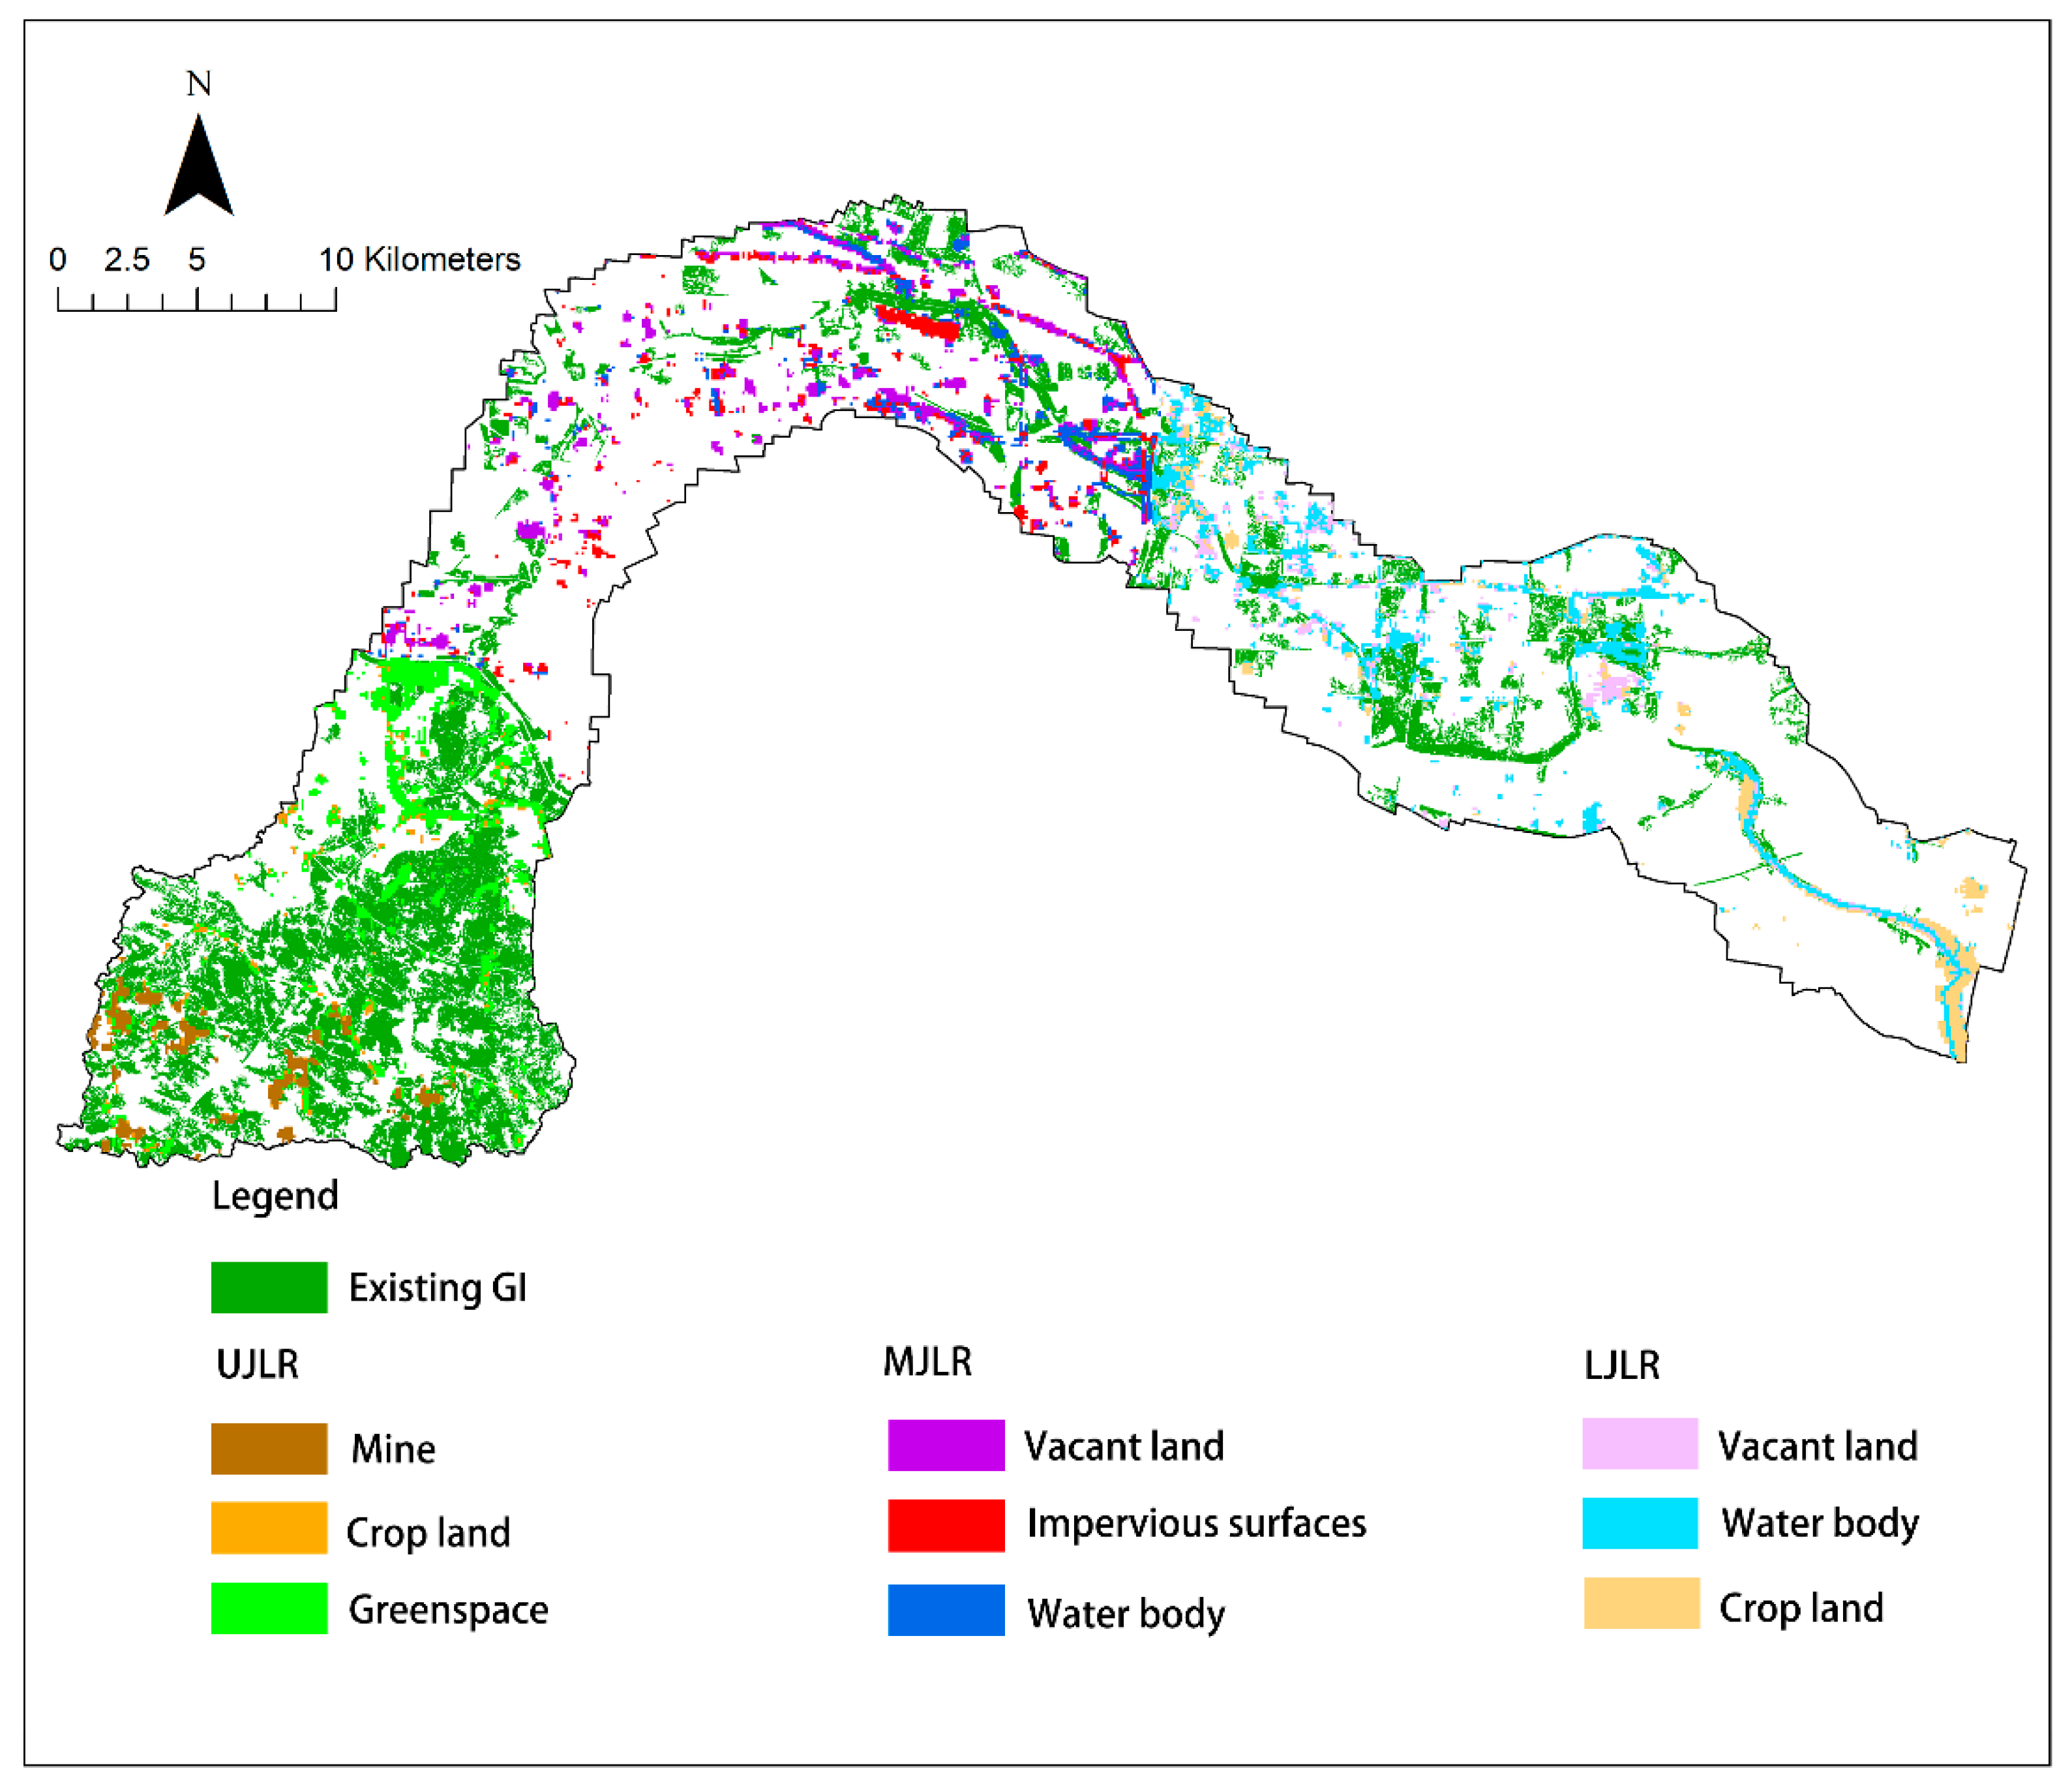
3.5. Green Infrastructure Planning

Five different types of spatial correlations between landscape characteristics indices and flooding inundation intensity indices (FI) are shown as the bivariate LISA maps in Figure 7. They are HH, LH, HL, LL, and non-significance. The areas identified with HH have both high landscape characteristics indices and flood inundation intensity indices, while the areas with LH designations have low landscape characteristics index, but high flood inundation intensity index. The areas identified with HL have both high landscape characteristics indices, but low flood inundation intensity indices while the areas with LL designations have both low landscape characteristics indices and low flood inundation intensity indices. The areas with non-significance designations are those where no significant corrections between landscape characteristics indices and flooding inundation indices were found.
The areas with HH and LH designations as a combined group had more flooding damage than those with the LL and HL. The total percentages of both HH and LH areas are 12.96%, 13.47%, and 13.80% in UJLR, MJLR, and LJLR, respectively. The total percentages of LL and HL areas are 22.29%, 21.16%, and 27.31%.
The areas with HH and LH designations were further segregated by using both global bivariate Moran I values (Table 4) and local bivariate Moran’s I (Figure 7). The top three landscape composition types were then identified for each region of the Jialu river system based on the relative values of the global bivariate Moran’s I correlation coefficients (Figure 8). In UJLR, MINEP, and CROPP, GSP had the highest global bivariate Moran’s I correlation coefficients. In MJLR, VACANTP, and ISP, WATERP had the highest global bivariate Moran’s I correlation coefficients. In LJLR, VACANTP, and WATERP, CROPP had the highest global bivariate Moran’s I correlation coefficients. These top three types or a total of nine were labelled as the “priority types” based these analyses and groupings.

4. Discussion

4.1. Planning Flood Mitigation Efforts in Zhengzhou since 1990s

Extensive flood mitigation projects, such as the construction of dams, levees, retention lakes, reservoirs, dragging and rerouting of the river system, and expansion of gray drainage infrastructure (storm drain network), the deepening and widening of the river system, greening of concrete channels, and addition of green corridors, bioswales, green roofs, and permeable pavements, have been implemented due to rapid urbanization in greater Zhengzhou, starting in the early 1990s. With the rapid rise in the economic importance of Greater Zhengzhou as a manufacturing and transportation hub for China, Zhengzhou Water Resources Bureau developed “Zhengzhou Ecological Water System Planning of 2007” and “Zhengzhou Metropolitan Water System Comprehensive Governance Planning of 2014” to revitalize dynamic fluvial processes through water diversion, deepening and widening of the river system, improvement of connectivity of a water system network and restoration of wetlands. In 2016, “Detailed Control Plans on Jialu River Comprehensive Treatment Project” was the first large-scale government program for the Water System in Greater Zhengzhou. The improvements included systematic dredging and widening of the 96km stretch of Jialu River from Jiangang Reservoir to Zhongmou Dawangzhuang Road, construction of three retention lakes, and massive plantings of green covers along the Jialu River System. Many of the major projects of the 2016 plan were completed in 2018 and have helped prevent several potential floods from 2019 to early 2021.
“The Major Flood Event” in 2021 has completely overwhelmed the flood-mitigating capacity of the Jialu River System and exposed the weaknesses of these flood-controlling projects. However, it may not be realistic to expect the 2016 Plan to completely mitigate the impacts of daily rainfall of 630 mm. Similar floods have also caused disasters in cities in China and other countries. There are limitations to any comprehensive plans due to financial, political, and environmental constraints. However, continuing efforts are still needed to reduce the potential impacts of flooding events.

4.2. Mitigation Strategies for the Upper, Middle and Lower Regions of Jialu River System

Our results showed that the land cover composition plays a more important role in flooding than topographic metrics based on global Moran’s I values. This finding is consistent with the results from several published papers. For example, Hammami et al. [77] selected eight flood-inducing factors, and the results show that land use/land cover constitutes the principal factor in identifying areas, that are susceptible to being submerged by flooding. Wu et al. demonstrated that the SLOPE and DEM contributed to limited flood risk for the Poyang Lake basin [78].
In general, increasing impervious surfaces, vacant land, and mine would cumulate overland flow and exacerbate the occurrence of flood disasters, whereas the increase in greenspace and crop land could favor water infiltration and alleviate flooding dramatically [79]. ISP in UJLR showed a significant positive spatial correlation with FI (Moran’s I: 0.032). This is consistent with other similar studies [80,81] and could be due to the higher elevation and more variable topography in that region. The calculated significant negative correlations between ISP in MJLR (Moran’s I: −0.071) was probably due to the limitation of the satellite images and the complexity of all the impervious surfaces. For examples, our images cannot distinguish the rooftops and roads. In the LJLR, a negative correction (Moran’s I: −0.031) is also misleading since the upper half of the region also had a lot of buildings. Similarly, GSP was negatively correlated with FI at UJLR and MJLR. These findings are consistent with other similar studies [37,82]. A positive correlation between GSP and FI in the LJLR was probably due to the lower elevation of the area and the narrow width of the river channels. Most of the green spaces were located along the riverbanks. The positive correlation between RE and FI in UJLR is inconsistent with other studies [59]. We speculate that numerous mine pits may have skewed the results. A negative correlation between RE and FI in MJLR was obtained from our calculations. This is consistent with other studies. Even though the changes in RE are small in MJLR, the average elevation there is about 10 m higher than LJLR. A positive correlation between RE and FI obtained in LJLR can probably attributed the presence of numerous ponds.
Along the entire Jialu River System, the percent cover of water body area has a relatively large contribution to flood inundation intensity (Moran’s I: 0.034 in UJLR, 0.046 in MJLR, and 0.125 in LJLR), and the larger proportion of water body within the grid unit, the more serious is the flood inundation intensity. The One Hundred Year flood showed that the river channels, lakes, reservoirs, and swamps along the Jialu River may not have adequate capacity to deal with more serious floods [83]. Our results suggest that the enlargement of the water flow capacity of river channels through widening and deepening existing river channels, construction of levees and reservoirs, and engineered channels should always be a part of the overall flood mitigation plan [84,85,86].
Due to their differences in landscape characteristics and distributions of GI along the Jialu River System, the mitigation strategies for the upper, middle, and lower regions of Jialu river are discussed separately.
In UJLR, some of the suggested locations for improvements are those old mines that showed the highest correlation coefficient with FI and have higher RE. Open cut mining cut off the hydrological connection between surface water and groundwater and severely reduced the soil’s water-holding capacity [87]. Reforestation and using the open pits as potential water retention ponds [88] have been mitigation methods in several river systems and are recommended for the upper region of the Jialu River. In addition, other mitigation methods should also be considered since our eight variables were not independent of each other based our interaction detection analyses using GDM. For example, MINEP showed nonlinear enhancements with ISP, VACANTP, and WATERP. In addition, MINEP showed bivariate enhancements with CROPP, GSP, RE, and TWI. A more comprehensive approach taking all variables into account may be a more logical approach. Our results may not tell us exactly how important other factors may be. Additional data and analysis in our future studies are needed to help us answer these questions. The construction of another large reservoir there has been proposed for that area. However, the complex nature of soil structures, enormous costs, and potential environmental impacts have stopped decisionmakers from building one. It is beyond the scope of our study to make that recommendation.
In MJLR, some of the suggested locations for improvements are those currently vacant lands that showed the highest correlation coefficient with FI and have lower RE. Since GDM analyses showed nonlinear enhancements between VACANTP and at least four other variables, and bivariate enhancements with two other variables, specific improvements in other areas will need to be considered in the comprehensive flooding mitigation efforts. In the areas within 500 m river system, improvements to channel-floodplain connectivity [89] by widening and deepening the river channel and installing wetlands where vacant lands are available. Sometimes, some current dams, levies, and dikes may be removed. In Cheonggyecheon, South Korea, dams and levees were removed to create a naturalized stream as a part of de-channelization through establishing a vegetation corridor, an aquatic transitional zone, and install constructed wetlands nearby to support the water source [90]. In Holland, some flood plains along the Rhine System were reconnected by dismantling levees and other riverbank protection works to reduce flooding risks through a more naturalized and dynamic river system [91]. In areas beyond 500m, green infrastructures, such as infiltration swales, bioretention cells, rain gardens, and stormwater parks can be added to vacant lands to mitigate flooding risks [92].
In LRJR, some of the suggested locations for improvements are currently crop lands and water bodies that showed the highest correlation coefficient with FI and have lower RE. However, our variables were not all independent of each other. For example, CROPP showed nonlinear enhancements with at least three other variables, such as GSP, RE, and TWI. WATERP showed nonlinear enhancement with ISP. CROPP showed bivariate enhancement ISP, VACANTP, and WATERP. WATERP showed bivariate enhancement with GSP, RE, TWI, and VACANTP. Considering the interactions of these factors, only addressing crop and water bodies may not solve all of the problems. Since there is a planned development for a Central Technology Hub in this region in the future, we think that careful planning is more critical than ever [93]. In the areas where severe flooding was identified, rice paddies should be a preferred crop over corn and wheat. The severely flooded areas with agriculture ponds should be kept since they can be buffer zones between the Jialu River and new development [94,95].
In LRJR, addition of river channels is planned in 2022 to divert water from the main channel of the Jialu River to its tributaries [96]. These efforts should also have very positive and long-lasting impacts. Similar methods have been used in other cities [97].
A systematic approach will be needed along the entire Jialu River System. These efforts will require a lot of financial resources and political will.

4.3. Limitations of This Study

The objective of our study was to reveal the spatial binary correlation of each factor along the Jialu River. The results of local bivariate Moran’s I were used to visualize local spatial correlations by generating cluster maps (bivariate LISA map). We are hoping that our results can help city planners develop site specific recommendations. The reason that we did not use the geographically weighted regression model (GWR) [98] is because it is better suited for exploring spatial heterogeneity so that users can estimate parameters at any place in the study area, when the spatial coordinates are available. The GWR model is an extension of the general linear regression model, and is typically used to build a linear relationship between a given dependent variable and a set of independent variables. We may try this modeling tool in our future studies.
GaoFen-3 (GF-3) Synthetic Aperture Radar (SAR) images were used for water detection in the “One Hundred Year Flood” on 20 July 2021 in Zhengzhou. Although GF-3 SAR has been validated with high accuracy and timely, it does not monitor inundation risk for underground infrastructures (e.g., metro systems and vehicular tunnels) [99], building underground space [100]. The next step is to quantify the inundation risk of underground space using a 3D modelling system [101] and numerical modelling to improve the accuracy of flood risk in rapid urbanization region. Climate change may affect hydrological processes in a complex and non-linear fashion. In addition to examining the risks of flooding under extreme rainfall events, an urban rainstorm model [102] and a scenario simulation method with different rainfall return periods [103] were applied to supports decision-making for GI planning.

5. Conclusions

“The 20 July 2021 Major Flood Event” in Zhengzhou caused serious damages, property losses, and 380 deaths and missing cases in the entire Jialu River System. Our study revealed a few weak links in flood mitigation planning and implementation. Since UJLR, MJLR, and LJLR are unique in their landscape characteristics, site-specific suggestions or recommendations were developed based on our comprehensive analyses. In UJLR, reforestation and conversion of open pit mines to retention ponds may be one of the suggested improvements to consider. In MJLR, restoration of channel-floodplain connectivity and addition of GI to vacant land are two suggested improvements. In LJLR, keeping or adjusting the agriculture landscape to buffer zones between the river and new development are suggested improvements. Since the percentages of mine, vacant land, water body, and crop land are not independent variables in this study, a more comprehensive approaches taking all factors into consideration would be a more sensible approach. It is important to note that successful flood mitigation planning and implementation efforts require both tremendous political will and vast financial resources. Our recommendations may need further validation. Hydrological modeling and simulation coupled with onsite verifications should help us develop more reliable information for future planning and mitigation efforts to reduce the negative impacts of climate change and rapid urbanization.

Author Contributions

Conceptualization, Y.D. and G.T.; methodology, Y.D. and Y.G.G.; software, Y.D., Y.Z. and Z.Z.; validation, Z.L. and H.L.; formal analysis, Y.D., H.L. and Y.Z.; investigation, Y.D.; resources, Y.L., Y.G.G. and Z.L.; data curation, Y.D.; writing—original draft preparation, Y.D.; writing—review and editing, Y.G.G. and Y.L.; visualization, Y.D. and Y.Z.; supervision, Y.L. and Y.G.G.; project administration, G.T.; funding acquisition, G.T. All authors have read and agreed to the published version of the manuscript.

Funding

This research was funded by the Landscape Architecture in Middle China Disciplinary Innovation and Talents Introduction Centre Program (grant number: CXJD2021004), Urban–Rural Green Space Resources Control and Landscape Ecological Design Disciplinary Innovation and Talents Introduction Centre Program (grant number: GXJD006), National Natural Science Foundation of China (grant number:31600579), Key Technology Program of Henan Province (grant number: 162102310093), National Natural Science Foundation of China (grant number:41501481), and International Cooperation Research Program of Henan Province (grant number: HNGD2021035).

Institutional Review Board Statement

Not applicable.

Informed Consent Statement

Not applicable.

Data Availability Statement

The data presented in this study are available on request from the first author.

Acknowledgments

The authors would like to thank the support of the International Joint Laboratory of Landscape Architecture, Henan Agricultural University for the help.

Conflicts of Interest

The authors declare no conflict of interest.

References

  1. Masson-Delmotte, V.; Zhai, P.; Pirani, A.; Connors, S.L.; Péan, C.; Chen, Y.; Goldfarb, L.; Gomis, M.I.; Matthews, J.B.R.; Berger, S.; et al. IPCC, 2021: Summary for Policymakers. In Climate Change 2021: The Physical Science Basis. Contribution of Working Group I to the Sixth Assessment Report of the Intergovernmental Panel on Climate Change; Cambridge University Press: Cambridge, UK; New York, NY, USA, 2021. [Google Scholar]
  2. Kundzewicz, Z.W.; Kanae, S.; Seneviratne, S.I.; Handmer, J.; Nicholls, N.; Peduzzi, P.; Mechler, R.; Bouwer, L.M.; Arnell, N.; Mach, K. Flood Risk and Climate Change: Global and Regional Perspectives. Hydrol. Sci. J. 2014, 59, 1–28. [Google Scholar] [CrossRef] [Green Version]
  3. Muis, S.; Güneralp, B.; Jongman, B.; Aerts, J.C.J.H.; Ward, P.J. Flood Risk and Adaptation Strategies under Climate Change and Urban Expansion: A Probabilistic Analysis Using Global Data. Sci. Total Environ. 2015, 538, 445–457. [Google Scholar] [CrossRef] [PubMed]
  4. Field, C.B.; Barros, V.; Stocker, T.F.; Qin, D.; Dokken, D.J.; Ebi, K.L.; Mastrandrea, M.D.; Mach, K.J.; Plattner, G.-K.; Allen, S.K.; et al. Managing the Risks of Extreme Events and Disasters to Advance Climate Change Adaptation. A Special Report of Working Groups I and II of the Intergovernmental Panel on Climate Change; Cambridge University Press: Cambridge, UK; New York, NY, USA, 2021. [Google Scholar]
  5. Forzieri, G.; Bianchi, A.; Batista e Silva, F.; Herrera, M.A.M.; Leblois, A.; Lavalle, C.; Aerts, J.C.J.H.; Feyen, L. Escalating Impacts of Climate Extremes on Critical Infrastructures in Europe. Glob. Environ. Chang.-Hum. Policy Dimens. 2018, 48, 97–107. [Google Scholar] [CrossRef] [PubMed]
  6. Myhre, G.; Alterskjaer, K.; Stjern, C.W.; Hodnebrog, O.; Marelle, L.; Samset, B.H.; Sillmann, J.; Schaller, N.; Fischer, E.; Schulz, M.; et al. Frequency of Extreme Precipitation Increases Extensively with Event Rareness under Global Warming. Sci. Rep. 2019, 9, 16063. [Google Scholar] [CrossRef] [Green Version]
  7. Kundzewicz, Z.W.; Su, B.; Wang, Y.; Xia, J.; Huang, J.; Jiang, T. Flood Risk and Its Reduction in China. Adv. Water Resour. 2019, 130, 37–45. [Google Scholar] [CrossRef]
  8. Roy, A.H.; Wenger, S.J.; Fletcher, T.D.; Walsh, C.J.; Ladson, A.R.; Shuster, W.D.; Thurston, H.W.; Brown, R.R. Impediments and Solutions to Sustainable, Watershed-Scale Urban Stormwater Management: Lessons from Australia and the United States. Environ. Manag. 2008, 42, 344–359. [Google Scholar] [CrossRef]
  9. Carvalho, L.; Mackay, E.B.; Cardoso, A.C.; Baattrup-Pedersen, A.; Birk, S.; Blackstockf, K.L.; Borics, G.; Borja, A.; Feld, C.K.; Ferreira, M.T.; et al. Protecting and Restoring Europe’s Waters: An Analysis of the Future Development Needs of the Water Framework Directive. Sci. Total Environ. 2019, 658, 1228–1238. [Google Scholar] [CrossRef]
  10. Luo, P.; He, B.; Takara, K.; Xiong, Y.E.; Nouer, D.; Duan, W.; Fukushi, K. Historical Assessment of Chinese and Japanese Flood Management Policies and Implications for Managing Future Floods. Environ. Sci. Policy 2015, 48, 265–277. [Google Scholar] [CrossRef] [Green Version]
  11. The Human Cost of Disasters: An Overview of the Last 20 Years (2000–2019). Available online: https://reliefweb.int/report/world/human-cost-disasters-overview-last-20-years-2000-2019 (accessed on 10 March 2022).
  12. Yan, D.; Liu, J.; Shao, W.; Mei, C. Evolution of Urban Flooding in China. Proc. IAHS 2020, 383, 193–199. [Google Scholar] [CrossRef]
  13. Wang, Y.; Xie, X.; Liang, S.; Zhu, B.; Yao, Y.; Meng, S.; Lu, C. Quantifying the Response of Potential Flooding Risk to Urban Growth in Beijing. Sci. Total Environ. 2020, 705, 135868. [Google Scholar] [CrossRef]
  14. Wu, H.-L.; Cheng, W.-C.; Shen, S.-L.; Lin, M.-Y.; Arulrajah, A. Variation of Hydro-Environment during Past Four Decades with Underground Sponge City Planning to Control Flash Floods in Wuhan, China: An Overview. Undergr. Space 2020, 5, 184–198. [Google Scholar] [CrossRef]
  15. Lyu, H.-M.; Wang, G.-F.; Shen, J.S.; Lu, L.-H.; Wang, G.-Q. Analysis and GIS Mapping of Flooding Hazards on 10 May 2016, Guangzhou, China. Water 2016, 8, 447. [Google Scholar] [CrossRef] [Green Version]
  16. U.S. Billion-Dollar Weather and Climate Disasters. Available online: https://www.ncei.noaa.gov/access/billions/ (accessed on 21 May 2022).
  17. Wing, O.E.J.; Lehman, W.; Bates, P.D.; Sampson, C.C.; Quinn, N.; Smith, A.M.; Neal, J.C.; Porter, J.R.; Kousky, C. Inequitable Patterns of US Flood Risk in the Anthropocene. Nat. Clim. Chang. 2022, 12, 156–162. [Google Scholar] [CrossRef]
  18. Thieken, A.H.; Kienzler, S.; Kreibich, H.; Kuhlicke, C.; Kunz, M.; Muehr, B.; Mueller, M.; Otto, A.; Petrow, T.; Pisi, S.; et al. Review of the Flood Risk Management System in Germany after the Major Flood in 2013. Ecol. Soc. 2016, 21, 51. [Google Scholar] [CrossRef]
  19. Hattermann, F.F.; Wortmann, M.; Liersch, S.; Toumi, R.; Sparks, N.; Genillard, C.; Schröter, K.; Steinhausen, M.; Gyalai-Korpos, M.; Máté, K.; et al. Simulation of Flood Hazard and Risk in the Danube Basin with the Future Danube Model. Clim. Serv. 2018, 12, 14–26. [Google Scholar] [CrossRef]
  20. Fitobor, K.; Ulanczyk, R.; Kolecka, K.; Ramm, K.; Wlodarek, I.; Zima, P.; Kalinowska, D.; Wielgat, P.; Mikulska, M.; Antonczyk, D.; et al. Extreme Weather Layer Method for Implementation of Nature-Based Solutions for Climate Adaptation: Case Study SłUpsk. Sci. Total Environ. 2022, 842, 156751. [Google Scholar] [CrossRef]
  21. Lee, Y.; Brody, S.D. Examining the Impact of Land Use on Flood Losses in Seoul, Korea. Land Use Pol. 2018, 70, 500–509. [Google Scholar] [CrossRef]
  22. Li, L.; Bergen, J.M. Green Infrastructure for Sustainable Urban Water Management: Practices of Five Forerunner Cities. Cities 2018, 74, 126–133. [Google Scholar] [CrossRef]
  23. Chang, N.-B.; Lu, J.-W.; Chui, T.F.M.; Hartshorn, N. Global Policy Analysis of Low Impact Development for Stormwater Management in Urban Regions. Land Use Pol. 2018, 70, 368–383. [Google Scholar] [CrossRef]
  24. Investigation Report on “The 20 July 2021” Major Rainstorm Disaster in Zhengzhou, Henan Province, China. Available online: https://www.mem.gov.cn/xw/bndt/202201/t20220121_407106.shtml (accessed on 22 January 2022).
  25. Zhang, K.; Shen, J.; Han, H.; Jia, Y. Urban River Health Analysis of the Jialu River in Zhengzhou City Using the Improved Fuzzy Matter-Element Extension Model. Water 2019, 11, 1190. [Google Scholar] [CrossRef]
  26. Dhakal, K.P.; Chevalier, L.R. Urban Stormwater Governance: The Need for a Paradigm Shift. Environ. Manag. 2016, 57, 1112–1124. [Google Scholar] [CrossRef] [PubMed]
  27. Omitaomu, O.A.; Kotikot, S.M.; Parish, E.S. Planning Green Infrastructure Placement Based on Projected Precipitation Data. J. Environ. Manag. 2021, 279, 111718. [Google Scholar] [CrossRef] [PubMed]
  28. Montz, B.E.; Tobin, G.A. Livin’ Large with Levees: Lessons Learned and Lost. Nat. Hazards Rev. 2008, 9, 150–157. [Google Scholar] [CrossRef]
  29. Ahern, J. From Fail-Safe to Safe-to-Fail: Sustainability and Resilience in the New Urban World. Landsc. Urban Plan. 2011, 100, 341–343. [Google Scholar] [CrossRef] [Green Version]
  30. Eckart, K.; McPhee, Z.; Bolisetti, T. Performance and Implementation of Low Impact Development—A Review. Sci. Total Environ. 2017, 607–608, 413–432. [Google Scholar] [CrossRef] [PubMed]
  31. Li, L.; Collins, A.M.; Cheshmehzangi, A.; Chan, F.K.S. Identifying Enablers and Barriers to the Implementation of the Green Infrastructure for Urban Flood Management: A Comparative Analysis of the UK and China. Urban For. Urban Green. 2020, 54, 126770. [Google Scholar] [CrossRef]
  32. Howe, C.; Mitchell, C. Water Sensitive Cities; IWA Publishing: London, UK, 2012; pp. 29–39. [Google Scholar]
  33. Nguyen, T.T.; Ngo, H.H.; Guo, W.; Wang, X.C.; Ren, N.; Li, G.; Ding, J.; Liang, H. Implementation of a Specific Urban Water Management-Sponge City. Sci. Total Environ. 2019, 652, 147–162. [Google Scholar] [CrossRef]
  34. US EPA. What Is Green Infrastructure? Available online: https://www.epa.gov/green-infrastructure/what-green-infrastructure (accessed on 26 March 2022).
  35. Dige, G.; Eichler, L.; Vermeulen, J.; Ferreira, A.; Rademaekers, K.; Adriaenssens, V.; Kolaszewska, D. Green Infrastructure and Flood Management: Promoting Cost-Efficient Flood Risk Reduction via Green Infrastructure Solutions; European Environment Agency (EEA) Report: Copenhagen K, Denmark, 2017. [Google Scholar]
  36. Wang, J.; Banzhaf, E. Towards a Better Understanding of Green Infrastructure: A Critical Review. Ecol. Indic. 2018, 85, 758–772. [Google Scholar] [CrossRef]
  37. Li, L.; Van Eetvelde, V.; Cheng, X.; Uyttenhove, P. Assessing Stormwater Runoff Reduction Capacity of Existing Green Infrastructure in the City of Ghent. Int. J. Sustain. Dev. World Ecol. 2020, 27, 749–761. [Google Scholar] [CrossRef]
  38. Schuch, G.; Serrao-Neumann, S.; Morgan, E.; Choy, D.L. Water in the City: Green Open Spaces, Land Use Planning and Flood Management—An Australian Case Study. Land Use Pol. 2017, 63, 539–550. [Google Scholar] [CrossRef]
  39. Liao, K.-H. From Flood Control to Flood Adaptation: A Case Study on the Lower Green River Valley and the City of Kent in King County, Washington. Nat. Hazards 2014, 71, 723–750. [Google Scholar] [CrossRef]
  40. Hansen, R.; Rall, E.; Chapman, E.; Rolf, W.; Pauleit, S. Urban Green Infrastructure Planning: A Guide for Practitioners. Green Surge. 2017. Available online: http://greensurge.eu/working-packages/wp5/ (accessed on 26 January 2022).
  41. Ahiablame, L.; Shakya, R. Modeling Flood Reduction Effects of Low Impact Development at a Watershed Scale. J. Environ. Manag. 2016, 171, 81–91. [Google Scholar] [CrossRef] [PubMed]
  42. Zope, P.E.; Eldho, T.I.; Jothiprakash, V. Hydrological Impacts of Land Use-Land Cover Change and Detention Basins on Urban Flood Hazard: A Case Study of Poisar River Basin, Mumbai, India. Nat. Hazards 2017, 87, 1267–1283. [Google Scholar] [CrossRef]
  43. Ahmed, S.; Meenar, M.; Alam, A. Designing a Blue-Green Infrastructure (BGI) Network: Toward Water-Sensitive Urban Growth Planning in Dhaka, Bangladesh. Land 2019, 8, 138. [Google Scholar] [CrossRef] [Green Version]
  44. Zhang, Z.; Meerow, S.; Newell, J.P.; Lindquist, M. Enhancing Landscape Connectivity through Multifunctional Green Infrastructure Corridor Modeling and Design. Urban For. Urban Green. 2019, 38, 305–317. [Google Scholar] [CrossRef]
  45. Li, L.; Uyttenhove, P.; Vaneetvelde, V. Planning Green Infrastructure to Mitigate Urban Surface Water Flooding Risk—A Methodology to Identify Priority Areas Applied in the City of Ghent. Landsc. Urban Plan. 2020, 194, 103703. [Google Scholar] [CrossRef]
  46. Shen, Z.; Hou, X.; Li, W.; Aini, G. Relating Landscape Characteristics to Non-Point Source Pollution in a Typical Urbanized Watershed in the Municipality of Beijing. Landsc. Urban Plan. 2014, 123, 96–107. [Google Scholar] [CrossRef]
  47. Veettil, A.V.; Mishra, A.K. Multiscale Hydrological Drought Analysis: Role of Climate, Catchment and Morphological Variables and Associated Thresholds. J. Hydrol. 2020, 582, 124533. [Google Scholar] [CrossRef]
  48. Borah, S.B.; Sivasankar, T.; Ramya, M.N.S.; Raju, P.L.N. Flood Inundation Mapping and Monitoring in Kaziranga National Park, Assam Using Sentinel-1 SAR Data. Environ. Monit. Assess. 2018, 190, 520. [Google Scholar] [CrossRef]
  49. Zhang, Y.; Wang, Y.; Chen, Y.; Liang, F.; Liu, H. Assessment of Future Flash Flood Inundations in Coastal Regions under Climate Change Scenarios—A Case Study of Hadahe River Basin in Northeastern China. Sci. Total Environ. 2019, 693, 133550. [Google Scholar] [CrossRef]
  50. Mu, B.; Mayer, A.L.; He, R.; Tian, G. Land Use Dynamics and Policy Implications in Central China: A Case Study of Zhengzhou. Cities 2016, 58, 39–49. [Google Scholar] [CrossRef]
  51. Population by Year—Zhengzhou Bureau of Statistics. Available online: http://tjj.zhengzhou.gov.cn/ndsj/3134558.jhtml (accessed on 5 January 2022).
  52. Ren, J.; Yang, J.; Zhang, Y.; Xiao, X.; Xia, J.C.; Li, X.; Wang, S. Exploring Thermal Comfort of Urban Buildings Based on Local Climate Zones. J. Clean. Prod. 2022, 340, 130744. [Google Scholar] [CrossRef]
  53. Zhengzhou Water Resources Bulletin on 2020. Available online: http://public.zhengzhou.gov.cn/D12Y/6283515.jhtml (accessed on 5 January 2022).
  54. Martinis, S.; Twele, A.; Voigt, S. Towards Operational near Real-Time Flood Detection Using a Split-Based Automatic Thresholding Procedure on High Resolution TerraSAR-X Data. Nat. Hazards Earth Syst. Sci. 2009, 9, 303–314. [Google Scholar] [CrossRef]
  55. Chung, H.-W.; Liu, C.-C.; Cheng, I.-F.; Lee, Y.-R.; Shieh, M.-C. Rapid Response to a Typhoon-Induced Flood with an SAR-Derived Map of Inundated Areas: Case Study and Validation. Remote Sens. 2015, 7, 11954–11973. [Google Scholar] [CrossRef] [Green Version]
  56. Devrani, R.; Srivastava, P.; Kumar, R.; Kasana, P. Characterization and Assessment of Flood Inundated Areas of Lower Brahmaputra River Basin Using Multitemporal Synthetic Aperture Radar Data: A Case Study from NE India. Geol. J. 2022, 57, 622–646. [Google Scholar] [CrossRef]
  57. Shen, Z.; Xu, X.; Xu, S.; Sun, D. A Comparative Study of Land Development Patterns and Regional Thermal Environments (RTEs) in Typical Urban Agglomerations of China and America: A Case Study of Beijing-Tianjin-Hebei (BTH) and Boswash. Sci. Total Environ. 2022, 803, 149735. [Google Scholar] [CrossRef]
  58. Rajbanshi, J.; Das, S.; Patel, P.P. Planform Changes and Alterations of Longitudinal Connectivity Caused by the 2019 Flood Event on the Braided Brahmaputra River in Assam, India. Geomorphology 2022, 403, 108174. [Google Scholar] [CrossRef]
  59. Zhang, Q.; Wu, Z.; Zhang, H.; Dalla Fontana, G.; Tarolli, P. Identifying Dominant Factors of Waterlogging Events in Metropolitan Coastal Cities: The Case Study of Guangzhou, China. J. Environ. Manag. 2020, 271, 110951. [Google Scholar] [CrossRef]
  60. Miller, J.D.; Brewer, T. Refining Flood Estimation in Urbanized Catchments Using Landscape Metrics. Landsc. Urban Plan. 2018, 175, 34–49. [Google Scholar] [CrossRef] [Green Version]
  61. Peng, Y.; Wang, Q.; Wang, H.; Lin, Y.; Song, J.; Cui, T.; Fan, M. Does Landscape Pattern Influence the Intensity of Drought and Flood? Ecol. Indic. 2019, 103, 173–181. [Google Scholar] [CrossRef]
  62. Bruzzone, L.; Cossu, R.; Vernazza, G. Detection of Land-Cover Transitions by Combining Multidate Classifiers. Pattern Recognit. Lett. 2004, 25, 1491–1500. [Google Scholar] [CrossRef]
  63. Gatis, N.; Carless, D.; Luscombe, D.J.; Brazier, R.E.; Anderson, K. An Operational Land Cover and Land Cover Change Toolbox: Processing Open-Source Data with Open-Source Software. Ecol. Solut. Evid. 2022, 3, e12162. [Google Scholar] [CrossRef]
  64. RStudio Team. RStudio: Integrated Development for R. 2020. Available online: https://www.rstudio.com/ (accessed on 29 August 2021).
  65. Chatzimentor, A.; Apostolopoulou, E.; Mazaris, A.D. A Review of Green Infrastructure Research in Europe: Challenges and Opportunities. Landsc. Urban Plan. 2020, 198, 103775. [Google Scholar] [CrossRef]
  66. Weber, T.; Sloan, A.; Wolf, J. Maryland’s Green Infrastructure Assessment: Development of a Comprehensive Approach to Land Conservation. Landsc. Urban Plan. 2006, 77, 94–110. [Google Scholar] [CrossRef]
  67. Li, W.; Zhou, W.; Bai, Y.; Pickett, S.T.A.; Han, L. The Smart Growth of Chinese Cities: Opportunities Offered by Vacant Land. Land Degrad. Dev. 2018, 29, 3512–3520. [Google Scholar] [CrossRef]
  68. Lei, K.; Pan, H.; Lin, C. A Landscape Approach towards Ecological Restoration and Sustainable Development of Mining Areas. Ecol. Eng. 2016, 90, 320–325. [Google Scholar] [CrossRef]
  69. Tien Bui, D.; Pradhan, B.; Nampak, H.; Bui, Q.-T.; Tran, Q.-A.; Nguyen, Q.-P. Hybrid Artificial Intelligence Approach Based on Neural Fuzzy Inference Model and Metaheuristic Optimization for Flood Susceptibilitgy Modeling in a High-Frequency Tropical Cyclone Area Using GIS. J. Hydrol. 2016, 540, 317–330. [Google Scholar] [CrossRef]
  70. Anselin, L. Local Indicators of Spatial Association—LISA. Geogr. Anal. 1995, 27, 93–115. [Google Scholar] [CrossRef]
  71. Zhou, Y.; Li, X.; Liu, Y. Land Use Change and Driving Factors in Rural China during the Period 1995–2015. Land Use Pol. 2020, 99, 105048. [Google Scholar] [CrossRef]
  72. Anselin, L. Exploring Spatial Data with GeoDaTM: A Workbook; Center for Spatially Integrated Social Science, University of Illinois: Urbana, IL, USA, 2005. [Google Scholar]
  73. Wang, J.; Li, X.; Christakos, G.; Liao, Y.; Zhang, T.; Gu, X.; Zheng, X. Geographical Detectors-Based Health Risk Assessment and Its Application in the Neural Tube Defects Study of the Heshun Region, China. Int. J. Geogr. Inf. Sci. 2010, 24, 107–127. [Google Scholar] [CrossRef]
  74. Hu, D.; Meng, Q.; Zhang, L.; Zhang, Y. Spatial Quantitative Analysis of the Potential Driving Factors of Land Surface Temperature in Different “Centers” of Polycentric Cities: A Case Study in Tianjin, China. Sci. Total Environ. 2020, 706, 135244. [Google Scholar] [CrossRef] [PubMed]
  75. Zhang, T.; Song, H.; Zhou, B.; Wang, L.; Yang, A.; Wang, T.; Kong, H.; Chen, Y.; Zhou, S.; Fu, S. Effects of Air Pollutants and Their Interactive Environmental Factors on Winter Wheat Yield. J. Clean. Prod. 2021, 305, 127230. [Google Scholar] [CrossRef]
  76. Wang, R.; Wang, M.; Zhang, Z.; Hu, T.; Xing, J.; He, Z.; Liu, X. Geographical Detection of Urban Thermal Environment Based on the Local Climate Zones: A Case Study in Wuhan, China. Remote Sens. 2022, 14, 1067. [Google Scholar] [CrossRef]
  77. Hammami, S.; Zouhri, L.; Souissi, D.; Souei, A.; Zghibi, A.; Marzougui, A.; Dlala, M. Application of the GIS Based Multi-Criteria Decision Analysis and Analytical Hierarchy Process (AHP) in the Flood Susceptibility Mapping (Tunisia). Arab. J. Geosci. 2019, 12, 653. [Google Scholar] [CrossRef]
  78. Wu, J.; Chen, X.; Lu, J. Assessment of Long and Short-Term Flood Risk Using the Multi-Criteria Analysis Model with the AHP-Entropy Method in Poyang Lake Basin. Int. J. Disaster Risk Reduct. 2022, 75, 102968. [Google Scholar] [CrossRef]
  79. Li, C.; Liu, M.; Hu, Y.; Zhou, R.; Wu, W.; Huang, N. Evaluating the Runoff Storage Supply-Demand Structure of Green Infrastructure for Urban Flood Management. J. Clean. Prod. 2021, 280, 124420. [Google Scholar] [CrossRef]
  80. Oudin, L.; Salavati, B.; Furusho-Percot, C.; Ribstein, P.; Saadi, M. Hydrological Impacts of Urbanization at the Catchment Scale. J. Hydrol. 2018, 559, 774–786. [Google Scholar] [CrossRef] [Green Version]
  81. Xu, T.; Xie, Z.; Zhao, F.; Li, Y.; Yang, S.; Zhang, Y.; Yin, S.; Chen, S.; Li, X.; Zhao, S.; et al. Permeability Control and Flood Risk Assessment of Urban Underlying Surface: A Case Study of Runcheng South Area, Kunming. Nat. Hazards 2022, 111, 661–686. [Google Scholar] [CrossRef]
  82. Sohn, W.; Bae, J.; Newman, G. Green Infrastructure for Coastal Flood Protection: The Longitudinal Impacts of Green Infrastructure Patterns on Flood Damage. Appl. Geogr. 2021, 135, 102565. [Google Scholar] [CrossRef]
  83. Deng, X.; Xu, Y. Degrading Flood Regulation Function of River Systems in the Urbanization Process. Sci. Total Environ. 2018, 622–623, 1379–1390. [Google Scholar] [CrossRef]
  84. Patel, D.P.; Srivastava, P.K. Flood Hazards Mitigation Analysis Using Remote Sensing and GIS: Correspondence with Town Planning Scheme. Water Resour Manag. 2013, 27, 2353–2368. [Google Scholar] [CrossRef]
  85. Grabs, W. Benchmarking Flood Risk Reduction in the Elbe River. J. Flood Risk Manag. 2016, 9, 335–342. [Google Scholar] [CrossRef] [Green Version]
  86. Serra-Llobet, A.; Jähnig, S.C.; Geist, J.; Kondolf, G.M.; Damm, C.; Scholz, M.; Lund, J.; Opperman, J.J.; Yarnell, S.M.; Pawley, A.; et al. Restoring Rivers and Floodplains for Habitat and Flood Risk Reduction: Experiences in Multi-Benefit Floodplain Management from California and Germany. Front. Environ. Sci. 2022, 9, 778568. [Google Scholar]
  87. McCullough, C.D.; van Etten, E.J.B. Ecological Restoration of Novel Lake Districts: New Approaches for New Landscapes. Mine Water Env. 2011, 30, 312–319. [Google Scholar] [CrossRef] [Green Version]
  88. Zhang, B.; Lu, C.; Wang, J.; Sun, Q.; He, X.; Cao, G.; Zhao, Y.; Yan, L.; Gong, B. Using Storage of Coal-Mining Subsidence Area for Minimizing Flood. J. Hydrol. 2019, 572, 571–581. [Google Scholar] [CrossRef]
  89. Gumiero, B.; Mant, J.; Hein, T.; Elso, J.; Boz, B. Linking the Restoration of Rivers and Riparian Zones/Wetlands in Europe: Sharing Knowledge through Case Studies. Ecol. Eng. 2013, 56, 36–50. [Google Scholar] [CrossRef]
  90. Seo, D.; Kwon, Y. Sustainable Strategies for the Dynamic Equilibrium of the Urban Stream, Cheonggyecheon. IOP Conf. Ser. Earth Environ. Sci. 2018, 143, 012068. [Google Scholar] [CrossRef] [Green Version]
  91. van Vuren, S.; Paarlberg, A.; Havinga, H. The Aftermath of “Room for the River” and Restoration Works: Coping with Excessive Maintenance Dredging. J. Hydro-Environ. Res. 2015, 9, 172–186. [Google Scholar] [CrossRef]
  92. Lee, R.J. Vacant Land, Flood Exposure, and Urbanization: Examining Land Cover Change in the Dallas-Fort Worth Metro Area. Landsc. Urban Plan. 2021, 209, 104047. [Google Scholar] [CrossRef]
  93. Lei, C.; Wang, Q.; Wang, Y.; Han, L.; Yuan, J.; Yang, L.; Xu, Y. Spatially Non-Stationary Relationships between Urbanization and the Characteristics and Storage-Regulation Capacities of River Systems in the Tai Lake Plain, China. Sci. Total Environ. 2022, 824, 153684. [Google Scholar] [CrossRef]
  94. Yi, Y.; Zhang, C.; Zhang, G.; Xing, L.; Zhong, Q.; Liu, J.; Lin, Y.; Zheng, X.; Yang, N.; Sun, H.; et al. Effects of Urbanization on Landscape Patterns in the Middle Reaches of the Yangtze River Region. Land 2021, 10, 1025. [Google Scholar] [CrossRef]
  95. Singh, R.; Tiwari, A.K.; Singh, G.S. Managing Riparian Zones for River Health Improvement: An Integrated Approach. Landsc. Ecol. Eng. 2021, 17, 195–223. [Google Scholar] [CrossRef]
  96. Serra-Llobet, A.; Kondolf, G.M.; Magdaleno, F.; Keenan-Jones, D. Flood Diversions and Bypasses: Benefits and Challenges. WIREs Water 2022, 9, e1562. [Google Scholar] [CrossRef]
  97. Singer, M.B.; Aalto, R.; James, L.A. Status of the Lower Sacramento Valley Flood-Control System within the Context of Its Natural Geomorphic Setting. Nat. Hazards Rev. 2008, 9, 104–115. [Google Scholar] [CrossRef] [Green Version]
  98. Wang, Q.; Xu, Y.; Xu, Y.; Wu, L.; Wang, Y.; Han, L. Spatial Hydrological Responses to Land Use and Land Cover Changes in a Typical Catchment of the Yangtze River Delta Region. CATENA 2018, 170, 305–315. [Google Scholar] [CrossRef]
  99. Wang, G.; Liu, Y.; Hu, Z.; Zhang, G.; Liu, J.; Lyu, Y.; Gu, Y.; Huang, X.; Zhang, Q.; Liu, L. Flood Risk Assessment of Subway Systems in Metropolitan Areas under Land Subsidence Scenario: A Case Study of Beijing. Remote Sens. 2021, 13, 637. [Google Scholar] [CrossRef]
  100. Shin, E.; Kim, H.-J.; Rhee, D.S.; Eom, T.; Song, C.G. Spatiotemporal Flood Risk Assessment of Underground Space Considering Flood Intensity and Escape Route. Nat. Hazards 2021, 109, 1539–1555. [Google Scholar] [CrossRef]
  101. Colombo, L.; Gattinoni, P.; Scesi, L. Stochastic Modelling of Groundwater Flow for Hazard Assessment along the Underground Infrastructures in Milan (Northern Italy). Tunn. Undergr. Space Technol. 2018, 79, 110–120. [Google Scholar] [CrossRef]
  102. Uribe, C.H.A.; Brenes, R.B.; Hack, J. Potential of Retrofitted Urban Green Infrastructure to Reduce Runoff-A Model Implementation with Site-Specific Constraints at Neighborhood Scale. Urban For. Urban Green. 2022, 69, 127499. [Google Scholar] [CrossRef]
  103. Sun, X.; Li, R.; Shan, X.; Xu, H.; Wang, J. Assessment of Climate Change Impacts and Urban Flood Management Schemes in Central Shanghai. Int. J. Disaster Risk Reduct. 2021, 65, 102563. [Google Scholar] [CrossRef]
Figure 1. (a) Location of Zhengzhou, Henan Province, in China; gray lines indicated the boundaries of provinces and territories. (b) Location of Greater Zhengzhou with elevations; red lines indicate the Jialu River, and blue lines indicate the tributaries of the Jialu River. (c) Satellite image of Jialu river system; the area within the red polygon is the demand region, point A indicates the origin of the Jialu river watershed, point B indicates the South-to-North Water Diversion Project points, point C indicates eastern boundary of built-up area of Zhengzhou, and point D indicates the eastern boundary of Greater Zhengzhou.
Land 11 01921 g001
Figure 2. The rainfall patterns from July 19 to 21 2021: (a) rainfall amounts from 0600 UTC 19 to 0600 UTC 20 July 2021; and (b) rainfall amounts from 0600 UTC 20 to 0600 UTC 21 July 2021.
Land 11 01921 g002
Figure 3. Maps of the extent of flood inundation at 10:31 pm on 20 July 2021 in the Jialu River System in greater Zhengzhou, China. The higher flood inundation intensity is shown for ten subsets (AJ) across the study areas.
Land 11 01921 g003
Figure 4. Flood inundation intensity (FI) at 10:31 pm on 20 July 2021 in the Jialu River System in greater Zhengzhou, China.
Land 11 01921 g004
Figure 5. The three regions of the Jialu River from upper to lower, with discerned changes in open water extents from the pre- to post-flood scenarios across each of the transects taken within each region.
Land 11 01921 g005
Figure 6. The spatial distribution of different landscape characteristics metrics levels along the Jialu River in greater Zhengzhou, China. (a) GSp (%); (b) WATERp (%); (c) ISp (%); (d) CROPp (%); (e) VACANTp (%); (f) MINEp (%); (g) RE; (h) TWI.
Land 11 01921 g006
Figure 7. Cluster maps of local bivariate Moran’ I between landscape characteristics indexes of riverfront and flood inundation intensity. (ah) UJLR, MJRL, LJLR.
Land 11 01921 g007
Figure 8. Priority types segregated by using both global bivariate Moran’s I values and local bivariate Moran’s I.
Land 11 01921 g008
Table 1. The overall accuracy and kappa coefficients for the classification.
Overall accuracyKappa coefficient
92%0.88
Producer’s accuracyUser’s accuracy
Greenspace96.34%78.38%
Water body98.27%98.72%
Impervious surfaces89.98%91.61%
Crop land74.31%93.87%
Vacant land81.37%78.58%
Mine99.91%94.52%
Table 2. The classification and description of the land cover composition.
Land Use Categorization Description
Green infrastructure [66]GreenspaceLands for all woodlands, tree resources, and associated vegetation in the urban core, suburb, and exurb data.
Water bodyAreas of open water and lands with water tables at or near the surface for prolonged periods of the year, such as rivers, lakes, canals, and reservoirs.
Impervious surfaces [13] Lands for buildings, parking lots, roads, driveways, and sidewalks. Impervious surfaces have become the most intuitive indicator in the process of urbanization.
Crop land Agriculture includes crops, horticulture, fruit growing, and ponds.
Vacant land [67] Bare without construction structure, empty with some weeds, paved by demolished construction structure.
Mine [68] Open pits after mining.
Table 3. The type of interaction when two factors.
CriterionResult
q ( f 1 f 2 ) < M i n ( q ( f 1 ) , q ( f 2 ) ) Nonlinear weakening
M i n ( q ( f 1 ) , q ( f 2 ) ) < q ( f 1 f 2 ) < M a x ( q ( f 1 ) , q ( f 2 ) ) Univariate weakening
M a x ( q ( f 1 ) , q ( f 2 ) ) < q ( f 1 f 2 ) < q ( f 1 ) + q ( f 2 ) Bivariate enhancement
q ( f 1 f 2 ) = q ( f 1 ) + q ( f 2 ) Independent
q ( f 1 f 2 ) > q ( f 1 ) + q ( f 2 ) Nonlinear enhancement
Table 4. Global bivariate Moran’s I between landscape characteristics indexes and flood inundation intensity along the Jialu River.
Landscape Characteristics IndexesRegionMoran’s I z-Value
UJLR−0.111 *−46.0514
GSPMJLR−0.008 *−3.6925
LJLR0.054 *25.2206
UJLR0.034 *14.46
WATERPMJLR0.046 *20.649
LJLR0.125 *58.3441
UJLR0.032 *13.4869
ISPMJLR−0.071 *−31.868
LJLR−0.031 *−14.7318
UJLR−0.125 *−51.531
CROPPMJLR−0.016 *−7.2654
LJLR−0.095 *−43.7756
UJLR0.106 *44.3297
VACANTPMJLR0.117 *53.2758
LJLR0.141 *68.2781
UJLR0.23 *92.1752
MINEPMJLR00
LJLR00
UJLR0.1 *42.61
REMJLR−0.009 *−3.8947
LJLR0.031 *14.2551
UJLR0.066 *28.3868
TWIMJLR0.028 *12.3081
LJLR0.044 *20.4663
* Indicates p-values < 0.01.
Table 5. Summary of interactive influences of the eight landscape characteristics indexes on flood inundation intensity along the Jialu River.
GSPWATERPISPCROPPVACANTPMINEPRETWI
UJLRGSP0.033
WATERP0.0600.024
ISP0.0510.0330.007
CROPP0.0820.0470.0360.026
VACANTP0.0550.0660.0520.0760.041
MINEP0.0990.1110.1000.1040.1290.084
RE0.0730.0440.0360.0450.0680.0880.018
TWI0.0630.0420.0320.0460.0650.1010.0440.020
MJLRGSP0.007-
WATERP0.0320.022-
ISP0.0260.0310.007-
CROPP0.0160.0250.0120.002-
VACANTP0.0300.0470.0280.0240.023-
MINEP--------
RE0.0080.0230.0090.0050.023-0.000
TWI0.0080.0230.0090.0020.024-0.0010.000
LJLRGSP0.017-
WATERP0.0660.052-
ISP0.0370.0840.031-
CROPP0.0480.0700.0490.024-
VACANTP0.0480.0780.0660.0460.030-
MINEP--------
RE0.0190.0530.0370.0270.033-0.001
TWI0.0230.0550.0360.0320.034-0.0070.004
The values in diagonal are q values of eight stand-alone indexes on flood inundation intensity. □: nonlinear enhanced; ∆: bivariate enhanced.
Publisher’s Note: MDPI stays neutral with regard to jurisdictional claims in published maps and institutional affiliations.

