Applicable Framework for Evaluating Urban Vitality with Multiple-Source Data: Empirical Research of the Pearl River Delta Urban Agglomeration Using BPNN
Abstract
1. Introduction
2. Literature Review and Research Framework
2.1. Built-Up Areas and Methods for Extraction
2.2. The Evaluation of Urban Vitality
2.3. The Framework of Urban Vitality Evaluation
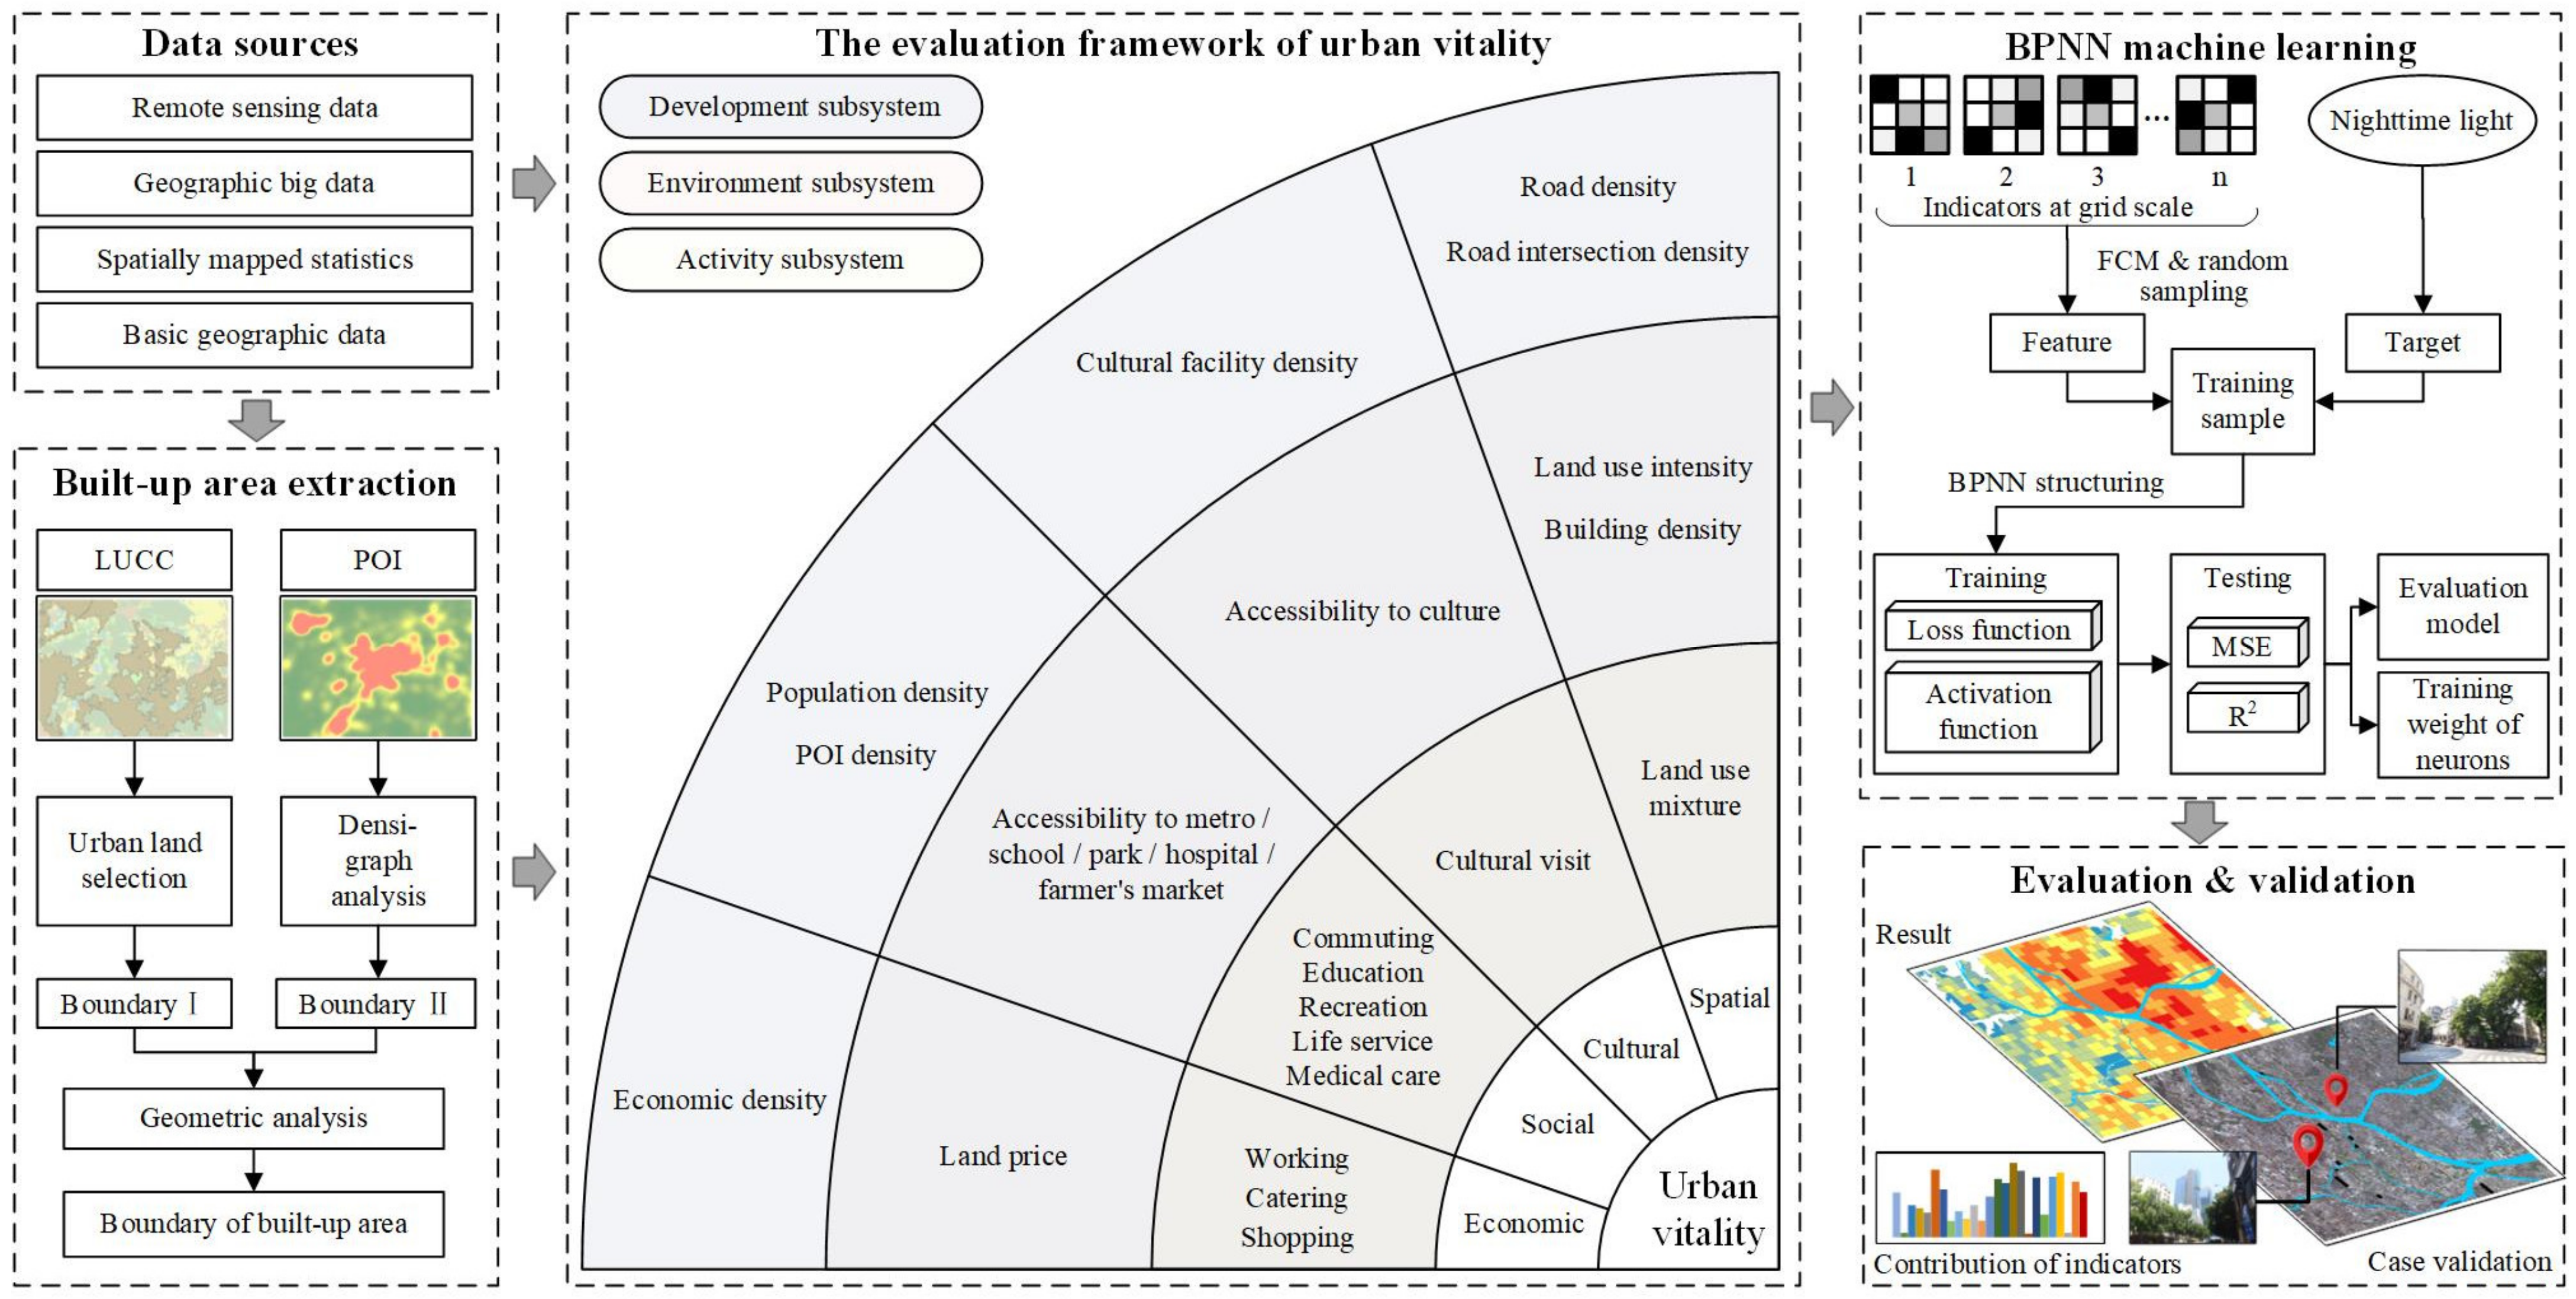
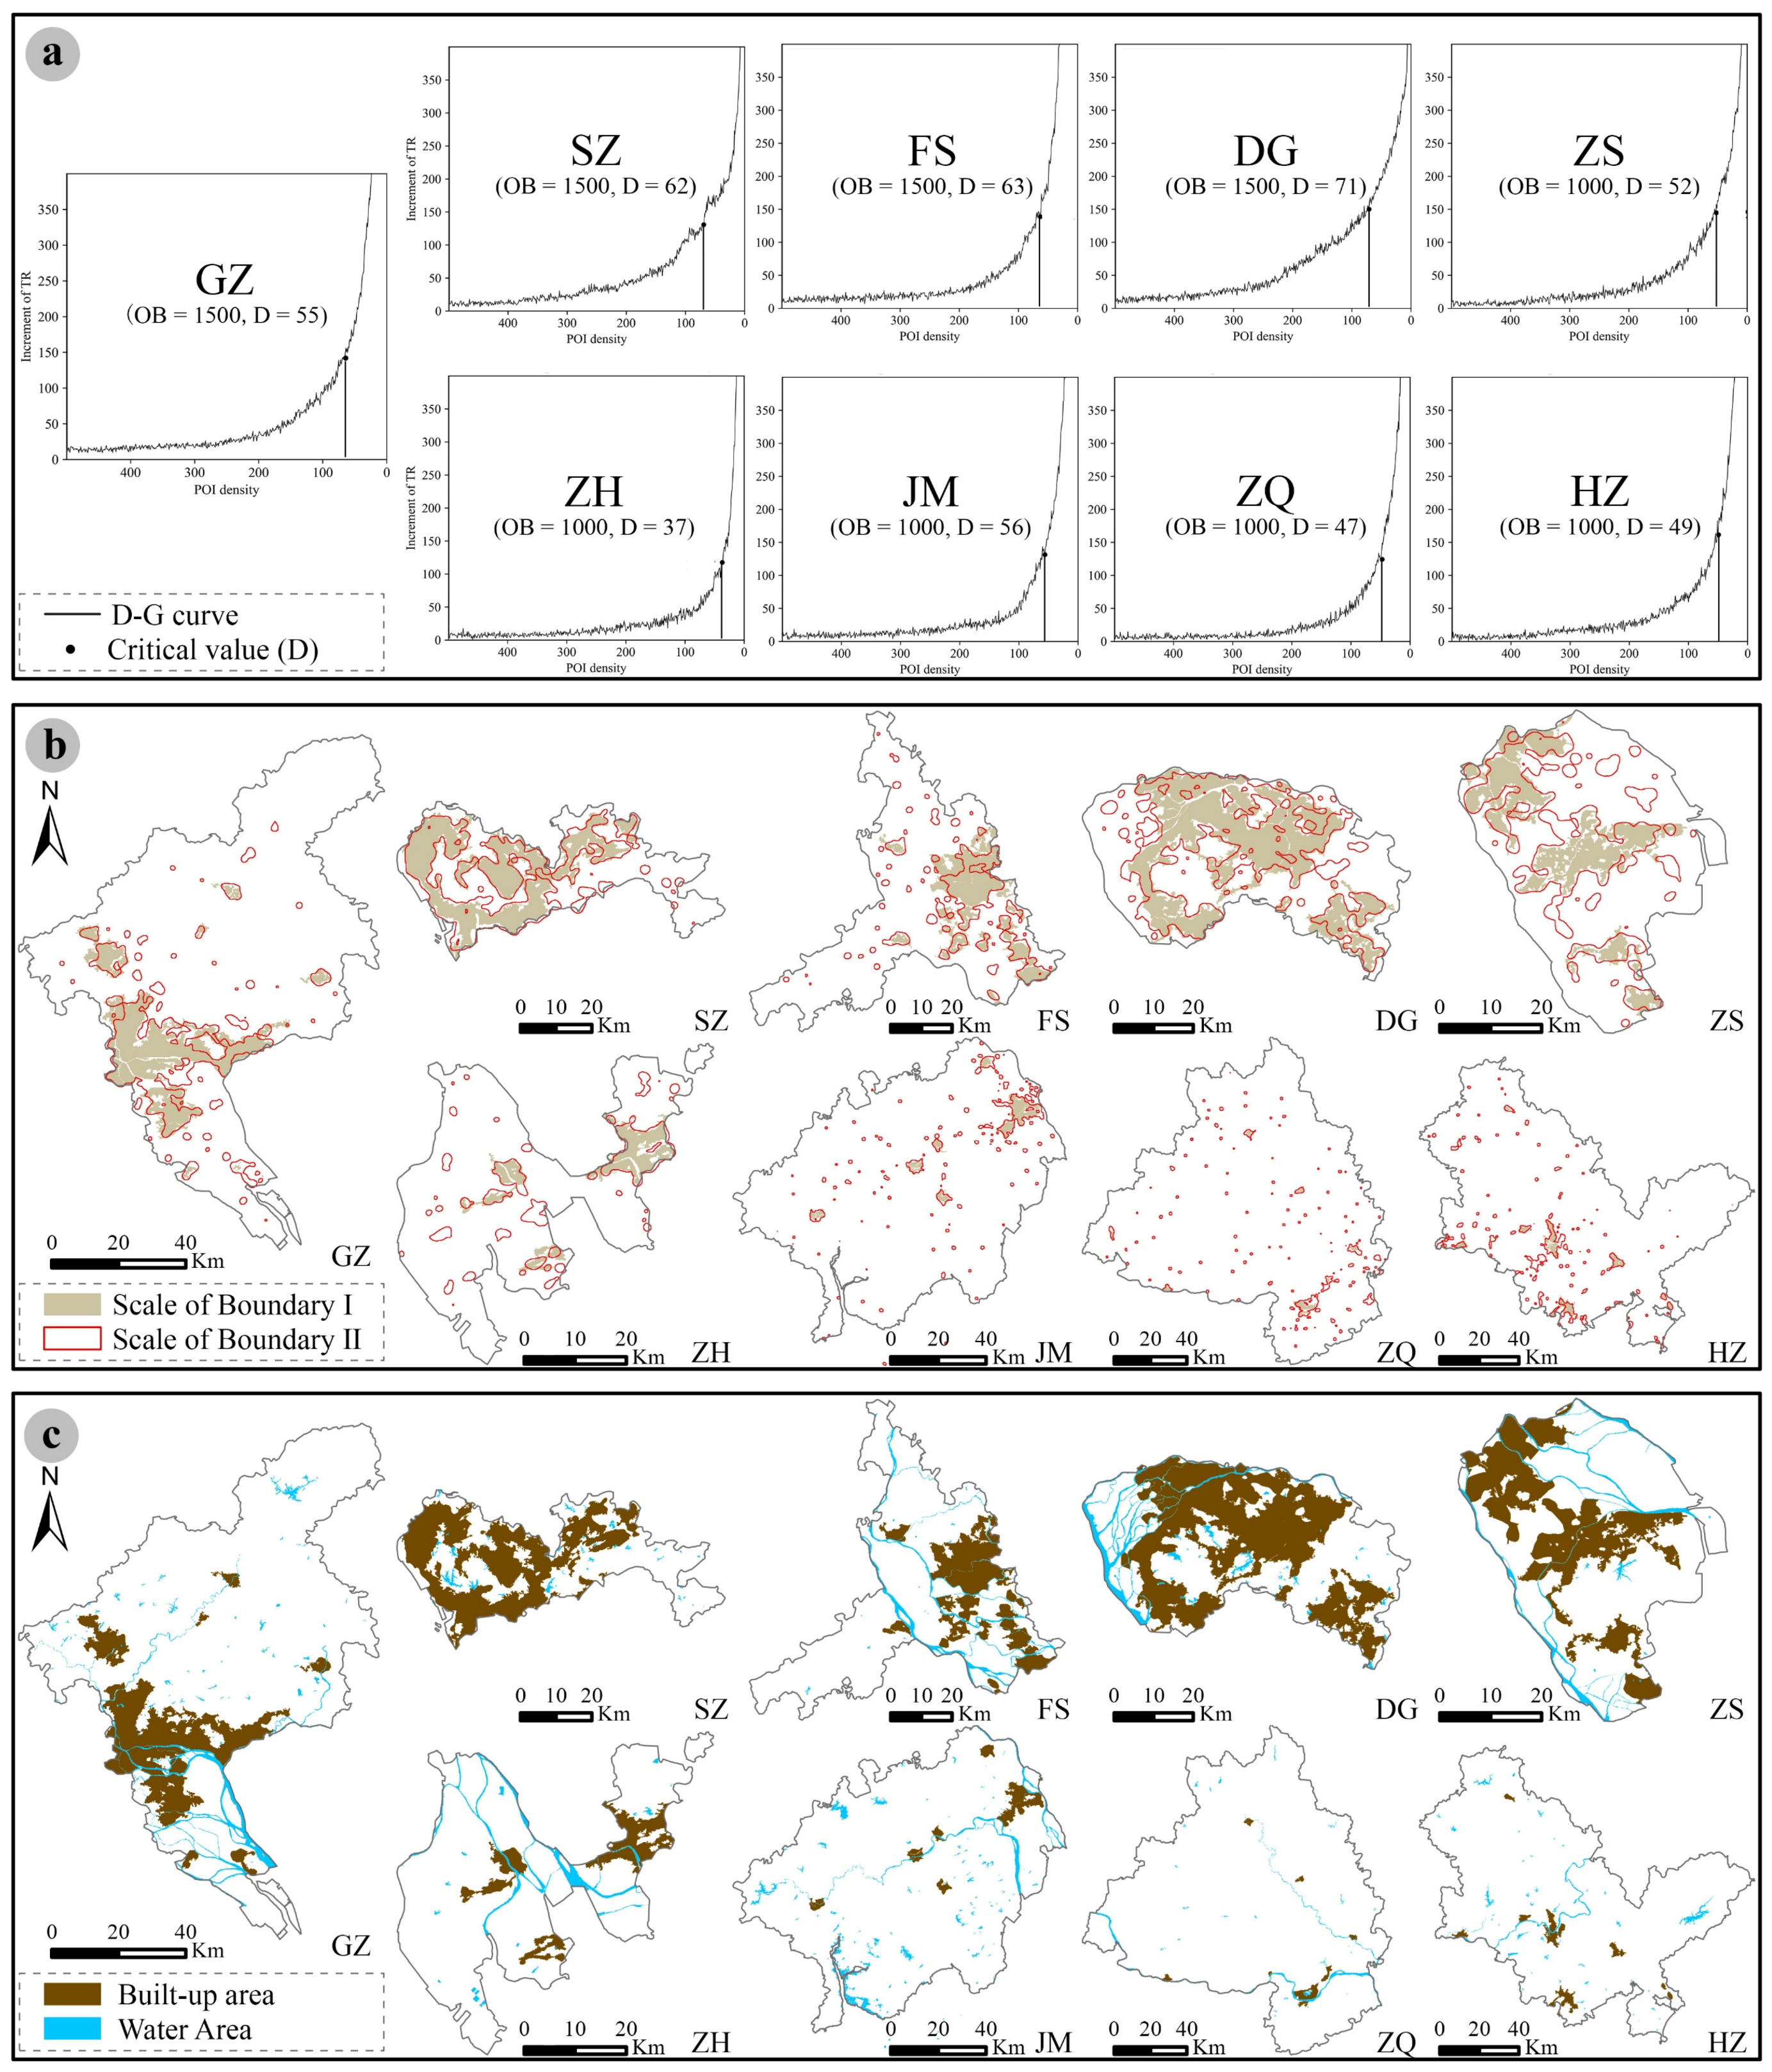
- Built-up area extraction with the fusion method. As the spatial scope of urban vitality, built-up areas were extracted with fusion data. The extraction method is introduced in Section 3.3.
- Evaluation framework construction and indicator quantification. The evaluation framework for urban vitality was combined with the three connecting subsystems: urban development, environment, and activity. Furthermore, each subsystem was split into four dimensions: economic, social, cultural, and spatial. The economic dimension demonstrates the productivity and creativity of the society and guarantees a vibrant city. The social dimension contributes to a livable city with great convenience. The cultural dimension allows ample exposure of citizens to culture. The spatial dimension refers to the material urban space. Representative indicators were selected, and the quantitative methods are detailed in Section 3.4.
- Evaluation of urban vitality using BPNN. Given the complex relationship between urban vitality and the three subsystems, urban vitality generation is a nonlinear process, so we seek innovation in the evaluation tool. How to establish a BPNN can be found in Section 3.5.
- Result analysis and validation. The evaluation outcome and validation are illustrated in Section 4. Whether the framework is effective was confirmed by analyzing the contribution of indicators and validating selected cases.
3. Data and Method
3.1. Study Area: The PRD Urban Agglomeration
3.2. Data Sources
3.3. Identifying the Boundary of Built-Up Areas Using Fusion Method
3.4. Quantifying the Urban Vitality Indicators According to the Evaluation Framework
3.5. Assessing the Urban Vitality Using the BPNN Machine Learning
3.5.1. Data Normalization
3.5.2. Building a Training Sample
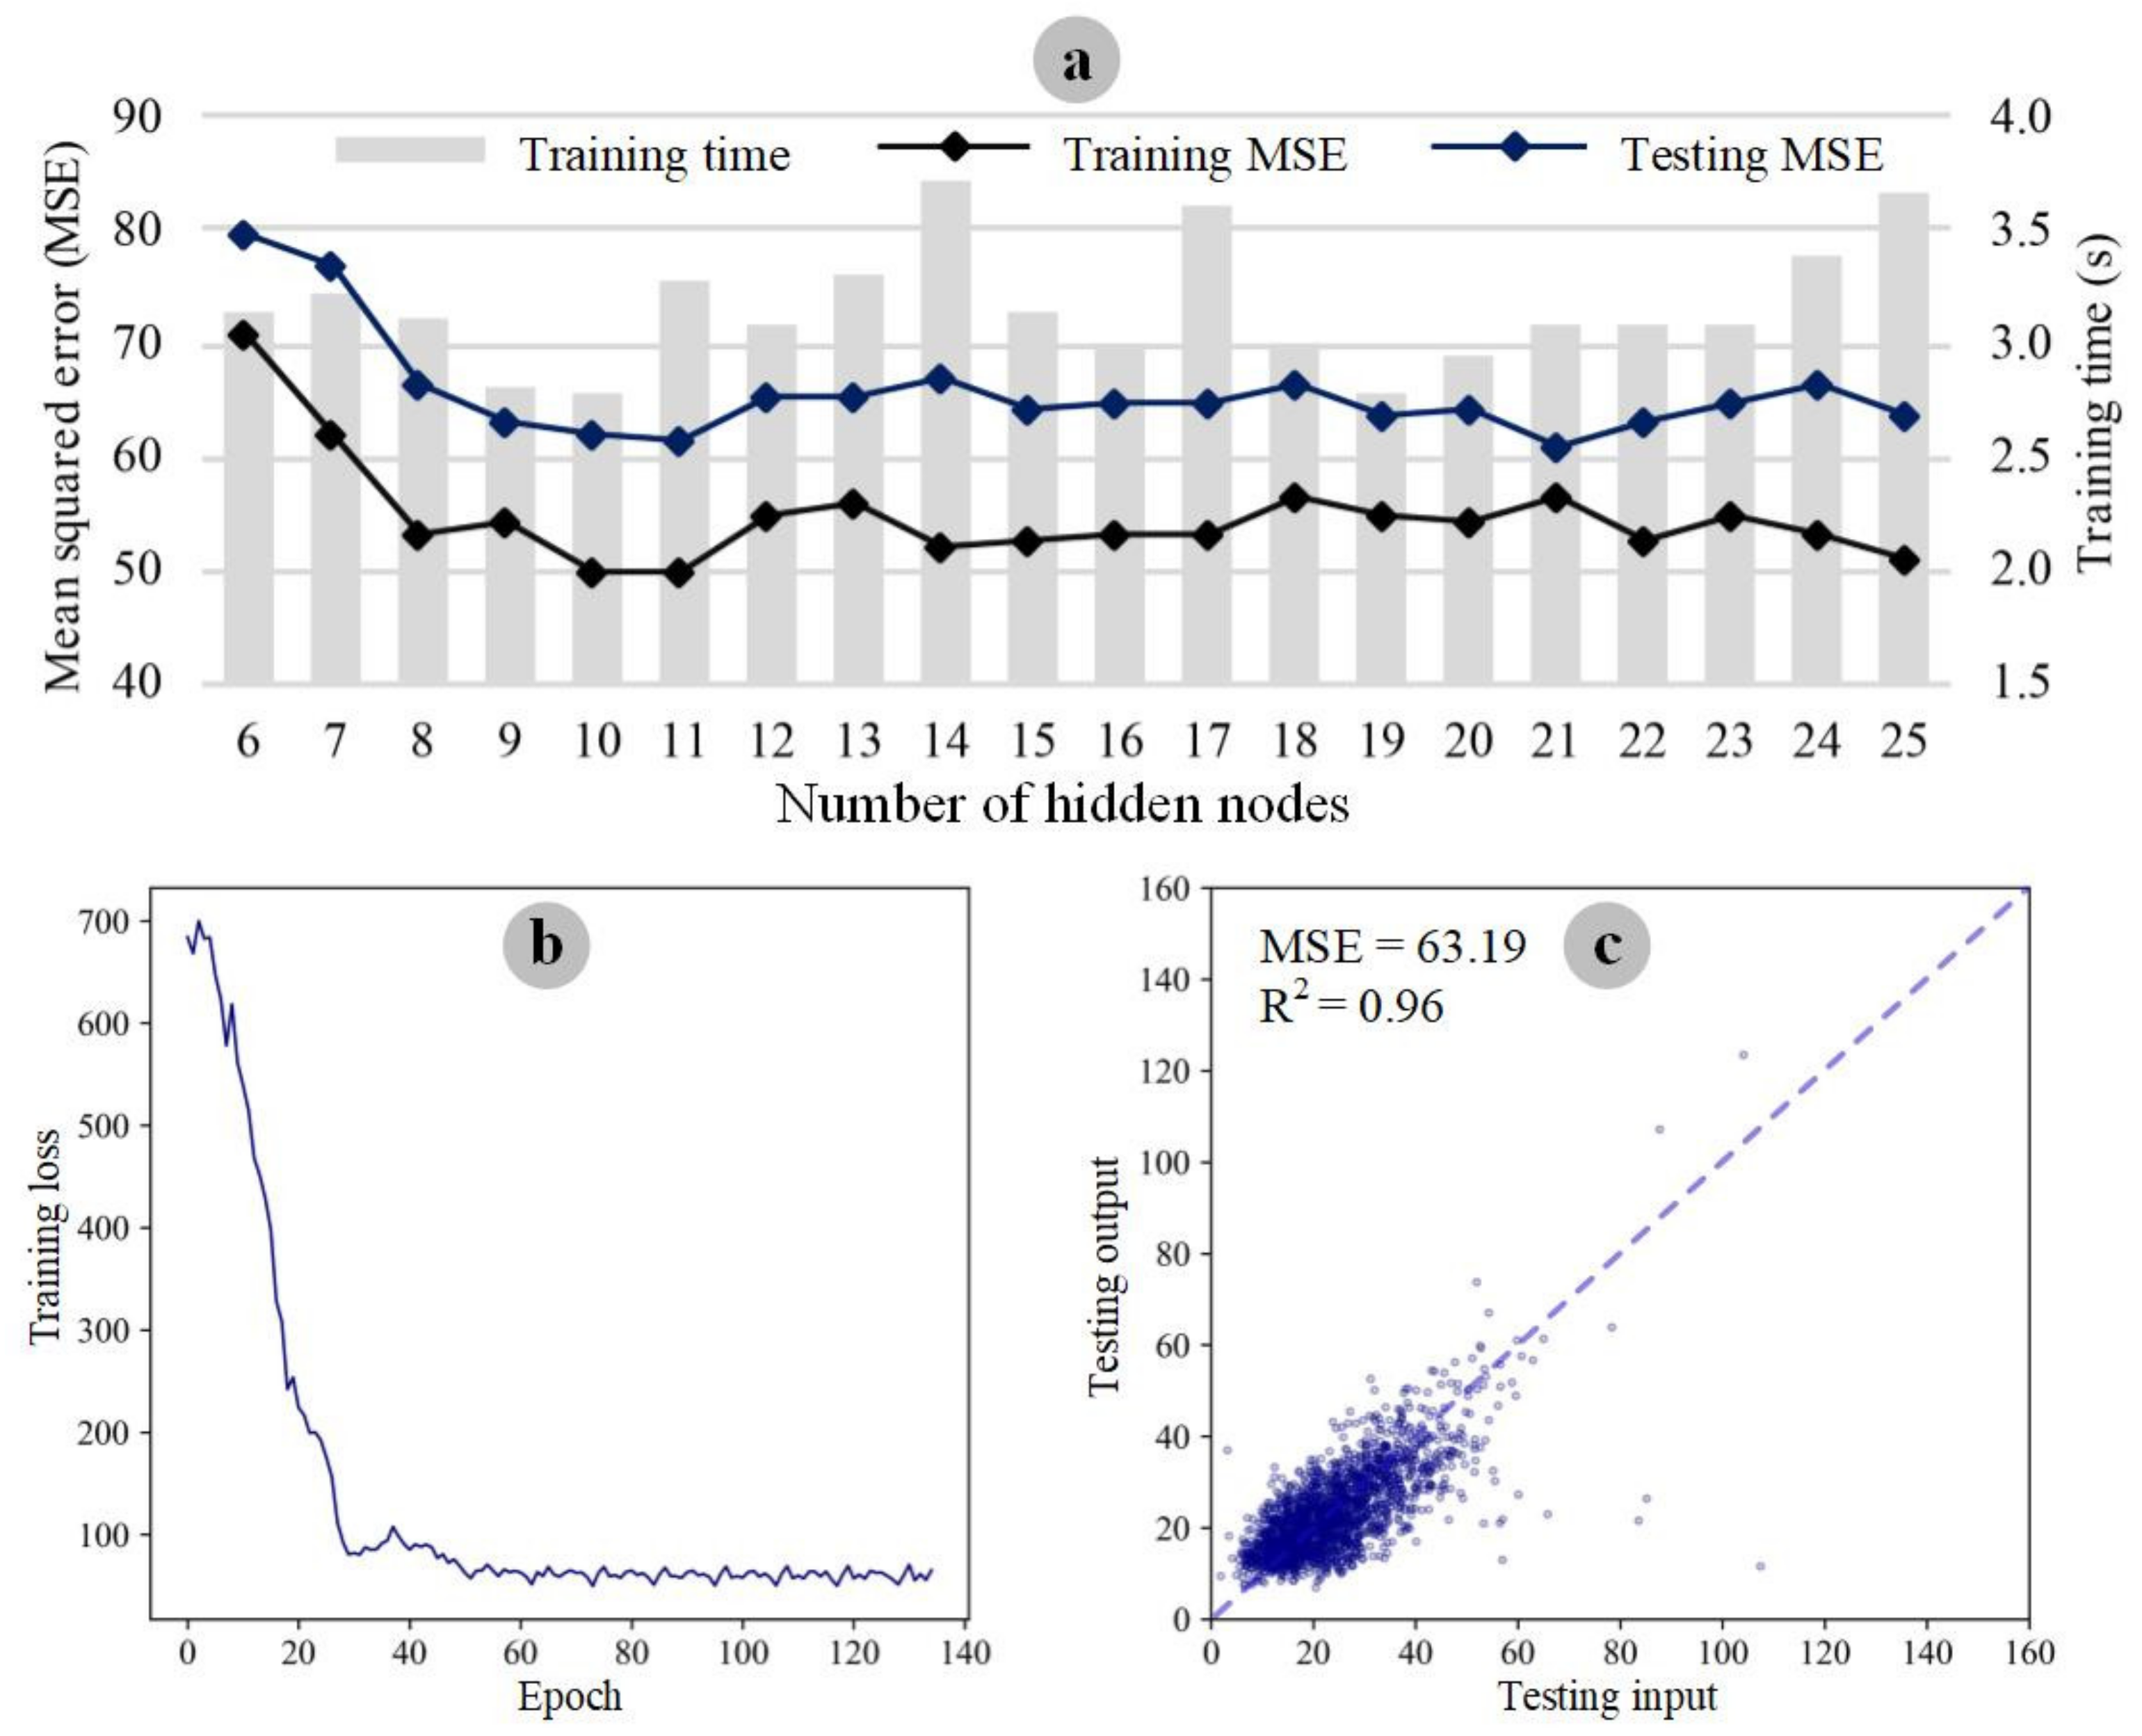
3.5.3. The Structure and Establishment of the BPNN
4. Results and Analysis
4.1. Boundary Identification of the Built-Up Area in the Pearl River Delta
4.2. Vitality Evaluation with the BPNN
4.2.1. Performance of the Model
4.2.2. Vitality Analysis among Cities with Different Scales
4.2.3. Vitality Comparison among Different Types of Built-Up Areas
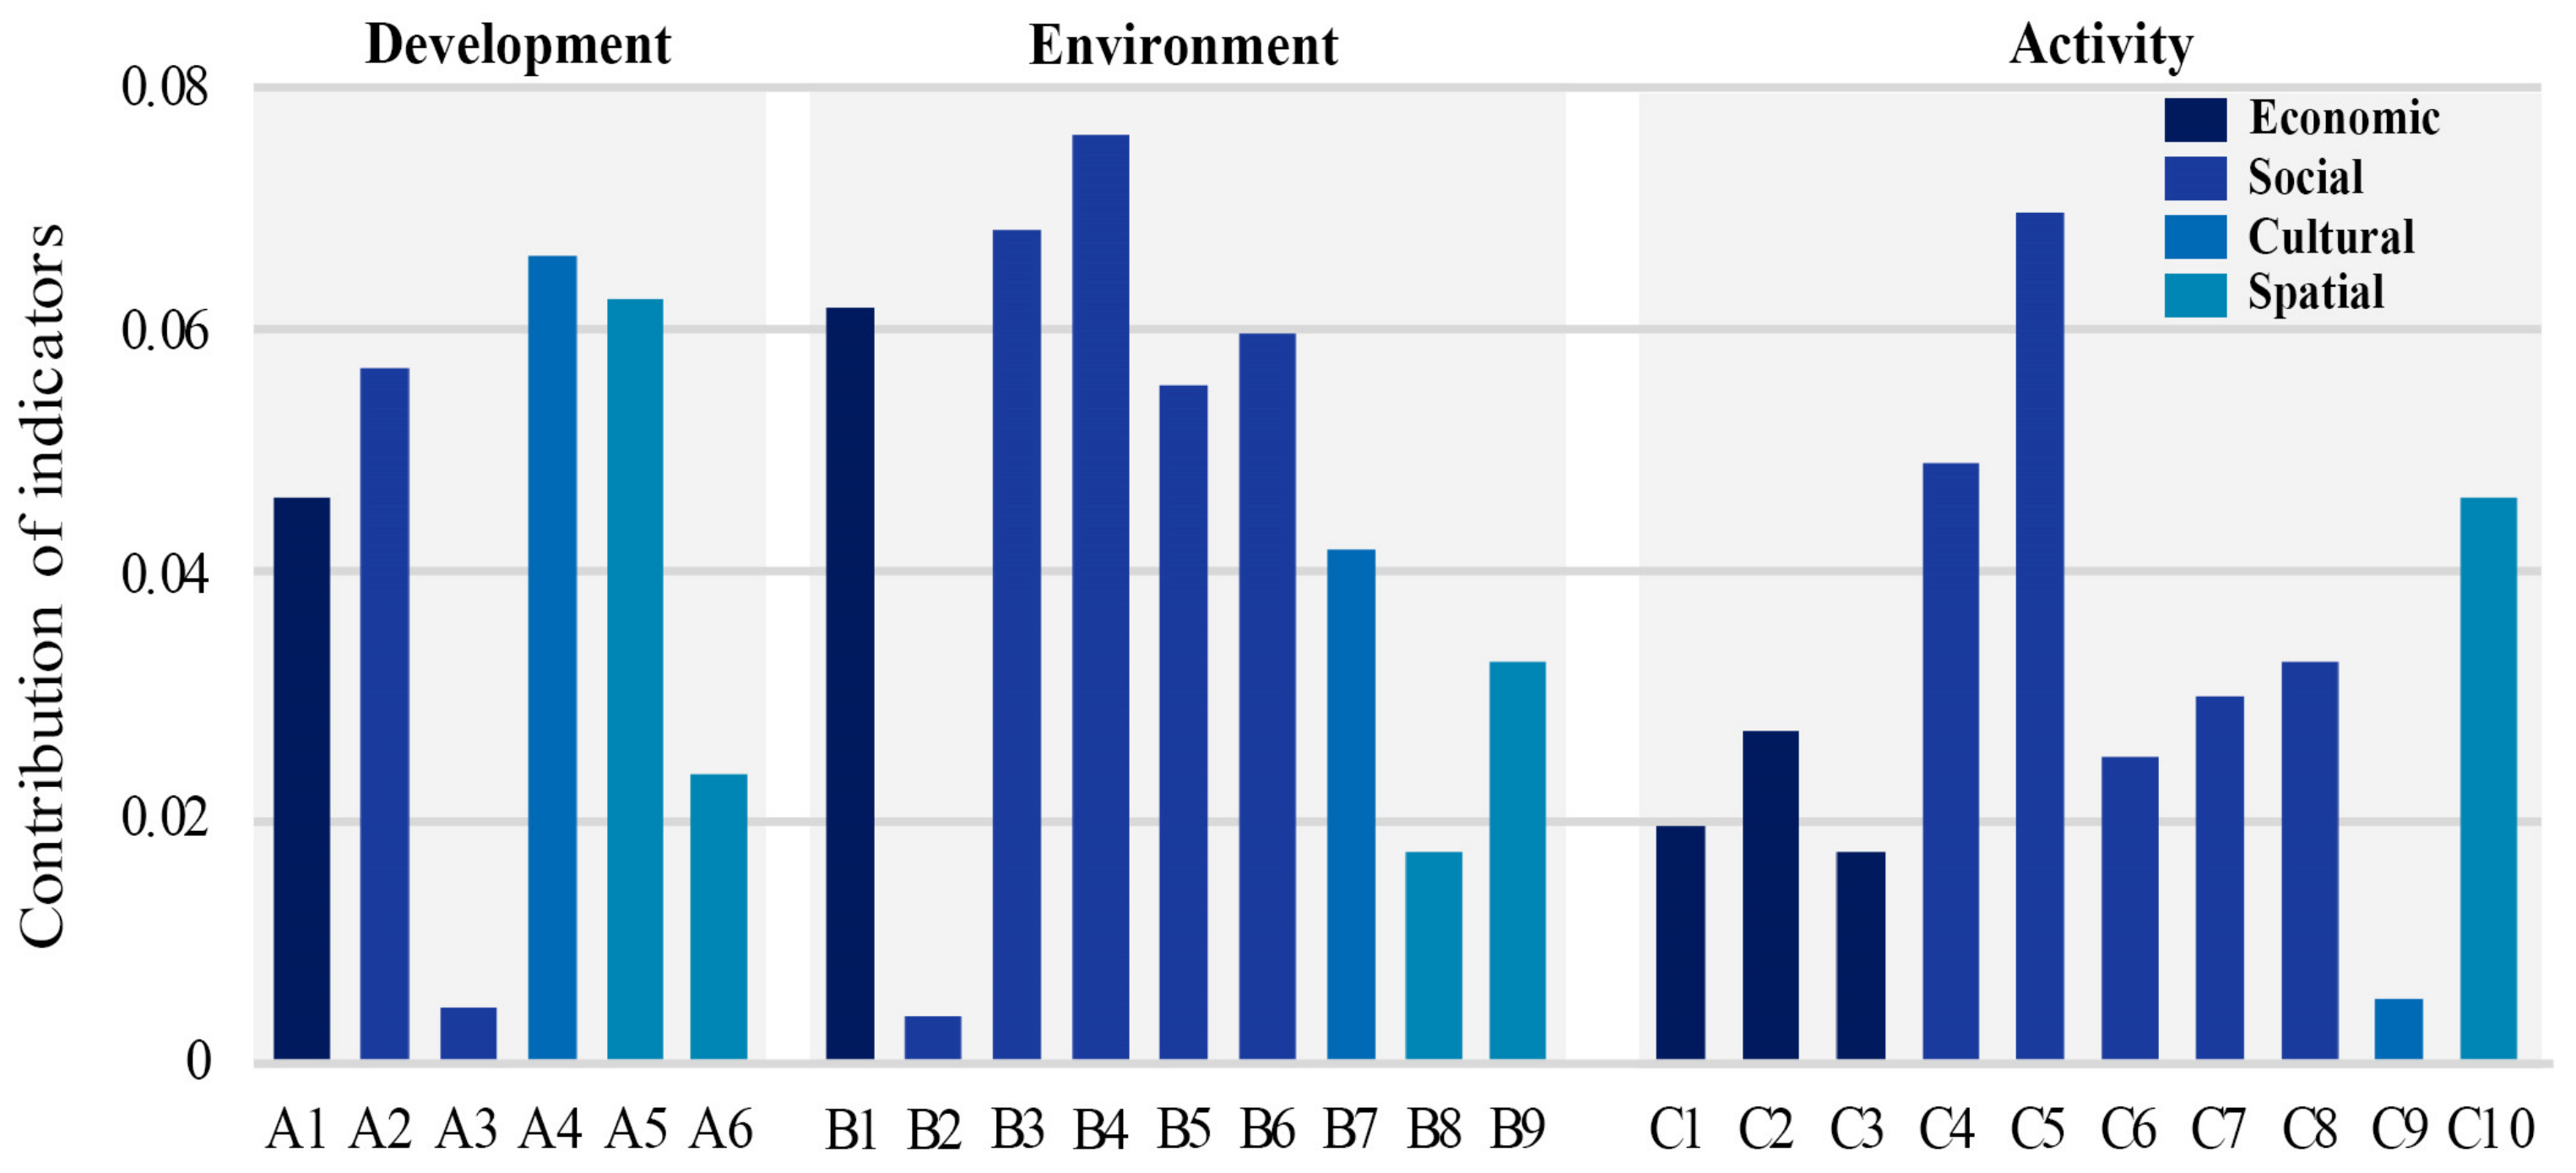
4.3. Contribution of Indicators Applied to Evaluating Urban Vitality
4.4. Case Validation of the Vitality Evaluation
5. Discussion
6. Conclusions and Limitations
Author Contributions
Funding
Data Availability Statement
Acknowledgments
Conflicts of Interest
Appendix A
| Name | Geotag | Longitude | Latitude | Province | City | District |
|---|---|---|---|---|---|---|
| XX Department Store | Store | 114.46246 | 23.08439 | Guangdong | Huizhou | Huicheng |
| XX City Park | Park | 113.62731 | 22.61444 | Guangdong | Guangzhou | Nansha |
| XX Hotel | Hotel | 113.56092 | 22.22464 | Guangdong | Zhuhai | Xiangzhou |
| Name | Longitude | Latitude | Geotag | Geotag Code | Check-in Number |
|---|---|---|---|---|---|
| XX Primary School | 110.18143 | 20.23926 | Primary school | 759 | 31 |
| XX Bus Terminal | 113.23185 | 22.31103 | Bus station | 151 | 155 |
| XX KTV | 112.19218 | 22.31103 | KTV | 759 | 83 |
| Year | Province | City | Longitude | Latitude | Area (hm2) | Transaction Way | Transaction Price (10 Thousand CNY) |
|---|---|---|---|---|---|---|---|
| 2020 | Guangdong | Guangzhou | 113.5847542 | 22.81376845 | 8.77884 | Auction | 6437.00 |
| 2020 | Guangdong | Foshan | 112.8106541 | 22.87589804 | 3.71424 | Listing | 2436.54 |
| 2019 | Guangdong | Shenzhen | 114.3159637 | 22.78039416 | 2.47766 | Bidding | 109,887.00 |
References
- Jacobs, J. The Death and Life of Great American Cities; Random House: New York, NY, USA, 1961. [Google Scholar]
- Bracken, I.; Martin, D. The generation of spatial population distributions from census centroid data. Environ. Plan. A 1989, 21, 537–543. [Google Scholar] [CrossRef]
- Ratti, C.; Frenchman, D.; Pulselli, R.M.; Williams, S. Mobile landscapes: Using location data from cell phones for urban analysis. Environ. Plan. B Plan. Des. 2006, 33, 727–748. [Google Scholar] [CrossRef]
- Zhen, F.; Cao, Y.; Qin, X.; Wang, B. Delineation of an urban agglomeration boundary based on Sina Weibo microblog ‘check-in’ data: A case study of the Yangtze River Delta. Cities 2017, 60, 180–191. [Google Scholar] [CrossRef]
- Ta, N.; Zeng, Y.; Zhu, Q.; Wu, J. Relationship between built environment and urban vitality in Shanghai downtown area based on big data. Sci. Geogr. Sin. 2020, 40, 60–68. [Google Scholar]
- Gehl, J. Life between Buildings: Using Public Space; Island Press: Washington, DC, USA, 1971. [Google Scholar]
- Delclòs-Alió, X.; Miralles-Guasch, C. Looking at Barcelona through Jane Jacobs’s eyes: Mapping the basic conditions for urban vitality in a Mediterranean conurbation. Land Use Policy 2018, 75, 505–517. [Google Scholar] [CrossRef]
- Sung, H.; Lee, S.; Cheon, S. Operationalizing Jane Jacobs’s Urban Design Theory. J. Plan. Educ. Res. 2015, 35, 117–130. [Google Scholar] [CrossRef]
- Jin, Y. Study on urban economic vitality index in China. Sci. Geogr. Sin. 2007, 27, 9–16. [Google Scholar]
- Feng, Y.; Zhen, J. The early warning of ecological security in Hohhot based on RBF model. J. Arid. Land Resour. Environ. 2018, 32, 87–92. [Google Scholar]
- Chang, Q.; Wang, Y.; Wu, J.; Li, S. Urban land use intensity assessment based on artificial neural networks: A case of Shenzhen. China Land Sci. 2007, 21, 26–31. [Google Scholar]
- Chen, J.; Zeng, M.; Duan, Y. Regional carrying capacity evaluation and prediction based on GIS in the Yangtze River Delta, China. Int. J. Geogr. Inf. Sci. 2011, 25, 171–190. [Google Scholar] [CrossRef]
- Kennedy, M.; Dinh, V.; Basu, B. Analysis of consumer choice for low-carbon technologies by using neural networks. J. Clean. Prod. 2016, 112, 3402–3412. [Google Scholar] [CrossRef]
- Qi, W.; Wang, K. City administrative area and physical area in China: Spatial differences and integration strategies. Geogr. Res. 2019, 38, 207–220. [Google Scholar]
- Chen, X.; Feng, J. Clarification and research progress of various urban spatial concepts. Urban Dev. Stud. 2020, 27, 62–69. [Google Scholar]
- Zha, Y.; Ni, S.; Yang, S. An effective approach to automatically extract urban land-use from TM imagery. J. Remote Sens. 2003, 7, 37–40. [Google Scholar]
- Xu, H. A new index for delineating built-up land features in satellite imagery. Int. J. Remote Sens. 2008, 29, 4269–4276. [Google Scholar] [CrossRef]
- Sharma, R.C.; Tateishi, R.; Hara, K.; Gharechelou, S.; Iizuka, K. Global mapping of urban built-up areas of year 2014 by combining MODIS multispectral data with VIIRS nighttime light data. Int. J. Digit. Earth 2016, 9, 1004–1020. [Google Scholar] [CrossRef]
- Xu, Z.; Gao, X. A novel method for identifying the boundary of urban built-up areas with POI data. Acta Geogr. Sin. 2016, 71, 928–939. [Google Scholar]
- Li, C.; Wang, X.; Wu, Z.; Dai, Z.; Yin, J.; Zhang, C. An improved method for urban built-up area extraction supported by multi-source data. Sustainability 2021, 13, 5042. [Google Scholar] [CrossRef]
- Lynch, K. Good City Form; The MIT Press: Cambridge, UK, 1984. [Google Scholar]
- Shi, J.; Miao, W.; Si, H.; Liu, T. Urban Vitality Evaluation and Spatial Correlation Research: A Case Study from Shanghai, China. Land 2021, 10, 1195. [Google Scholar] [CrossRef]
- Liu, L.; Xu, Y.; Jiang, S.; Wu, Q. Evaluation of urban vitality based on fuzzy matter-element model. Geogr. Geo-Inf. Sci. 2010, 26, 73–77. [Google Scholar]
- Wang, S.; Li, D.; Ye, X.; Chen, Q.; Jiang, X. Fuzzy comprehensive evaluation on the urban vitality—A case of the main city in Hubei Province. J. Huazhong Norm. Univ. (Nat. Sci.) 2013, 47, 440–445. [Google Scholar]
- Zhang, A.; Li, W.; Wu, J.; Lin, J.; Chu, J.; Xia, C. How can the urban landscape affect urban vitality at the street block level? A case study of 15 metropolises in China. Environ. Plan. B: Urban Anal. City Sci. 2021, 48, 631–652. [Google Scholar] [CrossRef]
- Niu, X.; Wu, W.; Li, M. Influence of built environment on street vitality and its spatiotemporal characteristics based on LBS positioning data. Urban Plan. Int. 2019, 34, 28–37. [Google Scholar] [CrossRef]
- Lan, F.; Gong, X.; Da, H.; Wen, H. How do population inflow and social infrastructure affect urban vitality? Evidence from 35 large- and medium-sized cities in China. Cities 2020, 100, 102454. [Google Scholar] [CrossRef]
- Wang, B.; Zhen, F.; Zhang, S.; Huang, X.; Zhou, L. The impact of air pollution on urban vibrancy and its built environment heterogeneity: An empirical analysis based on big data. Geogr. Res. 2021, 40, 1935–1948. [Google Scholar]
- Ye, Y.; Zhuang, Y. A hypothesis of urban morphogenesis and urban vitality in newly built-up areas: Analyses based on street accessibility, building density and functional mixture. Urban Plan. Int. 2017, 32, 43–49. [Google Scholar] [CrossRef]
- Zeng, C.; Song, Y.; He, Q.; Shen, F. Spatially explicit assessment on urban vitality: Case studies in Chicago and Wuhan. Sustain. Cities Soc. 2018, 40, 296–306. [Google Scholar] [CrossRef]
- Jin, X.; Long, Y.; Sun, W.; Lu, Y.; Yang, X.; Tang, J. Evaluating cities’ vitality and identifying ghost cities in China with emerging geographical data. Cities 2017, 63, 98–109. [Google Scholar] [CrossRef]
- Montgomery, J. Making a city: Urbanity, vitality and urban design. J. Urban Des. 1998, 3, 93–116. [Google Scholar] [CrossRef]
- Wu, J.; Ta, N.; Song, Y.; Lin, J.; Chai, Y. Urban form breeds neighborhood vibrancy: A case study using a GPS-based activity survey in suburban Beijing. Cities 2018, 74, 100–108. [Google Scholar] [CrossRef]
- Li, X.; Li, Y.; Jia, T.; Zhou, L.; Hijazi, I.H. The six dimensions of built environment on urban vitality: Fusion evidence from multi-source data. Cities 2022, 121, 103482. [Google Scholar] [CrossRef]
- Wu, C.; Ye, X.; Ren, F.; Du, Q. Check-in behaviour and spatio-temporal vibrancy: An exploratory analysis in Shenzhen, China. Cities 2018, 77, 104–116. [Google Scholar] [CrossRef]
- Gan, X.; Wang, L.; Wang, H.; Mou, Y.; Wang, D.; Hu, A. Optimal block size for improving urban vitality: An exploratory analysis with multiple vitality indicators. J. Urban Plan. Dev. 2021, 147, 04021027. [Google Scholar] [CrossRef]
- Huang, B.; Zhou, Y.; Li, Z.; Song, Y.; Cai, J.; Tu, W. Evaluating and characterizing urban vibrancy using spatial big data: Shanghai as a case study. Environ. Plan. B Urban Anal. City Sci. 2020, 47, 1543–1559. [Google Scholar] [CrossRef]
- Yue, Y.; Zhuang, Y.; Yeh, A.G.O.; Xie, J.; Ma, C.; Li, Q. Measurements of POI-based mixed use and their relationships with neighbourhood vibrancy. Int. J. Geogr. Inf. Sci. 2017, 31, 658–675. [Google Scholar] [CrossRef]
- He, Q.; He, W.; Song, Y.; Wu, J.; Yin, C.; Mou, Y. The impact of urban growth patterns on urban vitality in newly built-up areas based on an association rules analysis using geographical ‘big data’. Land Use Policy 2018, 78, 726–738. [Google Scholar] [CrossRef]
- Ministry of Housing and Urban-Rural Development of the People’s Republic of China. GB50137-2011 Code for Classification of Urban Land Use and Planning Standards of Development Land; Standard Press of China: Beijing, China, 2012. [Google Scholar]
- Long, Y.; Zhou, Y. Quantitative evaluation on street vibrancy and its impact factors: A case study of Chengdu. New Archit. 2016, 1, 52–57. [Google Scholar]
- Zhang, Y.; Li, J. Comparative analysis about reference land price and its influencing factor of the towns in Hohhot. Geogr. Res. 2007, 26, 373–382. [Google Scholar]
- Ye, Y.; Li, D.; Liu, X. How block density and typology affect urban vitality: An exploratory analysis in Shenzhen, China. Urban Geogr. 2018, 39, 631–652. [Google Scholar] [CrossRef]
- Jia, C.; Liu, Y.; Du, Y.; Huang, J.; Fei, T. Evaluation of Urban Vibrancy and Its Relationship with the Economic Landscape: A Case Study of Beijing. ISPRS Int. J. Geo-Inf. 2021, 10, 72. [Google Scholar] [CrossRef]
- Tang, N.; Tan, M. The grade of farming land by artificial neural network Ⅱ: Optimization disposal of preceding data. J. Fujian Agric. For. Univ. (Nat. Sci. Ed.) 2004, 33, 512–516. [Google Scholar]
- Cai, R.; Cui, Y.; Xue, P. Research on the methods of determining the number of hidden nodes in three-layer BP neural network. Comput. Inf. Technol. 2017, 25, 29–33. [Google Scholar]
- Sun, H.; Wang, X. Determination of the weight of evaluation indexes with artificial neural network method. J. Shandong Univ. Sci. Technol. (Nat. Sci. Ed.) 2001, 20, 84–86. [Google Scholar]
- Zhang, J.; He, X.; Yuan, X. Research on the relationship between Urban economic development level and urban spatial structure—A case study of two Chinese cities. PLoS ONE 2020, 15, e0235858. [Google Scholar] [CrossRef] [PubMed]
- Yue, W.; Chen, Y.; Thy, P.T.M.; Fan, P.; Liu, Y.; Zhang, W. Identifying urban vitality in metropolitan areas of developing countries from a comparative perspective: Ho Chi Minh City versus Shanghai. Sustain. Cities Soc. 2021, 65, 102609. [Google Scholar] [CrossRef]
- Huang, Y.; Sun, Y. Judgement Characteristics and Quantitative Index of Suitable Block Scale. J. South China Univ. Technol. (Nat. Sci. Ed.) 2012, 40, 131–138. [Google Scholar]
- Ministry of Natural Resources of China. TD/T XXXXX—202X Code of Practice for City Examination & Evaluation in Spatial Planning (Draft); Standard Press of China: Beijing, China, 2021. [Google Scholar]
- Liu, C.; Yang, K.; Cheng, L.; Li, M.; Guo, Z. Comparison of Landsat8 impervious surface extraction methods. Remote Sens. Land Resour. 2019, 31, 148–156. [Google Scholar]
- Sun, W.; Xu, Y. Financial security evaluation of the electric power industry in China based on a back propagation neural network optimized by genetic algorithm. Energy 2016, 101, 366–379. [Google Scholar] [CrossRef]



| Data | Data Source | Year | |
|---|---|---|---|
| Remote sensing data | Landsat RS image | Geospatial Data Cloud (http://www.gscloud.cn/, accessed on 15 September 2021) | 2020 |
| CNLUCC | RESDC (https://www.resdc.cn/, accessed on 16 July 2021) | 2020 | |
| Nighttime light | EGO (https://eogdata.mines.edu/products/vnl/, accessed on 11 August 2021) | 2020 | |
| Geographic big data | POIs | AMAP (https://lbs.amap.com/, accessed on 10 September 2020) | 2020 |
| Weibo check-ins | Sina Weibo (https://open.weibo.com/, accessed on 30 December 2019) | 2015 | |
| Land transaction price | Landchina (https://www.landchina.com/, accessed on 25 September 2021) | 2010–2020 | |
| Street image | Baidu Map (https://map.baidu.com/, accessed on 11 Januaury 2022) | 2019 | |
| Spatially mapped statistical data | GDP | RESDC (https://www.resdc.cn/, accessed on 26 April 2021) | 2015 |
| Population | RESDC (https://www.resdc.cn/, accessed on 1 September 2021) | 2020 | |
| Basic geographic data | Road network | AMAP (https://lbs.amap.com/, accessed on 29 June 2021) | 2020 |
| Water area | OSM (http://www.openstreetmap.org/, accessed on 18 July 2021) | 2020 | |
| Administrative boundary | AMAP (https://lbs.amap.com/, accessed on 10 September 2021) | 2020 | |
| Primary—Land Use | Secondary—Urban Activity | Tertiary—POI Geotag |
|---|---|---|
| Administration and public services | Governance | Government, police office, court, tax office, etc. |
| Cultural visit | Museum, library, temple, heritage site etc. | |
| Education | Institution, university, and school | |
| Sports | Stadium, natatorium, football field, etc. | |
| Medical care | Hospital, clinic, pharmacy, etc. | |
| Commercial and business facilities | Lodging | Hotel, hostel, guesthouse, etc. |
| Catering | Restaurant, fast-food, snack, coffee shop, etc. | |
| Shopping | Mall, supermarket, shop, store, farmer’s market, etc. | |
| Entertainment | Cinema, club, KTV, game room, spa, etc. | |
| Financial service | Bank and ATM | |
| Working | Office, corporation, press, firm, etc. | |
| Residential | Home-based | Residential area, community, apartment, etc. |
| Industrial | Working | Factory, enterprise, and industrial zone |
| Street and transportation | Commuting | Airport, harbor, train station, metro station, bus station, etc. |
| Municipal utilities | Municipal service | Fire station, post office, supply station, toilets, etc. |
| Green space | Recreation | City square, park, zoom, arboretum, scenic spots, etc. |
| Subsystem | Indicator | Description | Method |
|---|---|---|---|
| Development | Economic density (A1) | Distribution of GDP at 500 m resolution (CNY/km2) | Resampling |
| Population density (A2) | Distribution of population at 500 m resolution (people/km2) | Resampling | |
| POI density (A3) | Density of all POIs (/km2) | KDE | |
| Cultural facility (A4) | Density of cultural facilities (/km2) | KDE | |
| Road density (A5) | Total length of roads in each grid (m/km2) | Equation (1) | |
| Road intersection (A6) | Density of road intersections (/km2) | KDE | |
| Environment | Land price (B1) | Transaction price of land transfer by bidding, auction, and listing (CNY/m2) | Kriging |
| Accessibility to the metro (B2) | Distance to metro stations (m) | Near Analysis | |
| Accessibility to schools (B3) | Distance to schools (m) | Near Analysis | |
| Accessibility to a park (B4) | Distance to parks (m) | Near Analysis | |
| Accessibility to hospitals (B5) | Distance to hospitals (m) | Near Analysis | |
| Accessibility to markets (B6) | Distance to farmer’s markets (m) | Near Analysis | |
| Accessibility to culture (B7) | Distance to cultural facilities (m) | Near Analysis | |
| Land use intensity (B8) | Maximum value of NDBI (value) | Equation (2) | |
| Building density (B9) | Construction land coverage ratio in each grid (%) | Equation (3) | |
| Activity | Working (C1) | Density of check-ins located in places of employment (/km2) | Weighted KDE |
| Catering (C2) | Density of check-ins located at catering sites (/km2) | Weighted KDE | |
| Shopping (C3) | Density of check-ins located in places for shopping (/km2) | Weighted KDE | |
| Commuting (C4) | Density of check-ins located on metro or bus stations (/km2) | Weighted KDE | |
| Education (C5) | Density of check-ins located in schools (/km2) | Weighted KDE | |
| Recreation (C6) | Density of check-ins located in parks (/km2) | Weighted KDE | |
| Medical care (C7) | Density of check-ins located in hospitals (/km2) | Weighted KDE | |
| Life service (C8) | Density of check-ins located in farmer’s markets (/km2) | Weighted KDE | |
| Cultural visit (C9) | Density of check-ins located at cultural sites (/km2) | Weighted KDE | |
| Land use mixture (C10) | LUM within seven types of POIs according to Table 2 (value) | Equation (4) |
| Region | GZ | SZ | FS | DG | ZS | ZH | JM | ZQ | HZ |
|---|---|---|---|---|---|---|---|---|---|
| A | 56% | 68% | 51% | 64% | 50% | 44% | 42% | 20% | 28% |
| B | 19% | 20% | 14% | 17% | 31% | 20% | 20% | 31% | 19% |
| C | 15% | 10% | 23% | 14% | 10% | 10% | 6% | 2% | 7% |
| D | 10% | 2% | 11% | 5% | 9% | 26% | 32% | 47% | 46% |
| E | 0% | 0% | 1% | 0% | 0% | 0% | 0% | 0% | 0% |
| Total | 100% | 100% | 100% | 100% | 100% | 100% | 100% | 100% | 100% |
| Vitality Grade | GZ | SZ | FS | DG | ZH | ZH | JM | ZQ | HZ |
|---|---|---|---|---|---|---|---|---|---|
| Very High | 57% | 41% | 0% | 0% | 1% | 0% | 1% | 0% | 0% |
| High | 33% | 59% | 3% | 0% | 2% | 0% | 1% | 0% | 0% |
| Medium High | 29% | 39% | 12% | 3% | 4% | 2% | 4% | 2% | 4% |
| Medium | 23% | 25% | 17% | 12% | 6% | 3% | 6% | 4% | 5% |
| Medium Low | 19% | 17% | 16% | 21% | 9% | 4% | 5% | 4% | 5% |
| Low | 16% | 12% | 15% | 31% | 12% | 3% | 5% | 2% | 4% |
| Very Low | 15% | 6% | 11% | 31% | 17% | 4% | 6% | 3% | 8% |
Publisher’s Note: MDPI stays neutral with regard to jurisdictional claims in published maps and institutional affiliations. |
© 2022 by the authors. Licensee MDPI, Basel, Switzerland. This article is an open access article distributed under the terms and conditions of the Creative Commons Attribution (CC BY) license (https://creativecommons.org/licenses/by/4.0/).
Share and Cite
Huang, X.; Jiang, P.; Li, M.; Zhao, X. Applicable Framework for Evaluating Urban Vitality with Multiple-Source Data: Empirical Research of the Pearl River Delta Urban Agglomeration Using BPNN. Land 2022, 11, 1901. https://doi.org/10.3390/land11111901
Huang X, Jiang P, Li M, Zhao X. Applicable Framework for Evaluating Urban Vitality with Multiple-Source Data: Empirical Research of the Pearl River Delta Urban Agglomeration Using BPNN. Land. 2022; 11(11):1901. https://doi.org/10.3390/land11111901
Chicago/Turabian StyleHuang, Xuefeng, Penghui Jiang, Manchun Li, and Xin Zhao. 2022. "Applicable Framework for Evaluating Urban Vitality with Multiple-Source Data: Empirical Research of the Pearl River Delta Urban Agglomeration Using BPNN" Land 11, no. 11: 1901. https://doi.org/10.3390/land11111901
APA StyleHuang, X., Jiang, P., Li, M., & Zhao, X. (2022). Applicable Framework for Evaluating Urban Vitality with Multiple-Source Data: Empirical Research of the Pearl River Delta Urban Agglomeration Using BPNN. Land, 11(11), 1901. https://doi.org/10.3390/land11111901


