Article

Applicable Framework for Evaluating Urban Vitality with Multiple-Source Data: Empirical Research of the Pearl River Delta Urban Agglomeration Using BPNN

1
School of Geography and Ocean Science, Nanjing University, Nanjing 210023, China
2
Jiangsu Provincial Key Laboratory of Geographic Information Science and Technology, Nanjing 210023, China
3
Key Laboratory for Land Satellite Remote Sensing Applications of Ministry of Natural Resources, Nanjing 210023, China
4
Collaborative Innovation Center of South China Sea Studies, Nanjing 210023, China
5
Jiangsu Center for Collaborative Innovation in Geographical Information Resource Development and Application, Nanjing 210023, China
*
Author to whom correspondence should be addressed.
Land 2022, 11(11), 1901; https://doi.org/10.3390/land11111901
Submission received: 2 September 2022 / Revised: 9 October 2022 / Accepted: 24 October 2022 / Published: 26 October 2022

Abstract

:
Urban vitality is a mirror reflection of ‘urban disease’ in cities. The research on urban vitality has made great progress in evaluation frameworks; however, these frameworks cannot jointly account for the macro and micro performance of urban vitality. It is better to establish an integrated evaluation framework for this topic. This paper defines urban vitality as the comprehensive strength to support dense and diverse activities based on urban development and the urban environment, and subsequently develops an integrated framework including economic, social, cultural, and spatial dimensions. With the nonlinear evaluation model of a back propagation neural network, we further presented the result of an application on the Pearl River Delta urban agglomeration. Our profiling results illustrate the core-edge structure of urban vitality. There are differences in vitality performance within built-up areas, which shows that areas with urban landscapes and excellent infrastructure are more vibrant. The integrated framework with good applicability improves the evaluation of urban vitality that is crucial to city examination and urban planning. Hence, this study provides a comprehensive reference for optimizing resource allocation and promoting sustainable development.

1. Introduction

After decades of fast growth, urbanization in China is shifting to high-quality development, creating unprecedented opportunities and challenges for cities. In addition to maintaining a stable development, the government needs to manage urban diseases due to the rapid urbanization, such as unlimited sprawl, the imbalance between the supply and demand of public services, and the worsening environment. Recently, city examination and evaluation in spatial planning were carried out to reveal the problems and improve the spatial quality in cities. In fact, urban vitality is closely related to the spatial quality and can serve as a mirror for urban diseases. Hence, urban vitality evaluation is a common concern for governments, scholars, and urban planners.
Jacobs [1] first defined ‘urban vitality’ as the performance that results from abundant activities and favorable living places in a city. Subsequently, researchers have conducted in-depth studies on urban vitality evaluation centering on two aspects: intensity and diversity. Characterizing the spatial attractiveness, activity intensity was measured by travel surveys in the past, compared with multiple-source data such as Geographic Information Systems (GPS), cellular signaling, social media, and nighttime light data nowadays, through which we can locate and quantify activity more precisely [2,3,4]. Additionally, considering the diversity of activity, urban vitality was evaluated based on economic, social, and cultural dimensions [5]. Urban vitality is also defined as citizens’ perceptions generated while living in a certain place, for example, a neighborhood park, suggesting that the built environment in a place is also a parameter for vitality evaluation [6,7]. Other studies analyzed the ability of the built environment to provide ideal services or livability for people under the conditions of urban morphology, land use, block size, and other physical characteristics [8]. These studies commonly focused on the micro performance of urban vitally. At the beginning of the 21st century, Chinese scholars began to engage in urban vitality evaluation differently from western scholars because they usually considered a city’s macro performance measured by economic and social statistical data in administrative units [9]. However, quantitative research at the micro-urban level is rapidly increasing with the growing availability of spatio-temporal big data, which may cause ignorance of a city’s macro conditions for urban vitality. Given that both macro and micro evaluation are significant for guiding urban planning, establishing an integrated framework and application to urban vitality evaluation are the main points in this paper.
Urban vitality is generated in the urban system. Most scholars applied linear approaches to evaluation, such as the analytic hierarchy process, principal component analysis, and grey relational analysis that probably do not allow the exploration of the complex relationship between urban vitality and urban elements. Due to the advantage of nonlinear mapping and self-adaptation, artificial neural networks (ANNs) have been adopted in evaluation research on topics such as ecological security, land use, and the environmental carrying capacity [10,11,12]. Particularly, back propagation neural networks (BPNNs) are multilayer feedforward neural networks with an error propagation algorithm, which can approach complex nonlinear functions with arbitrary precision [13].
This study aims to construct a multi-dimensional integrated framework to evaluate urban vitality under the newly proposed definition. With the nonlinear tool of BPNN, we further took the Pearl River Delta (PRD) urban agglomeration as a case study and applied the framework to empirical research. The results reveal the performance of urban vitality on a fine scale, which can support the ongoing city examination and evaluation and provide a practical basis for decision making in territorial spatial planning in China. Following this introduction, Section 2 reviews relevant literature and clarifies our framework. Section 3 describes the study area, data, and methods. Section 4 presents the results, analyzes the contribution of indicators, and details the implementation of the case study validation. Section 5 and Section 6 provide the discussion and concluding remarks.

2. Literature Review and Research Framework

2.1. Built-Up Areas and Methods for Extraction

In China, cities differ from western cities because the administrative and physical boundaries are spatially inconsistent [14]. Urban production and life are concentrated in physical regions rather than the former. Built-up areas are the main body of physical regions in cities in China, defined as urban construction land developed and equipped with municipal and public facilities. The boundaries of built-up area are also the basis for dividing urban and rural areas [15]. The evaluation of urban vitality should focus on the concentrated region of production and life in cities, so it is necessary to first identify the spatial scope of urban vitality. In this study, built-up areas are regarded as the spatial scope of urban vitality.
Researchers commonly use multispectral remote sensing, nighttime light, points of interest (POIs), or fusion data to extract built-up areas. Based on the band information in multispectral remote sensing images, indexes such as the normalized difference built-up index (NDBI) and index-based built-up index (IBI) are useful for identifying built-up areas [16,17]. The abundant information about land use and cover change (LUCC) reveals the distinction between urban and rural landscapes. Although nighttime light can objectively map the distribution of human activities, it is hard to identify built-up areas precisely on a city scale due to low resolution and light spillover [18]. With the development of electronic map services, POI data that can effectively reflect the spatial pattern of cities have also been applied to built-up area extraction through analysis of POI distribution [19]. However, relying solely on POI data may lead to the exclusion of certain areas with reasonable low density, such as industrial zones that are contiguous and architecturally homogeneous. Therefore, the extraction by fusion data emerged to meet these requirements [20]. To choose an appropriate approach, we summarized three characteristics of built-up areas according to the definition above. First, built-up areas have a major proportion of the urban landscape with unnatural ground features, so we can identify them by LUCC. Second, built-up areas are equipped with facilities to support a livable environment, so we can analyze them based on POI density. Third, built-up areas are spatially continuous, and we should estimate them through spatial geometric analysis.

2.2. The Evaluation of Urban Vitality

Derived from Jacobs’ concept of neighborhood vitality, urban vitality comprises the vitality of the urban society, urban function, and urban fabric [21]. From a macro perspective, urban vitality represents the development potential measured by the overall performance in economy and society. The gross domestic product (GDP), the proportion of the service sector, total retail sales, and other indicators obtained by statistical yearbooks were used for evaluation [22]. Some scholars extended the dimension of urban vitality and set the library collection per capita as the indicator of the cultural aspect [23,24]. However, this research cannot describe the heterogeneity of vitality inside the city due to the statistical unit of data. Assessing the urban interior vitality is crucial for fine-scale urban planning [25]. To investigate urban vitality at the micro-urban level, activity intensity is usually a proxy quantified with available spatial datasets such as Location Based Services positioning data and nighttime light data [26,27]. From the perspective of diversity, POIs and Weibo check-ins with extra information of the users and places, were used to describe the various types of activities including working, commuting, and catering [5,28]. Compared with statistical data, the application of spatio-temporal big data has an advantage of spatially mapping urban vitality.
The above studies highlight the importance of human activities for urban vitality. As for Jacob’s view, urban vitality is also influenced by the internal organization and design of urban space. Many researchers have shed light on citizens’ living places and observed conditions that can affect multiple urban phenomena, such as accessibility, building density, and land use mixtures [29,30]. Accessible streets can induce pedestrian volume and gather crowds, which affect the contact opportunities among citizens. Traffic accessibility and public service accessibility have mainly drawn scholars’ attention. Specifically, the road network density and road intersection density are the common features characterizing traffic accessibility as relevant studies illustrated [31]. Additionally, public service accessibility refers to the convenience of citizens to obtain public services in surrounding urban areas, which is mainly reflected by the distances to surrounding facilities such as hospitals, schools, parks, retail sites, bus-stops and subways [32,33]. Scholars also explored the relationship between urban vitality and urban form and argued ‘development intensity’ as an important driving factor [34]. The floor area ratio, building density, block size, and building height are usually selected to characterize the so-called development intensity [35,36,37]. Land use mixture refers to the combination of various types of urban land, which can achieve the diversity of urban functions related to residence, commerce, recreation, and so on. A mixed land-use block or neighborhood is likely to attract a larger volume of people because their demands for different services can be easily met so that commuting costs will be saved [38].
Recently, more and more studies have focused on the micro performance of urban vitality. Although great progress has been made in urban vitality evaluation, these frameworks cannot take macro and micro performance into account together. Subsequently, it is necessary to build a comprehensive, integrated, and applicable framework for urban vitality evaluation.

2.3. The Framework of Urban Vitality Evaluation

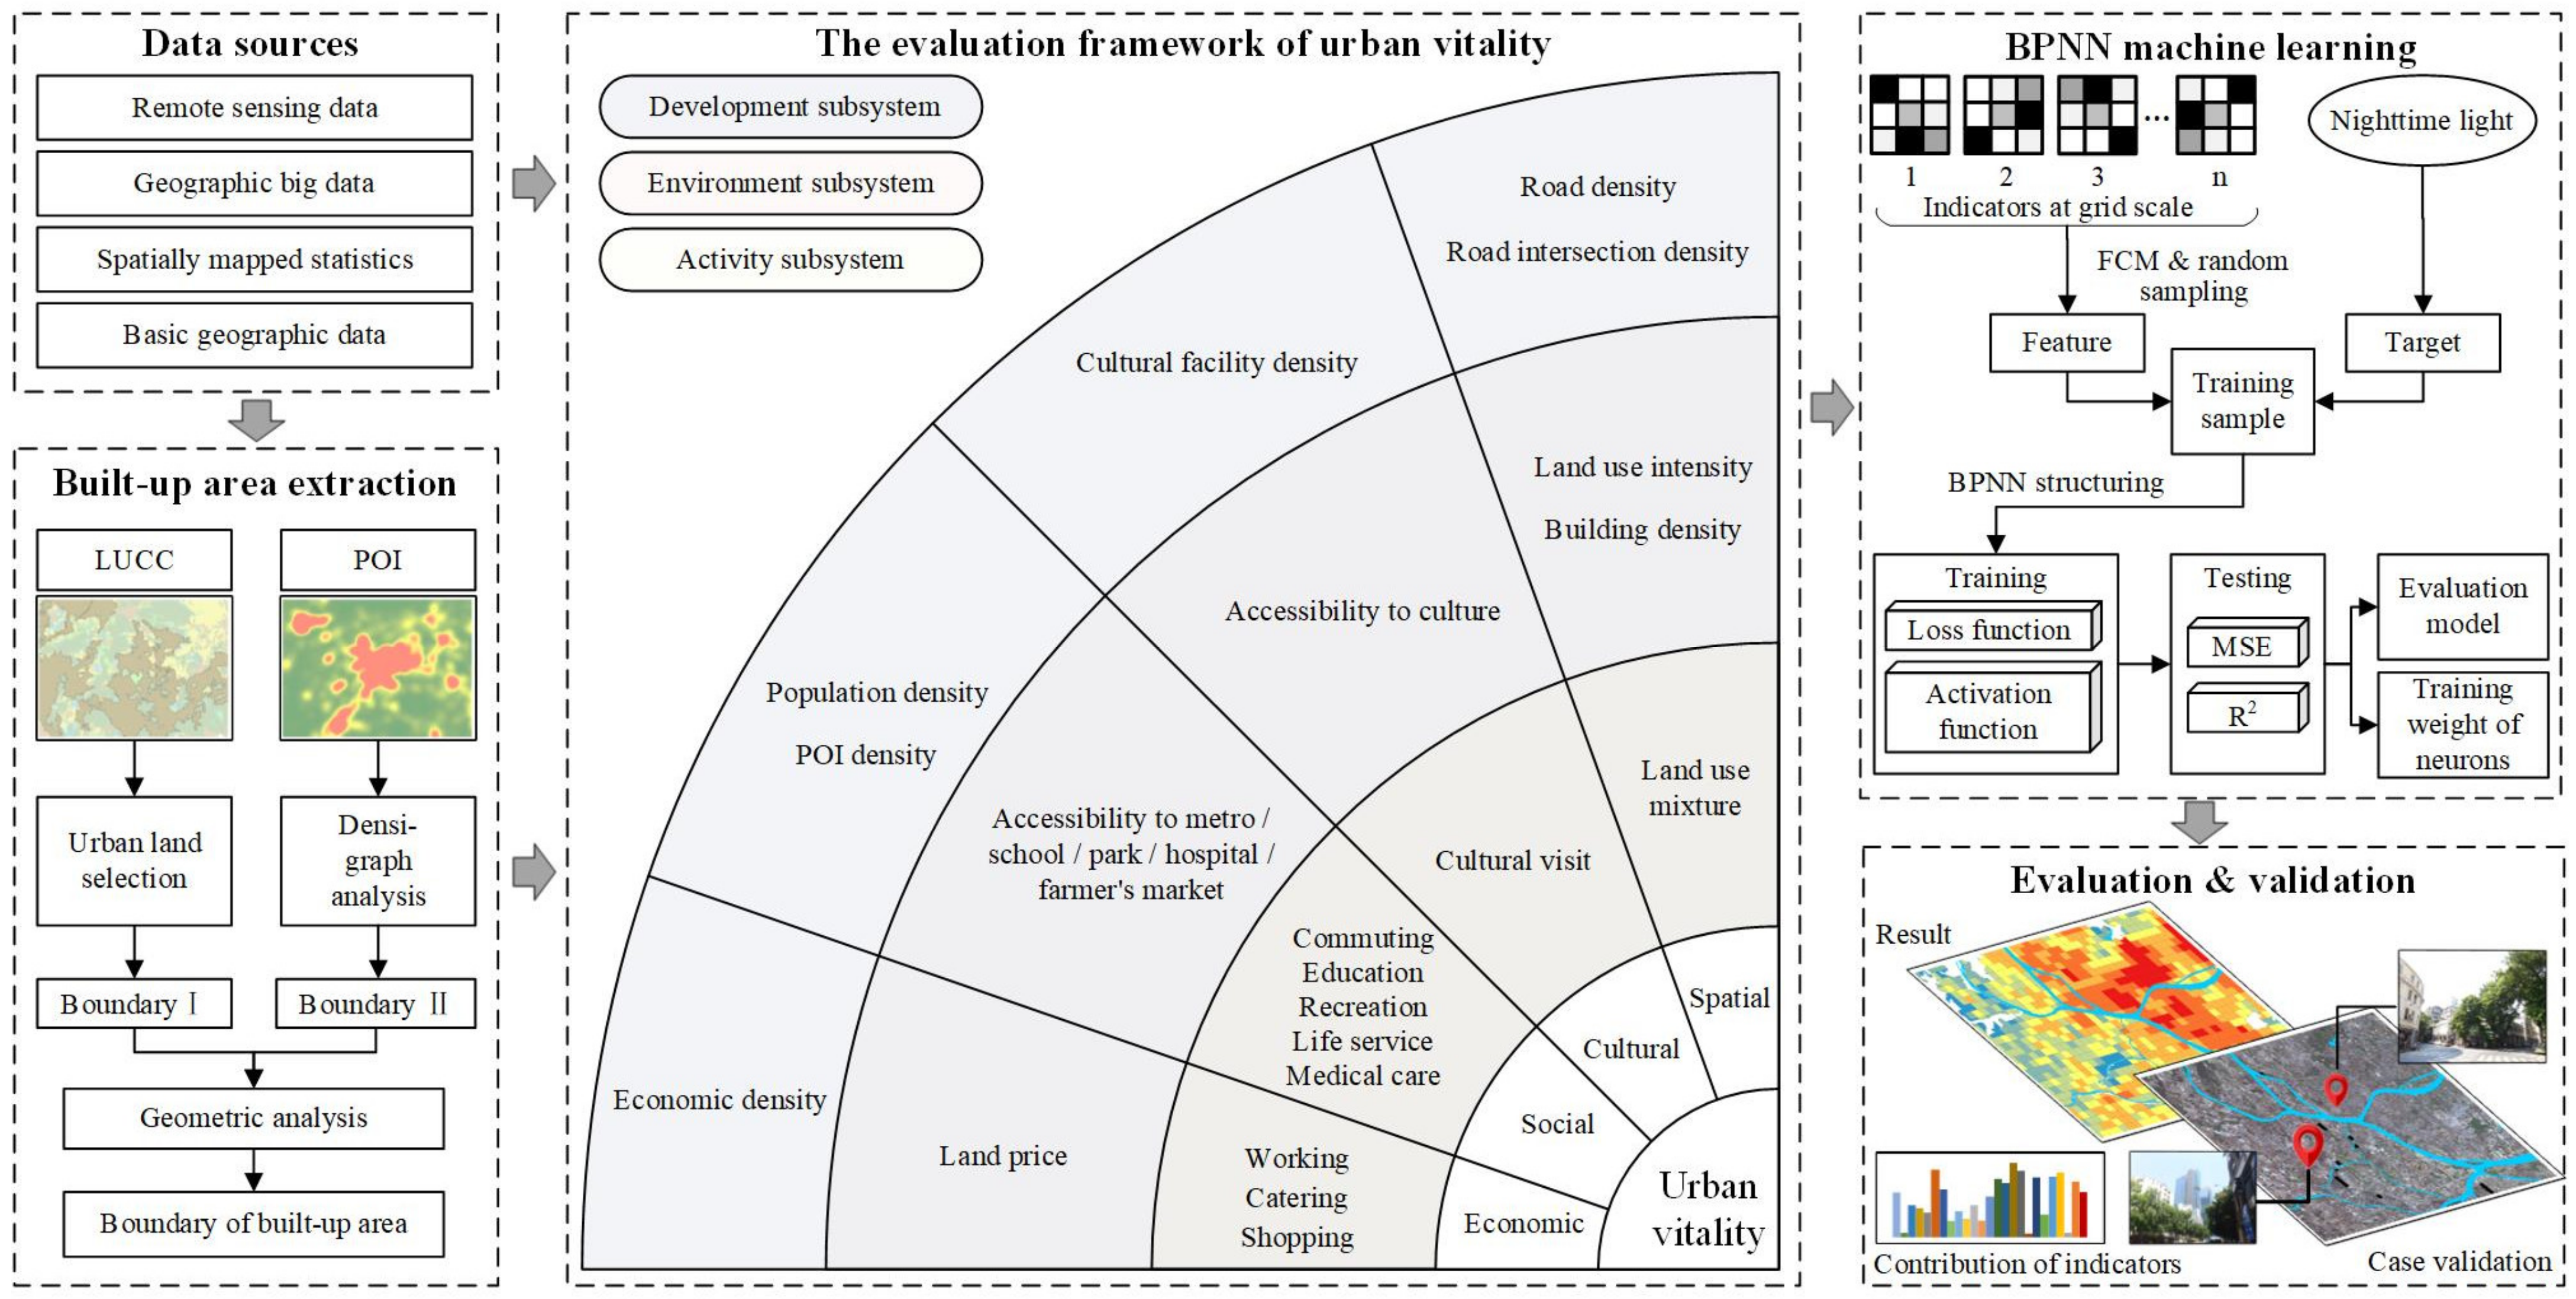
First, it is necessary to figure out urban vitality, the object of evaluation, and the perspective of interaction commonly helps us to understand how urban vitality generates in cities. Urban vitality is developed by continuous and intensive interactions between citizens and urban space. Intuitively, these interactions are usually translated into urban activities in which everyone is involved as they have visible outcomes, for example, citizens working in a company, contributing to the GDP, or walking in the streets, which can create an active neighborhood. However, citizens are more willing to live in areas that are accessible to schools and parks compared with those with poor convenience. This reveals that while citizens who engage in living and production are the hosts of urban activities, the urban environment is the carrier because it constantly influences the attractiveness of space and then influences the intensity and diversity of activities. By thinking about what deeply changes urban environments, we found that the development foundation of cities plays a role. With a better development foundation, a city is prosperous enough to attract citizens to settle, providing them with convenient infrastructure and service, which rely on sufficient fiscal revenue. Urban development stimulates urbanization as the population converges from rural to urban areas, bringing the hosts of urban activities, and the proportion of the urban landscape that shapes the carrier is steadily increasing. Urban development and the environment are invisibly supportive for urban vitality. Therefore, this study defines urban vitality as the comprehensive strength to support dense and diverse activities based on urban development and the urban environment, as illustrated in Figure 1.
Consequently, this research follows four steps (Figure 2):
  • Built-up area extraction with the fusion method. As the spatial scope of urban vitality, built-up areas were extracted with fusion data. The extraction method is introduced in Section 3.3.
  • Evaluation framework construction and indicator quantification. The evaluation framework for urban vitality was combined with the three connecting subsystems: urban development, environment, and activity. Furthermore, each subsystem was split into four dimensions: economic, social, cultural, and spatial. The economic dimension demonstrates the productivity and creativity of the society and guarantees a vibrant city. The social dimension contributes to a livable city with great convenience. The cultural dimension allows ample exposure of citizens to culture. The spatial dimension refers to the material urban space. Representative indicators were selected, and the quantitative methods are detailed in Section 3.4.
  • Evaluation of urban vitality using BPNN. Given the complex relationship between urban vitality and the three subsystems, urban vitality generation is a nonlinear process, so we seek innovation in the evaluation tool. How to establish a BPNN can be found in Section 3.5.
  • Result analysis and validation. The evaluation outcome and validation are illustrated in Section 4. Whether the framework is effective was confirmed by analyzing the contribution of indicators and validating selected cases.

3. Data and Method

3.1. Study Area: The PRD Urban Agglomeration

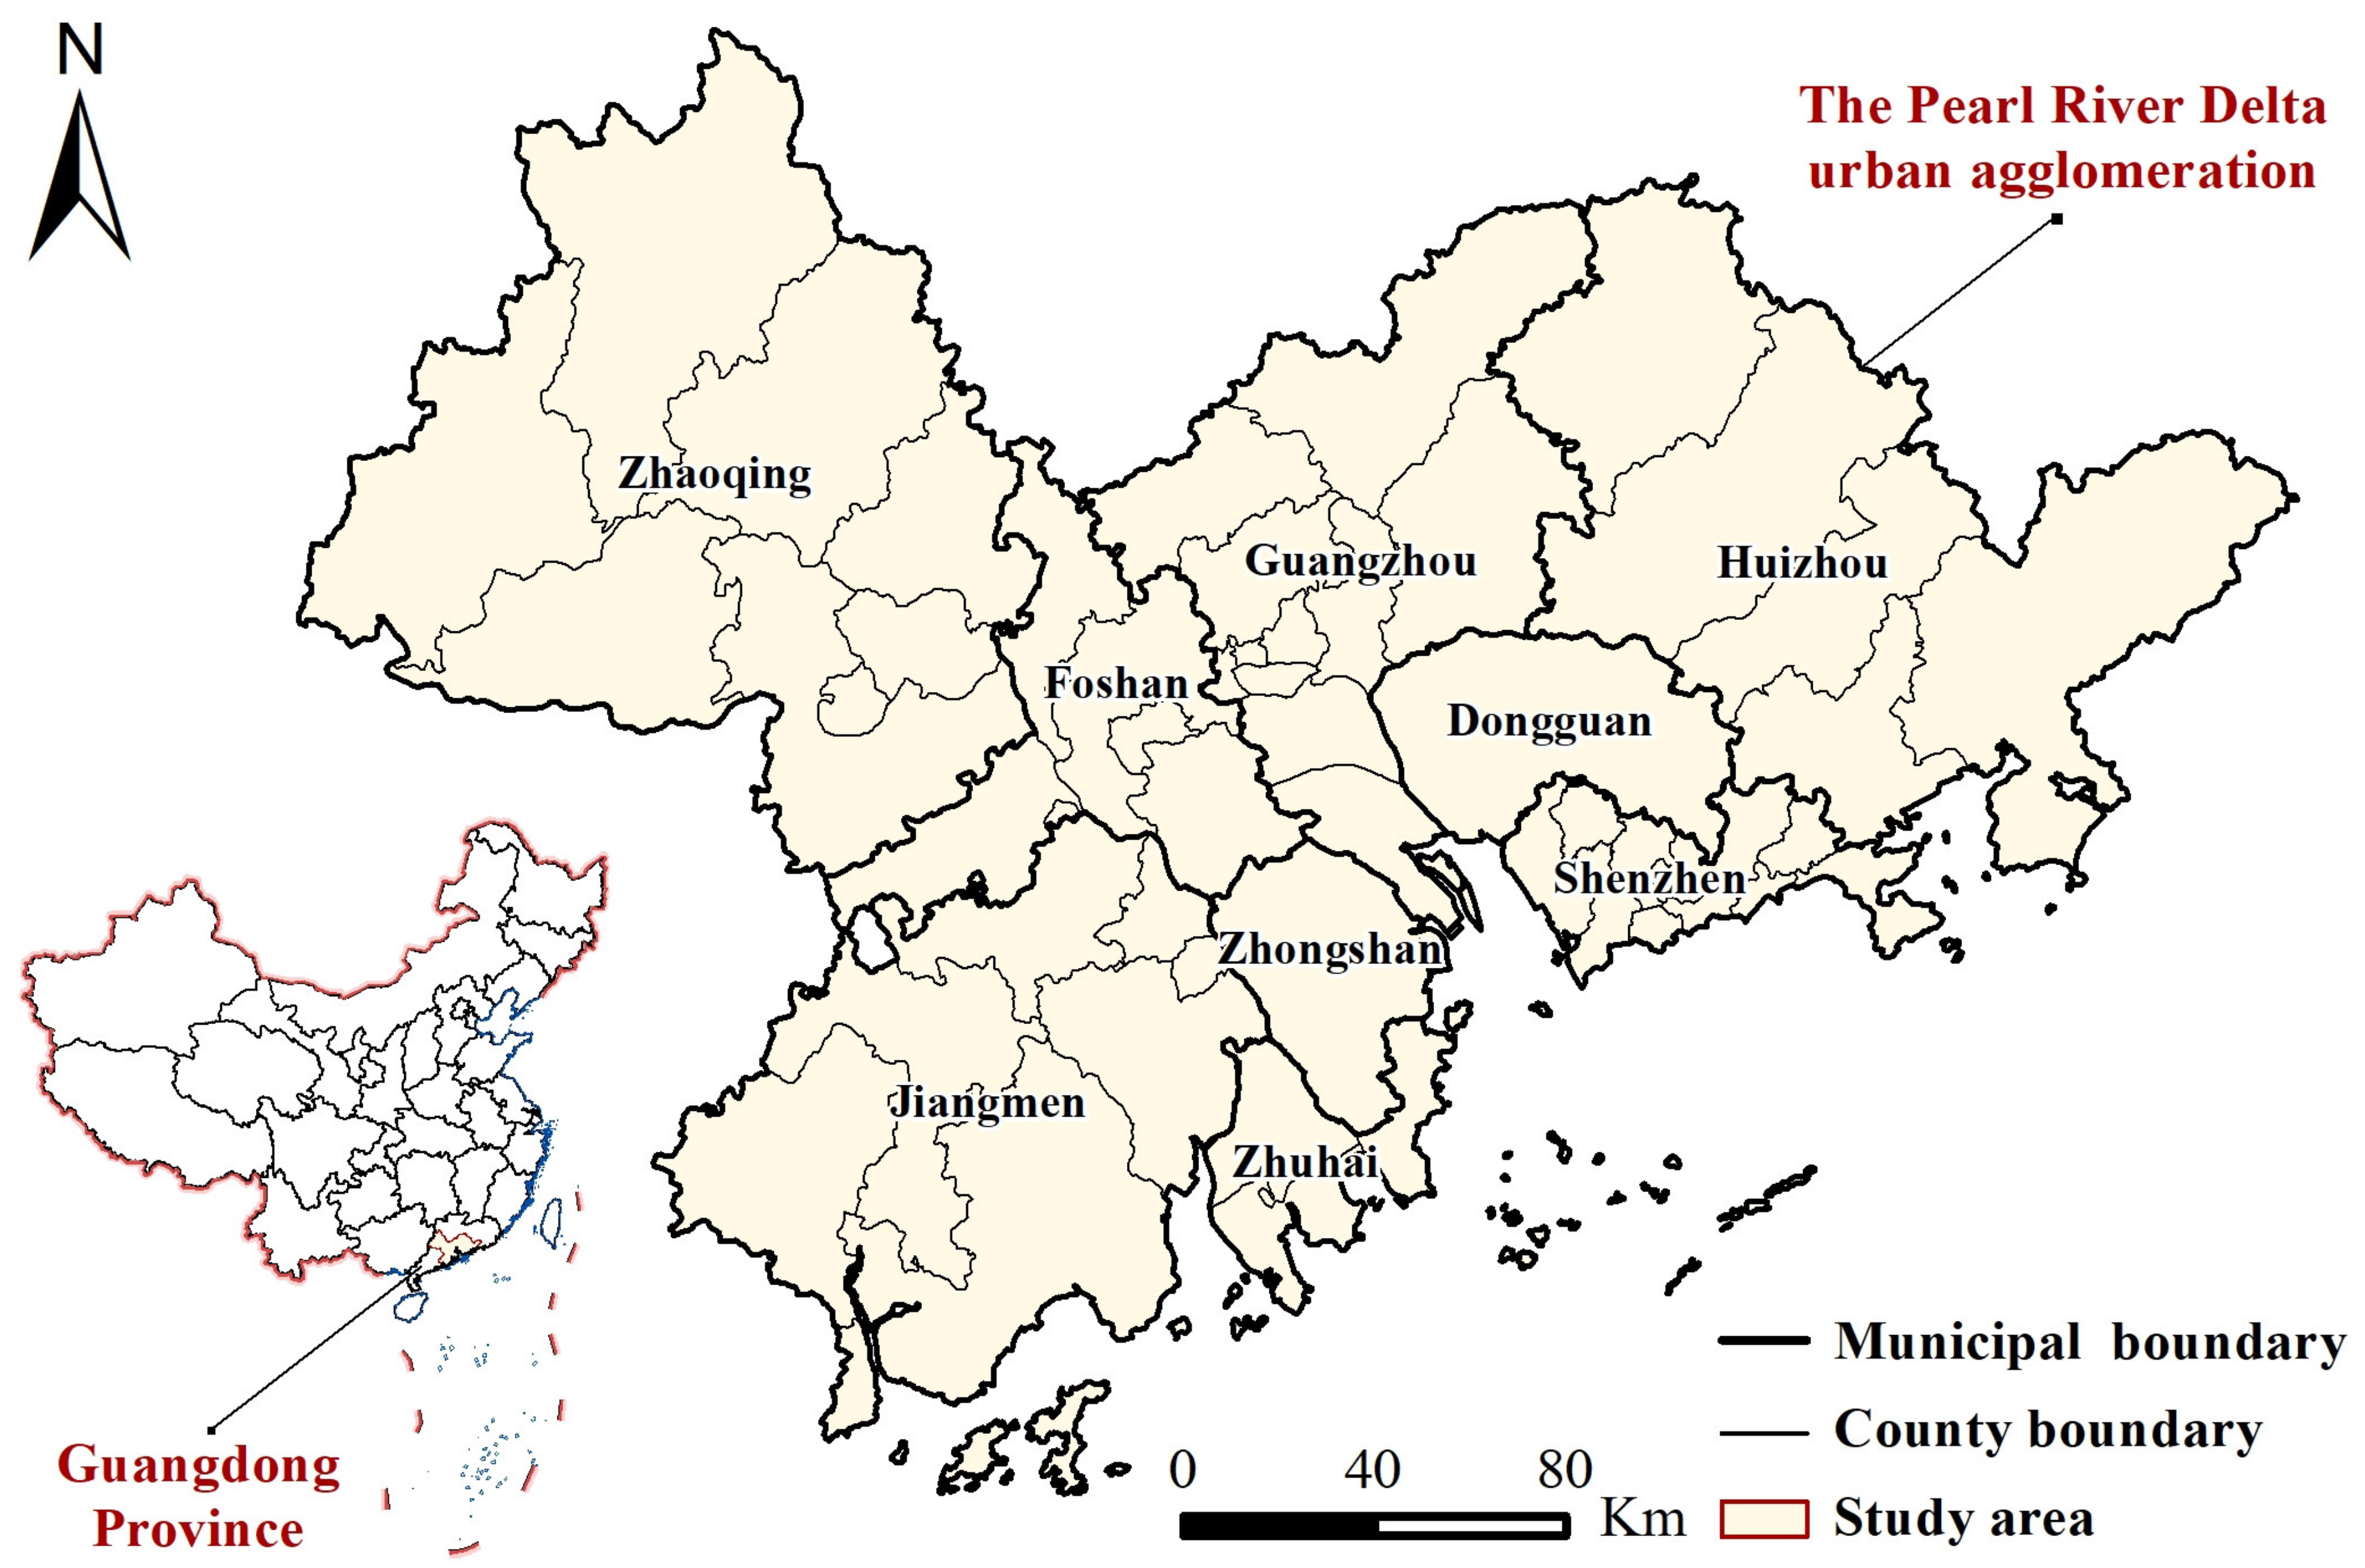
Located in Guangdong Province in China, the PRD urban agglomeration (Figure 3), downstream of the Pearl River, comprises nine prefecture-level cities: Guangzhou (GZ), Shenzhen (SZ), Foshan (FS), Dongguan (DG), Zhongshan (ZS), Zhuhai (ZH), Jiangmen (JM), Huizhou (HZ), and Zhaoqing (ZQ). It covers an area of approximately 55,000 km2, with an urbanization rate of 70% on average. In this area, large cities with vague boundaries form a broad metropolitan interlocking region, while small cities are scattered beyond the core region.

3.2. Data Sources

Four types of data were used in this study: remote sensing data, geographic big data, spatially mapped statistical data, and basic geographic data (Table 1). Landsat remote sensing (RS) images with less than 10% cloud coverage were obtained from the Geospatial Data Cloud. The National Land-Use/Cover Database of China (CNLUCC), interpreted visually from remote sensing imagery by human–computer interaction, was provided by the Resource and Environment Science Data Center (RESDC). The NPP-VIIRS nightlight data produced by the Earth Observation Group (EGO) have significant improvements compared to DMSP-OLS data because they eliminated the interference of stray light, lightning, and lunar illumination. POIs of geographic big data were derived from AMAP (Appendix A), a Chinese digital map content provider that we used to access more than 250 categories of POIs with various geotags. Through the application program interface of Sina Weibo, POIs were imported, and Weibo check-ins whose positions are located on such geotags were collected. The number of check-ins represents the popularity and attractiveness of the location for app users [39]. The land transaction price was obtained from the website ‘Landchina’, along with other information of land transaction projects from 2010 to 2020, such as latitude and longitude coordinates. Data examples of POIs, check-ins and land transaction are shown in Table A1, Table A2 and Table A3. Street images were obtained from the Baidu street view map, and the spatially mapped statistical data, GDP, and population distribution at 1 km resolution were also provided by RESDC. Basic geographic data included road networks, water areas, and administrative boundaries.

3.3. Identifying the Boundary of Built-Up Areas Using Fusion Method

CNLUCC includes six primary land types, which are further divided into twenty-five secondary categories. Primary type ‘Urban and rural industrial, mining, and residential land’ comprises three secondary categories, namely, urban land, rural residential area, and other construction land. ‘Urban land’ was selected to identify one kind of initial boundary of built-up areas (Boundary I).
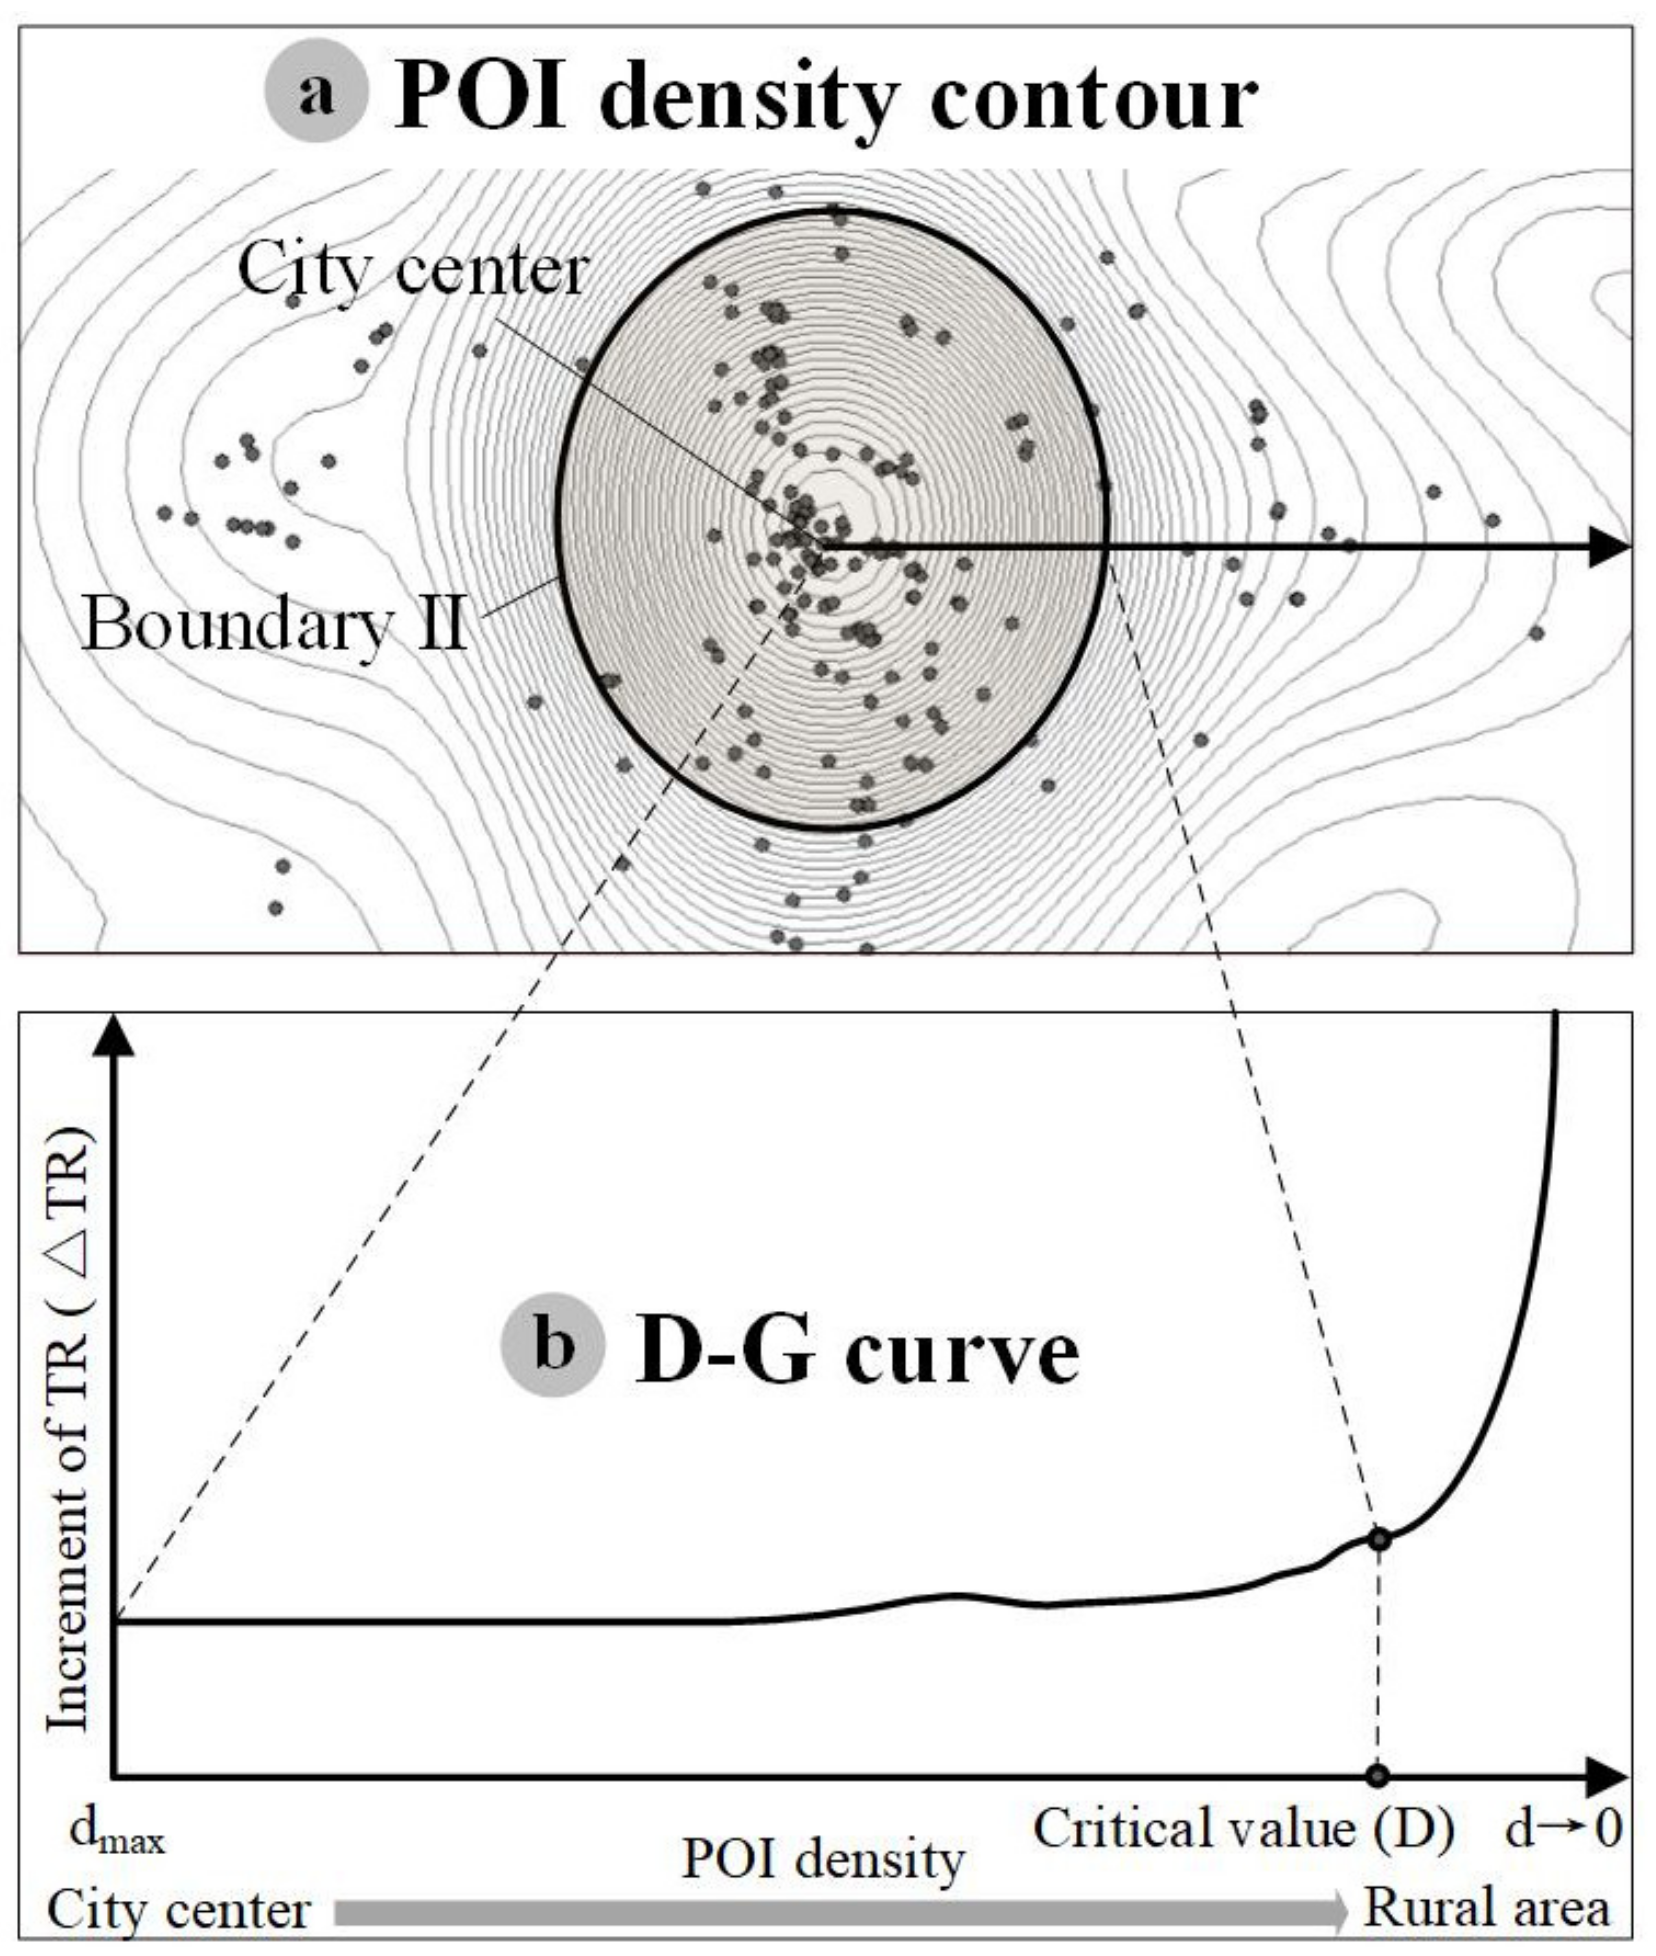
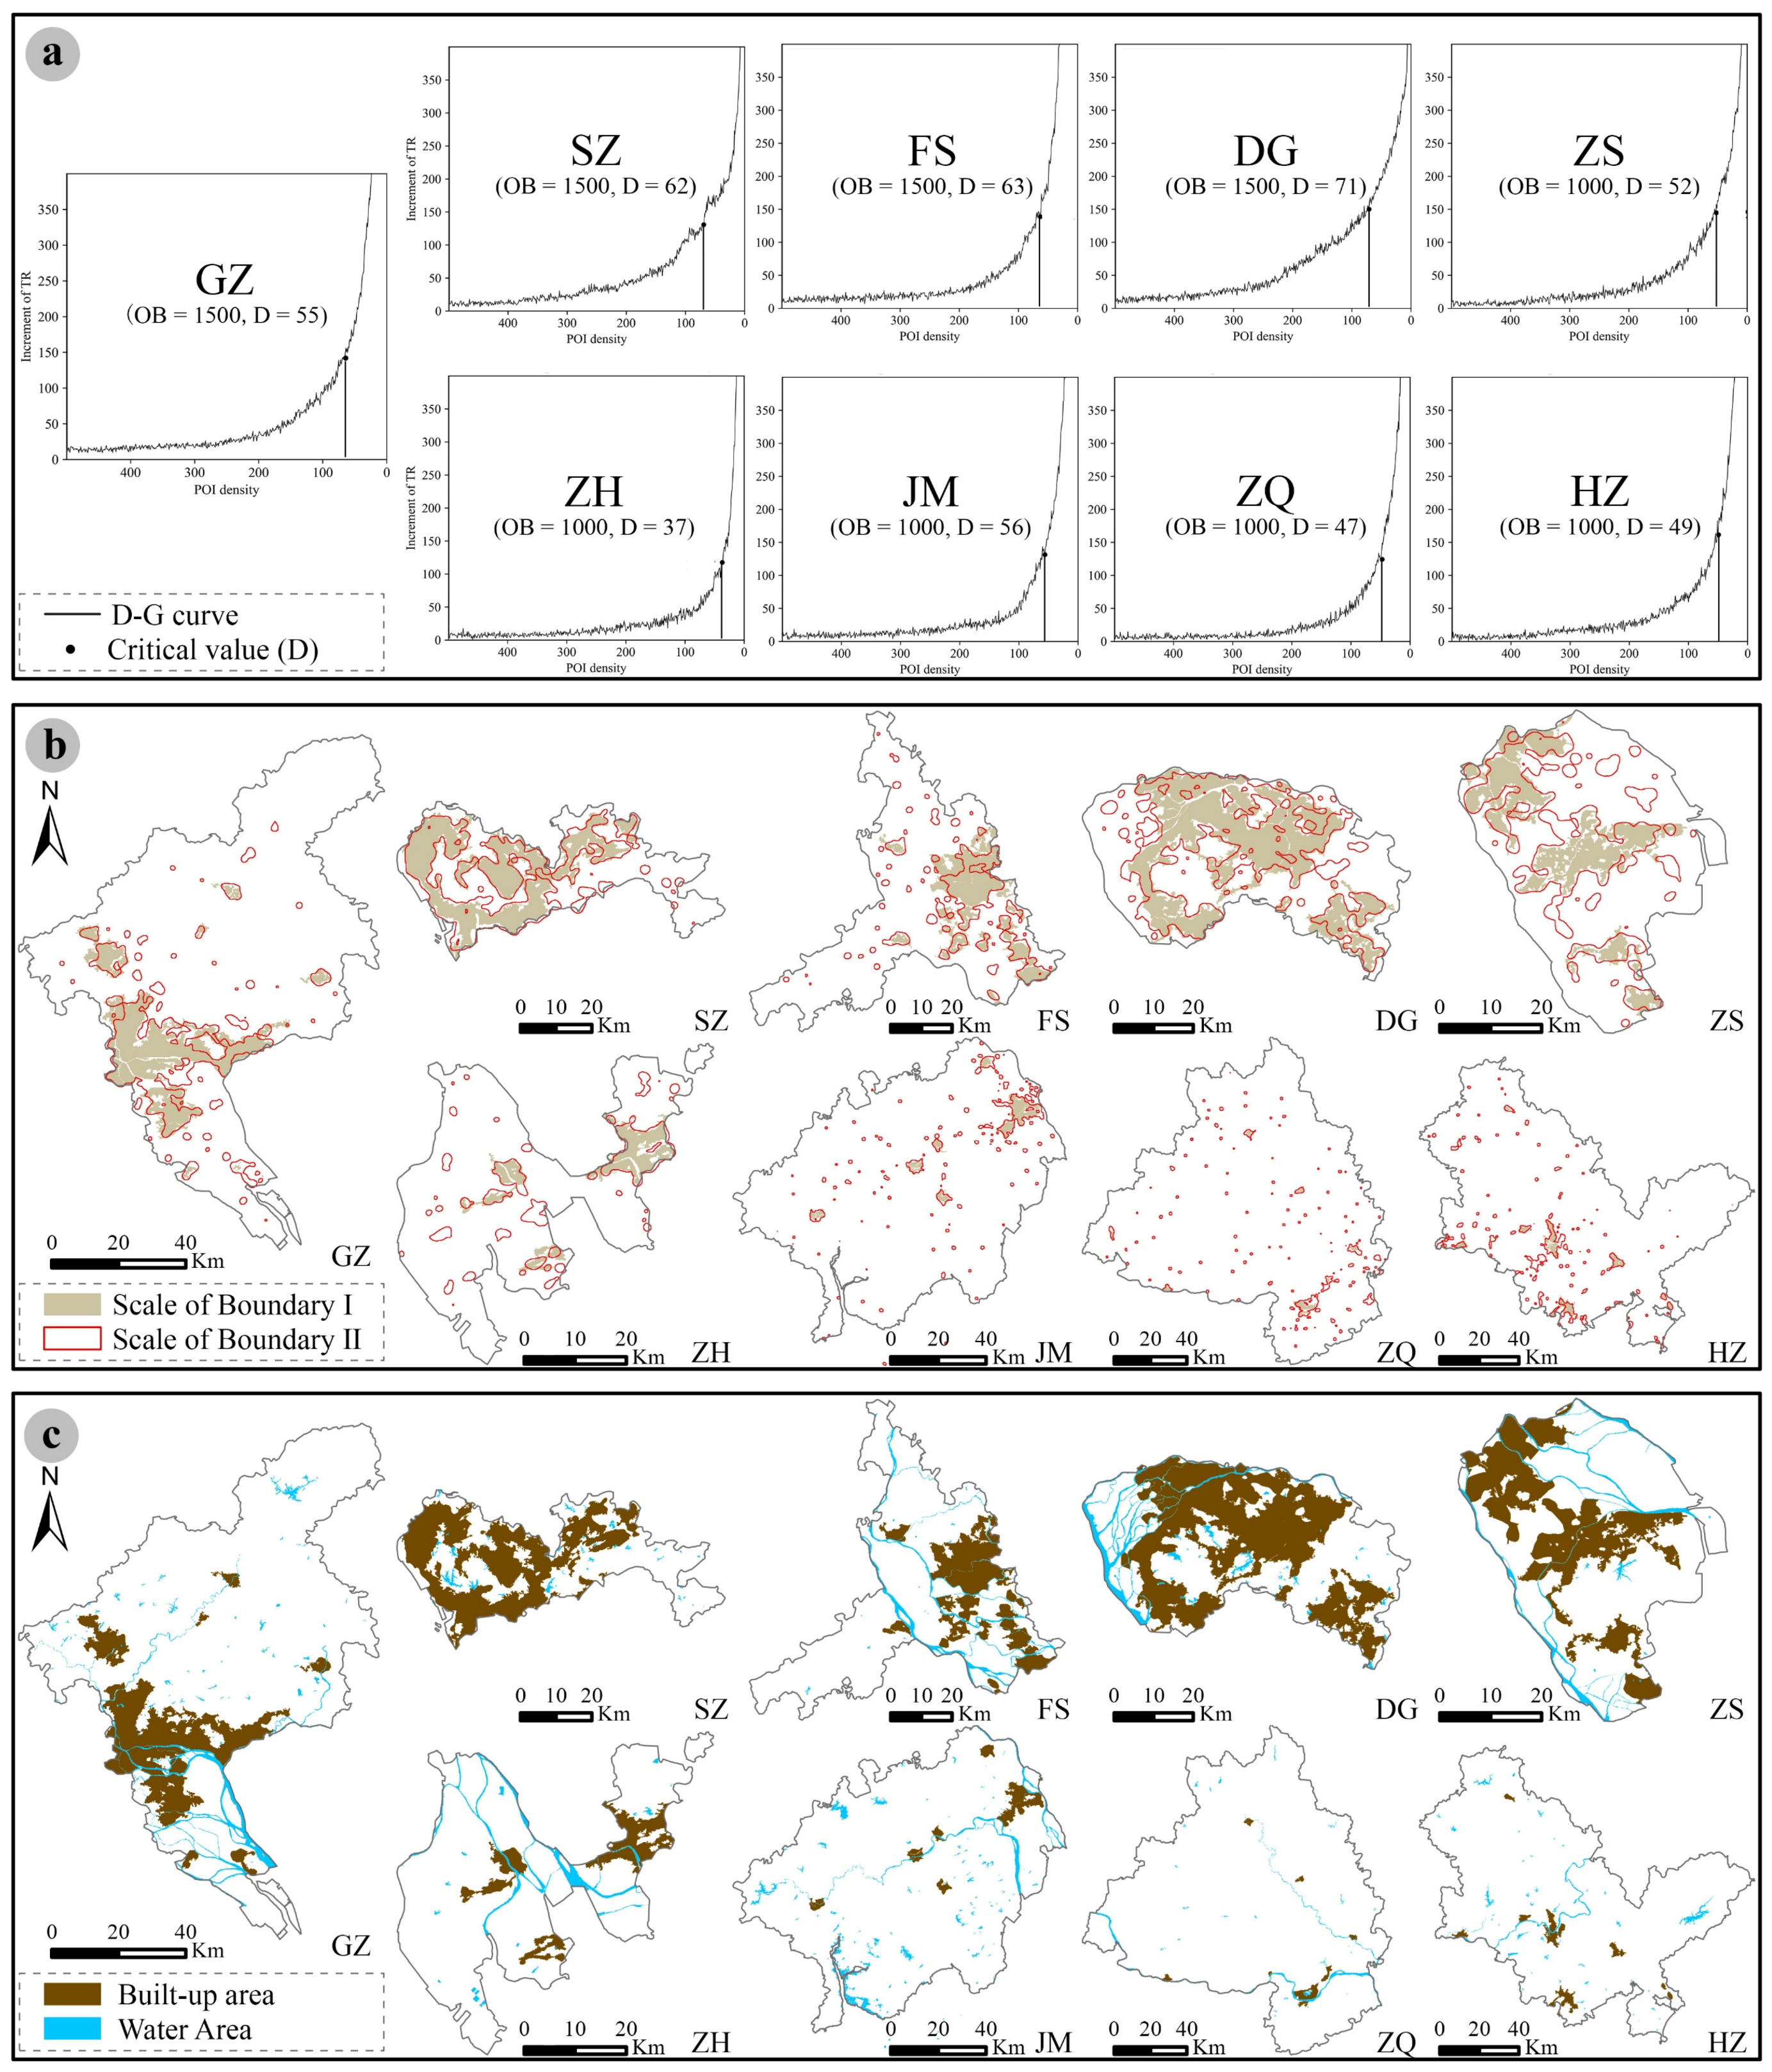
According to Xu and Gao [19], using the kernel density estimation (KDE) of POIs, the D-G method can effectively extract built-up areas. From city centers to rural areas, POI density declines rapidly but then more and more slowly while the corresponding contours change from dense to sparse (Figure 4a). The D-G curve describes the relationship between POI density (d) and the theoretical radius increment of contours ( Δ TR ) (Figure 4b). With this curve, the value D will be found when the growth rate of Δ TR exceeds 5%, and finally the contour of value D is another initial boundary of built-up areas (Boundary II). The bandwidth in KDE was set as 500 m, 1 km, 1.5 km, 2 km, 2.5 km, and 3 km, and the optimal bandwidth (OB) was determined by result comparison.
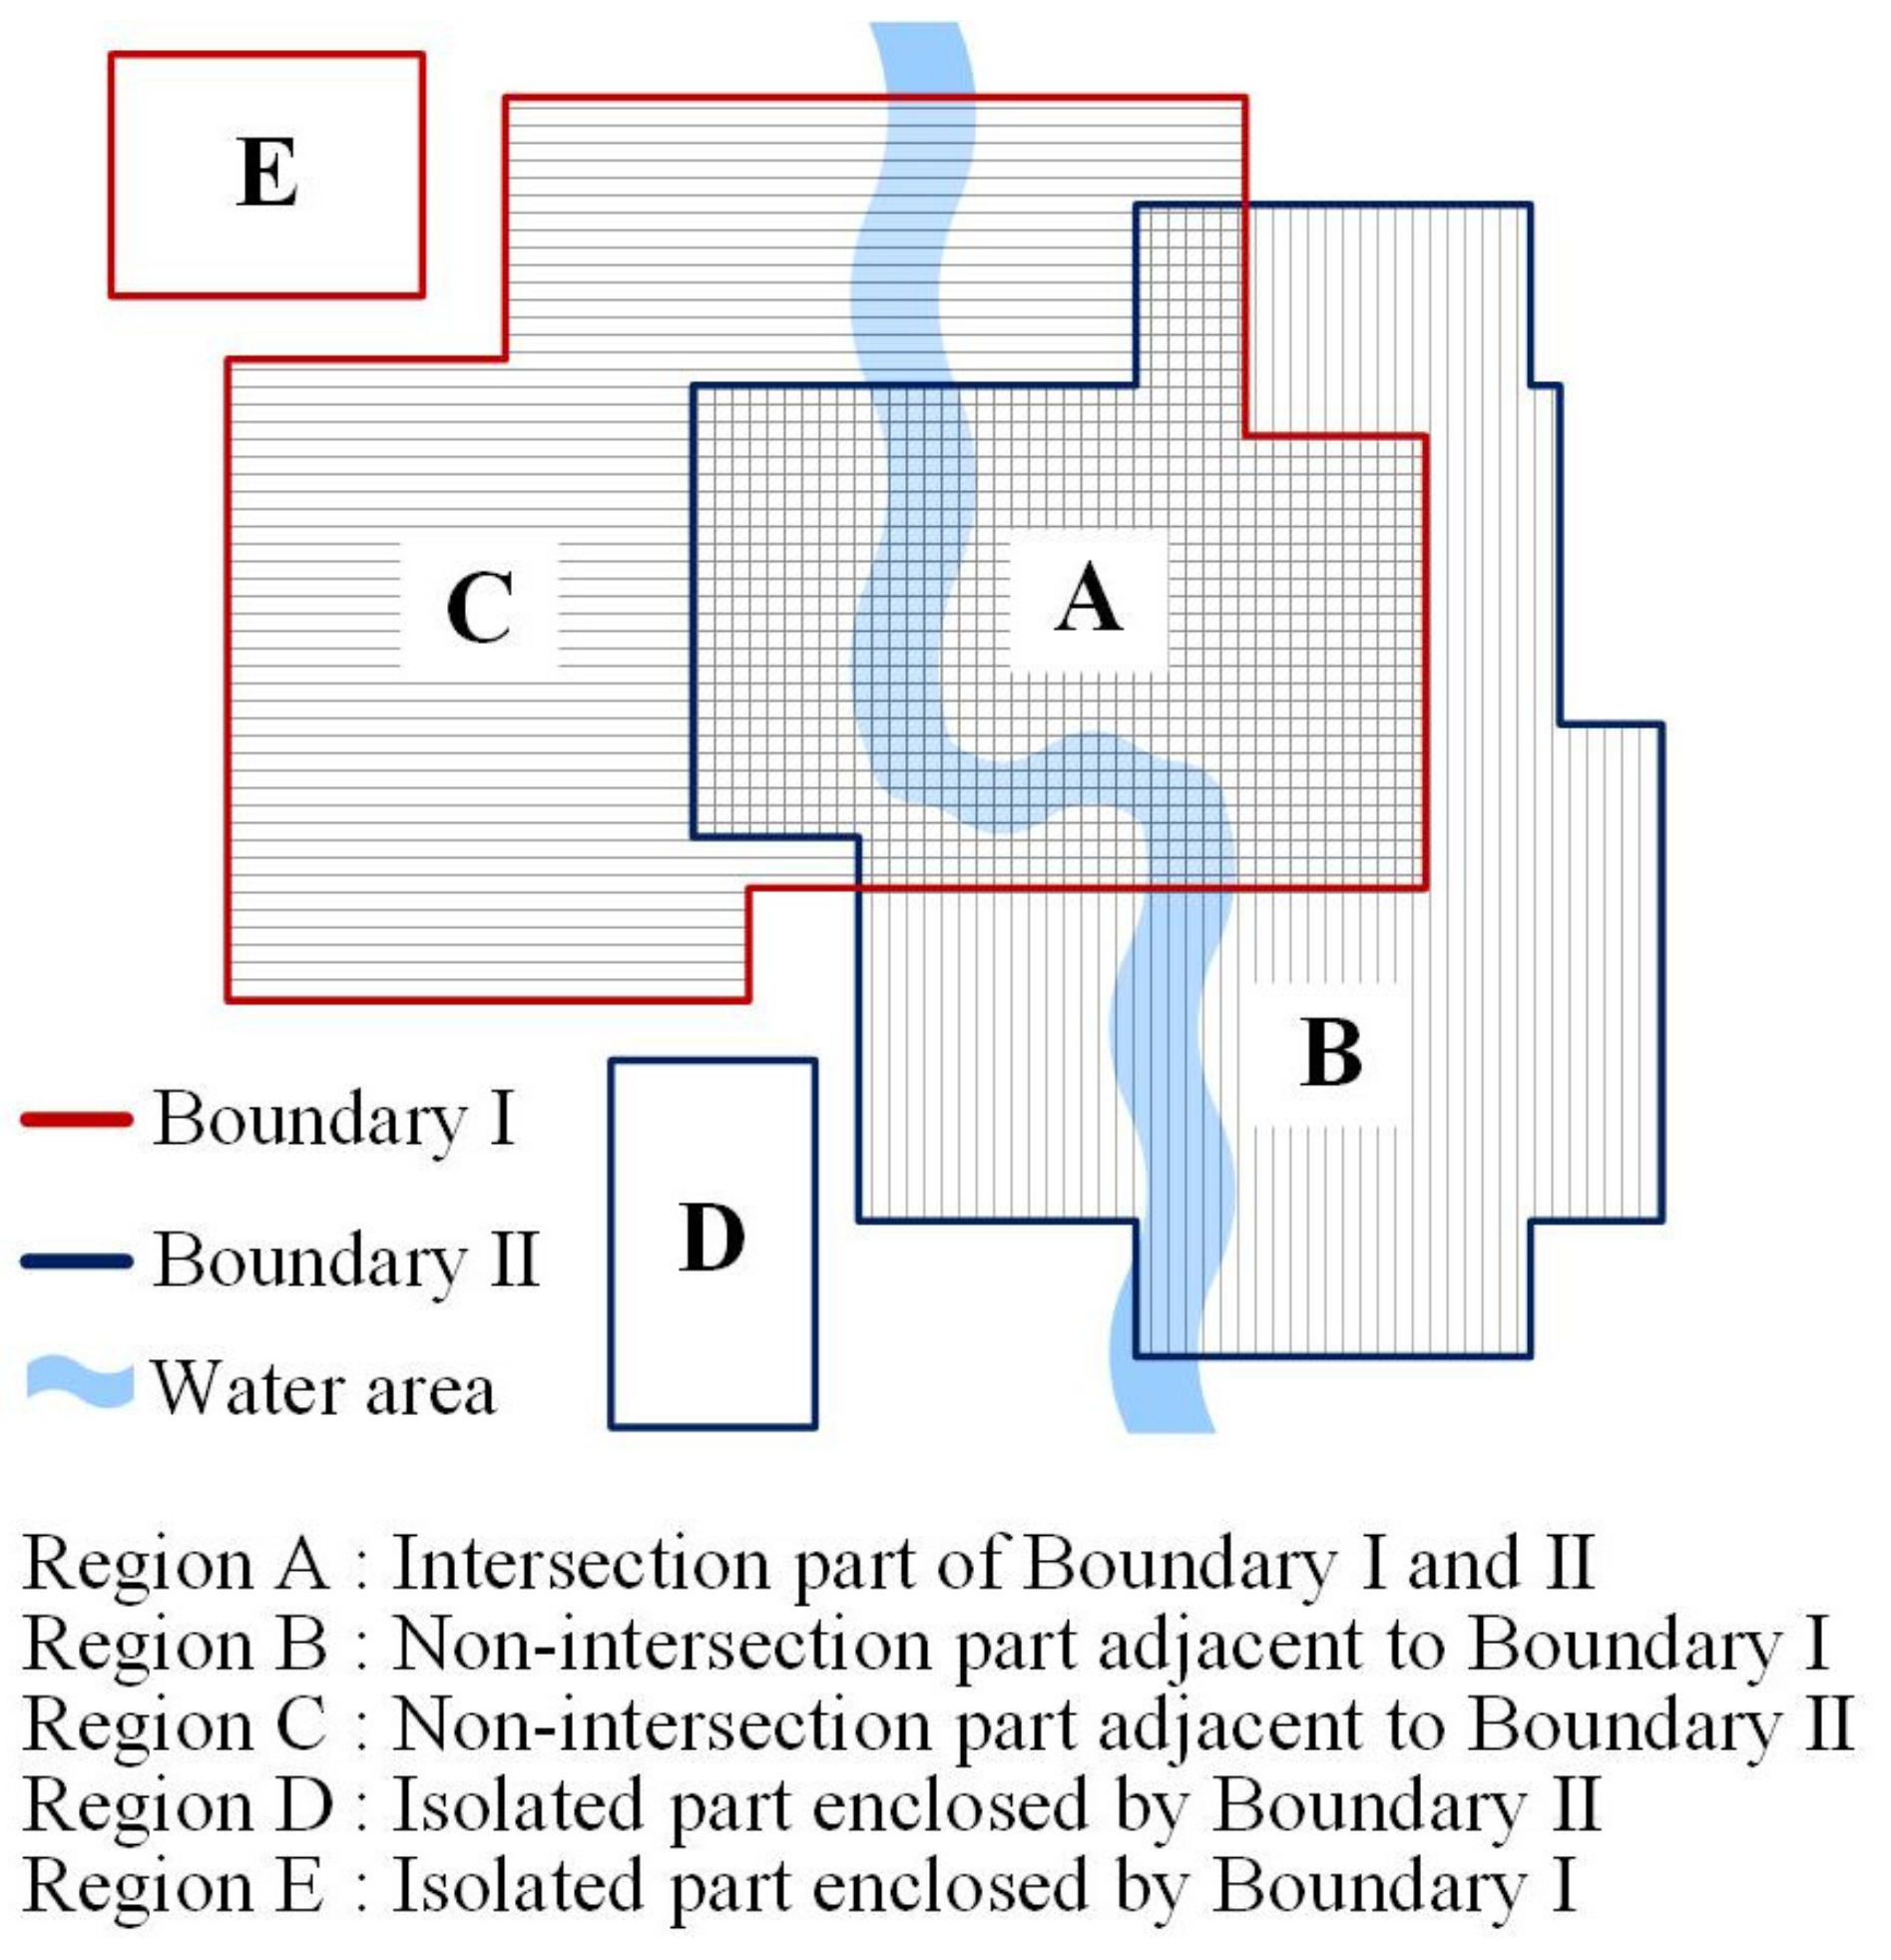
Five types of regions were obtained with the combination of Boundary I and Boundary II as illustrated in Figure 5. Region A is the intersection of the two boundaries, while Regions B–E constitute the non-intersections. Regions A and C belong to the built-up areas in this study. Equipped with adequate facilities, Region B adjacent to Boundary I may be new built-up areas expanding outward from the core area, and parts of them were excessively identified due to the POI density overflow. Hence, compared to the satellite images, areas in Region B that do not conform with urban landscapes would be removed. The remaining parts of Region B are referred to as Region B’ in the remainder of this article. Isolated areas enclosed by Boundary II are defined as Region D, which appears more like rural market towns than built-up areas because they are scattered outside the megalopolis and were subsequently removed. Similarly, Region E consisted of small and dispersed urbanized areas that were also removed as they were not constructed continuously. Additionally, this study reserved the natural incisions of rivers and lakes with an average width greater than 100 m. Finally, the built-up areas were obtained through the above steps.

3.4. Quantifying the Urban Vitality Indicators According to the Evaluation Framework

In this study, the POIs and check-in dataset played a key role in quantifying the density and accessibility of facilities, describing the types of urban activities, and reflecting urban land use. It is necessary to reorganize this dataset with numerous categories and to construct a three-tier classification system so that land use, urban activities, and facilities are connected organically (Table 2). Referring to the ‘Code for classification of urban land use and planning standards of developing land’ in China, this study distinguished seven primary land use types, such as public management and services, etc. [40]. With detailed volunteered geographic information, the check-ins located on POI geotags can describe different urban activities. For instance, cultural land where cultural visits occur is one type of land for administration and public services, and cultural visits can be identified by check-ins located on cultural facilities. POI geotags of AMAP represent specific facilities, for example, cultural facilities include museums, libraries, temples, heritage sites, etc.
To facilitate the evaluation of urban vitality, multiple-source data were utilized to quantify urban development, environment, and activities in 500 × 500 m grids. Regarding urban development, to obtain economic density, GDP at grids of 1 km2 was resampled at 500 m resolution [41]. Similarly, population distribution data were also adjusted to the same resolution by resampling. With the use of the KDE, POI density was used to characterize social development, along with population density. The density of cultural facilities by KDE represents cultural development. Road networks shape the skeleton and texture of a city, which contributes greatly to connecting urban space, so we selected road density (calculated by Equation (1)) and road intersection density (calculated by KDE) as relevant indicators to represent spatial development [42].
While characterizing the urban environment, land price provides important information on the condition of the urban economy [43]. First, we divided the transaction price by the exact area to obtain the land price per square meter, and then, based on the coordinates of transaction projects, we adopted the Kriging interpolation method to obtain the continuous distribution of the land price. Through the near analysis method, accessibility to facilities such as metro stations, schools, parks, hospitals, and farmers’ markets characterized the social environment. Similarly, accessibility to cultural facilities affects citizens’ attitudes towards experiencing culture, representing the cultural environment. Spatial environment referred to the built environment in previous studies, with important indicators such as the floor area ratio and building density [44]. Generally, it is difficult to access a city’s entire building footprint, so we used NDBI as a substitution (calculated by Equation (2)). Land use intensity was quantified as the maximum value of the NDBI, and building density equals the coverage ratio of construction land (calculated by Equation (3)).
R o a d   D e n s i t y = R o a d   L e n g t h / A
N D B I = M I R N I R / M I R + N I R
B u i l d   D e n s i t y = C o n s t r u c i t o n   L a n d / A
L a n d   U s e   M i x t u r e = 1 ln n i = 1 n p i ln p i
In Equation (1), Road Length refers to the total length of roads in each grid, while A is the area of the grids. In Equation (2), 𝑀𝐼𝑅 refers to the pixel value of the infrared band, and 𝑁𝐼𝑅 refers to the pixel value of the near infrared band. Generally, Construction Land refers to pixels with an NDBI greater than zero, and its area is the numerator in Equation (3). In Equation (4), p i is the proportion of single-type POIs compared to the total number of all POIs, and n is the number of types, which is seven in this study.
Through weighted KDE, we adopted nine categories of check-ins to describe the intensity of economic, social, and cultural activities. The number of check-ins was taken as the weight parameter in estimation. Land use mixture (LUM) guarantees diverse activities, which are key to improving vitality. Quantification of the LUM based on POIs has a solid foundation in research, and this study adopted Shannon entropy. According to the three-tier classification system, seven types of POIs characterizing land use were used for calculation (Equation (4)). In summary, the description and quantitative method of indicators are listed in Table 3.

3.5. Assessing the Urban Vitality Using the BPNN Machine Learning

3.5.1. Data Normalization

Before model training, the indicators with different orientations were normalized by Equations (5) and (6) below. Among 25 indicators, six of them (B2~B7) were negative, and the rest of them were positive.
f o r   p o s i t i v e   i n d i c a t o r s :   r i = μ i μ m i n μ m a x μ m i n
f o r   n e g a t i v e   i n d i c a t o r s :   r i = μ i μ m a x μ m i n μ m a x
where μ i is the indicator value of one object, μ m i n is the minimum value, and μ m a x is the maximum value.

3.5.2. Building a Training Sample

The training sample that consists of sample feature and sample targets should cover all typical characteristics. Fuzzy clustering combined with random sampling was used to build the training sample. With the use of k-means analysis, all grids were first fuzzily clustered into several categories according to the proximity of each grid without prior knowledge [45]. The collection of sample features was then determined by random selection in each category at 10%. In addition, nighttime light has a positive correlation with urban vitality, so it is an applicable proxy for sample targets [27]. Therefore, the value of nighttime light data in sample grids were collected to serve as sample targets. Before that, outliers in nighttime light data were replaced by the average of the neighboring value in advance.

3.5.3. The Structure and Establishment of the BPNN

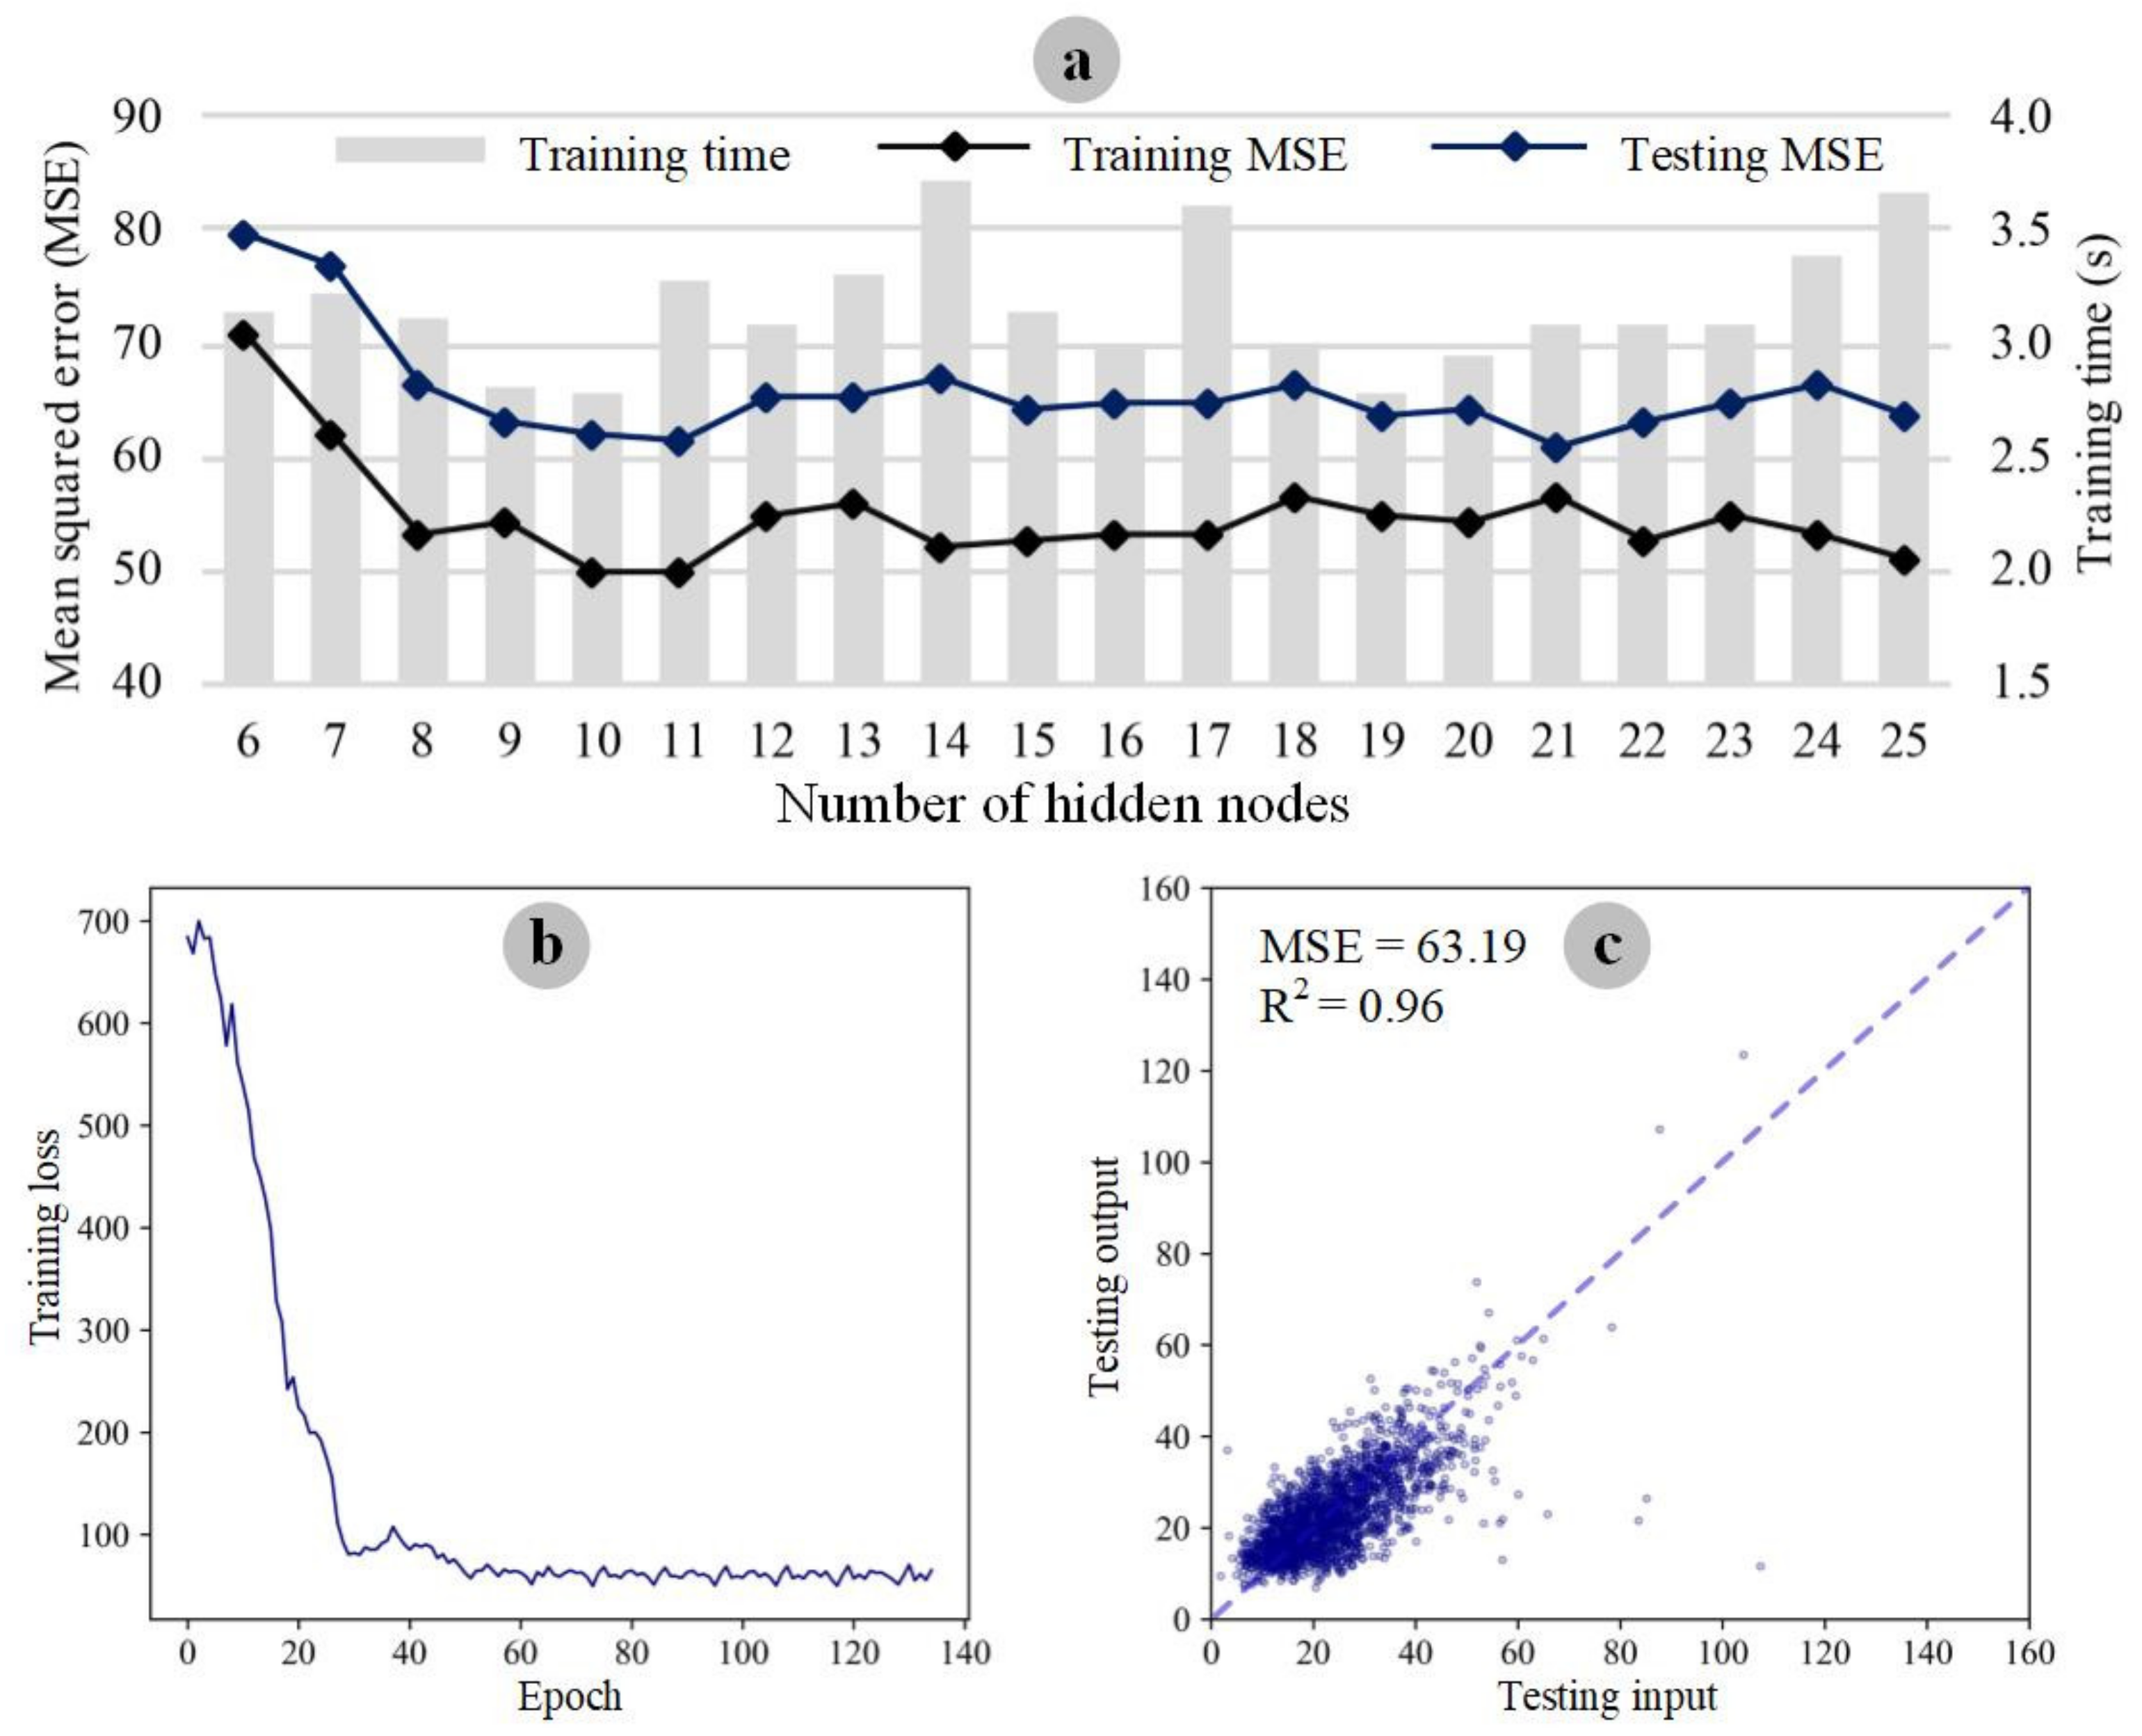
We adopted a classical three-layer structure of the BPNN. Data information was transmitted to hidden layer and then transformed through the activation function. Furthermore, the loss function was used to calculate errors between the forward propagation result and real values to adjust the interconnection weights between the individual neurons in the next iteration until the errors were compressed. As demonstrated by previous research, we confirmed that the range of hidden nodes was from 6 to 25 based on Equation (7) [46]. The optimal number of hidden nodes was obtained using repeated trials.
s = x y + α
where x is the number of input nodes,   x = 25; y is the number of output nodes, y = 1; and α is a constant between l and 10.
The gradient descent algorithm was employed for training, and the rectified linear unit function was used as the activation function in the hidden layer. Training and testing errors were calculated with the mean square error (MSE) function, the method of early stopping was used to avoid overfitting, and the learning rate was set as 0.001. All samples were divided into two groups: 80% for training and 20% for testing. The fitting model was saved to evaluate urban vitality for all grids.

4. Results and Analysis

4.1. Boundary Identification of the Built-Up Area in the Pearl River Delta

Considering the differences among cities with various sizes, the D-G curves of the nine cities were drawn with different optimal bandwidths. Furthermore, by assessing the irreversible growth of the D-G curve, the critical values were obtained and are demonstrated in Figure 6a. As illustrated in Figure 6b, Boundary I, enclosing Regions A, C, and E, had clear serration, while Boundary II, enclosing Regions A, B, and D, was relatively smooth. The area proportions of the five types of regions in each city are illustrated in Table 4. As expected, big cities had large areas of Region A. Urbanization is the main driving factor of land expansion; however, big cities lead the inventory planning that aims to optimize land use rather than increment planning. This causes a very low rate of the expansion of built-up areas. Consequently, the government has promoted the optimization and adjustment of built-up areas through urban renewal, which results in the overlapping of urban land that is both dominated by urban landscapes and is equipped with facilities. According to the fusion method described in Section 3.3, the extracted built-up areas in the PRD urban agglomeration illustrated in Figure 6c represent the spatial scope for urban vitality.

4.2. Vitality Evaluation with the BPNN

4.2.1. Performance of the Model

Controlling the same condition, the performance of the BPNN with different hidden nodes was recorded when the training loss began to converge. The training MSE and testing MSE had similar trends, demonstrating that both reached the interval minimum when the number of hidden nodes was 10 or 11 (Figure 7a). Although the training MSE was low as the node number was set to 14 or 22, the testing MSE was high. After trials and comparison, the 25-10-1 network structure whose hidden layer consisted of 10 neurons performed best on the testing data (MSE = 63.19) and was determined as the optimal structure. As illustrated in Figure 7b,c, the 25-10-1 network showed high robustness in evaluating urban vitality in the sample. The training loss became low and stable, and there was a positive correlation with a coefficient of 0.96 in the scatter plot of the tested input and output. Subsequently, we adopted this model to evaluate the urban vitality of all grids.

4.2.2. Vitality Analysis among Cities with Different Scales

As illustrated in Figure 8a, the urban vitality evaluation of the PRD urban agglomeration at 500 m resolution was divided into seven grades using the natural break method: very high, high, medium high, medium, medium low, low, and very low. Furthermore, the proportions of grids with vitality grades were calculated to compare the vitality performance (Table 5). This demonstrated Guangzhou and Shenzhen as the two most vibrant cities in the PRD, accounting for 98% of the very high vitality grids. Most of the high vitality or above grids were in the central areas, but something different also emerged from the two vibrant cities. In Guangzhou, vitality distribution presented a radial pattern from the vital core areas, similar to the traditional central axis in Yuexiu district and the central business district (CBD) made up of Zhujiang New Town in Tianhe district. These formed two distinct vitality poles surrounded by relatively low vitality areas. Shenzhen had a continuous and linear range of high vitality or above regions in the south, which covered the Shenzhen International Convention and Exhibition Center in Futian district and Caiwuwei CBD in Luohu district. Additionally, under the unified classification of urban vitality, there was a gradient declining trend of the vitality poles’ grade as the city scale decreased. For example, high-vitality grids constructed the vitality pole of Foshan with a scale following Guangzhou and Shenzhen, and medium–high vitality grids constructed the vitality pole of Dongguan and other cities with much smaller scales. While the central area dominated the vibrant areas, low vitality or below grids were mainly distributed at the edge of built-up areas. In summary, the results reflect that the urban vitality of the PRD urban agglomeration presented a core-edge structure, and the proportion structure of vitality changed with a city’s scale.

4.2.3. Vitality Comparison among Different Types of Built-Up Areas

The proportion of vitality grades among the grids based on the three types of built-up areas was also calculated. As illustrated in Figure 8b, an inverted pyramid structure of the vitality level from high to low existed in Region A, sharing 85% of very high vitality grids but approximately 15% of very low vitality grids. Built-up areas in Region A have been well-developed, and its characteristic of urban landscape and good infrastructure is conducive to the generation of urban vitality; hence, it is the most important area for production and living. On the contrary, built-up areas of Region B’ after extraction from the original Region B presented an inverse proportion structure with 10% of very high vitality grids, and the proportion of very low vitality grids increased to 38%. Region B’ originated from the expansion of urban land, and although facilities in Region B’ are adequately equipped, the planning of development and construction is relatively poor, which leads to the current situation of single-function development. These low-end commercial and residential services are unable to meet the needs of citizens for various urban functions, and citizens are forced to consider their options if the chance to leave arises. For instance, a lack of high-end medical and cultural services will force people to settle in places where these services are easily accessible. As a result, Region B is unlikely to become as vibrant as Region A. Surprisingly, there was a large difference between Region C and Region A, which connected originally. While very high vitality grids hardly appeared in Region C, it contained about half the number of very low vitality grids. This illustrates even if built-up areas are spatially adjacent, facility sufficiency may lead to huge contrasts in urban vitality. With a home–work separation, the broad industrial areas where people engage in production instead of shopping, recreation, and other activities during the day potentially belong to Region C. Because of inadequate interaction between citizens and urban spaces, Region C was less vibrant than Region B and much less vibrant than Region A

4.3. Contribution of Indicators Applied to Evaluating Urban Vitality

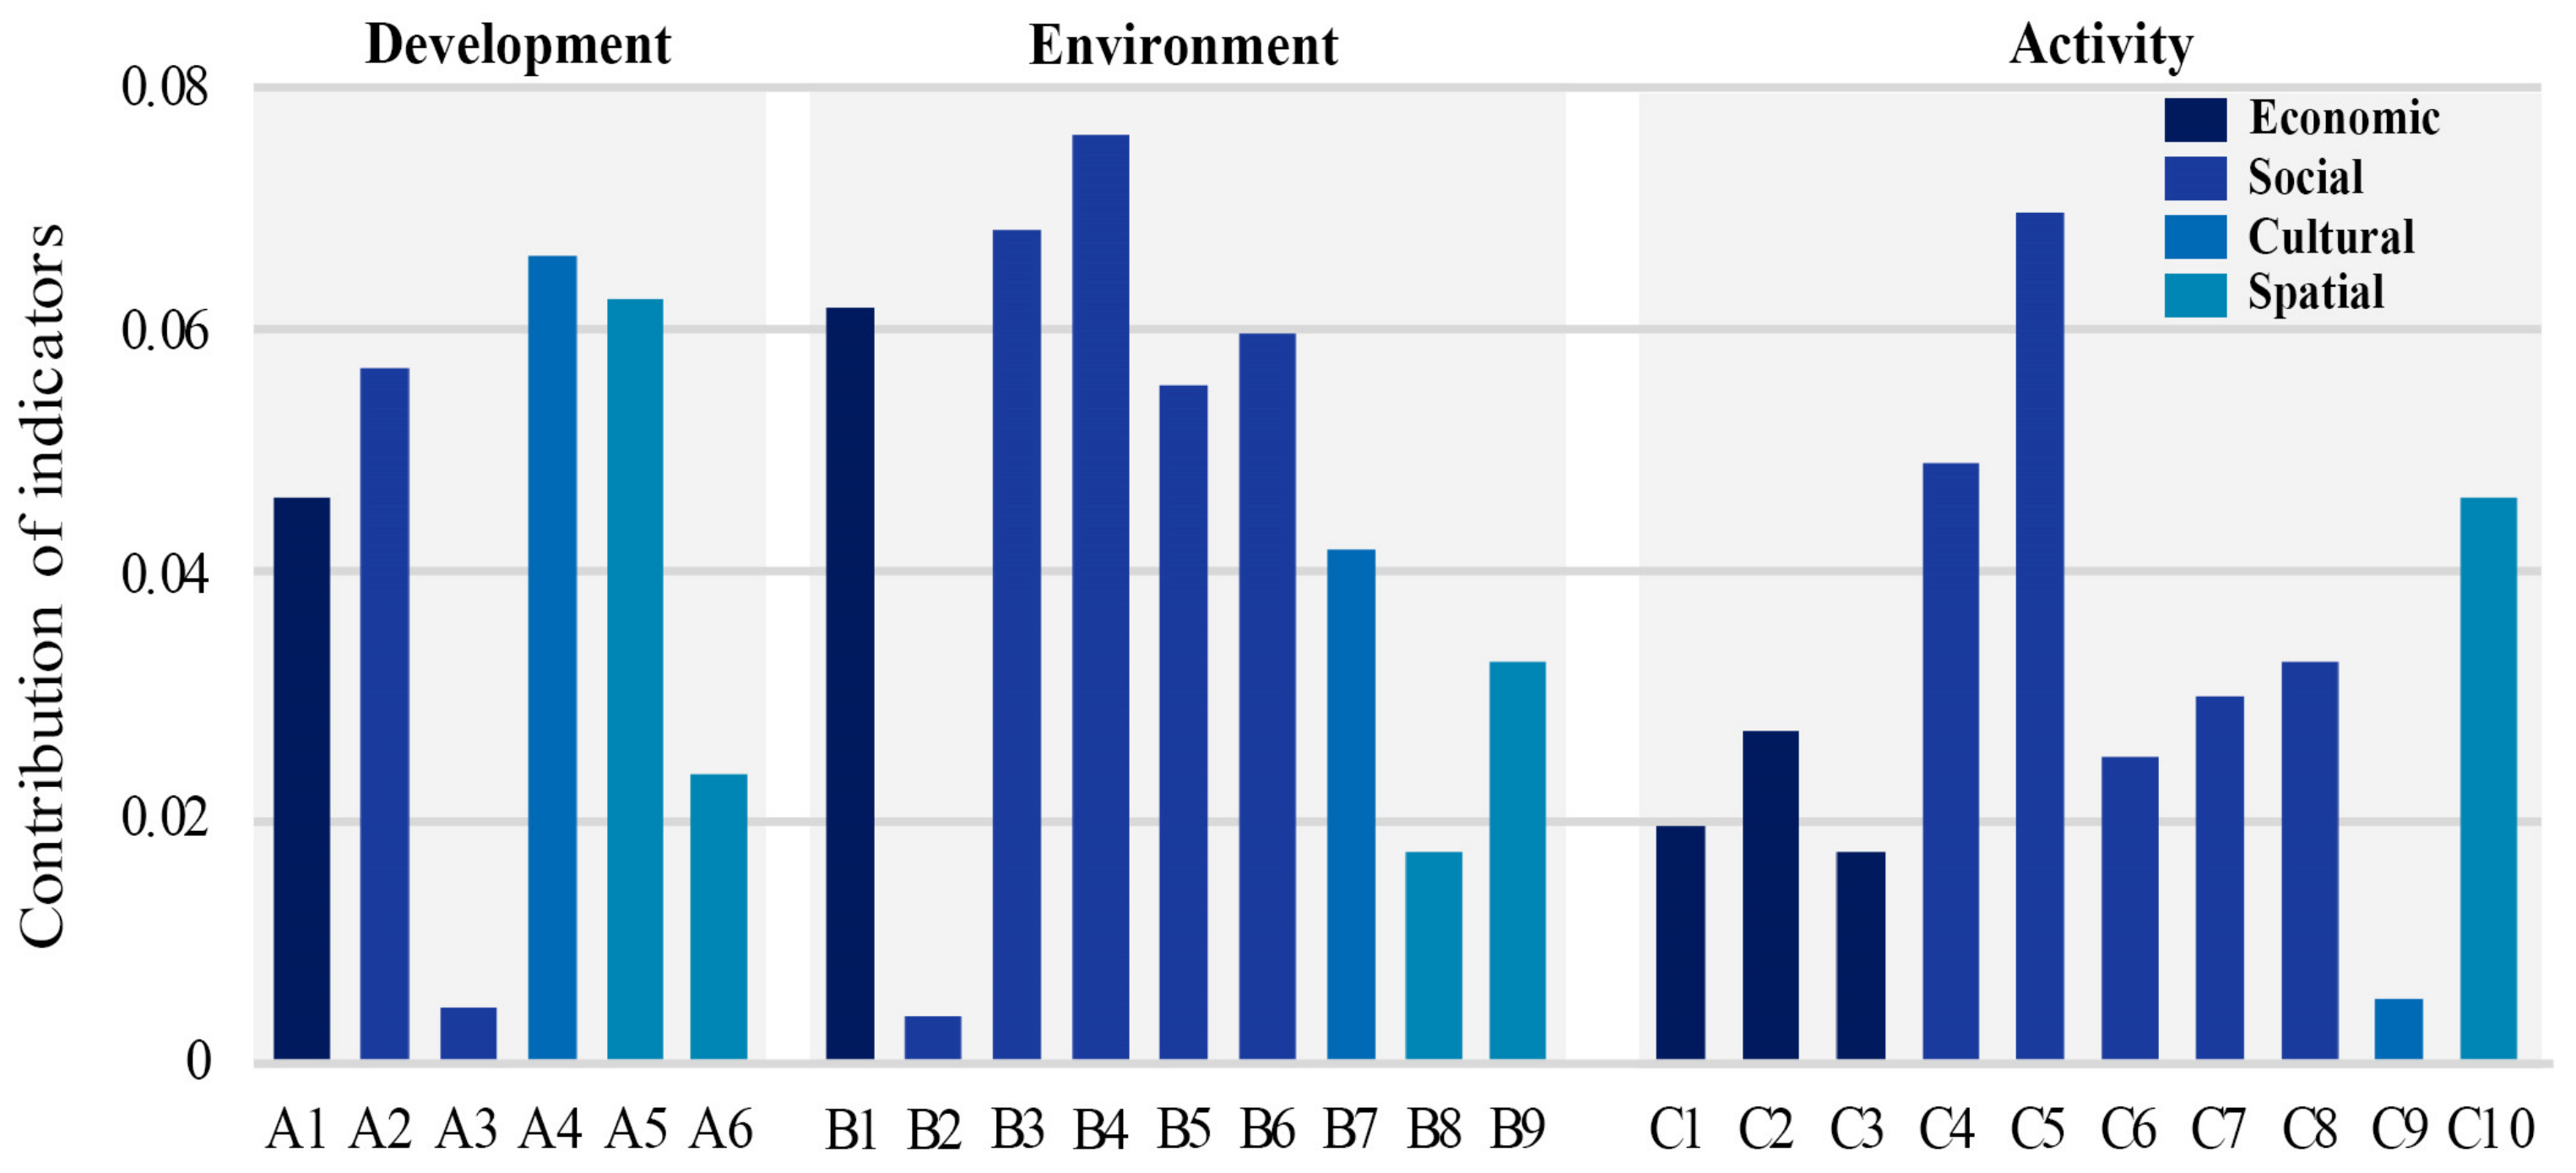
To investigate the contribution of each indicator, Sun and Wang’s [47] method was used to calculate the training weight of neurons, which is illustrated in Figure 9. The greater the weight of the indicator, the more important it is. If each indicator is at the same level of importance in evaluation, the weight would be 0.04 on average. Therefore, this paper took 0.04 as the benchmark for the following analysis.
For economic dimension, economic density (A1) and land price (B1) showed a high level of contribution. This may indicate that areas with high economic density enable the full support of urban construction that needs financial investment in infrastructures or industries [48]. Hence, they are more likely to become vibrant. In addition, the land price that determines the nature of land usage is also important for boosting vitality. On the other hand, working (C1), catering (C2), and shopping (C3), the three kinds of economic activities, did not contribute as greatly as found in previous research, which took the city center as the study area. The economic development and environment of a city give urban vitality a better interpretation than activities of tertiary industries.
For social dimension, the high contribution of population density (A2) emphasized the importance of citizens compared with facilities (A3), which indicates that citizens play a bigger role in the interactions that generate urban vitality interactions. Distance to schools (B3), parks (B4), hospitals (B5), and farmers’ markets (B6), which affect the convenience of daily life, are in support of increasing vitality. The activity intensity of commuting (C4) and education (C5) had good performance for evaluation, which indicates urban vitality may be stimulated by the active population—commuter and students. However, accessibility to the metro, activities of recreation, medical care, and life service showed less importance.
For cultural dimension, the significant contribution of cultural facilities density (A4) and accessibility (B7) suggested the city culture, as a kind of soft competitiveness, may improve urban vitality by enhancing the coverage of services. Additionally, as the representatives of cultural relics and historical sites, old buildings such as temples and ancestral halls highlight the aesthetic value of urban environments [49].
For the spatial dimension, road networks (A5) that shape a small-block city texture may benefit urban vitality, as suggested by the high contribution. A small block in downtown is more pedestrian friendly than a large residential area in a suburb, which probably provides an environment for continuous and dense human activities. However, the road intersection density (A6) performed relatively poorly, and this may result from the grid size. Grids at 500 m resolution are slightly larger than blocks with an appropriate scale of 200 m, and the spatial heterogeneity of the road interaction density may not be so significant [50]. Contrary to land use intensity (B8) and building density (B9), the land use mixture (C10) contributed greatly to urban vitality evaluation, emphasizing the importance of land use mixture to improve vitality.

4.4. Case Validation of the Vitality Evaluation

We used remote sensing images and street images to verify the evaluation results. A series of typical cases with the same vitality grade were chosen, and each one covered an area of 1 km2 (2 grids × 2 grids). For typicality, ten cases covering all cities and vitality grades were selected (Figure 10).
Cases 2 and 6 represent the most vibrant areas in the PRD urban agglomeration. Located north of Zhujiang New Town in Guangzhou, Case 2 consists of two parts. Many high-end commercial plazas are in the north, and residential communities with dense roads cover the southern part. Case 6 of Shenzhen is the CBD in Futian district with dense crowd flows. These two multi-functional areas concentrate businesses, entertainment, and recreation, as a combination of functions and convenience. Cases 1, 8, and 9 are examples of industry–city integration that can create urban vitality. Case 1 is in the old urban district of Foshan, which has new and traditional communities with the business services industry. Case 8 includes the Xingzhong Stadium and shopping malls with surrounding residential buildings, so residents have the potential to engage in non-work activities as a convenience of participating in sports or leisure. Located in Jiangmen, Case 9 has a contiguous range of middle and high-rise residential buildings with street shops, and an industrial zone for people’s employment is in the east nearby.
The urban vitality grade of Case 10 is moderate, where shopping centers, parks, and the administrative service center make life convenient and diverse. Additionally, residents in Zhaoqing can access the cultural heritage (the ancient city wall) that also attracts tourists from other cities, but to some extent, the underdeveloped status of Zhaoqing leads to certain limits in vitality generation.
Single-functional areas, Cases 3, 4, 5, and 7, cannot meet the needs of citizens or attract tourists, resulting in low vitality. Case 3 in Dongguan covers an industrial cluster of automobile manufacturers with the Xinjiuwei industrial zone and an automobile market. Subsequently, 24 h activity in the streets is unlikely to occur, similar to Case 5 in Shenzhen. Case 4 in Huizhou is near the combination zone between urban and rural areas, where residential buildings mingle with factories and villages. Case 7 is the Guangsheng Community in Zhuhai, where people live in the south but factories are in the north. From the analysis above, there is a match between the condition of cases and their urban vitality grades, illustrating that the evaluation framework proposed in this study is applicable.

5. Discussion

Evaluating urban vitality plays an important role in urban physical analyses, guides industrial site selection, assists city examination, guides industrial location decisions, and provides a reference for urban planning. Recently, the ’Code of practice for city examination and evaluation in spatial planning’ was issued to promptly detect shortcomings and risks in terms of spatial quality and to evaluate urban vitality that can help diagnose various ’urban diseases’ during the growth of a city [51]. Additionally, urban vitality is viewed as an investment bellwether of industries and businesses. On the one hand, a vibrant city has potential to establish a complete and strong industrial system because the government will provide a livable environment for employees. On the other hand, competitive enterprises, especially in commercial fields, would prioritize and select the places with large amounts of local crowds and business travelers. Hence, urban vitality evaluation can provide a basis for industrial transfers and site selection. Furthermore, urban vitality can reveal the prominent problems of current urban construction, both for master planning concerning land use and the spatial layout of public service facilities and for detailed planning that focuses on floor area ratios, building density, and placemaking.
As illustrated in Section 2.2, great progress in urban vitality evaluation has been achieved since the 1960s, laying a solid foundation for further research. Spatio-temporal big data have innovated the quantitative evaluation of urban vitality. Before that, data from travel surveys, censuses, and statistical yearbooks were used to investigate the performance of a city’s overall vitality. Large volumes of big data with a fine grain size and detailed spatio-temporal information have upgraded the accuracy of assessing the intensity of activities, making it possible to describe the built environment quantitatively. Scholars have made attempts to measure urban vitality directly, by using single indicators and comprehensive indexes. However, human activities, the built environment, and urban development are just surface attributes associated with urban vitality. We reiterated that urban vitality is a comprehensive strength of a city supported by the urban system. Although we admit the obvious contribution of spatio-temporal big data to promoting vitality evaluation, direct measurement is still ongoing. In this context, the evaluation framework for urban vitality in this paper extends the relevant research. The frameworks that excessively depend on fine-grained data may become rigid and only suitable for limited situations, so an integrated evaluation framework is required to investigate both the interior and overall performances of urban vitality.
The spatial scope identification of urban vitality, the first step of this research, is worthy of further discussion. As we can see in Section 4.2, there is spatial heterogeneity in urban vitality, so limited financial budgets for improving spatial quality should be exactly targeted for urgent needs. Urban planners should place strong emphasis on the spatial quality of citizens’ actual production and living areas, for which spatial scope identification can help. Therefore, evaluating urban vitality under a spatial scope simplifies the workload and more importantly, increases the practical effectiveness of the work. In summary, the contributions of our study mainly lie in the following aspects. First, this study put forward an evaluation framework under the definition of urban vitality explaining how urban development, the urban environment, and urban activities contribute to urban vitality. Second, this study identified the spatial scope of urban vitality, which is effective for promoting guidance in urban planning and construction. Finally, this is a successful attempt to use a BPNN for vitality evaluation, and application to the PRD urban agglomeration confirms the theoretical necessity and practical possibility of nonlinear evaluation.

6. Conclusions and Limitations

To explore the spatial characteristics of urban vitality in the PRD urban agglomeration, this study established an integrated evaluation framework of urban vitality under the proposed definition and adopted a nonlinear method, BPNN, for vitality evaluation. The result shows a core-edge spatial pattern of urban vitality in the PRD urban agglomeration, and Guangzhou and Shenzhen are the core vibrant cities. Furthermore, areas with urban landscapes and adequate facilities generally show higher levels of vitality. Through case validation, we confirmed the evaluation result effectively reflects the realistic spatial quality in the study area, and the evaluation framework is applicable.
Urban vitality is a comprehensive concept. The evaluation framework in this paper has considerable expandability and adaptability as it consists of three subsystems: urban development, environment, and activity, enabling evaluation to investigate both macro and micro performance with a combination of different perspectives and dimensions. Furthermore, it broadens the horizons of related evaluation research. Both visible and invisibly supportive factors should be considered, as urban vitality generates dynamically in an urban system.
The evaluation result also provides guidance for city examination and future urban planning in the PRD urban agglomeration. The government should take effective measures to improve the spatial quality of contiguous industrial areas with low urban vitality, such as developing complementary industries to enhance the diversity of the industrial structure and increasing the investment in infrastructure and public services, which can promote industry–city integration. On the other hand, urban planners should pay more attention to human-oriented planning. In old urban districts, the original road texture should be maintained and open spaces need to be built for people’s daily contacts. In new built-up areas, the government should focus on comfortable street scales to create a livable environment.
With important theoretical and practical value, this study made a significant attempt to extend future research. Nevertheless, several limitations still exist. First, the fusion method used to extract built-up areas—the spatial scope for urban vitality—still requires visual interpretation to solve the problem of density spillovers, which needs to be further improved. Second, the quantification method of land use intensity and building density can be further deepened because the NDBI cannot eliminate the interference of bare land [52]. A comprehensive index that can identify construction land more effectively should replace the single index in future research. Moreover, the ANN needs to be further optimized to achieve the best fitting conditions, for example, updating a better training algorithm such as the genetic algorithm [53]. Finally, cellular signaling data with higher user coverage can be used to objectively and quantitatively verify the accuracy of urban vitality evaluation in future research.

Author Contributions

Conceptualization, X.H. and M.L.; Data curation, X.H.; Formal analysis, X.H.; Funding acquisition, M.L.; Methodology, X.H. and X.Z.; Writing—original draft, X.H.; Writing—review and editing, P.J. All authors have read and agreed to the published version of the manuscript.

Funding

This research was funded by the Major Consulting and Research Project of the Chinese Academy of Engineering,2022-XBZD-10-03, Research on Intelligent Supervision of Territorial Space Planning, BRA2020003, Natural Science Foundation of Jiangsu Province of China, BK20220126, and National Natural Science Foundation of China, 42171395.

Data Availability Statement

Not applicable.

Acknowledgments

All authors have confirmed.

Conflicts of Interest

The authors declare no conflict of interest.

Appendix A

Table A1. The example of POI data from AMAP.
NameGeotagLongitudeLatitudeProvinceCityDistrict
XX Department StoreStore114.4624623.08439GuangdongHuizhouHuicheng
XX City ParkPark113.6273122.61444GuangdongGuangzhouNansha
XX HotelHotel113.5609222.22464GuangdongZhuhaiXiangzhou
Table A2. The example of check-in data from Sina Weibo.
NameLongitudeLatitudeGeotagGeotag CodeCheck-in Number
XX Primary School110.1814320.23926Primary school75931
XX Bus Terminal113.2318522.31103Bus station151155
XX KTV112.1921822.31103KTV75983
Table A3. The example of land transaction data from the Landchina website.
YearProvinceCityLongitudeLatitudeArea (hm2)Transaction WayTransaction Price
(10 Thousand CNY)
2020GuangdongGuangzhou113.584754222.813768458.77884Auction6437.00
2020GuangdongFoshan112.810654122.875898043.71424Listing2436.54
2019GuangdongShenzhen114.315963722.780394162.47766Bidding109,887.00

References

  1. Jacobs, J. The Death and Life of Great American Cities; Random House: New York, NY, USA, 1961. [Google Scholar]
  2. Bracken, I.; Martin, D. The generation of spatial population distributions from census centroid data. Environ. Plan. A 1989, 21, 537–543. [Google Scholar] [CrossRef]
  3. Ratti, C.; Frenchman, D.; Pulselli, R.M.; Williams, S. Mobile landscapes: Using location data from cell phones for urban analysis. Environ. Plan. B Plan. Des. 2006, 33, 727–748. [Google Scholar] [CrossRef]
  4. Zhen, F.; Cao, Y.; Qin, X.; Wang, B. Delineation of an urban agglomeration boundary based on Sina Weibo microblog ‘check-in’ data: A case study of the Yangtze River Delta. Cities 2017, 60, 180–191. [Google Scholar] [CrossRef]
  5. Ta, N.; Zeng, Y.; Zhu, Q.; Wu, J. Relationship between built environment and urban vitality in Shanghai downtown area based on big data. Sci. Geogr. Sin. 2020, 40, 60–68. [Google Scholar]
  6. Gehl, J. Life between Buildings: Using Public Space; Island Press: Washington, DC, USA, 1971. [Google Scholar]
  7. Delclòs-Alió, X.; Miralles-Guasch, C. Looking at Barcelona through Jane Jacobs’s eyes: Mapping the basic conditions for urban vitality in a Mediterranean conurbation. Land Use Policy 2018, 75, 505–517. [Google Scholar] [CrossRef]
  8. Sung, H.; Lee, S.; Cheon, S. Operationalizing Jane Jacobs’s Urban Design Theory. J. Plan. Educ. Res. 2015, 35, 117–130. [Google Scholar] [CrossRef]
  9. Jin, Y. Study on urban economic vitality index in China. Sci. Geogr. Sin. 2007, 27, 9–16. [Google Scholar]
  10. Feng, Y.; Zhen, J. The early warning of ecological security in Hohhot based on RBF model. J. Arid. Land Resour. Environ. 2018, 32, 87–92. [Google Scholar]
  11. Chang, Q.; Wang, Y.; Wu, J.; Li, S. Urban land use intensity assessment based on artificial neural networks: A case of Shenzhen. China Land Sci. 2007, 21, 26–31. [Google Scholar]
  12. Chen, J.; Zeng, M.; Duan, Y. Regional carrying capacity evaluation and prediction based on GIS in the Yangtze River Delta, China. Int. J. Geogr. Inf. Sci. 2011, 25, 171–190. [Google Scholar] [CrossRef]
  13. Kennedy, M.; Dinh, V.; Basu, B. Analysis of consumer choice for low-carbon technologies by using neural networks. J. Clean. Prod. 2016, 112, 3402–3412. [Google Scholar] [CrossRef]
  14. Qi, W.; Wang, K. City administrative area and physical area in China: Spatial differences and integration strategies. Geogr. Res. 2019, 38, 207–220. [Google Scholar]
  15. Chen, X.; Feng, J. Clarification and research progress of various urban spatial concepts. Urban Dev. Stud. 2020, 27, 62–69. [Google Scholar]
  16. Zha, Y.; Ni, S.; Yang, S. An effective approach to automatically extract urban land-use from TM imagery. J. Remote Sens. 2003, 7, 37–40. [Google Scholar]
  17. Xu, H. A new index for delineating built-up land features in satellite imagery. Int. J. Remote Sens. 2008, 29, 4269–4276. [Google Scholar] [CrossRef]
  18. Sharma, R.C.; Tateishi, R.; Hara, K.; Gharechelou, S.; Iizuka, K. Global mapping of urban built-up areas of year 2014 by combining MODIS multispectral data with VIIRS nighttime light data. Int. J. Digit. Earth 2016, 9, 1004–1020. [Google Scholar] [CrossRef]
  19. Xu, Z.; Gao, X. A novel method for identifying the boundary of urban built-up areas with POI data. Acta Geogr. Sin. 2016, 71, 928–939. [Google Scholar]
  20. Li, C.; Wang, X.; Wu, Z.; Dai, Z.; Yin, J.; Zhang, C. An improved method for urban built-up area extraction supported by multi-source data. Sustainability 2021, 13, 5042. [Google Scholar] [CrossRef]
  21. Lynch, K. Good City Form; The MIT Press: Cambridge, UK, 1984. [Google Scholar]
  22. Shi, J.; Miao, W.; Si, H.; Liu, T. Urban Vitality Evaluation and Spatial Correlation Research: A Case Study from Shanghai, China. Land 2021, 10, 1195. [Google Scholar] [CrossRef]
  23. Liu, L.; Xu, Y.; Jiang, S.; Wu, Q. Evaluation of urban vitality based on fuzzy matter-element model. Geogr. Geo-Inf. Sci. 2010, 26, 73–77. [Google Scholar]
  24. Wang, S.; Li, D.; Ye, X.; Chen, Q.; Jiang, X. Fuzzy comprehensive evaluation on the urban vitality—A case of the main city in Hubei Province. J. Huazhong Norm. Univ. (Nat. Sci.) 2013, 47, 440–445. [Google Scholar]
  25. Zhang, A.; Li, W.; Wu, J.; Lin, J.; Chu, J.; Xia, C. How can the urban landscape affect urban vitality at the street block level? A case study of 15 metropolises in China. Environ. Plan. B: Urban Anal. City Sci. 2021, 48, 631–652. [Google Scholar] [CrossRef]
  26. Niu, X.; Wu, W.; Li, M. Influence of built environment on street vitality and its spatiotemporal characteristics based on LBS positioning data. Urban Plan. Int. 2019, 34, 28–37. [Google Scholar] [CrossRef]
  27. Lan, F.; Gong, X.; Da, H.; Wen, H. How do population inflow and social infrastructure affect urban vitality? Evidence from 35 large- and medium-sized cities in China. Cities 2020, 100, 102454. [Google Scholar] [CrossRef]
  28. Wang, B.; Zhen, F.; Zhang, S.; Huang, X.; Zhou, L. The impact of air pollution on urban vibrancy and its built environment heterogeneity: An empirical analysis based on big data. Geogr. Res. 2021, 40, 1935–1948. [Google Scholar]
  29. Ye, Y.; Zhuang, Y. A hypothesis of urban morphogenesis and urban vitality in newly built-up areas: Analyses based on street accessibility, building density and functional mixture. Urban Plan. Int. 2017, 32, 43–49. [Google Scholar] [CrossRef]
  30. Zeng, C.; Song, Y.; He, Q.; Shen, F. Spatially explicit assessment on urban vitality: Case studies in Chicago and Wuhan. Sustain. Cities Soc. 2018, 40, 296–306. [Google Scholar] [CrossRef]
  31. Jin, X.; Long, Y.; Sun, W.; Lu, Y.; Yang, X.; Tang, J. Evaluating cities’ vitality and identifying ghost cities in China with emerging geographical data. Cities 2017, 63, 98–109. [Google Scholar] [CrossRef]
  32. Montgomery, J. Making a city: Urbanity, vitality and urban design. J. Urban Des. 1998, 3, 93–116. [Google Scholar] [CrossRef]
  33. Wu, J.; Ta, N.; Song, Y.; Lin, J.; Chai, Y. Urban form breeds neighborhood vibrancy: A case study using a GPS-based activity survey in suburban Beijing. Cities 2018, 74, 100–108. [Google Scholar] [CrossRef]
  34. Li, X.; Li, Y.; Jia, T.; Zhou, L.; Hijazi, I.H. The six dimensions of built environment on urban vitality: Fusion evidence from multi-source data. Cities 2022, 121, 103482. [Google Scholar] [CrossRef]
  35. Wu, C.; Ye, X.; Ren, F.; Du, Q. Check-in behaviour and spatio-temporal vibrancy: An exploratory analysis in Shenzhen, China. Cities 2018, 77, 104–116. [Google Scholar] [CrossRef]
  36. Gan, X.; Wang, L.; Wang, H.; Mou, Y.; Wang, D.; Hu, A. Optimal block size for improving urban vitality: An exploratory analysis with multiple vitality indicators. J. Urban Plan. Dev. 2021, 147, 04021027. [Google Scholar] [CrossRef]
  37. Huang, B.; Zhou, Y.; Li, Z.; Song, Y.; Cai, J.; Tu, W. Evaluating and characterizing urban vibrancy using spatial big data: Shanghai as a case study. Environ. Plan. B Urban Anal. City Sci. 2020, 47, 1543–1559. [Google Scholar] [CrossRef]
  38. Yue, Y.; Zhuang, Y.; Yeh, A.G.O.; Xie, J.; Ma, C.; Li, Q. Measurements of POI-based mixed use and their relationships with neighbourhood vibrancy. Int. J. Geogr. Inf. Sci. 2017, 31, 658–675. [Google Scholar] [CrossRef] [Green Version]
  39. He, Q.; He, W.; Song, Y.; Wu, J.; Yin, C.; Mou, Y. The impact of urban growth patterns on urban vitality in newly built-up areas based on an association rules analysis using geographical ‘big data’. Land Use Policy 2018, 78, 726–738. [Google Scholar] [CrossRef]
  40. Ministry of Housing and Urban-Rural Development of the People’s Republic of China. GB50137-2011 Code for Classification of Urban Land Use and Planning Standards of Development Land; Standard Press of China: Beijing, China, 2012. [Google Scholar]
  41. Long, Y.; Zhou, Y. Quantitative evaluation on street vibrancy and its impact factors: A case study of Chengdu. New Archit. 2016, 1, 52–57. [Google Scholar]
  42. Zhang, Y.; Li, J. Comparative analysis about reference land price and its influencing factor of the towns in Hohhot. Geogr. Res. 2007, 26, 373–382. [Google Scholar]
  43. Ye, Y.; Li, D.; Liu, X. How block density and typology affect urban vitality: An exploratory analysis in Shenzhen, China. Urban Geogr. 2018, 39, 631–652. [Google Scholar] [CrossRef]
  44. Jia, C.; Liu, Y.; Du, Y.; Huang, J.; Fei, T. Evaluation of Urban Vibrancy and Its Relationship with the Economic Landscape: A Case Study of Beijing. ISPRS Int. J. Geo-Inf. 2021, 10, 72. [Google Scholar] [CrossRef]
  45. Tang, N.; Tan, M. The grade of farming land by artificial neural network Ⅱ: Optimization disposal of preceding data. J. Fujian Agric. For. Univ. (Nat. Sci. Ed.) 2004, 33, 512–516. [Google Scholar]
  46. Cai, R.; Cui, Y.; Xue, P. Research on the methods of determining the number of hidden nodes in three-layer BP neural network. Comput. Inf. Technol. 2017, 25, 29–33. [Google Scholar]
  47. Sun, H.; Wang, X. Determination of the weight of evaluation indexes with artificial neural network method. J. Shandong Univ. Sci. Technol. (Nat. Sci. Ed.) 2001, 20, 84–86. [Google Scholar]
  48. Zhang, J.; He, X.; Yuan, X. Research on the relationship between Urban economic development level and urban spatial structure—A case study of two Chinese cities. PLoS ONE 2020, 15, e0235858. [Google Scholar] [CrossRef] [PubMed]
  49. Yue, W.; Chen, Y.; Thy, P.T.M.; Fan, P.; Liu, Y.; Zhang, W. Identifying urban vitality in metropolitan areas of developing countries from a comparative perspective: Ho Chi Minh City versus Shanghai. Sustain. Cities Soc. 2021, 65, 102609. [Google Scholar] [CrossRef]
  50. Huang, Y.; Sun, Y. Judgement Characteristics and Quantitative Index of Suitable Block Scale. J. South China Univ. Technol. (Nat. Sci. Ed.) 2012, 40, 131–138. [Google Scholar]
  51. Ministry of Natural Resources of China. TD/T XXXXX—202X Code of Practice for City Examination & Evaluation in Spatial Planning (Draft); Standard Press of China: Beijing, China, 2021. [Google Scholar]
  52. Liu, C.; Yang, K.; Cheng, L.; Li, M.; Guo, Z. Comparison of Landsat8 impervious surface extraction methods. Remote Sens. Land Resour. 2019, 31, 148–156. [Google Scholar]
  53. Sun, W.; Xu, Y. Financial security evaluation of the electric power industry in China based on a back propagation neural network optimized by genetic algorithm. Energy 2016, 101, 366–379. [Google Scholar] [CrossRef]
Figure 1. The mechanism of urban vitality generation.
Land 11 01901 g001
Figure 2. The research framework.
Land 11 01901 g002
Figure 3. Study area.
Land 11 01901 g003
Figure 4. D-G Method. (a) POI density contour; (b) The D-G curve.
Land 11 01901 g004
Figure 5. Process of merging the extraction results.
Land 11 01901 g005
Figure 6. Built-up area extraction of the nine cities. (a) D-G graph; (b). Comparison between boundary I and boundary II; (c) The final extraction of the built-up area.
Land 11 01901 g006
Figure 7. The performance of the BPNN model. (a) The performance of the model with different number of hidden nodes; (b) The training loss of the 25-10-1 network; (c) The testing of the 25-10-1 network.
Land 11 01901 g007
Figure 8. Result of urban vitality evaluation with a 500 m grid, classified in seven grades by natural breaks. (a) The spatial distribution; (b) The proportion of grids in built-up areas.
Land 11 01901 g008
Figure 9. Contribution of each indicator.
Land 11 01901 g009
Figure 10. The selected cases with remote sensing images and street images.
Land 11 01901 g010
Table 1. Data sources used in this study.
DataData SourceYear
Remote sensing dataLandsat RS imageGeospatial Data Cloud (http://www.gscloud.cn/, accessed on 15 September 2021)2020
CNLUCCRESDC (https://www.resdc.cn/, accessed on 16 July 2021)2020
Nighttime lightEGO (https://eogdata.mines.edu/products/vnl/, accessed on 11 August 2021)2020
Geographic big dataPOIsAMAP (https://lbs.amap.com/, accessed on 10 September 2020)2020
Weibo check-insSina Weibo (https://open.weibo.com/, accessed on 30 December 2019)2015
Land transaction priceLandchina (https://www.landchina.com/, accessed on 25 September 2021)2010–2020
Street imageBaidu Map (https://map.baidu.com/, accessed on 11 Januaury 2022)2019
Spatially mapped
statistical data
GDPRESDC (https://www.resdc.cn/, accessed on 26 April 2021)2015
PopulationRESDC (https://www.resdc.cn/, accessed on 1 September 2021)2020
Basic geographic dataRoad networkAMAP (https://lbs.amap.com/, accessed on 29 June 2021)2020
Water areaOSM (http://www.openstreetmap.org/, accessed on 18 July 2021)2020
Administrative boundaryAMAP (https://lbs.amap.com/, accessed on 10 September 2021)2020
Table 2. The three-tier classification system.
Primary—Land UseSecondary—Urban ActivityTertiary—POI Geotag
Administration and public servicesGovernanceGovernment, police office, court, tax office, etc.
Cultural visitMuseum, library, temple, heritage site etc.
EducationInstitution, university, and school
SportsStadium, natatorium, football field, etc.
Medical careHospital, clinic, pharmacy, etc.
Commercial and business facilitiesLodgingHotel, hostel, guesthouse, etc.
CateringRestaurant, fast-food, snack, coffee shop, etc.
ShoppingMall, supermarket, shop, store, farmer’s market, etc.
EntertainmentCinema, club, KTV, game room, spa, etc.
Financial serviceBank and ATM
WorkingOffice, corporation, press, firm, etc.
ResidentialHome-basedResidential area, community, apartment, etc.
IndustrialWorkingFactory, enterprise, and industrial zone
Street and transportationCommutingAirport, harbor, train station, metro station, bus station, etc.
Municipal utilitiesMunicipal serviceFire station, post office, supply station, toilets, etc.
Green spaceRecreationCity square, park, zoom, arboretum, scenic spots, etc.
Table 3. Description and quantitative method of indicators for evaluating urban vitality.
SubsystemIndicatorDescriptionMethod
DevelopmentEconomic density (A1)Distribution of GDP at 500 m resolution (CNY/km2)Resampling
Population density (A2)Distribution of population at 500 m resolution (people/km2)Resampling
POI density (A3)Density of all POIs (/km2)KDE
Cultural facility (A4)Density of cultural facilities (/km2)KDE
Road density (A5)Total length of roads in each grid (m/km2)Equation (1)
Road intersection (A6)Density of road intersections (/km2)KDE
EnvironmentLand price (B1)Transaction price of land transfer by bidding, auction, and listing (CNY/m2)Kriging
Accessibility to the metro (B2)Distance to metro stations (m)Near Analysis
Accessibility to schools (B3)Distance to schools (m)Near Analysis
Accessibility to a park (B4)Distance to parks (m)Near Analysis
Accessibility to hospitals (B5)Distance to hospitals (m)Near Analysis
Accessibility to markets (B6)Distance to farmer’s markets (m)Near Analysis
Accessibility to culture (B7)Distance to cultural facilities (m)Near Analysis
Land use intensity (B8)Maximum value of NDBI (value)Equation (2)
Building density (B9)Construction land coverage ratio in each grid (%)Equation (3)
ActivityWorking (C1)Density of check-ins located in places of employment (/km2)Weighted KDE
Catering (C2)Density of check-ins located at catering sites (/km2)Weighted KDE
Shopping (C3)Density of check-ins located in places for shopping (/km2)Weighted KDE
Commuting (C4)Density of check-ins located on metro or bus stations (/km2)Weighted KDE
Education (C5)Density of check-ins located in schools (/km2)Weighted KDE
Recreation (C6)Density of check-ins located in parks (/km2)Weighted KDE
Medical care (C7)Density of check-ins located in hospitals (/km2)Weighted KDE
Life service (C8)Density of check-ins located in farmer’s markets (/km2)Weighted KDE
Cultural visit (C9)Density of check-ins located at cultural sites (/km2)Weighted KDE
Land use mixture (C10)LUM within seven types of POIs according to Table 2 (value)Equation (4)
Table 4. Area proportion of different types of regions.
RegionGZSZFSDGZSZHJMZQHZ
A56%68%51%64%50%44%42%20%28%
B19%20%14%17%31%20%20%31%19%
C15%10%23%14%10%10%6%2%7%
D10%2%11%5%9%26%32%47%46%
E0%0%1%0%0%0%0%0%0%
Total100%100%100%100%100%100%100%100%100%
Table 5. The proportion of grids at different vitality levels in cities.
Vitality GradeGZSZFSDGZHZHJMZQHZ
Very High57%41%0%0%1%0%1%0%0%
High33%59%3%0%2%0%1%0%0%
Medium High29%39%12%3%4%2%4%2%4%
Medium23%25%17%12%6%3%6%4%5%
Medium Low19%17%16%21%9%4%5%4%5%
Low16%12%15%31%12%3%5%2%4%
Very Low15%6%11%31%17%4%6%3%8%
Publisher’s Note: MDPI stays neutral with regard to jurisdictional claims in published maps and institutional affiliations.