


Assessment and Comparison of Agricultural Technology Development under Different Farmland Management Modes: A Case Study of Grain Production, China


Abstract
1. Introduction
2. Conceptual Framework of the Study
2.1. China’s Farmland System Reform
2.2. Agricultural Land Management Mode
2.3. Agricultural Technology Progress
3. Model and Data Source
3.1. Basic Model
3.1.1. Production Function Model
- (1)
- H0: ϒ = 0, if the original hypothesis is not rejected, it is not necessary to use the stochastic frontier model analysis; if the original assumption is rejected, it is reasonable to set the model as the stochastic frontier.
- (2)
- H0: β5 = β6 = β7 = …… = β19 = β20 = 0, if the original hypothesis is rejected, the transcendental logarithmic production function should be adopted; conversely, use the C-D function.
- (3)
- H0: β15 = β16 = β17 = β18 = β19 = β20 = 0, if the original hypothesis is rejected, there is technological progress.
- (4)
- H0: β17 = β18 = β19 = β20 = 0, if the original hypothesis is rejected, the Hicks technology is non-neutral, that is, the technological progress is related to the factor input.
3.1.2. Decomposition of the Generalized Technology Progress Rate (TFPG)
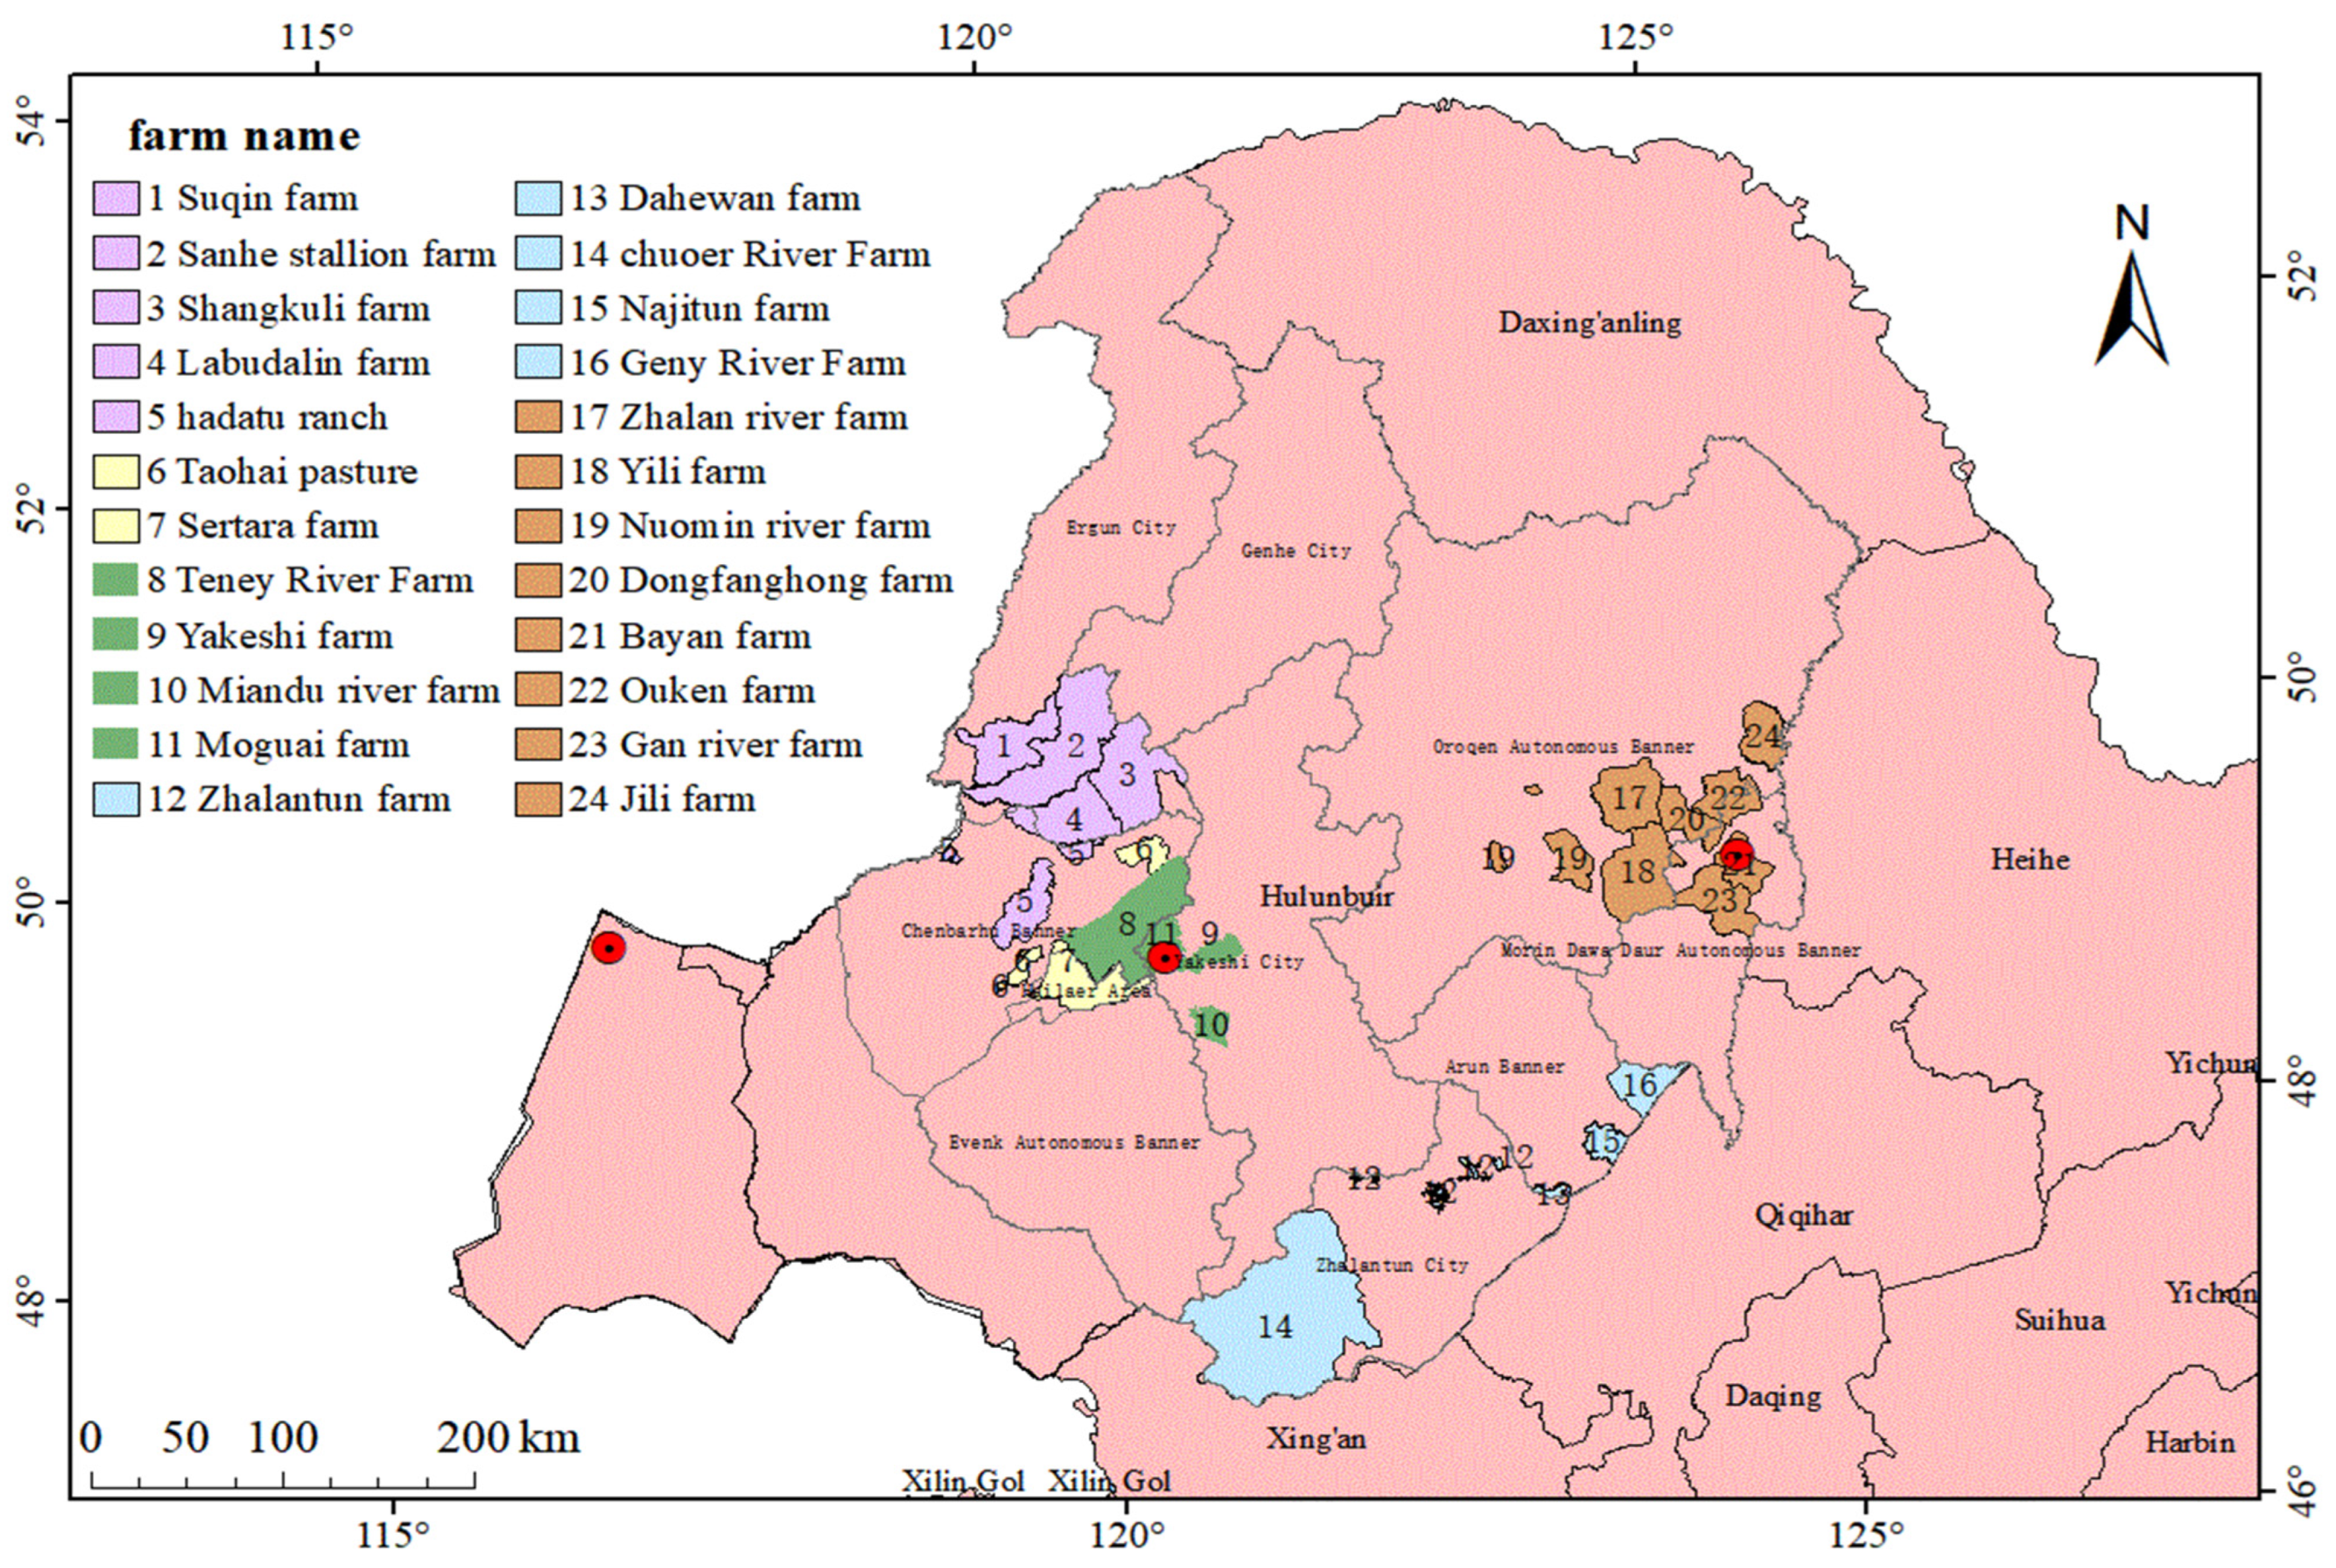
3.2. Data Source and Hypothesis
- (1)
- China’s agricultural reclamation system has played a key role in ensuring the security of national food and important agricultural products, and has also undertaken the historical mission of providing a model for China’s modernization;
- (2)
- The farms owning advanced agricultural technology that can lead the technological progress of China’s grain production;
- (3)
- The farms are managed by two farmland management modes, the decentralized household contract operation, and the unified collective organization operation, and the samples sizes of the two modes are relatively equal, in order to guarantee the accuracy of the measurement;
- (4)
- The farms in the two modes have the same external environment for grain production (including the natural environment, institutional environment, production organization, and management environment, etc.), and the consistency in the acquisition of the production factors and the agricultural technology, which can avoid the interference of the external conditions on the comparative analysis;
- (5)
- Agricultural reclamation is better than the implementation of the double-layer management system in general rural areas as it ensures the unity of the external conditions of grain production;
- (6)
- Consideration of the availability of the sample data and the operability of the field investigation and research.
4. Results Analysis and Discussion
4.1. Test of the Production Function Model
4.2. TFPG Assessment and Comparison
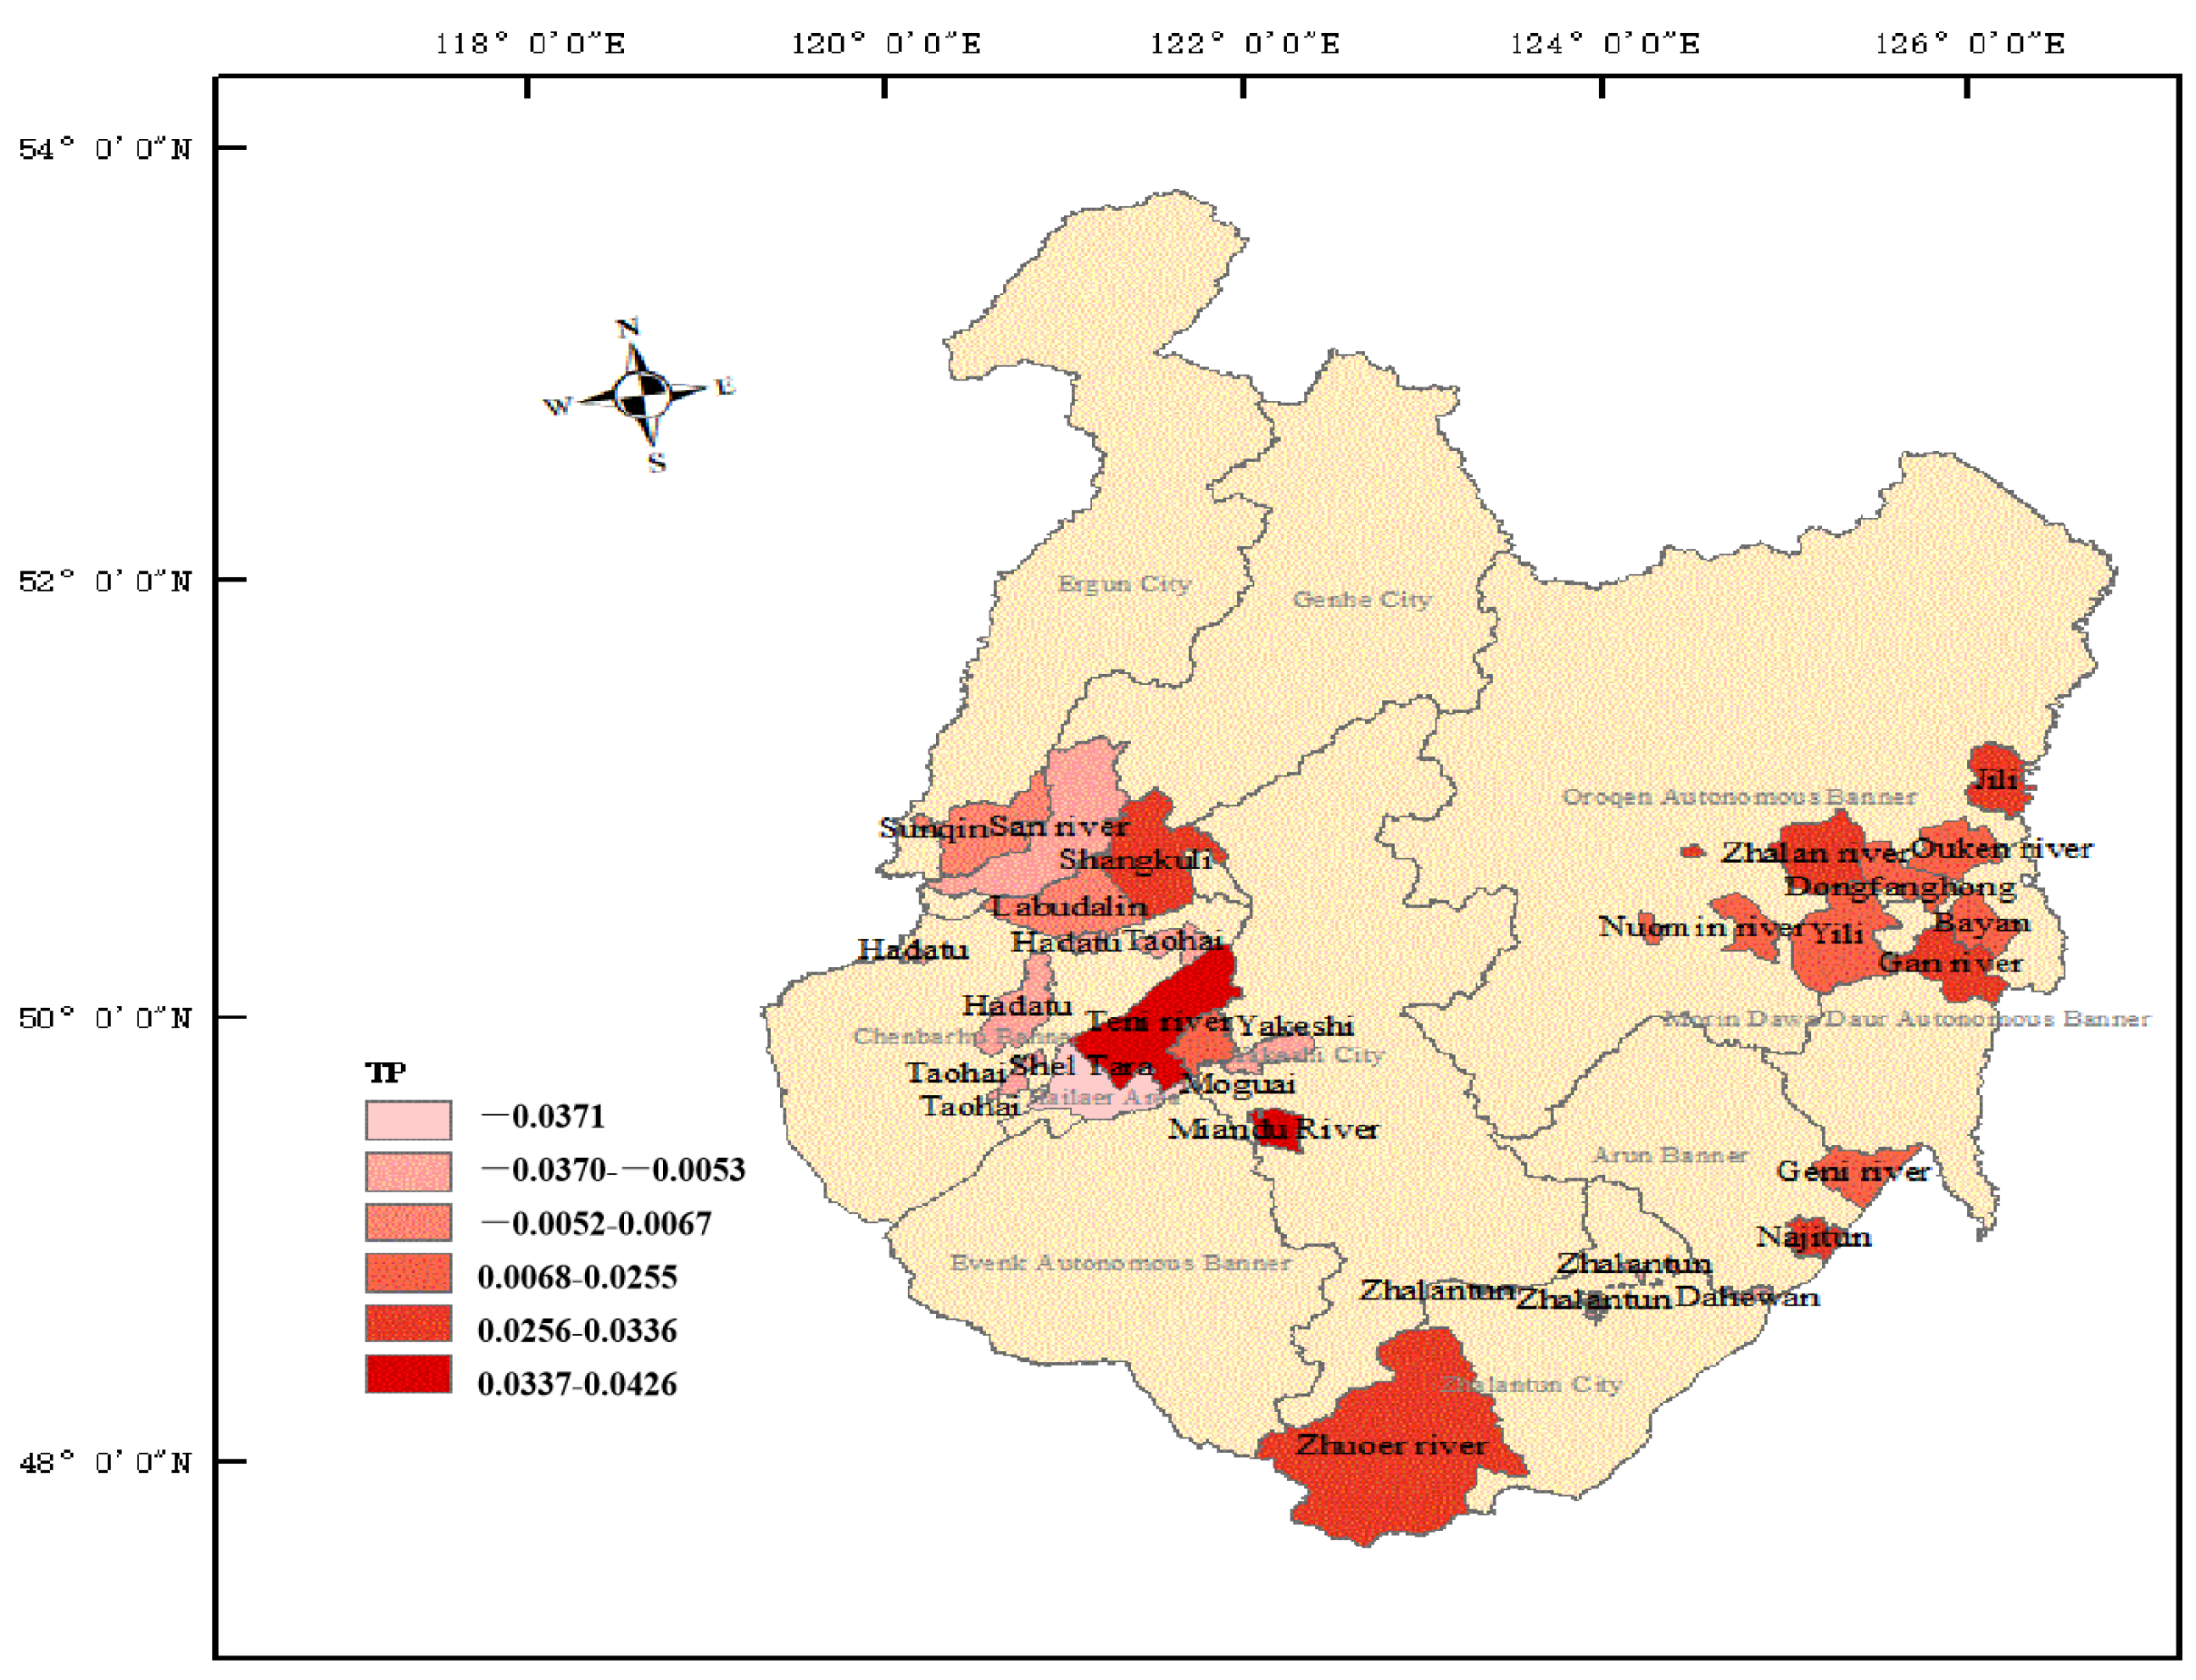
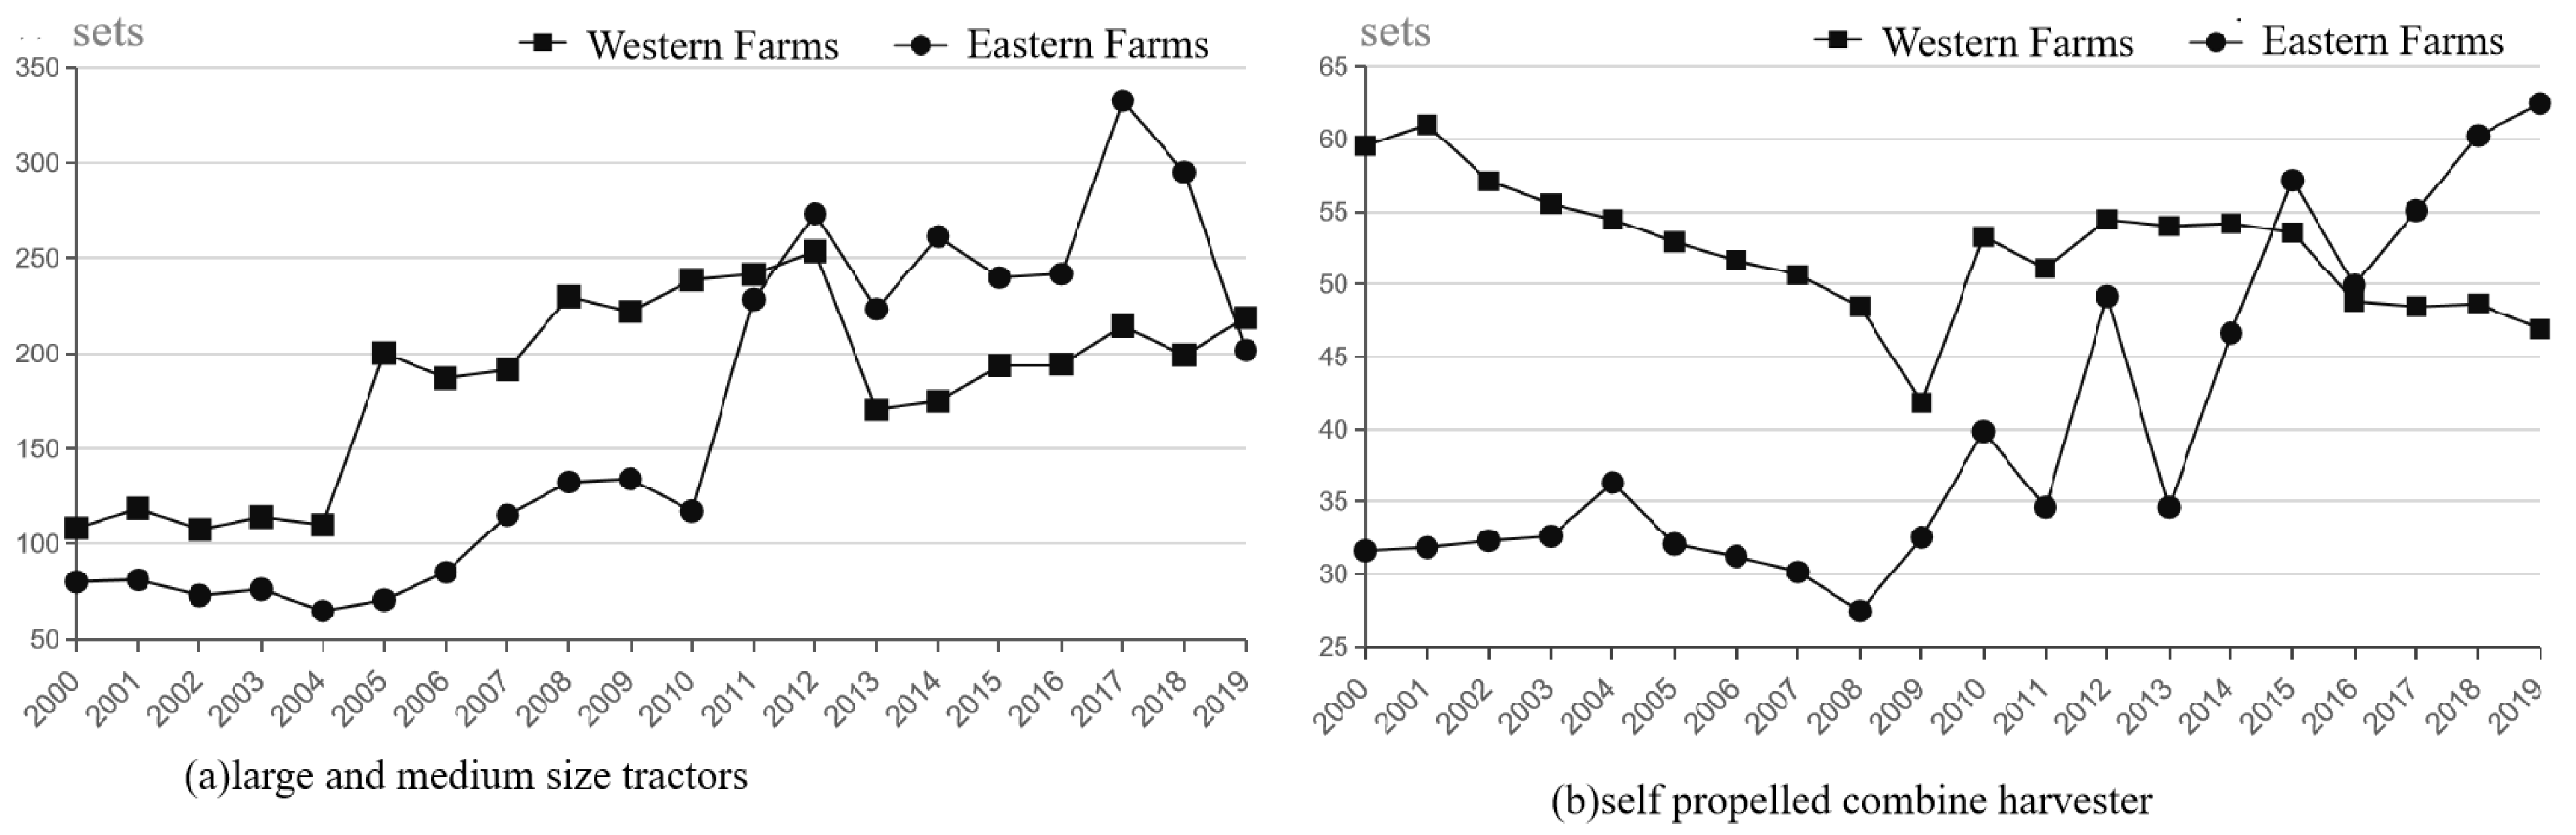
4.2.1. The Varied Main Driving Force of the TP Change under the Two Modes
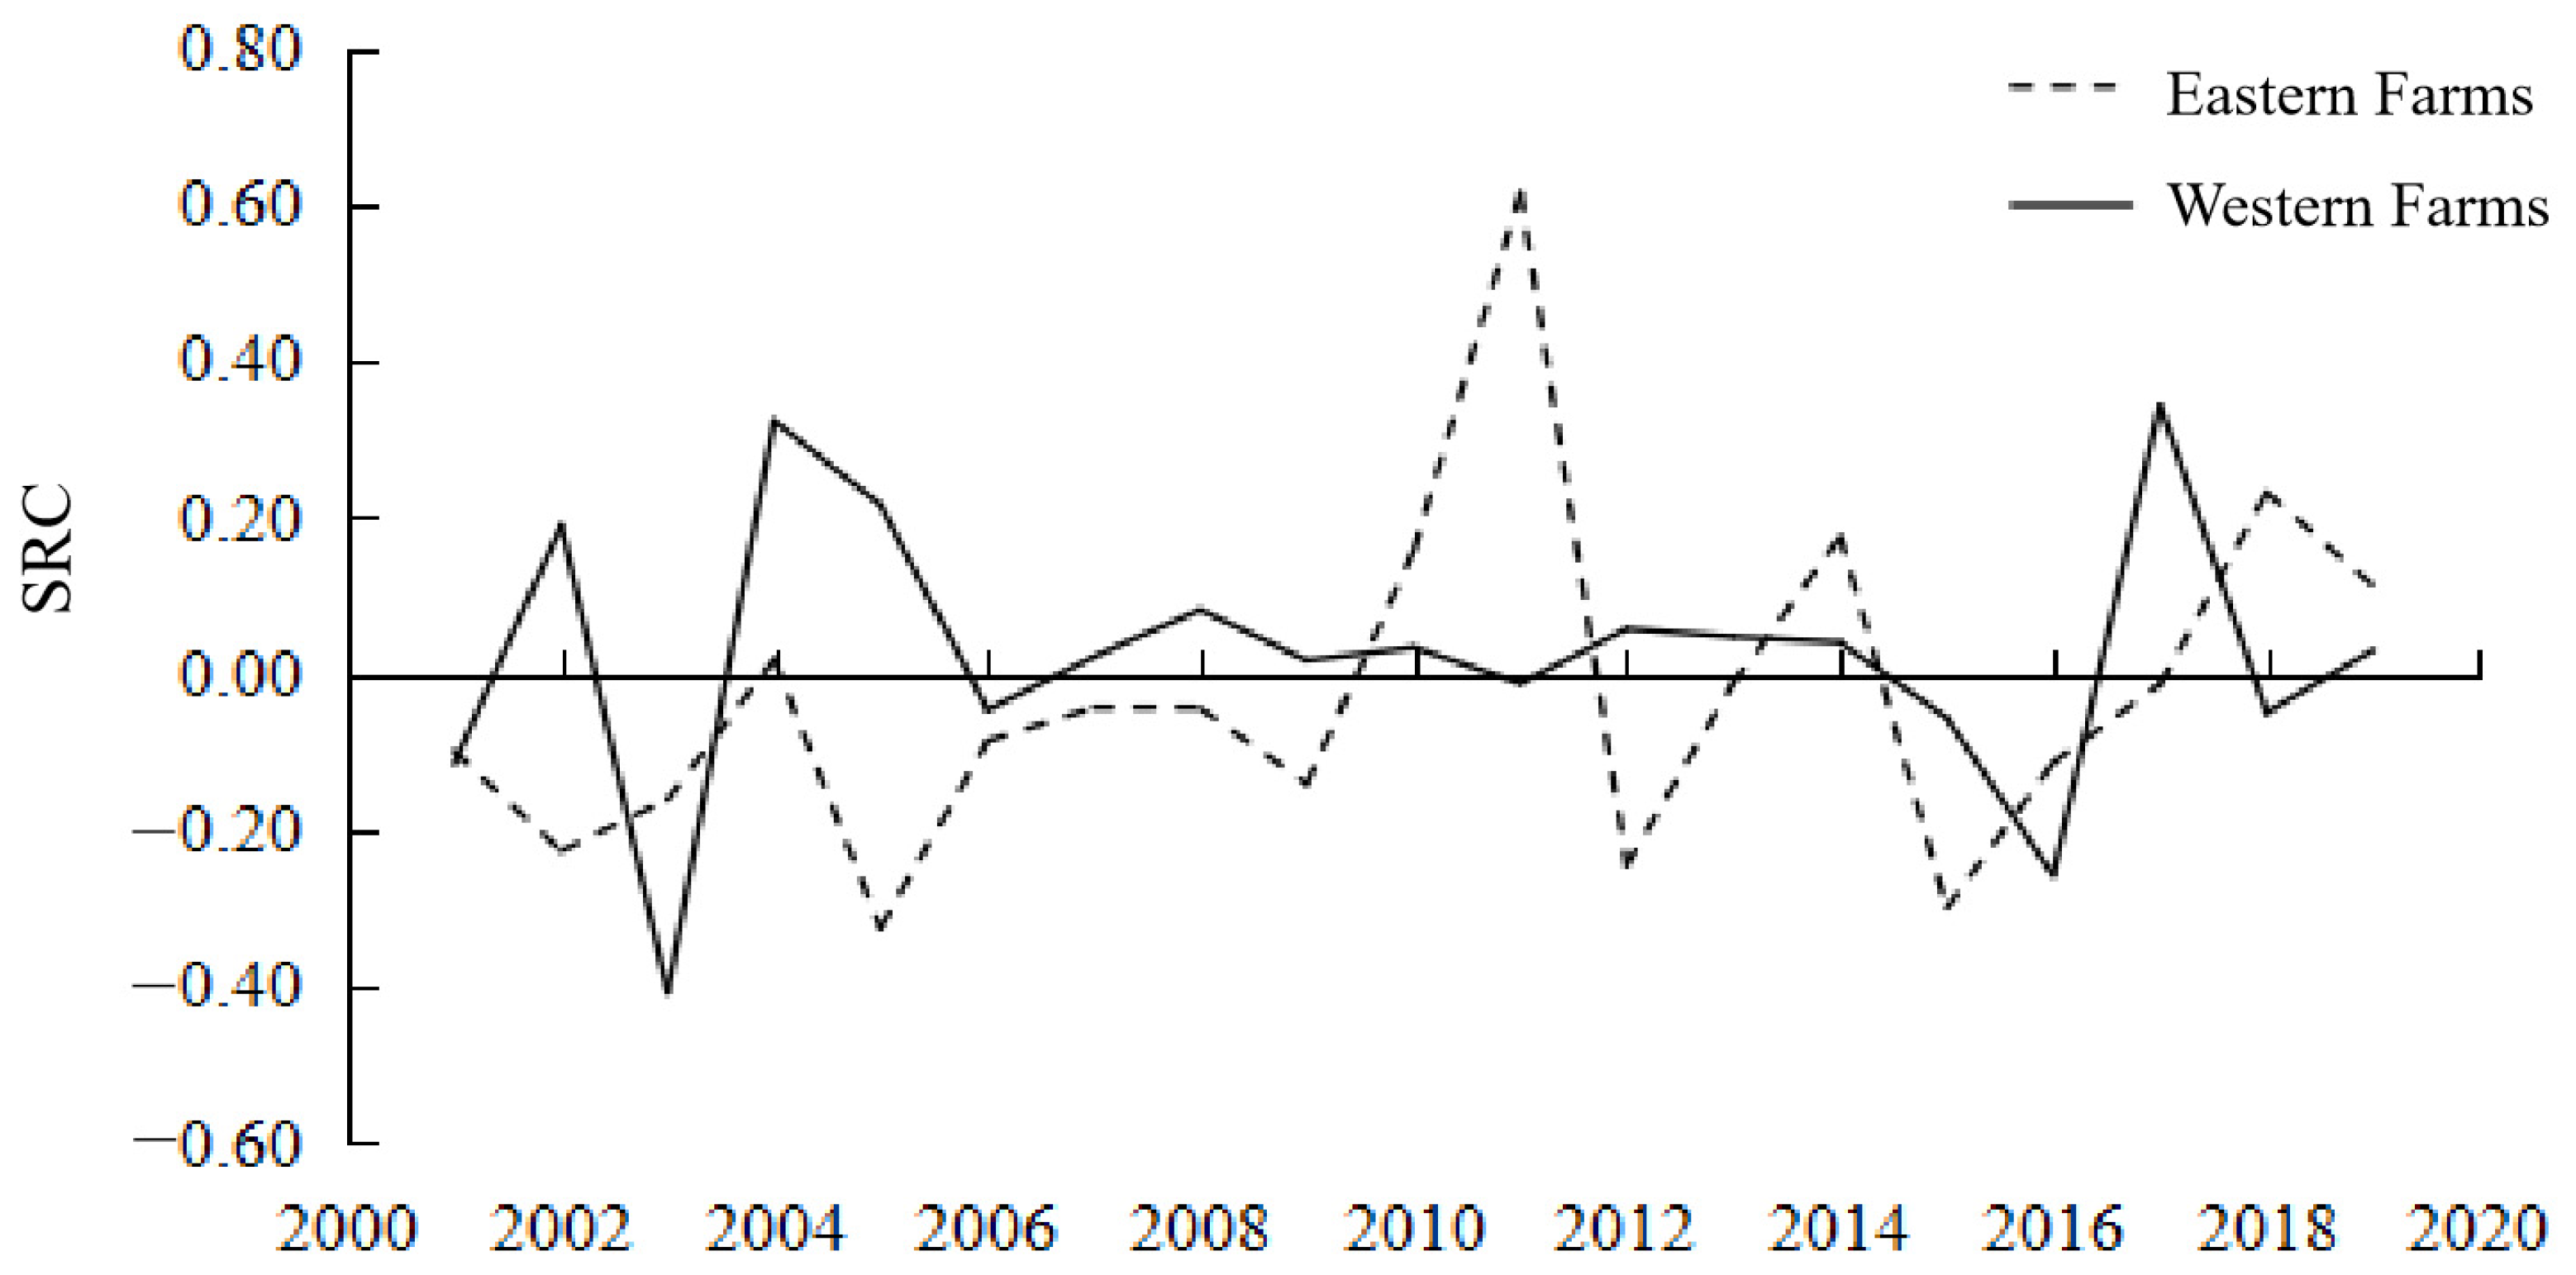
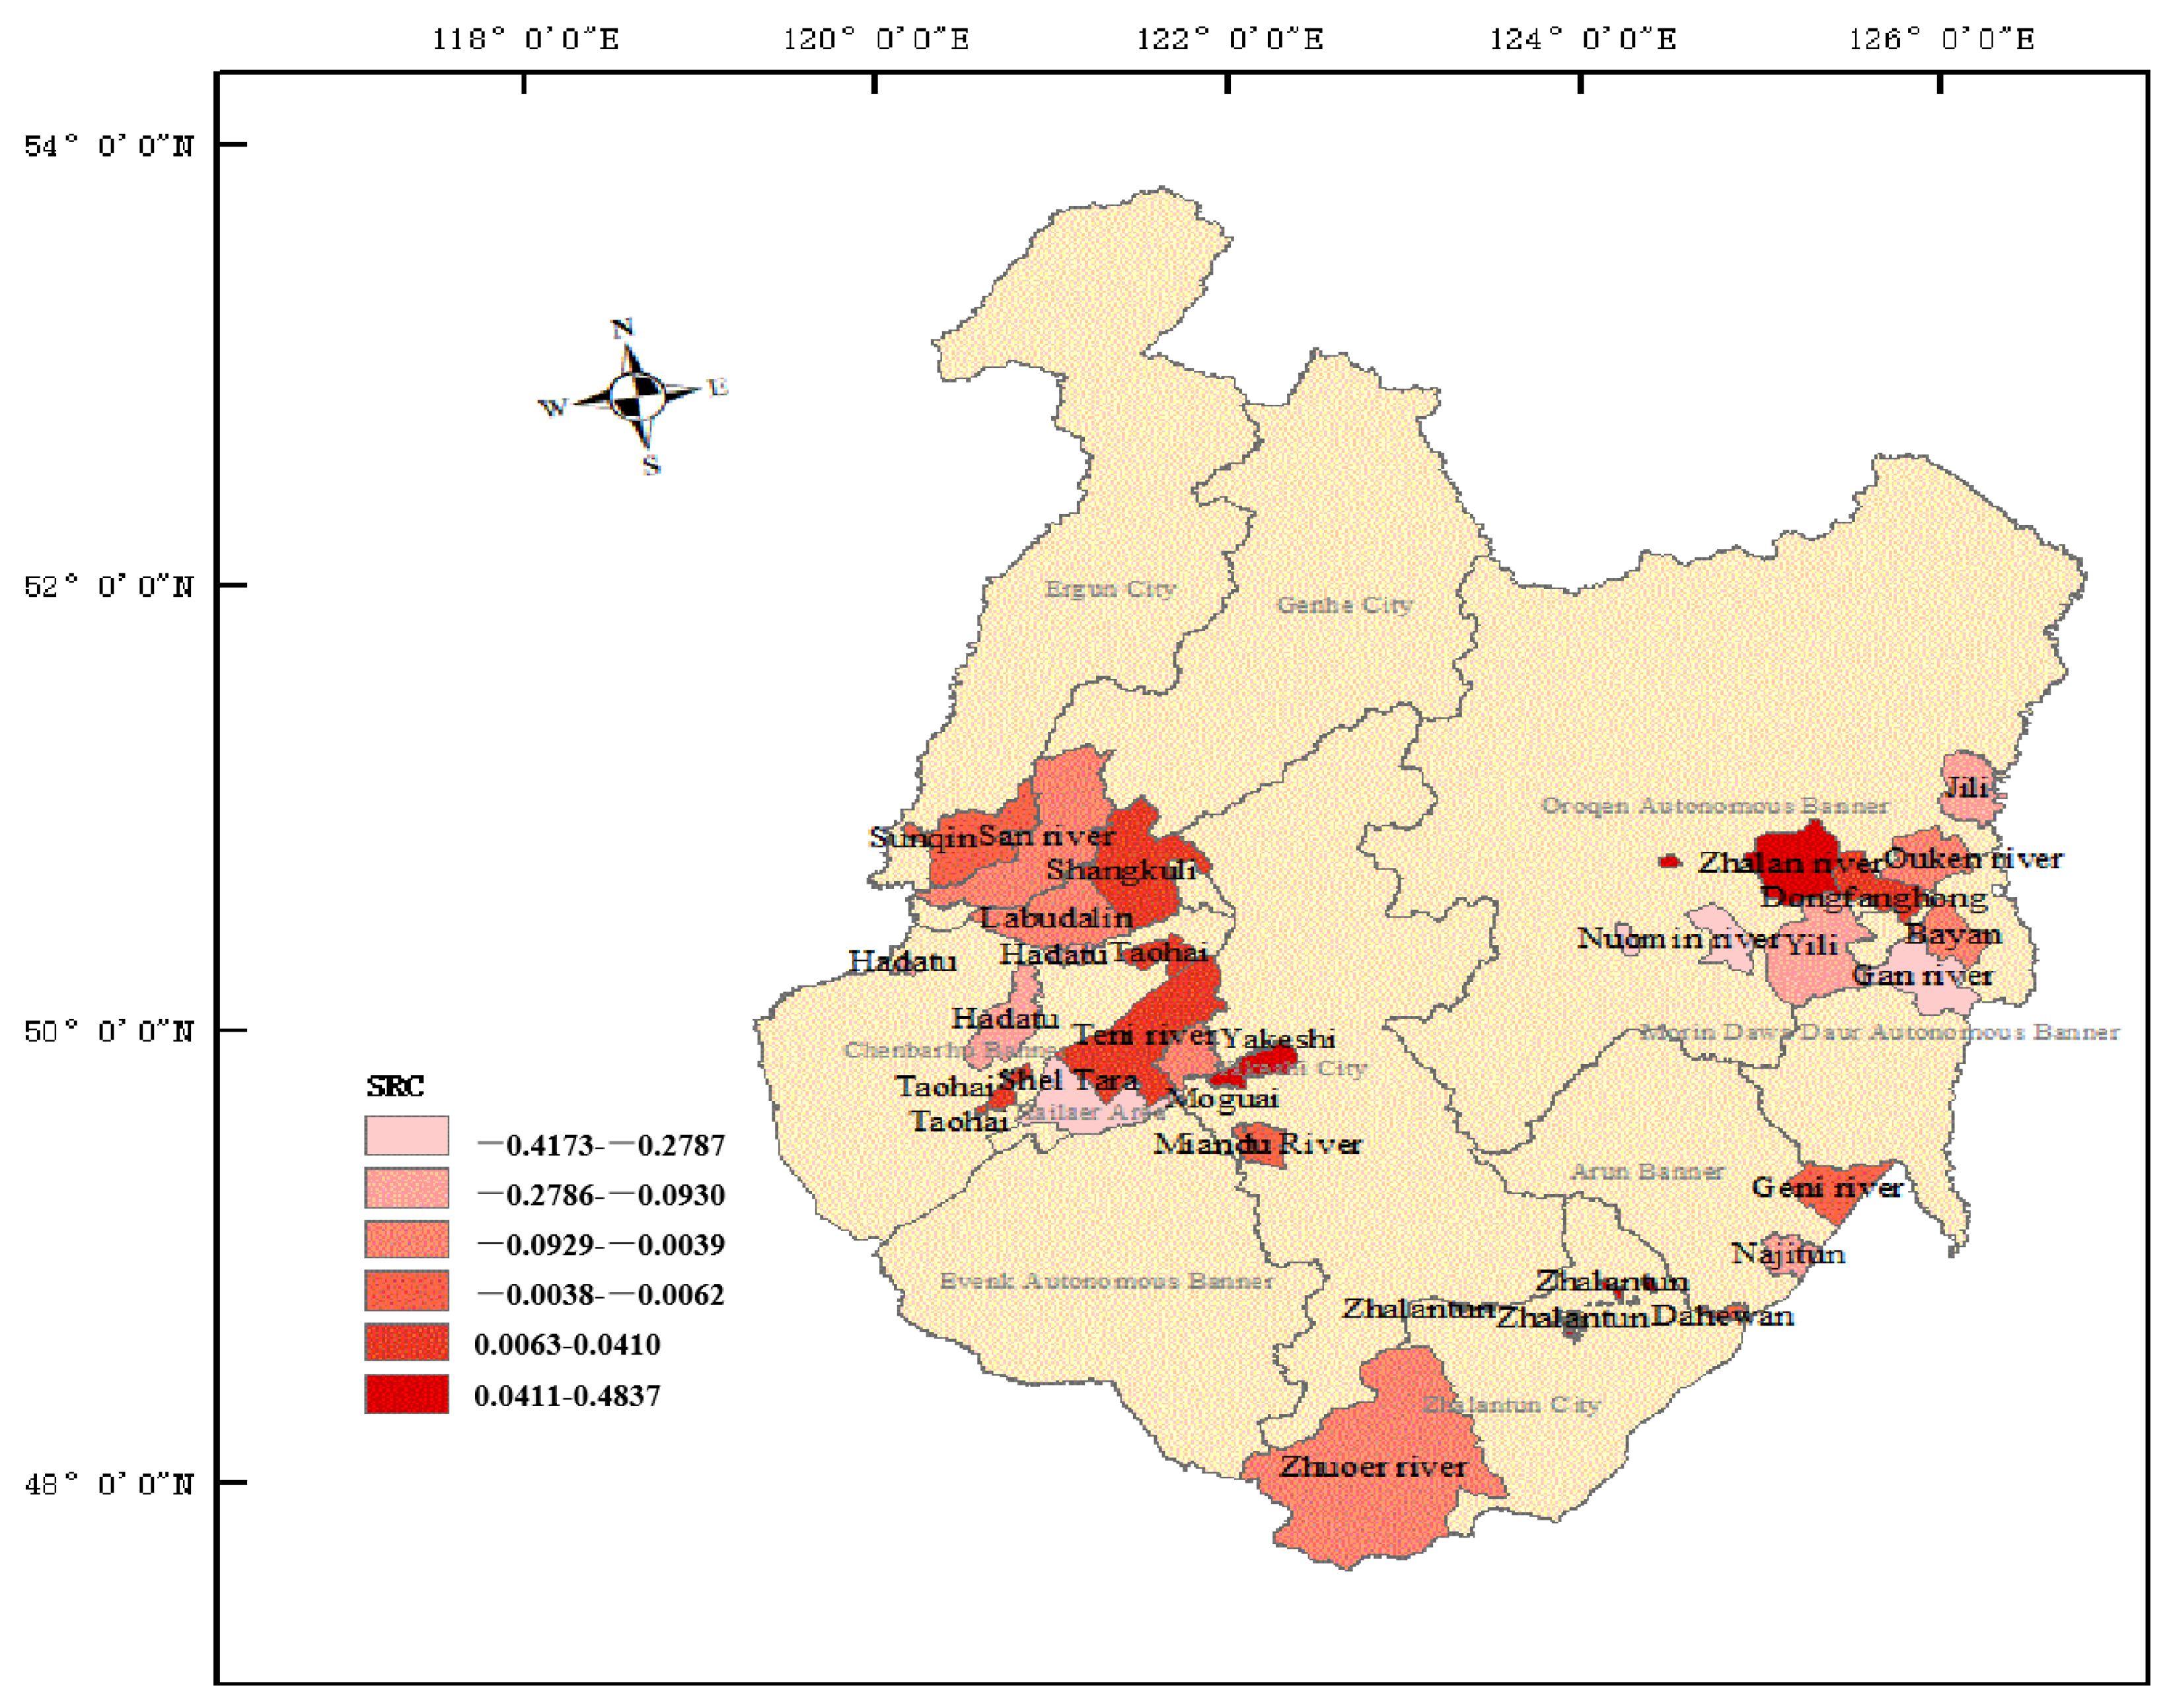
4.2.2. The More Significant Change in the Returns to Scale (SRC) of the Farms in the UMCO
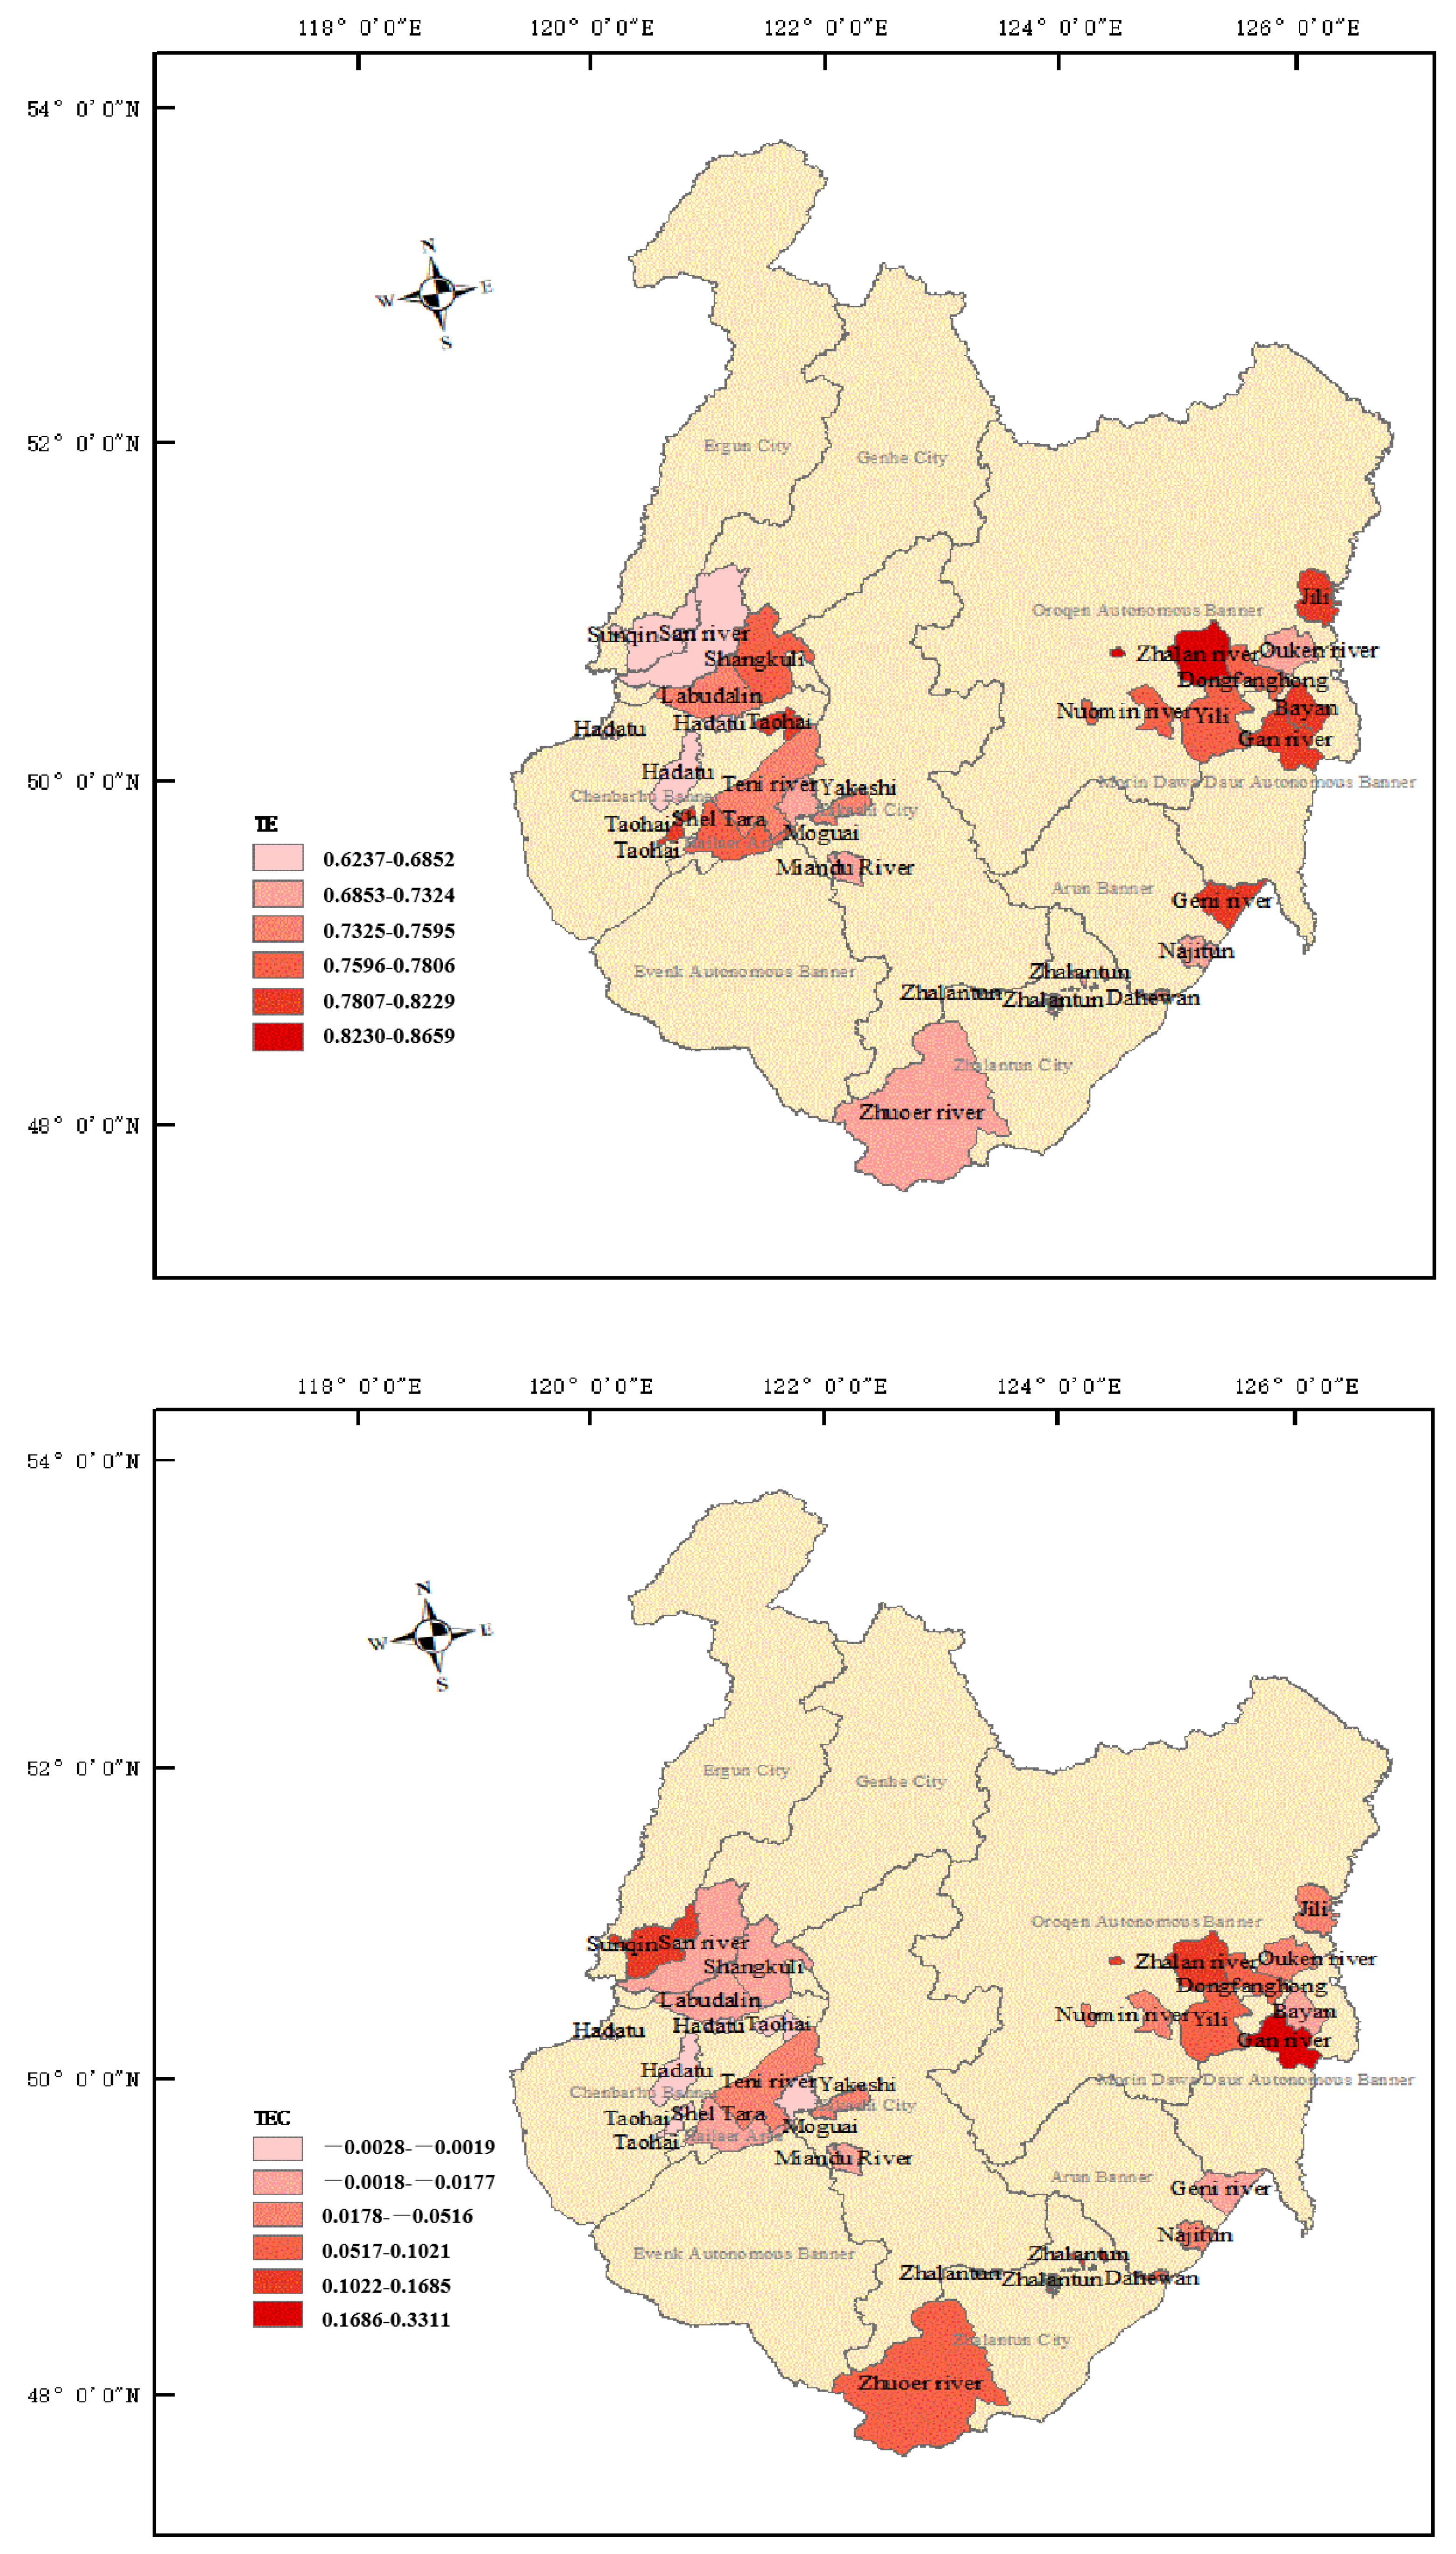
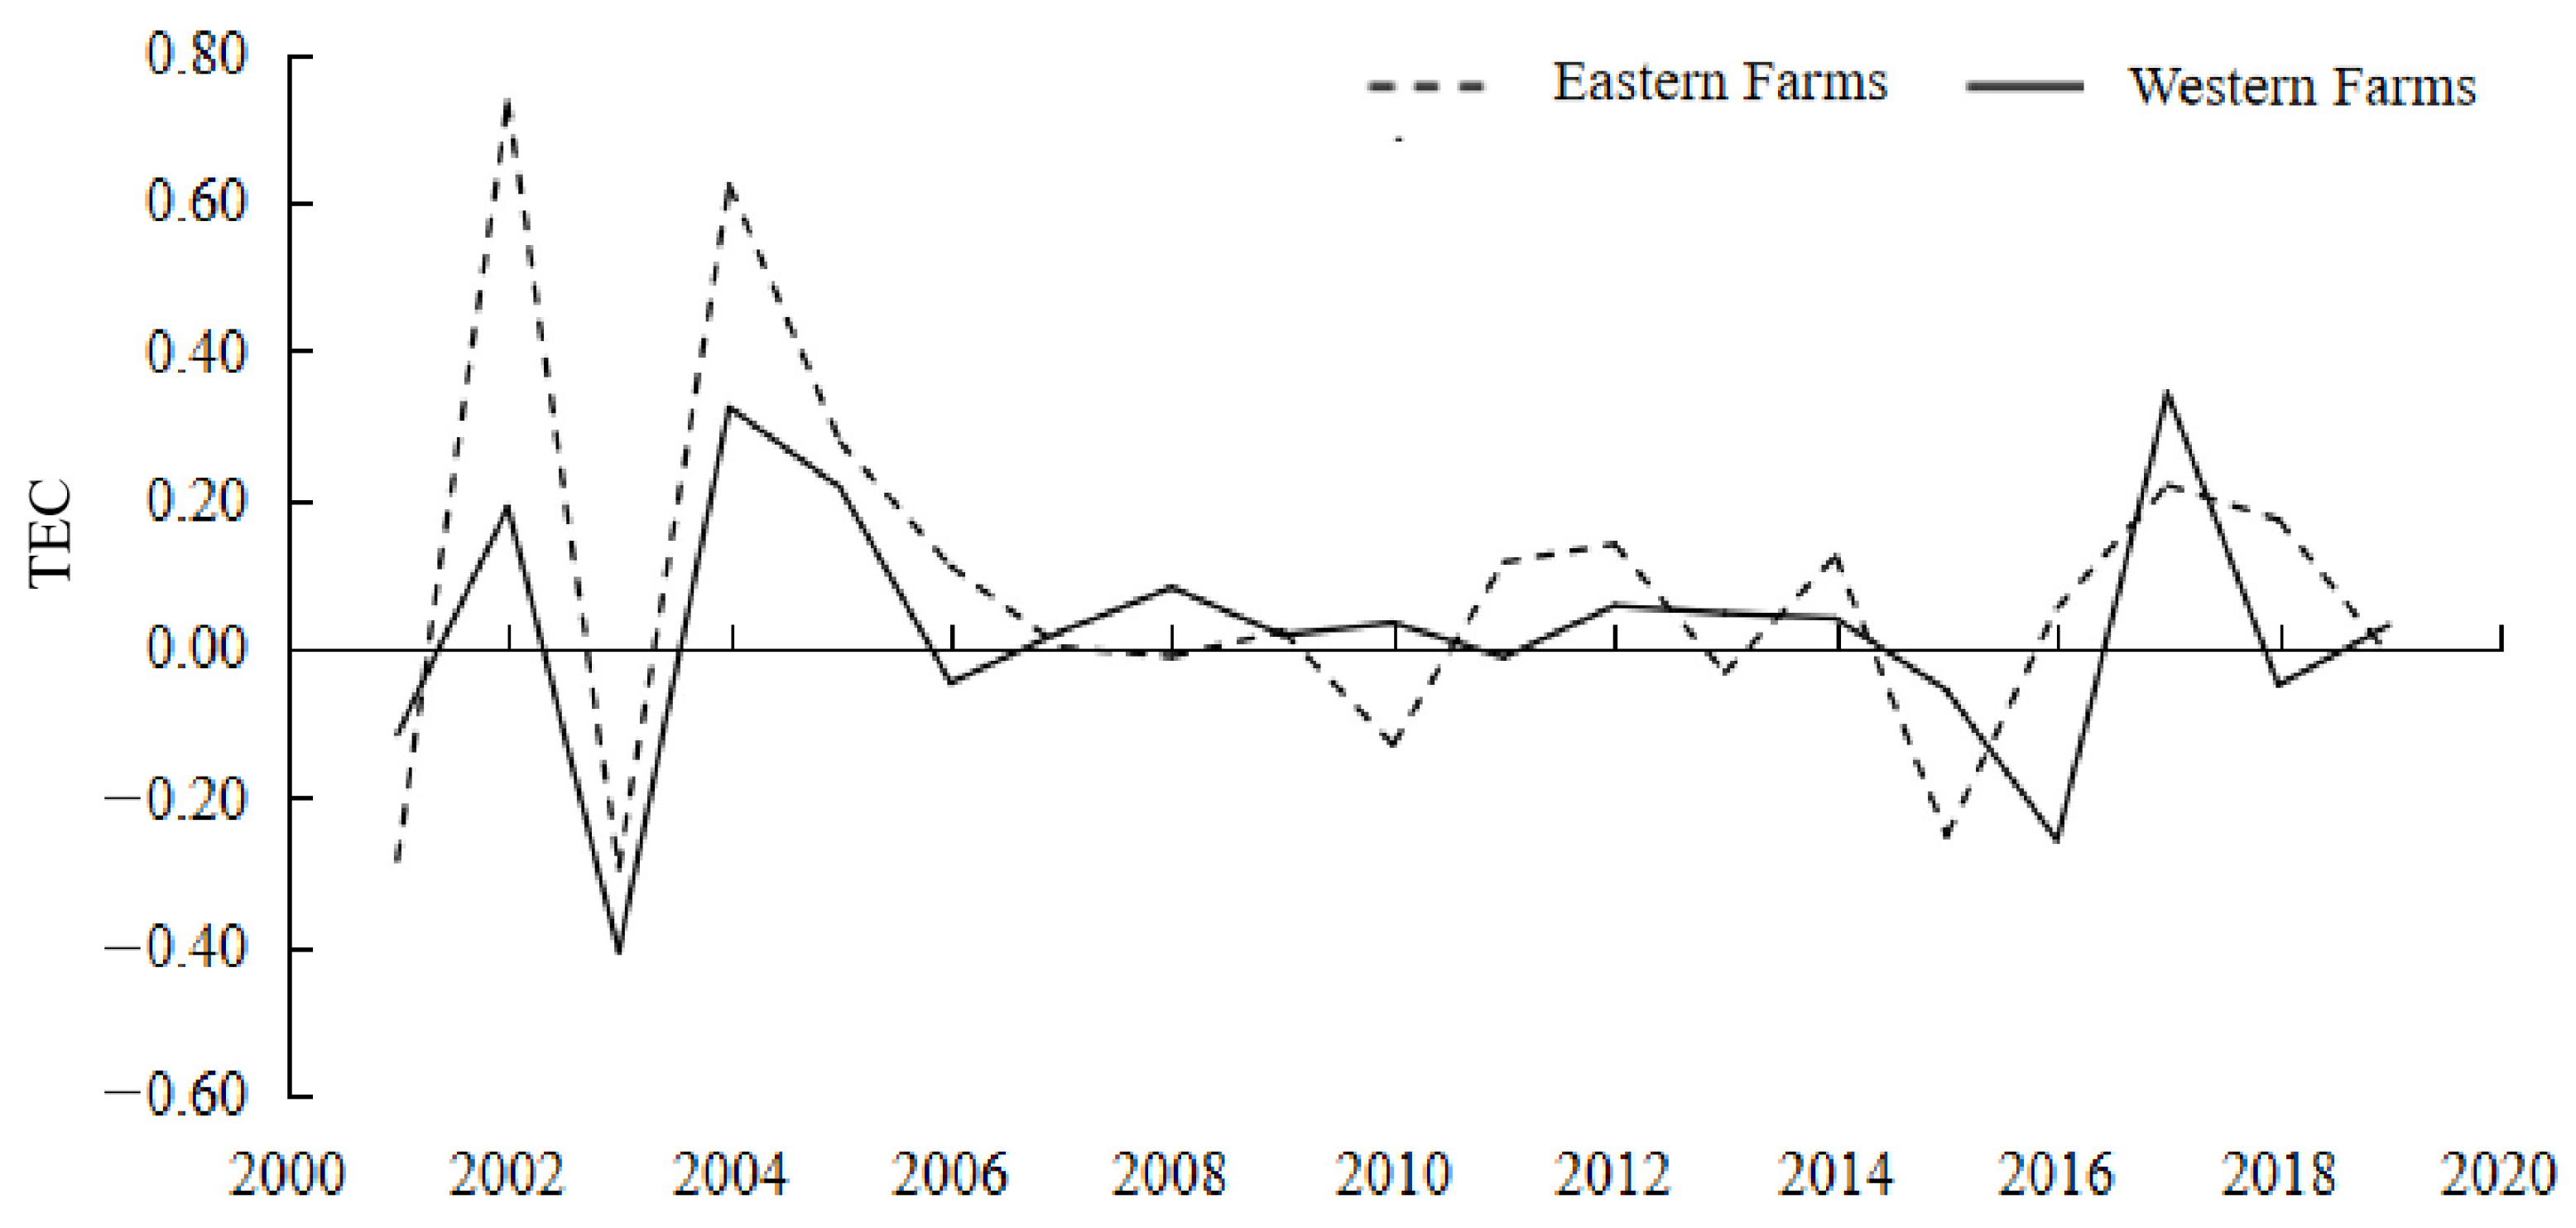
4.2.3. Higher TE of the Farms in the DMCF
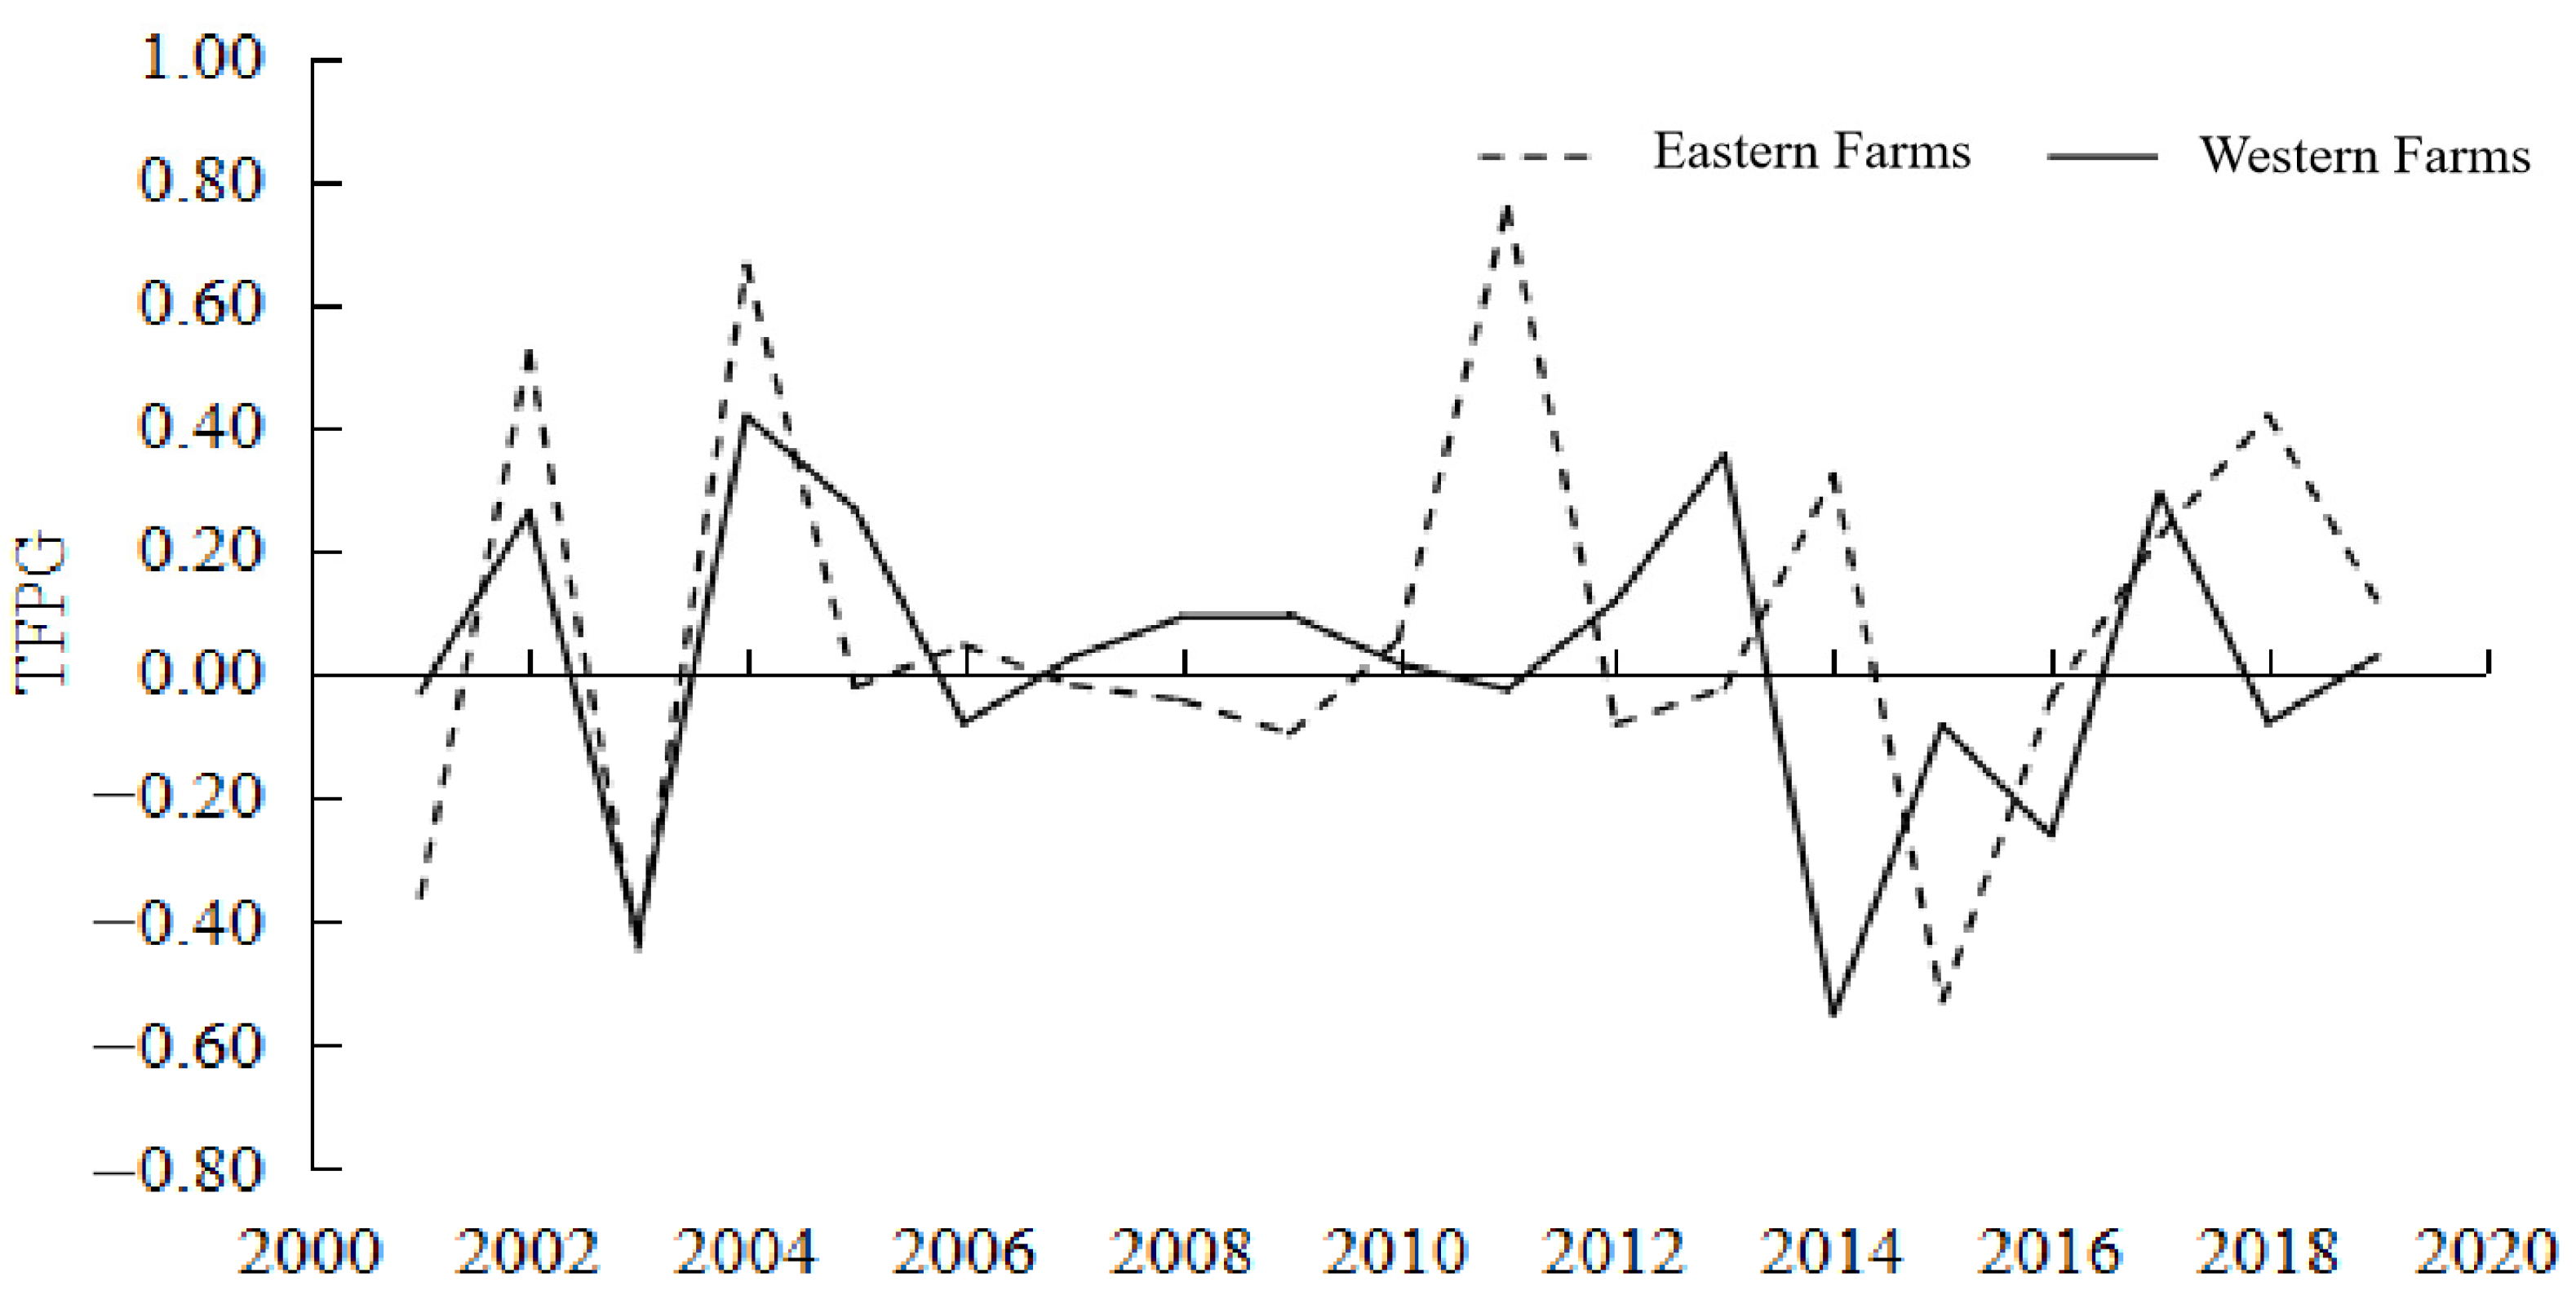
4.2.4. Overall Characteristics of the TFPG
5. Conclusions and Recommendations
Author Contributions
Funding
Institutional Review Board Statement
Informed Consent Statement
Data Availability Statement
Conflicts of Interest
References
- Liu, Y.; Li, Y. Revitalize the world’s countryside. Nature 2017, 548, 275–277. [Google Scholar] [CrossRef] [PubMed]
- Hu, Y.; Li, B.; Zhang, Z.; Wang, J. Farm size and agricultural technology progress: Evidence from China. J. Rural. Stud. 2022, 93, 417–429. [Google Scholar] [CrossRef]
- Fan, S.; Li, X.; Fang, C. Agricultural R&D and urban poverty. Agrotech. Econ. 2012. [Google Scholar]
- Mendola, M. Agricultural technology adoption and poverty reduction: A propensity-score matching analysis for rural Bangladesh. Food Policy 2007, 32, 372–393. [Google Scholar] [CrossRef]
- Li, Y.; Li, Y.; Westlund, H.; Liu, Y. Urban–rural transformation in relation to cultivated land conversion in China: Implications for optimizing land use and balanced regional development. Land Use Policy 2015, 47, 218–224. [Google Scholar] [CrossRef]
- Washizu, A.; Nakano, S. Exploring the characteristics of smart agricultural development in Japan: Analysis using a smart agricultural kaizen level technology map. Comput. Electron. Agric. 2022, 198, 107001. [Google Scholar] [CrossRef]
- Ma, M.; Lin, J.; Sexton, R.J. The transition from small to large farms in developing economies: A welfare analysis. Am. J. Agric. Econ. 2022, 104, 111–133. [Google Scholar] [CrossRef]
- Nolte, K.; Ostermeier, M. Labour Market Effects of Large-Scale Agricultural Investment: Conceptual Considerations and Estimated Employment Effects. World Dev. Multi-Discip. Int. J. Devoted Study Promot. World Dev. 2017, 98, 430–446. [Google Scholar] [CrossRef]
- Zhang, X.; Yu, X.; Xu, T.; Geng, X.; Zhou, Y. Farm size, inefficiency, and rice production cost in China. J. Product. Anal. 2019, 52, 57–68. [Google Scholar] [CrossRef]
- Wang, S.; Tu, Y.; Liu, S. The evolution of state-owned enterprises in South China: The choice of property right system perspective. Anthropologist 2014, 18, 103–111. [Google Scholar] [CrossRef]
- Zhang, X.; Zhang, Z. How do smart villages become a way to achieve sustainable development in rural areas? Smart village planning and practices in China. Sustainability 2020, 12, 10510. [Google Scholar] [CrossRef]
- Shi, C.; Zhan, P.; Zhu, J. Land Transfer, Factor Allocation and Agricultural Production Efficiency Improvement. China Land Sci. 2020, 34, 49–57. [Google Scholar]
- Peng, Y.; Jiang, Y.; Hong, Y. Heterogeneous Preferences for Selecting Attributes of Farmland Management Right Mortgages in Western China: A Demand Perspective. Land 2022, 11, 1157. [Google Scholar] [CrossRef]
- Huang, Z.; Wang, J.; Chen, Z. The impact of non-agricultural employment, land transfer and land fragmentation on the technical efficiency of rice farmers. Chin. Rural. Econ. 2014, 11, 4–16. [Google Scholar]
- Chen, C. Untitled land, occupational choice, and agricultural productivity. Am. Econ. J. Macroecon. 2017, 9, 91–121. [Google Scholar] [CrossRef]
- Regan, J.; Smith, C. Agrarian Reform and Resistance in an Age of Globalisation: The Euro-American World and Beyond, 1780–1914; Routledge: Abingdon, UK, 2018. [Google Scholar]
- Niu, Z.; Zhang, Y.; Li, T.; Baležentis, T.; Štreimikienė, D.; Shen, Z. Total factor productivity growth in China’s corn farming: An application of generalized productivity indicator. J. Bus. Econ. Manag. 2021, 22, 1189–1208. [Google Scholar] [CrossRef]
- Peng, J. Study on Deepening Rural Land Reform and Farmers’ Income. Asian Agric. Res. 2019, 11, 27–29. [Google Scholar]
- Mao, F.; Guo, W. A Literature Review on Structural Reform of Agricultural Supply Side. In Proceedings of the 2017 3rd International Conference on Economics, Social Science, Arts, Education and Management Engineering (ESSAEME 2017), Huhhot, China, 29–30 July 2017. [Google Scholar] [CrossRef]
- Gai, Q.; ZhuCheng, X.; Shi, Q. Improper allocation of land resources and labor productivity. Econ. Res. 2017, 5, 117–129. [Google Scholar]
- Chen, M.; Heerink, N.; Zhu, X.; Feng, S. Do small and equally distributed farm sizes imply large resource misallocation? Evidence from wheat-maize double-cropping in the North China Plain. Food Policy 2022, 112, 102350. [Google Scholar] [CrossRef]
- Xu, H. Research on the optimal operation scale of State Farm, takes Hainan state-owned rubber planting Farm as an example. Agric. Technol. Econ. 2012, 8, 96–104. [Google Scholar]
- Wang, L.; Chang, W. Total factor productivity and its differences in family farms in China. J. South China Agric. Univ. 2017, 16, 20–31. [Google Scholar]
- Zhu, L.; Zhang, G.; Zhang, J. Analysis of Influence of Soil and Water Resources on technological efficiency of Large Grain Farmers based on the survey data of 697 large grain growers in Heilongjiang Province. Econ. Jingwei 2018, 35, 66–72. [Google Scholar]
- Song, W.; Ye, C. Impact of the Cultivated-Land-Management Scale on Fertilizer Reduction—Empirical Evidence from the Countryside of China. Land 2022, 11, 1184. [Google Scholar] [CrossRef]
- Zhang, R.; Gao, M. New technology adoption behavior and technology efficiency difference based on the comparison between small farmers and large grain growers. Rural. Econ. China 2018, 5, 84–97. [Google Scholar]
- Zhou, Y.; Li, X.; Liu, Y. Rural land system reforms in China: History, issues, measures and prospects. Land Use Policy 2020, 91, 104330. [Google Scholar] [CrossRef]
- Li, J.; Lin, Q. Can the Adjustment of China’s Grain Purchase and Storage Policy Improve Its Green Productivity? Int. J. Environ. Res. Public Health 2022, 19, 6310. [Google Scholar] [CrossRef]
- Liu, S. The reform of the rural land system: From the household contract responsibility system to three rights division. Econ. Res. J. 2022, 57, 18–26. [Google Scholar]
- Wang, X.; Yamauchi, F.; Huang, J.; Rozelle, S. What constrains mechanization in Chinese agriculture? Role of farm size and fragmentation. China Econ. Rev. 2020, 62, 101221. [Google Scholar] [CrossRef]
- Chen, F.; Zhao, Y. Determinants and differences of grain production efficiency between main and non-main producing area in china. Sustainability 2019, 11, 5225. [Google Scholar] [CrossRef]
- Chen, S.; Lan, X. Tractor vs. Animal: Rural reforms and technology adoption in China. J. Dev. Econ. 2020, 147, 102536. [Google Scholar] [CrossRef]
- Huffman, W.E. Allocative Efficiency: The Role of Human Capital. Q. J. Econ. 1977, 91, 59–80. [Google Scholar] [CrossRef]
- Mao, P.; Xu, J. Agricultural land system, the transfer of land management rights and the growth of farmers’ income. Manag. World 2015, 63–74. [Google Scholar]
- Gao, J.; Peng, C.; Shi, Q. Study on the high chemical fertilizers consumption and fertilization behavior of small rural household in china:discovery from 1995~2016 national fixed point survey data. Manag. World 2019, 10, 120–132. [Google Scholar]
- Chen, C.; Wang, X.; Chen, H.; Wu, C.; Mafarja, M.; Turabieh, H. Towards precision fertilization: Multi-strategy grey wolf optimizer based model evaluation and yield estimation. Electronics 2021, 10, 2183. [Google Scholar] [CrossRef]
- Holden, S.; Quiggin, J. Climate risk and state-contingent technology adoption: Shocks, drought tolerance and preferences. Eur. Rev. Agric. Econ. 2017, 44, 285–308. [Google Scholar]
- Chen, C.; Restuccia, D.; Santaeulalia-Llopis, R. The Effects of Land Markets on Resource Allocation and Agricultural Productivity. Rev. Econ. Dyn. 2022, 45, 41–54. [Google Scholar] [CrossRef]
- Wang, Y.; Dong, F.; Xu, J. Production Efficiency of Scaled-up Agricultural Operations in China: An Empirical Analysis. In Proceedings of the 2018 Agricultural & Applied Economics Association Annual Meeting, Washington, DC, USA, 5–7 August 2018. [Google Scholar]
- Li, W.; Wang, L.; Wan, Q.; You, W.; Zhang, S. A Configurational Analysis of Family Farm Management Efficiency: Evidence from China. Sustainability 2022, 14, 6015. [Google Scholar] [CrossRef]
- Jin, S.; Ma, H.; Huang, J.; Hu, R.; Rozelle, S. Productivity, efficiency and technical change: Measuring the performance of China’s transforming agriculture. J. Product. Anal. 2010, 33, 191–207. [Google Scholar] [CrossRef]
- Khanna, M.; Miao, R. Inducing the adoption of emerging technologies for sustainable intensification of food and renewable energy production: Insights from applied economics. Aust. J. Agric. Resour. Econ. 2022, 66, 1–23. [Google Scholar] [CrossRef]
- Zhang, Y.; Brümmer, B. Productivity change and the effects of policy reform in China’s agriculture since 1979. Asian Pac. Econ. Lit. 2011, 25, 131–150. [Google Scholar] [CrossRef]
- Kuang, Y.; Yang, J. China agricultural technical efficiency analysis based on farmland transger. J. Nanjing Agric. Universtiy 2018, 18, 138–148+162. [Google Scholar]
- Huang, J.B.; Du, D.; Hao, Y. The driving forces of the change in China’s energy intensity: An empirical research using DEA-Malmquist and spatial panel estimations. Econ. Model. 2017, 65, 41–50. [Google Scholar] [CrossRef]
- Chen, Y.; Miao, J.; Zhu, Z. Measuring green total factor productivity of China’s agricultural sector: A three-stage SBM-DEA model with non-point source pollution and CO2 emissions. J. Clean. Prod. 2021, 318, 128543. [Google Scholar] [CrossRef]
- Ngo, D.; Nguyen, L.T.P. Total factor productivity of Thai Banks in 2007-2010: An application of DEA and Malmquist Index. J. Appl. Financ. Bank. 2012, 2, 27–42. [Google Scholar]
- Battese, G.E.; Coelli, T.J. A model for technical inefficiency effects in a stochastic frontier production function for panel data. Empir. Econ. 1995, 20, 325–332. [Google Scholar] [CrossRef]
- Kumbhakar, S.C.; Denny, M.; Fuss, M. Estimation and decomposition of productivity change when production is not efficient: A paneldata approach. Econom. Rev. 2000, 19, 312–320. [Google Scholar] [CrossRef]
- Zhu, J.; Jin, L. Agricultural Infrastructure, Food Production Cost and International Competitiveness: Based on the Empirical Test of Total Factor Productivity. J. Agrotech. Econ 2017, 10, 14–24. [Google Scholar]
- Rakotoarisoa, M.A. The impact of agricultural policy distortions on the productivity gap: Evidence from the rice Production. Food Policy 2011, 36, 147–157. [Google Scholar] [CrossRef]


| Farm | Western | Eastern |
|---|---|---|
| Farms | Farms | |
| Modes of operation | Corporate management (state farm before 2012) | Individual family management |
| Management structure | Group Corporation → Subsidiary→ Farm → Workers | Group Corporation →Subsidiary → Farm → Family |
| Land management system | Land of lease | Contracted land |
| Sowing area (ha) | 248,097 | 152,227 |
| Number of employees (person) | 9802 | 23,650 |
| Grain output (ton) | 388,922 | 482,478 |
| Variable | Unit | Eastern Farms | Western Farms | ||||
|---|---|---|---|---|---|---|---|
| Mean | Standard Error | Sample Capacity | Mean | Standard Error | Sample Capacity | ||
| Sown area | ha | 11,439.40 | 6670.19 | 260 | 17,105.15 | 9220.94 | 220 |
| Damage area | ha | 6487.16 | 9600.19 | 260 | 12,171.04 | 10,858.94 | 220 |
| Output of grain | Yuan/ha | 4059.45 | 1468.57 | 260 | 4143.71 | 1899.08 | 220 |
| Employees amount | persons/ha | 0.15 | 0.11 | 260 | 0.18 | 0.35 | 220 |
| Chemical fertilizer folding purity | kg/ha | 129.52 | 55.76 | 260 | 141.91 | 60.36 | 220 |
| Mechanical power | Watt/ha | 2048.51 | 714.97 | 260 | 2078.71 | 804.08 | 220 |
| Total seed input | kg/ha | 94.02 | 56.81 | 260 | 185.44 | 83.96 | 220 |
| Per-capita employee income | Yuan/person | 359,227 | 210,328 | 260 | 368,023 | 203,855 | 220 |
| Order Number | Null Hypothesis | Eastern Farms | Western Farms | ||
|---|---|---|---|---|---|
| Maximum Likelihood Value | LR Statistics | Maximum Likelihood Value | LR Statistics | ||
| 1 | ϒ = 0 | −10.98 | 245.76 | −87.73 | 111.17 |
| 2 | β5 = β6 = β7 = …… = β19 = β20 = 0 | −37.19 | 52.41 | −106.74 | 38.02 |
| 3 | β15 = β16 = β17 = β18 = β19 = β20 = 0 | −27.07 | 32.17 | −99.64 | 23.82 |
| 4 | β17 = β18 = β19 = β20 = 0 | −19.19 | 16.41 | −94.67 | 13.89 |
| Explanatory Variable | Parameter | 13 Farms in Eastern Farms(DMCF) | 11 Farms in Western Farms(UMCO) | ||
|---|---|---|---|---|---|
| Regression Coefficient | Standard Error | Regression Coefficient | Standard Error | ||
| constant term | β0 | 3.1744 | 4.1263 | 8.3361 *** | 1.1916 |
| β1 | −0.0904 | 0.6714 | 2.2659 *** | 0.8241 | |
| β2 | 1.2578 | 0.9670 | −0.3397 | 0.9966 | |
| β3 | 0.3257 | 1.1922 | −0.1945 | 0.6707 | |
| β4 | 1.3248 | 0.8870 | 2.0907 *** | 0.7268 | |
| β5 | −0.1481 * | 0.0875 | 0.2354 | 0.1495 | |
| β6 | 0.2199 | 0.1702 | −0.0984 | 0.2722 | |
| β7 | −0.2482 | 0.2217 | −0.2109 | 0.2222 | |
| β8 | −0.1462 | 0.1024 | 0.0081 | 0.0308 | |
| β9 | 0.2618 *** | 0.0816 | 0.0832 | 0.1208 | |
| β10 | −0.1992 ** | 0.0892 | −0.4014 *** | 0.1243 | |
| β11 | 0.0611 | 0.0826 | 0.2500 *** | 0.0779 | |
| β12 | 0.0417 | 0.1271 | 0.1977 | 0.1985 | |
| β13 | −0.1899 | 0.1106 | −0.1651 ** | 0.0684 | |
| β14 | −0.1106 | 0.1469 | −0.1898 * | 0.1061 | |
| t | β15 | −0.0959 | 0.0749 | 0.2833 * | 0.1505 |
| t2 | β16 | −0.0012 | 0.0014 | −0.0053 ** | 0.0024 |
| β17 | −0.0233 *** | 0.0078 | 0.0241 | 0.0185 | |
| β18 | 0.0027 | 0.0136 | 0.0417 * | 0.0221 | |
| β19 | −0.0107 | 0.0115 | −0.0488 ** | 0.0245 | |
| β20 | 0.0199 | 0.0106 | 0.0231 *** | 0.0079 | |
| DIS | β21 | −0.1728 *** | 0.0406 | −0.2889 *** | 0.0729 |
| Constant term | d0 | −0.4621 | 0.3276 | −0.3136 | 0.5878 |
| Group Reform (G) | d1 | 1.9610 *** | 0.5191 | 0.7582 | 0.6037 |
| Per capita income (AR) | d2 | −0.0002 *** | 0.0000 | −0.0002 *** | 0.0000 |
| T | d3 | 0.2369 *** | 0.0465 | 0.0755 | 0.0487 |
| 0.6307 *** | 0.1493 | 1.1901 *** | 0.3625 | ||
| ϒ | 0.9793 *** | 0.0086 | 0.9657 *** | 0.0149 | |
| Likelihood ratio (LR) one-sided test | 245.76 *** | 111.17 *** | |||
| Number of observed values | 260 | 220 | |||
| Number of sections | 13 | 11 | |||
| Year | 13 Farms in Eastern Farms (DMCF) | 11 Farms in Western Farms (UMCO) | ||||||||||
|---|---|---|---|---|---|---|---|---|---|---|---|---|
| TPn | TPb | TP | SRC | TEC | TFPG | TPn | TPb | TP | SRC | TEC | TFPG | |
| 2000 | −0.0971 | 0.1144 | 0.0173 | 0.278 | −0.2157 | 0.0623 | ||||||
| 2001 | −0.0983 | 0.1208 | 0.0225 | −0.099 | −0.2846 | −0.3611 | 0.2728 | −0.2255 | 0.0473 | 0.0377 | −0.1157 | −0.0308 |
| 2002 | −0.0995 | 0.1122 | 0.0127 | −0.2266 | 0.7337 | 0.5198 | 0.2675 | −0.225 | 0.0425 | 0.0302 | 0.1894 | 0.2622 |
| 2003 | −0.1007 | 0.1123 | 0.0115 | −0.1609 | −0.2955 | −0.4449 | 0.2623 | −0.2399 | 0.0223 | −0.0391 | −0.4077 | −0.4244 |
| 2004 | −0.102 | 0.1237 | 0.0217 | 0.0179 | 0.6223 | 0.6618 | 0.257 | −0.2236 | 0.0334 | 0.0603 | 0.3235 | 0.4173 |
| 2005 | −0.1032 | 0.1286 | 0.0254 | −0.325 | 0.2772 | −0.0224 | 0.2517 | −0.2194 | 0.0324 | 0.0183 | 0.2158 | 0.2665 |
| 2006 | −0.1044 | 0.1264 | 0.0219 | −0.086 | 0.1101 | 0.046 | 0.2465 | −0.229 | 0.0175 | −0.0515 | −0.0466 | −0.0805 |
| 2007 | −0.1056 | 0.1288 | 0.0231 | −0.0431 | 0.001 | −0.019 | 0.2412 | −0.217 | 0.0243 | −0.0202 | 0.0219 | 0.0260 |
| 2008 | −0.1069 | 0.1195 | 0.0126 | −0.0443 | −0.0114 | −0.0431 | 0.236 | −0.218 | 0.0179 | −0.0082 | 0.0817 | 0.0914 |
| 2009 | −0.1081 | 0.1289 | 0.0208 | −0.1406 | 0.0225 | −0.0974 | 0.2307 | −0.2104 | 0.0203 | 0.0581 | 0.0170 | 0.0954 |
| 2010 | −0.1093 | 0.1344 | 0.0251 | 0.1586 | −0.1294 | 0.0543 | 0.2255 | −0.2028 | 0.0227 | −0.0411 | 0.0338 | 0.0154 |
| 2011 | −0.1105 | 0.1347 | 0.0241 | 0.6145 | 0.1157 | 0.7543 | 0.2202 | −0.2203 | −0.0001 | −0.0133 | −0.0126 | −0.0260 |
| 2012 | −0.1118 | 0.1355 | 0.0237 | −0.2447 | 0.1393 | −0.0817 | 0.215 | −0.2273 | −0.0124 | 0.0731 | 0.0573 | 0.1180 |
| 2013 | −0.113 | 0.1341 | 0.0211 | −0.0123 | −0.033 | −0.0242 | 0.2097 | −0.2265 | −0.0168 | 0.3246 | 0.0470 | 0.3548 |
| 2014 | −0.1142 | 0.1375 | 0.0233 | 0.1755 | 0.1233 | 0.3221 | 0.2044 | −0.2211 | −0.0167 | −0.5748 | 0.0399 | −0.5515 |
| 2015 | −0.1154 | 0.1368 | 0.0214 | −0.2996 | −0.2525 | −0.5307 | 0.1992 | −0.2119 | −0.0127 | −0.0147 | −0.0566 | −0.0840 |
| 2016 | −0.1167 | 0.1364 | 0.0197 | −0.1142 | 0.0539 | −0.0406 | 0.1939 | −0.2147 | −0.0208 | 0.0162 | −0.2580 | −0.2626 |
| 2017 | −0.1179 | 0.1363 | 0.0184 | −0.0134 | 0.2186 | 0.2236 | 0.1887 | −0.2178 | −0.0291 | −0.0217 | 0.3427 | 0.2918 |
| 2018 | −0.1191 | 0.1334 | 0.0143 | 0.2317 | 0.1724 | 0.4183 | 0.1834 | −0.2227 | −0.0393 | 0.0097 | −0.0500 | −0.0797 |
| 2019 | −0.1203 | 0.1353 | 0.0149 | 0.1121 | −0.0093 | 0.1177 | 0.1782 | −0.2292 | −0.051 | 0.0488 | 0.0304 | 0.0281 |
| Average | −0.1087 | 0.1285 | 0.0198 | −0.0263 | 0.0829 | 0.0765 | 0.2281 | −0.2209 | 0.0072 | −0.0057 | 0.0239 | 0.0225 |
| Indicators | Land Management Modes | |
|---|---|---|
| 13 Farms in Eastern Farms (DMCF) | 11 Farms in Western Farms (UMCO) | |
| TFPG | higher, 7.65% | lower, 2.25% |
| TP | higher, 1.99%; affected by TPb; stable | Lower,0.43%; affected by the TPn; declining |
| TE and TEC | Higher in the TE and the TEC; 78% and 8.29% | Lower in the TE and TEC; 73% and 2.39% |
| SRC | Lower, −2.63% | higher, −0.57% |
Publisher’s Note: MDPI stays neutral with regard to jurisdictional claims in published maps and institutional affiliations. |
© 2022 by the authors. Licensee MDPI, Basel, Switzerland. This article is an open access article distributed under the terms and conditions of the Creative Commons Attribution (CC BY) license (https://creativecommons.org/licenses/by/4.0/).
Share and Cite
Luo, H.; Hu, Z.; Hao, X.; Khan, N.; Liu, X. Assessment and Comparison of Agricultural Technology Development under Different Farmland Management Modes: A Case Study of Grain Production, China. Land 2022, 11, 1895. https://doi.org/10.3390/land11111895
Luo H, Hu Z, Hao X, Khan N, Liu X. Assessment and Comparison of Agricultural Technology Development under Different Farmland Management Modes: A Case Study of Grain Production, China. Land. 2022; 11(11):1895. https://doi.org/10.3390/land11111895
Chicago/Turabian StyleLuo, Hui, Zhaomin Hu, Xiuping Hao, Nawab Khan, and Xiaojie Liu. 2022. "Assessment and Comparison of Agricultural Technology Development under Different Farmland Management Modes: A Case Study of Grain Production, China" Land 11, no. 11: 1895. https://doi.org/10.3390/land11111895
APA StyleLuo, H., Hu, Z., Hao, X., Khan, N., & Liu, X. (2022). Assessment and Comparison of Agricultural Technology Development under Different Farmland Management Modes: A Case Study of Grain Production, China. Land, 11(11), 1895. https://doi.org/10.3390/land11111895