Article

Self-Purification Mode of Still-Water Ponds in Urban Parks Based on In Situ Ecological Remediation Design

1
School of Art and Archaeology, Zhejiang University City College, Hangzhou 310015, China
2
College of Environmental Science and Engineering, Beijing Forestry University, Beijing 100083, China
3
School of Landscape Architecture, Beijing Forestry University, Beijing 100083, China
*
Author to whom correspondence should be addressed.
Land 2022, 11(10), 1676; https://doi.org/10.3390/land11101676
Submission received: 24 August 2022 / Revised: 16 September 2022 / Accepted: 24 September 2022 / Published: 28 September 2022

Abstract

:
Still-water ponds in urban parks are often eutrophic; hence, these ponds are typically at risk of algal blooms, which have a negative impact on landscapes and visitor experiences. Instead of adopting the current mainstream methods of ex situ ecological remediation with flowing water bodies, such as the construction of a circulating filtration system or an artificial wetland system around the pond, this research adopted in situ ecological remediation in still-water ponds to suppress algal blooms. The plan was implemented through a small-scale engineering design and plant configuration inside the pond. Using six still-water ponds in Beijing Yu Park as experimental sites, different mini-engineering designs and plant configurations were implemented at different ponds to perform comparative experiments, and the water quality of each pond was monitored for three consecutive years. By summarizing the variation in key water quality indices for each pond, we found that a mini-engineering design of “multilevel” pond revetments and lakebeds combined with a “multilayer” aquatic macrophyte configuration of floating-leaved plants, emergent plants, and submerged plants could effectively inhibit algal blooms. Thus, an effective ecological self-purification model and corresponding landscape design principles for still-water ponds in urban parks were proposed.

1. Introduction

Water is one of the most basic elements of landscape architectural design and can enhance people’s enjoyment of landscapes [1,2]. As a type of waterscape, ponds have high ecological and social value; however, they are often ignored by environmental managers due to their small scale [3]. Ponds are widely used in the landscape design of modern urban parks, but they are also subject to many restrictions. First, as ponds are limited by the scale of the site, hardened vertical revetments and hardened lakebeds are often used in many ponds to create a wide water surface and prevent water leakage. These features harm the growth conditions of emergent plants on the revetment and submerged plants at the lakebed; however, these plants always play an important role in water purification. Second, ponds are generally small in scale and shallow in depth, and they have a closed water body and low hydrodynamic forces [4], resulting in low dissolved oxygen levels, which is not conducive to the survival of aquatic animals and makes it easy for water bodies to develop light and temperature conditions that favor algal outbreaks [5]. Third, most ponds regularly depend on replenishment from external water bodies, where the water quality is often relatively poor [6], adding to the risk of repeated pollution. Due to the above risks, the water quality of still-water ponds is often at a level of eutrophication [7] (pp. 95–140), leading to a low self-purification capacity of the water body [8], causing algal outbreaks and massive aggregation on the water surface, and forming algal blooms [9], thus affecting the landscape environment and people’s experience in that landscape.
At present, algal inhibition methods mainly include four technical means, namely, engineering, physical, chemical, and biological. For example, sludge dredging is a type of engineering method [10], ultrasonic deposition of algae is a physical method [11], and the use of flocculants and photosensitizers to control algae represents chemical methods [12,13]. However, it is difficult to maintain purified water over the long term due to the high cost or secondary pollution of these three methods. Biological methods mainly include algicidal microorganisms, biomanipulation, and aquatic plant methods [14,15,16]. Although the first two methods have more ecological benefits than the physical and chemical methods, they still have the risk of harming the ecological balance of water bodies. In contrast, the hydrophytic method is often considered a “green scheme” for water purification [17] because aquatic macrophytes can secrete allelochemicals and absorb nutrients in water, thus inhibiting the growth of algae [16,18,19,20]. Algal overproduction is one of the main causes of increased turbidity of landscape water. A study by Scheffer et al. indicated that the growth of aquatic macrophytes is conducive to the transformation of shallow lake water from turbidity to clarity [21], and lakes with high coverage of submerged plants and small, shallow lakes tend to have a higher transparency [22] (pp. 455–466). The studies above indicated that planting aquatic macrophytes may serve as a proper method for remediating eutrophic or polluted small lakes and ponds.
Many studies on the algal inhibition of aquatic macrophytes have been performed in a laboratory environment by simulating outdoor water or analyzing plant extracts [23,24]; however, the laboratory environment is quite different from the complex outdoor environment. In the current research field of algal bloom inhibition through outdoor landscape design with aquatic macrophytes, flowing water bodies are most often studied, and ex situ water quality conservation technology is mostly used [25], such as constructed wetland systems of composite multilevel ponds, circulating filtration systems formed by the combination of filters and circulating pumps [2,26,27], or the use of rainwater gardens that collect purified rainwater [28]. However, many urban parks have difficulty meeting the site scale and the water flow conditions required by this type of technology, and construction often occupies most of the space of the waterscape and damages the original landscape design. Among studies on the ecological purification design of small- and medium-sized outdoor still-water ponds, some have been conducted on ponds in natural wetlands [29], and others have been conducted on aquaculture ponds [30] (pp. 181–195). However, research on artificial ponds in urban parks is relatively rare.
Ecological engineering-based techniques, such as plant purification treatment, ecological floating beds, artificial floating islands, and constructed wetlands, have attracted the most research attention due to their overall economic, environmental, and ecological benefits [31]. This study aimed to design an ecological engineering-based method with a low impact on the original waterscape design to self-purify still-water ponds in urban parks. In this experiment, a mini-engineering design combined with aquatic macrophyte planting was used as an ecological remediation technology to purify the water of still-water ponds. Many still-water ponds are located in Beijing Yu Park, and these ponds have the same problems as the still-water ponds in urban parks mentioned above. Thus, the ponds represent typical cases. With the principle of minimum intervention, an in situ ecological remediation design consisting of mini-engineering and configuration of aquatic macrophytes was adopted to inhibit algal blooms of the ponds in Yu Park on the premise of retaining the original overall effect of landscape design, and comparative experiments were designed. The main research objectives were as follows: (1) verify whether a multilayer aquatic macrophyte configuration can effectively improve water quality and thus reduce algal blooms; (2) test whether the species of floating-leaved and emergent plants or the combination of floating-leaved, emergent, and submerged plants is the key factor in reducing algal blooms; (3) propose an effective ecological self-purification model of still-water ponds based on the improvement in water quality.

2. Materials and Methods

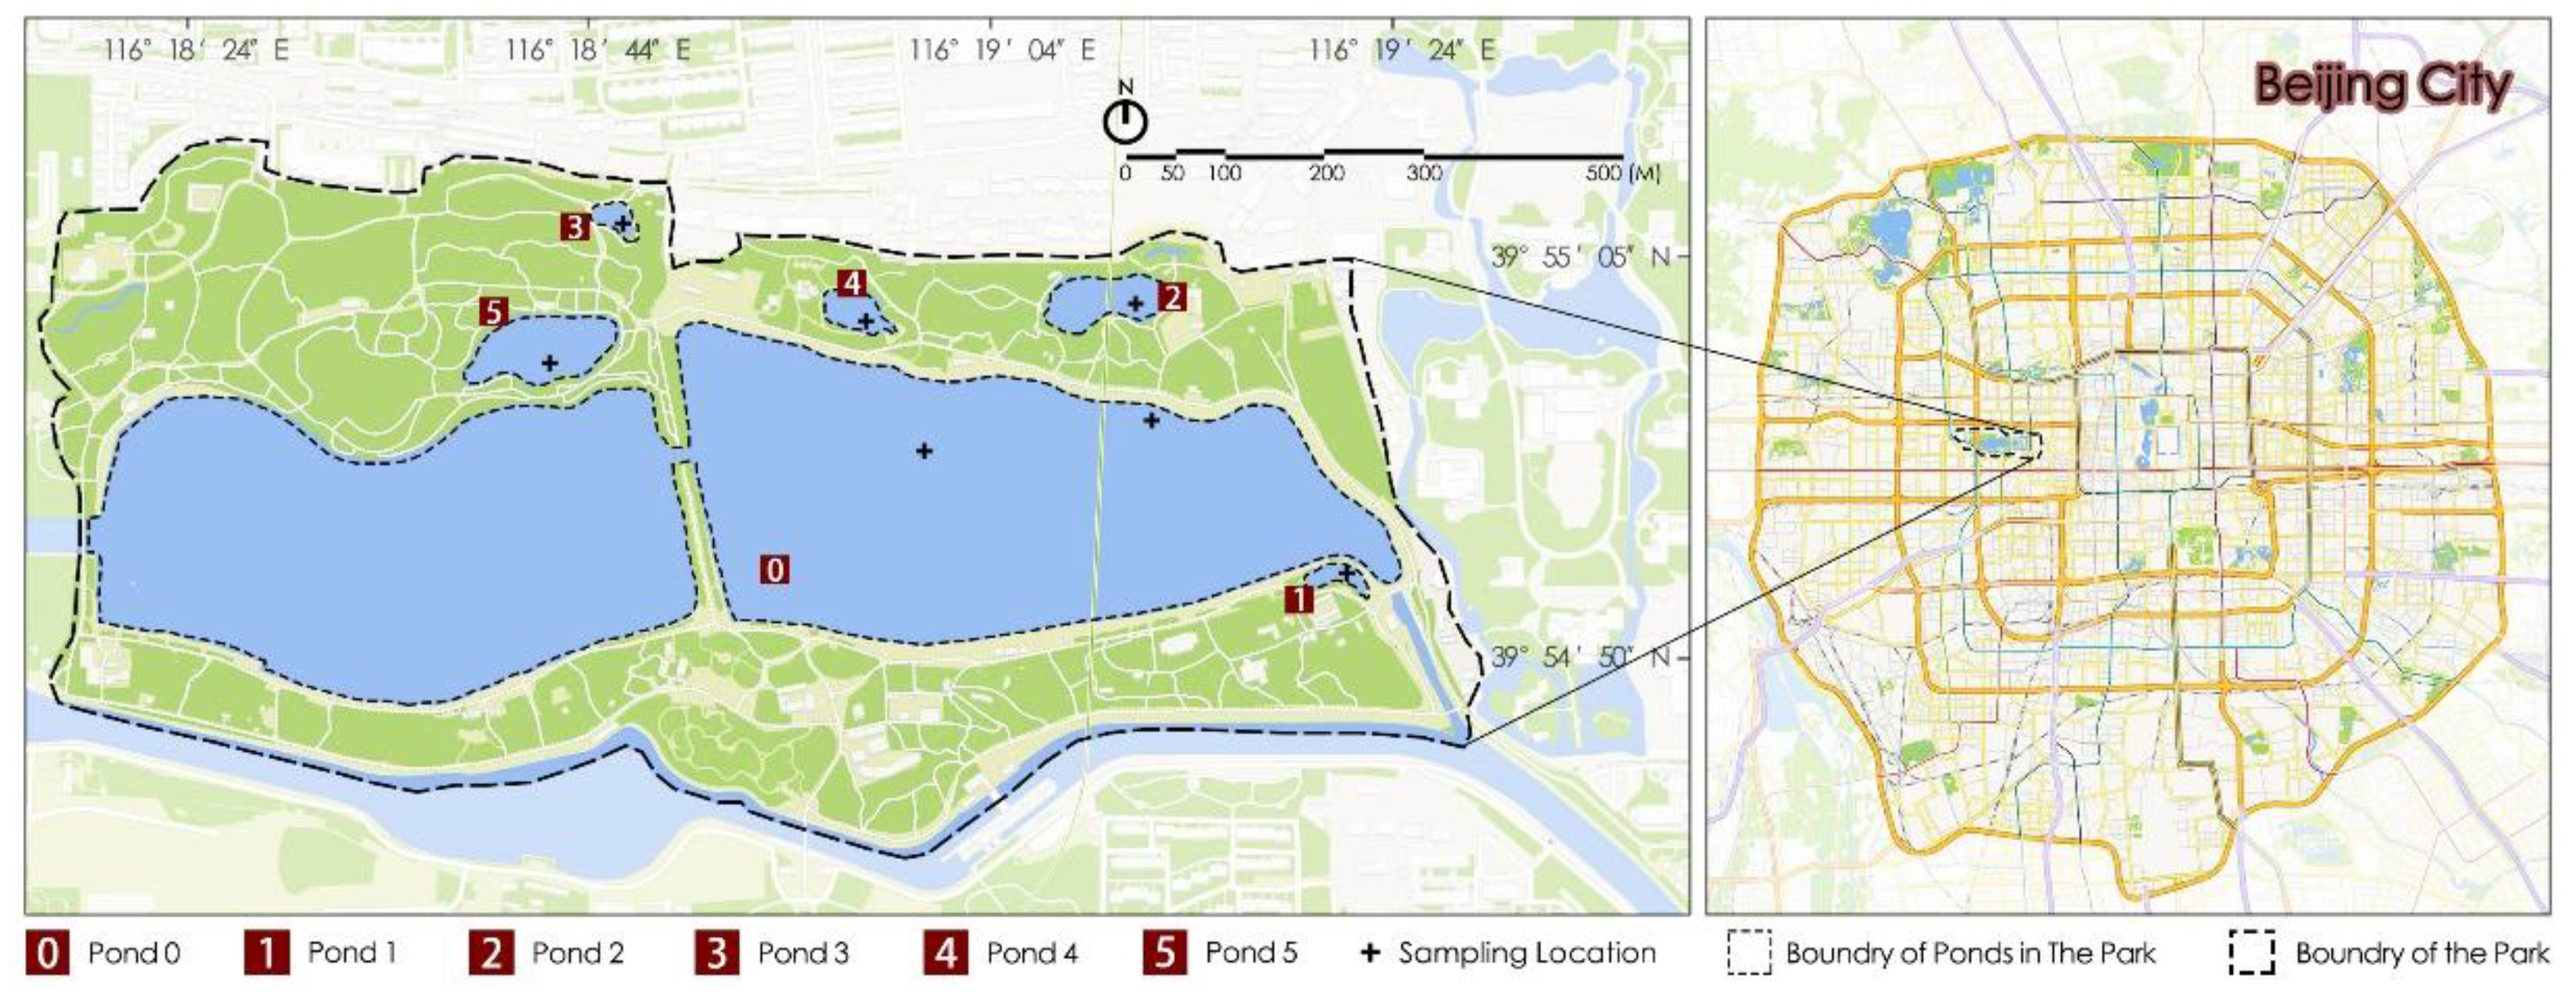
2.1. Selection of Experimental Ponds and Water Sampling Sites

Six still-water ponds in Beijing Yu Park were selected as experimental sites, namely, ponds 0, 1, 2, 3, 4, and 5 (Figure 1). The ponds mentioned above have similar surrounding environments. Pond 0 is slightly larger and is the source of water replenishment for ponds 1, 2, 3, 4, and 5; replenishment water was directly supplied to each pond from pond 0. Before ecological remediation, pond 5 was a nearly natural pond with a natural pond lakebed, gentle slope revetment, and good water quality. Pond 0 had hardened vertical revetments, and ponds 1, 2, 3, and 4 had hardened vertical revetments and flat lakebeds with poor water quality and frequent algal blooms. The area and depth of each pond are shown in Table 1. As a natural pond, pond 5 had healthy aquatic macrophyte communities, including floating-leaved plants, emergent plants, and submerged plants. However, ponds 0, 1, 2, 3, and 4 had almost no aquatic macrophytes. Before this ecological remediation, no other remediation or reconstruction was performed at ponds 0, 1, 2, 3, and 4, which experienced algal blooms of varying degrees almost every summer. In this experiment, seven water sampling points were chosen (Figure 1), and a 1 L tube sampler was used to collect water. Pond 0 was slightly larger. Thus, two sampling points were set at this pond, one near the shore and the other at the center of the pond. In the experiment, the average value of the water quality indices of the two water samples at pond 0 was applied as the value of the water quality index of the replenishment water. As the other ponds are relatively small, only one sampling point was set 100–150 cm away from shore at each pond. Water samples were collected once a month from March to November every year, except for the months when the park was closed for management and when the water was frozen. Ecological remediation reconstruction was conducted at the end of March of the second experimental year and was completed in the beginning of May (thus, water samples and data in April of the second experimental year were not collected during the reconstruction period). Then, the water quality was monitored for three consecutive years (i.e., the year before remediation, the year of remediation, and the year after remediation).

2.2. Methods

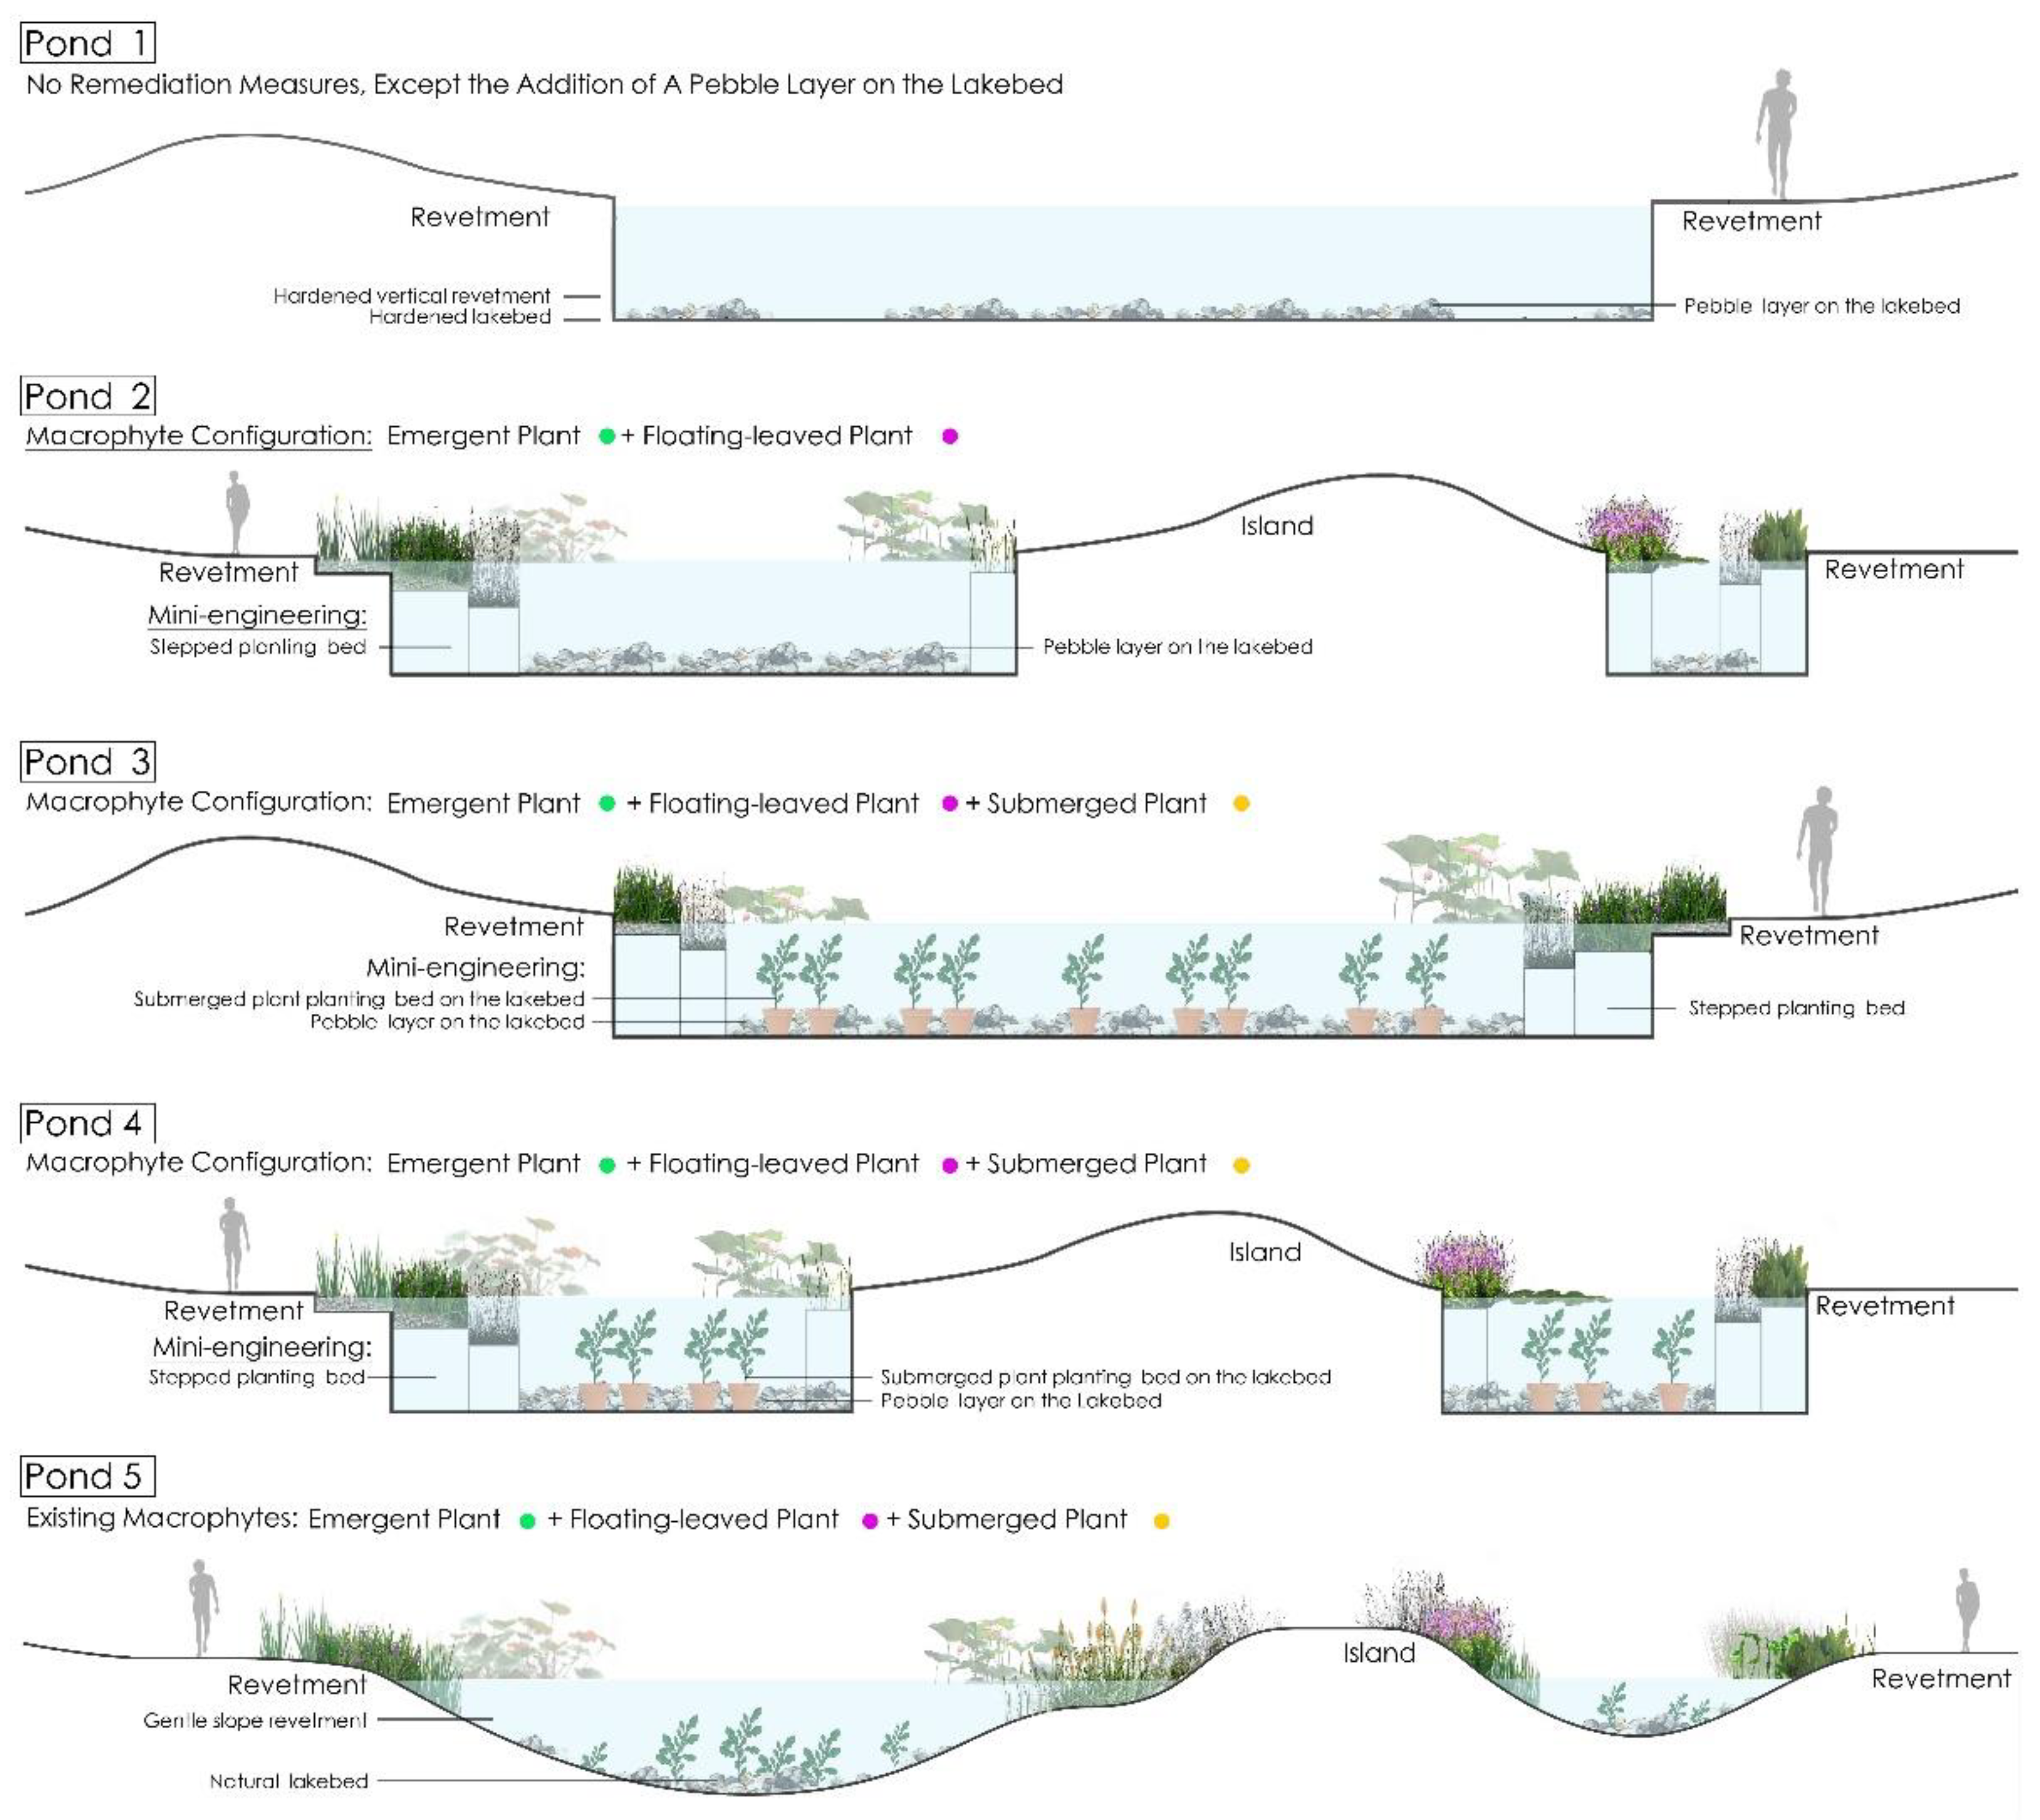
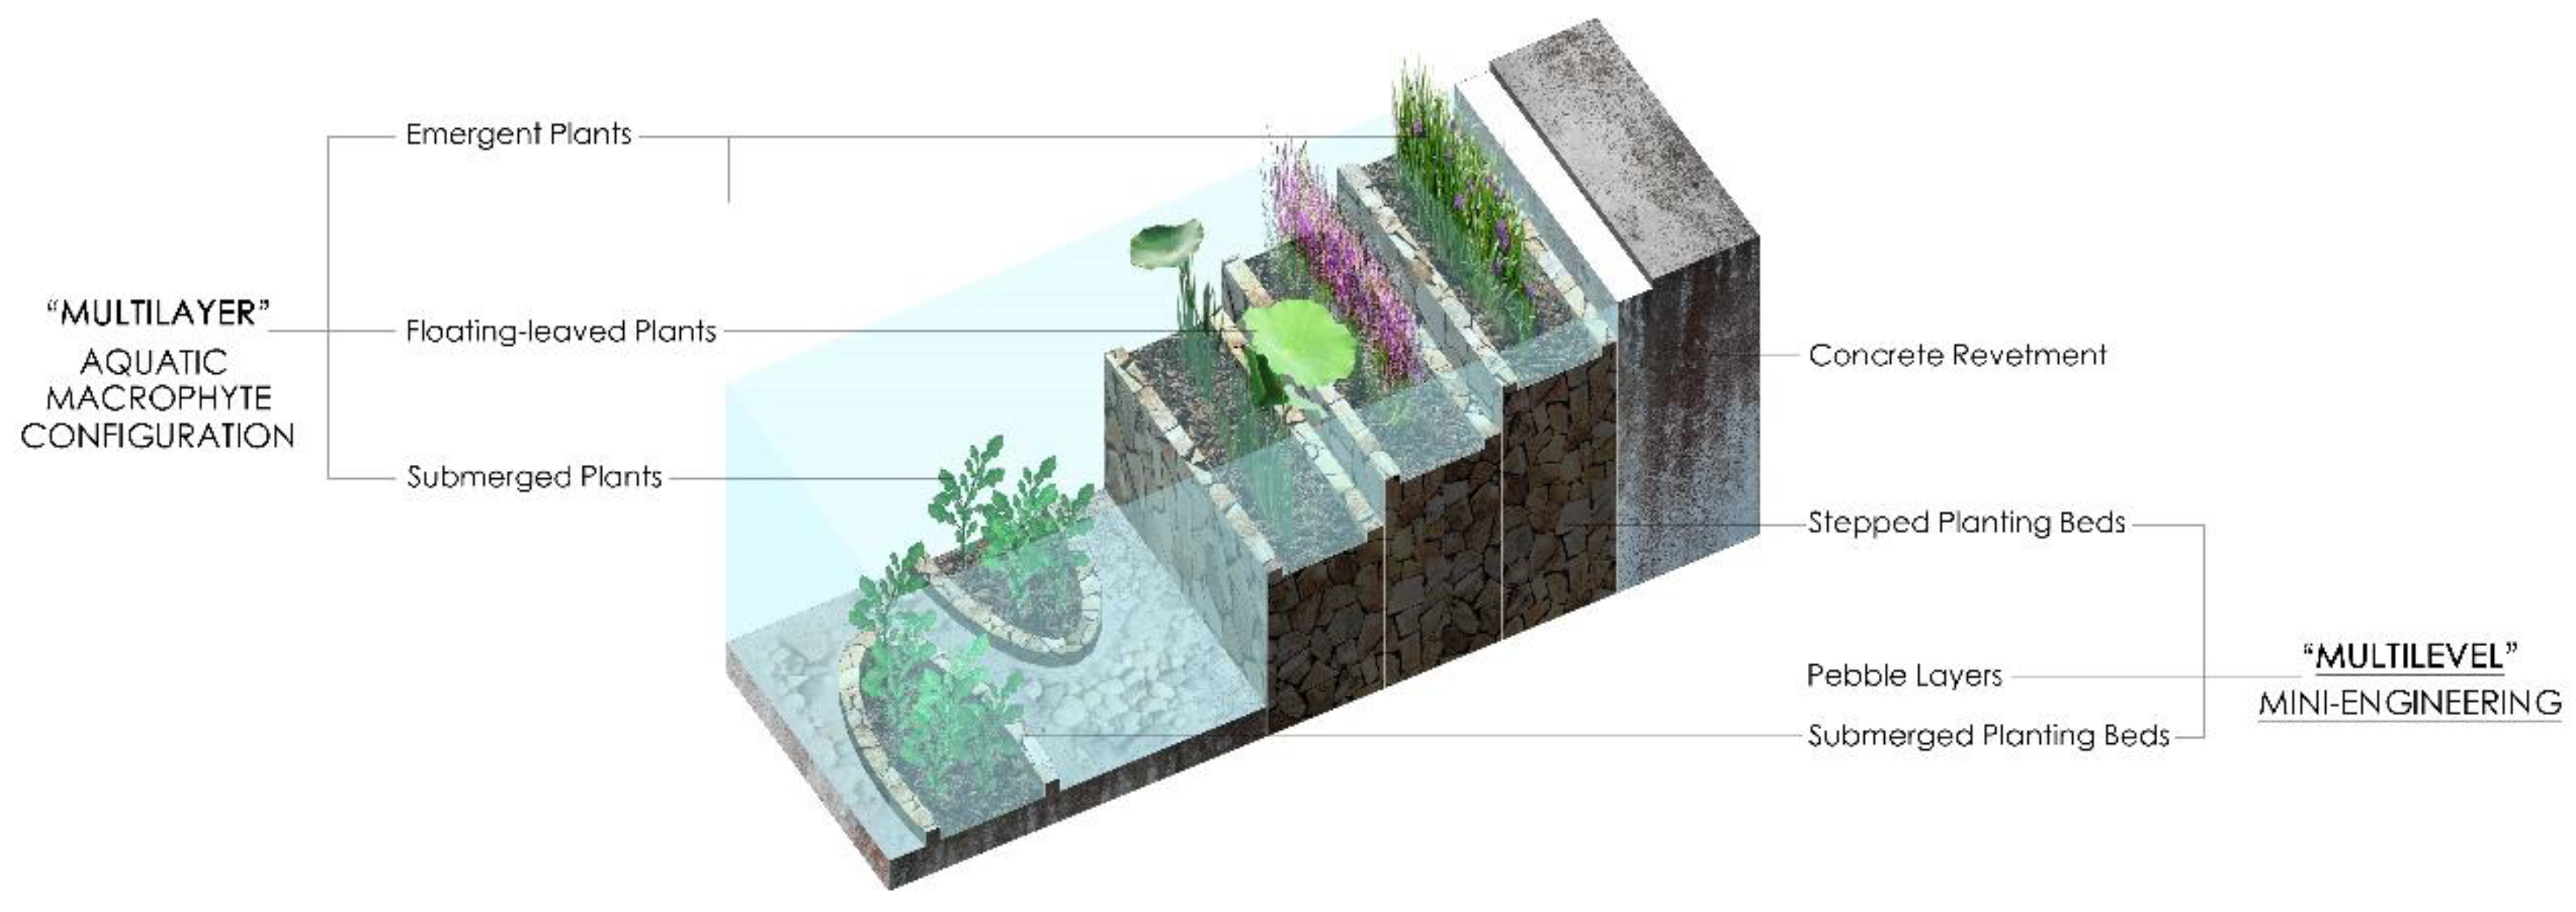
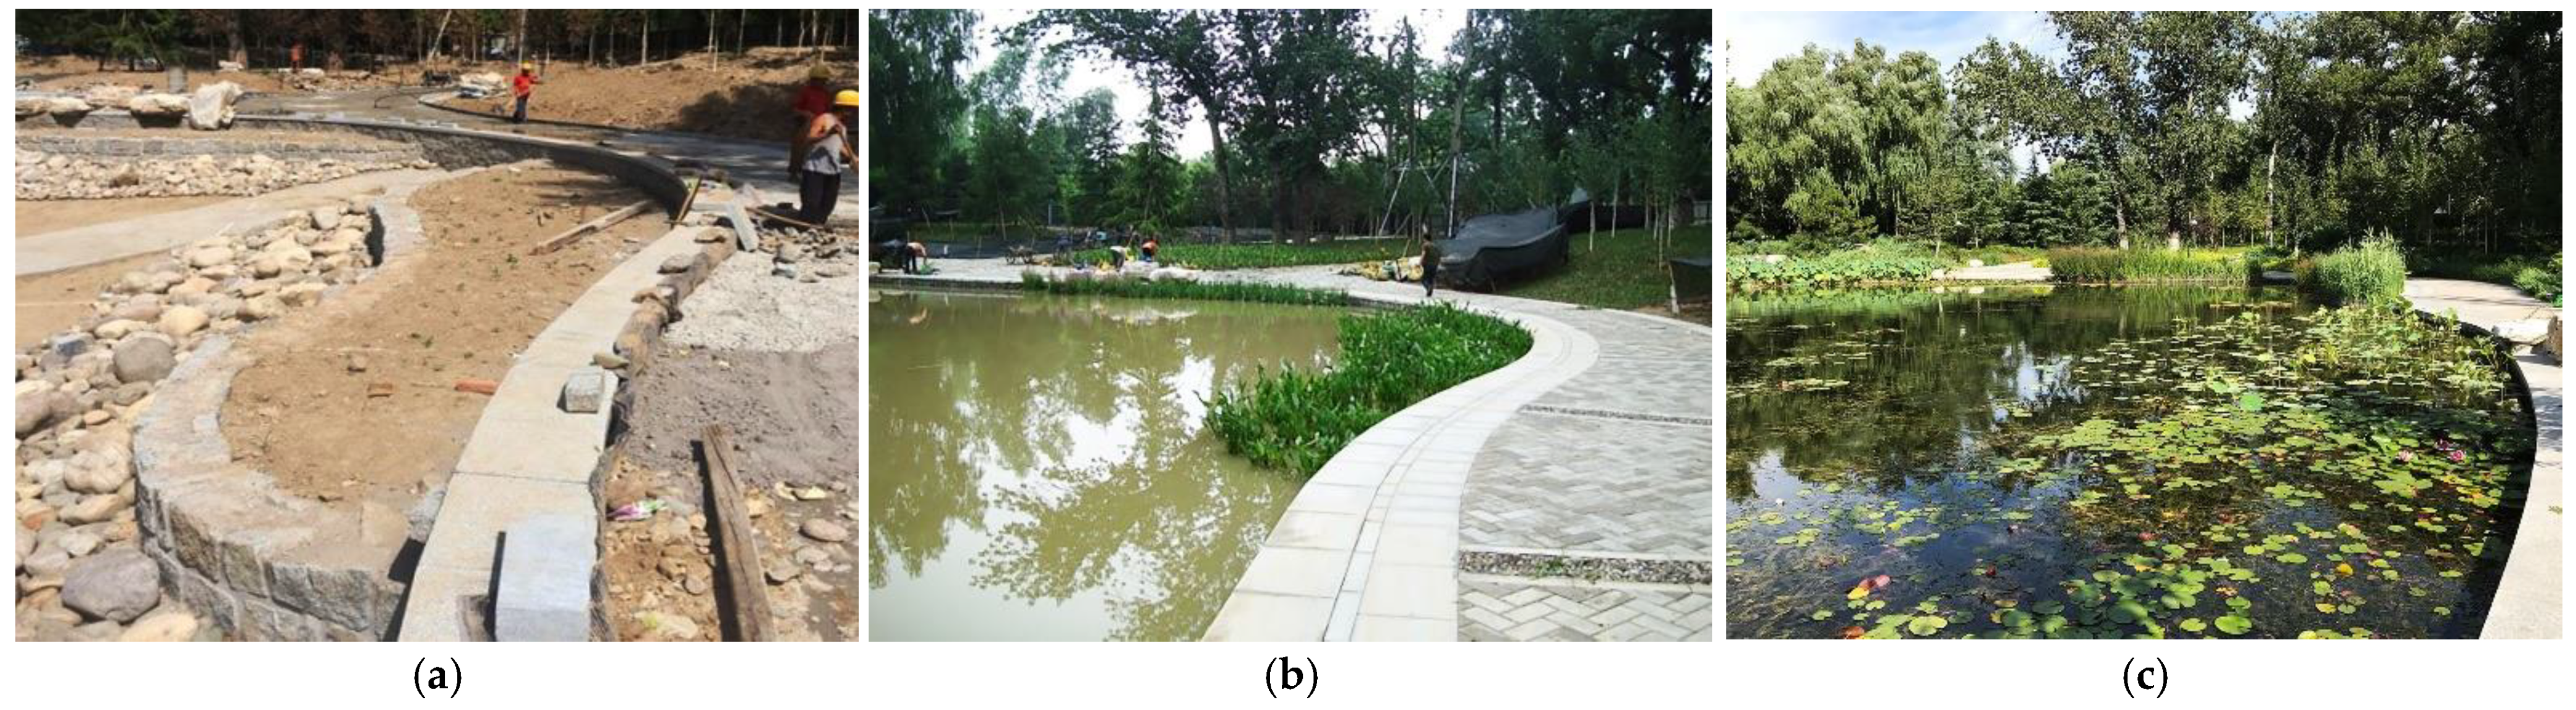
2.2.1. Ecological Remediation Design

In this study, ecological remediation included a mini-engineering design and an aquatic macrophyte configuration (Figure 2). The remediation principle is described as follows: Pond 1 was used for reference and had no reconstruction; comparative experiments were conducted in ponds 2, 3, and 4 with different reconstruction measures. The specific steps were as follows: The first step was the mini-engineering component. For the step, the hardened vertical revetments of ponds 2, 3, and 4 were replaced with three layers of “stepped” planting beds (10–30 cm depth), whereas the hardened lakebeds of ponds 3 and 4 were built with submerged plant beds (30–40 cm height). Additionally, some studies have shown that resuspension of sediment on the lakebed is one of the main reasons for eutrophication, particularly leading to excess phosphorus (P) in water bodies [32], and capping sediments with inert materials, such as sand or gravel, to create a physical barrier between organic-rich sediments and water bodies that can greatly reduce benthic sediment nutrient release [33]. Therefore, the lakebeds of ponds 1, 2, 3, and 4 were paved with layers of pebbles to weaken sediment overturning caused by water flow movement. The second step was the multilayer configuration of aquatic macrophytes. Three types of macrophytes were selected, namely, revetment floating-leaved plants, revetment emergent plants, and submerged plants at the lakebed (Table 2 and Table 3). The former two types were planted in the “stepped” planting beds of ponds 2, 3, and 4 at different water depths. Among them, six plant species were planted in ponds 2 and 4, and only three species were planted in pond 3. The total planting area accounted for approximately 35% to 40% of the water surface of each pond. Submerged plants were placed in the planting beds at the lakebeds of ponds 3 and 4 with the total planting area accounting for approximately 50% of the lakebed area of each pond. The reason for choosing these three types of aquatic macrophytes in this experiment lies in their respective functions. Floating-leaved plants and emergent plants can absorb nutrients, block impurities, and improve rhizosphere microflora to purify water [34]. Revetment emergent plants can block and filter the surface runoff of rainfall and irrigation to prevent water from nonpoint source pollution [35] (pp. 1–15). Submerged plants can increase dissolved oxygen in water, absorb nitrogen and phosphorus nutrients, block impurities in water, inhibit algal overgrowth [17,36,37], and prevent nitrogen, phosphorus salts, and organic deposits at the lakebeds from becoming resuspended and polluting the water body during water movement. Nelumbo nucifera was selected as the floating-leaved plant. Acorus calamus, Scirpus tabernaemontani, Arundo donax, Lythrum salicaria, and Thalia dealbata were selected as the emergent plants. Myriophyllum spicatum, Najas marina, and Najas minor were selected as the submerged plants. These macrophyte species were chosen for three main reasons: (1) they are the best growing native species in natural pond 5, indicating that they adapt to the local natural environment; (2) they have high ornamental value and are suitable for application in landscape design; (3) all of them exhibit water purification functions. To prevent interspecific competition, different species of macrophytes in each pond were planted in different planting beds and isolated from each other. The planting area, density, and depth of the macrophytes are presented in Table 4 and Table S1. The growth of macrophytes was limited to the planting bed, and aquatic plants were not planted outside the planting pond.
As a reference site, pond 1 was used to observe the changes in water quality and reproduction of algae without any engineering reconstruction or aquatic macrophyte planting. The values of the water quality indices at pond 0 were recorded to provide the condition of the water quality of the replenishment water source. Pond 5 was used as a comparative site because it was a natural pond with a high water clarity and healthy aquatic macrophyte communities. Without any reconstruction, the water qualities of ponds 0, 1, and 5 were recorded and compared with those of the other ponds where ecological remediation was implemented, aiming to test the water quality improvement effect of the ponds with different remediation measures.

2.2.2. Water Quality Indices and Their Measurements

According to studies on algae and Environmental Quality Standards for Surface Water (GB 3838-2002), water temperature, pH value, water transparency, total nitrogen (TN), total phosphorus (TP), chemical oxygen demand (COD), and chlorophyll a (Chl a) concentrations can be used as key indices to reflect water quality and quantity of algae [38,39,40,41,42,43]. Water temperature and pH values were used to measure whether the water environment was within the suitable range for algal growth, as water temperatures between 20 °C and 30 °C [38] and weakly alkaline environments are suitable for algal blooms [39]. TN and TP were used to measure the main nutrient loading in the water bodies, as water conditions are suitable for algal growth when the mass ratio of nitrogen to phosphorus (N/P) is approximately 16:1 [44,45] and below 29:1 [46,47], and algal blooms may occur when TN and TP values are higher than 0.5 mg/L and 0.02 mg/L, respectively [48]. COD was used to measure the content of organic matter in the water bodies. The Chl a concentration was used to explain the quantity of algae in the water bodies.
In addition, fluorescence spectroscopy is widely used in the study of dissolved organic matter in water and can reflect the concentration and type of organic matter according to the fluorescence intensity and wavelength [49,50]. The type of organic matter is mainly identified by the peak position of the fluorescence area that is formed by the superposition of the emission wavelength (EM) and the excitation wavelength (EX). The main objective of this method used in the experiment is to measure the allelochemicals of aquatic macrophytes in water bodies. Allelochemicals, such as small molecules of phenols with algal inhibitory functions [20,51], can lead to strong fluorescence in humic acid-like substance regions [52], with fluorescent areas generally near EX/EM = 255/410 nm [53].
Before collecting water samples, water transparency was measured using a Secchi disc with alternating black and white quadrants. The disc was placed horizontally into the water and gradually sunk just until the white of the disc could not be distinguished; at that point, the value, which represented the transparency of the pond, was read. After collecting water samples with a 1 L tube sampler, the water temperature was immediately measured at the sampling location. Specifically, the upper end of the thermometer was held, and the lower end of the thermometer was immersed in the water inside the sampler, avoiding contact between the thermometer and the bottom and wall of the sampler. The temperature was read at the moment when the liquid level of the thermometer no longer increased or decreased, and the thermometer was maintained inside the water while reading. Then, the water samples were sent to the laboratory to measure the above water quality index values. Lastly, the three-dimensional fluorescence spectra of the water samples were recorded to detect the allelochemicals of aquatic macrophytes.
The instrument models and operating standards used in the experiment were as follows: A Secchi disc with alternating black and white quadrants was used to measure the transparency of the water body, and an ordinary thermometer was used to measure the water temperature. The pH value was measured by a digital pH meter (PB-10, BSISL, China). The COD value was detected using a COD rapid digestion instrument (CTL-12, Chengde Hua tong Environmental Protection Apparatus Co., Chengde, China). Three operating standards were adopted in this experiment to measure the TN, TP and Chl a concentrations, namely, Water Quality Determination of Total Nitrogen–Alkaline Potassium Persulfate Digestion UV Spectrophotometric Method (HJ636-2012), Water Quality Determination of Total Phosphorus–Ammonium Molybdate Spectrophotometric Method (GB11893-89), and Water Quality Determination of Chlorophyll a Spectrophotometric Method (HJ897-2017), respectively. The three-dimensional excitation emission matrix fluorescence spectra (3DEEMFS) of dissolved fluorescent organic matter were recorded by a fluorescence spectrophotometer (F-7000, Hitachi Global Ltd., Tokyo, Japan) to measure both the EM and the EX from 200 nm to 700 nm, and the data were visualized using the database program SigmaPlot 12.5 (Systat Software Inc., San Jose, CA, USA). Water transparency, water temperature, and Chl a were measured in cm, °C, and ug/L, respectively. TN, TP, and COD were all measured in mg/L. The values of water transparency, water temperature, and the other indices were accurate to the integer, one digit after the decimal point, and two digits after the decimal point, respectively.

2.2.3. Statistical Analyses

Regarding the values of the water quality indices, because ponds 1, 2, 3, 4, and 5 received replenishment water from pond 0 every month and the water quality of pond 0 varied every year, consequential changes in the replenishment water quality, which affected the values of the water quality indices at each pond that had been replenished, were noted. Thus, the water quality values at each pond differed in different years. Therefore, a new indicator, RAR (an abbreviation for “ratio”, “assessed”, “reference”), was added to compare the values of the water quality indices (TN, TP, COD, and Chl a) among the different remediated ponds and the reference pond (pond 1), as well as the changes in RAR values between different years, to test the effect of different ecological remediation measures. The RAR represents the ratio of the index value at the different remediated assessed ponds to that of the reference pond in the same period of the current year. The RAR value was greater than 0. The closer the value was to 1, the closer the water quality parameter was to that of the untreated reference pond (pond 1). The smaller the value, the better the water quality index was compared to the reference pond (pond 1), indicating that ecological remediation was successful. From March in the first experimental year to October in the third experimental year, there were 24 months of RAR values for each water quality index at each pond (21 months for each water quality index at pond 4; 23 months for Chl a at pond 2).
Furthermore, given that the depth of each pond was different, the water transparency values of the different ponds could not be properly compared. The impact of ecological remediation on water transparency could be analyzed by comparing the variation in water transparency for the same pond in different experimental years. Therefore, an RAF value (the ratio of the assessed water transparency to that of the same period in the first experimental year) was added to test the improvement in water transparency, with a larger RAF value indicating a greater improvement in water transparency.
Statistical analyses of the improvement in water quality were performed using the SPSS 26.0 statistical program (IBM, Armonk, NY, USA). A bar chart was used to represent the RAR values of the water quality indices of each pond in different months. After excluding extreme values with boxplots (Table A3 and Figure A1), the RAR values of each index (TN, TP, COD, and Chl a) and the values of water transparency at the different ponds were analyzed by simple linear regression (the ordinal number of the months in the experiment was set as the x-axis, and the RAR value or water transparency value at each pond was set as the y-axis). Regression coefficients were used to indicate the variation trend of the RAR value over time. Statistical significance was set at a p-value < 0.05, and marginal significance was set at a p-value between 0.05 and 0.1. Linear regression models of the RAR values and the values of the water transparency were plotted using GraphPad Prism 9.3.1 software (GraphPad Software Inc., San Diego, CA, USA).
In addition, because the aquatic plants exhibited different growth states in different seasons, the effects of ecological remediation varied among different seasons. Therefore, the average values of the water quality indices in spring (from March to May), summer (from June to August), and autumn (from September to November) at each pond in each experimental year were determined. The RAR of the average value in each season was calculated, and the effectiveness of different ecological remediation designs in different seasons was verified by comparing the RAR value in each quarter between different experimental years. Furthermore, the variations in the values of the water quality indices before and after ecological remediation could also be compared using these statistics.

3. Results and Discussion

3.1. The Quantity of Macrophytes, Water Temperature, and pH Value

First, the growth of aquatic plants was directly related to the effectiveness of the results in the experiment. Given that both the revetments and lakebeds of the ponds were hardened, almost no aquatic macrophytes were found outside the planting beds on the revetments and lakebeds in the experimental process. Therefore, the quantities of aquatic macrophytes in the planting beds were counted. According to Table 4, most of the emergent plants in each pond grew well after being planted in the second experimental year, and their quantity gradually increased. The growth status of emergent plants in each pond was generally similar, and that at pond 4 was slightly better than that at ponds 2 and 3, especially in the second experimental year. However, submerged plants showed different growth states compared with emergent plants. In the second experimental year, the quantity of submerged plants did not increase significantly after being planted. These findings indicated that reproduction of the submerged plants was limited, and the reproduction limitation was more obvious at pond 4 than at pond 3, potentially because the transparency of the pond water did not reach the most suitable condition for submerged plant growth by the second experimental year. For instance, the quantity of N. marina in pond 4 even decreased that year. Nonetheless, this status was improved in the third experimental year with the further increase in the water transparency of the ponds, and the quantity of submerged plants in ponds 3 and 4 increased significantly. The growth state of submerged plants in pond 3 was slightly better than that in pond 4, which may have been due to the better light conditions for the growth of submerged plants in pond 3 due to its depth.
Therefore, the aquatic macrophytes in each remediated pond grew well and persisted until autumn of the second and third experimental years without significant reductions or extinctions, which was the basis of the result analyses of this ecological remediation and made the entire experiment possible.
The vigorous period of algal reproduction was from May to September every year, during which the water temperatures of the ponds in this experiment were mostly between 20 °C and 30 °C and the pH values were weakly alkaline (Supplementary Materials: Figures S1 and S2), representing favorable conditions for algal blooms. These background conditions were the common basis for our comparative experiments on algal bloom inhibition.

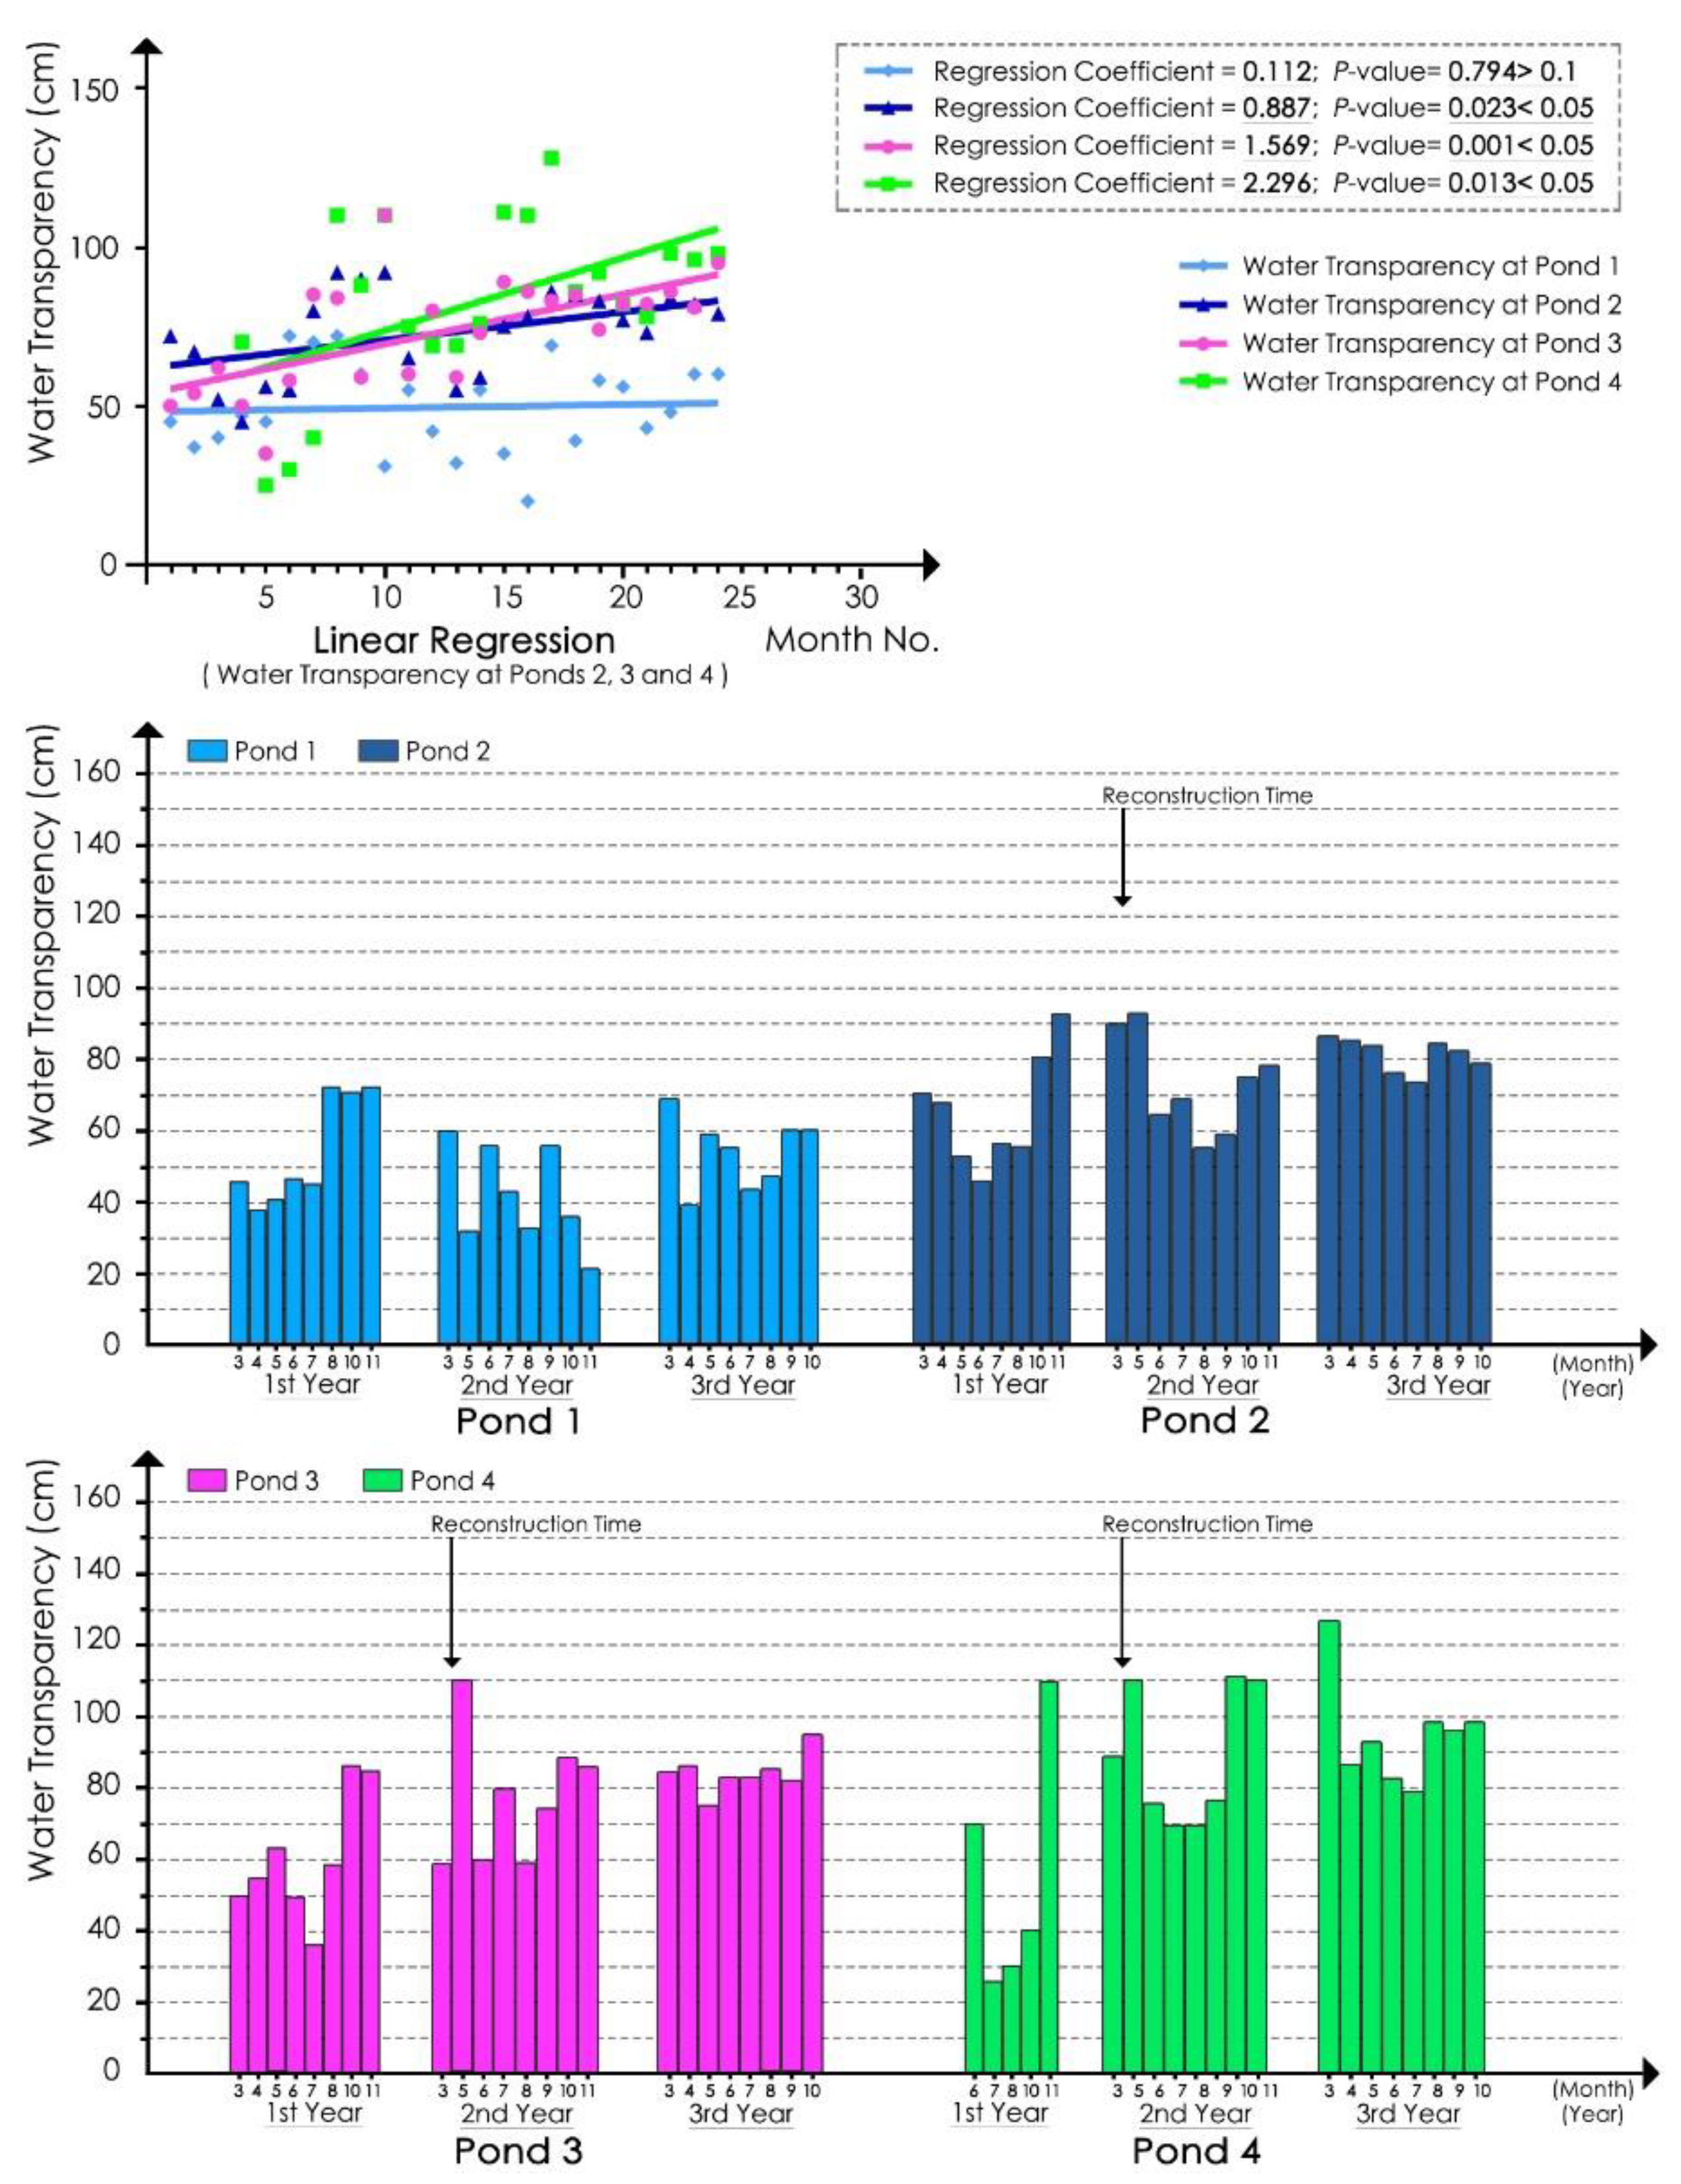
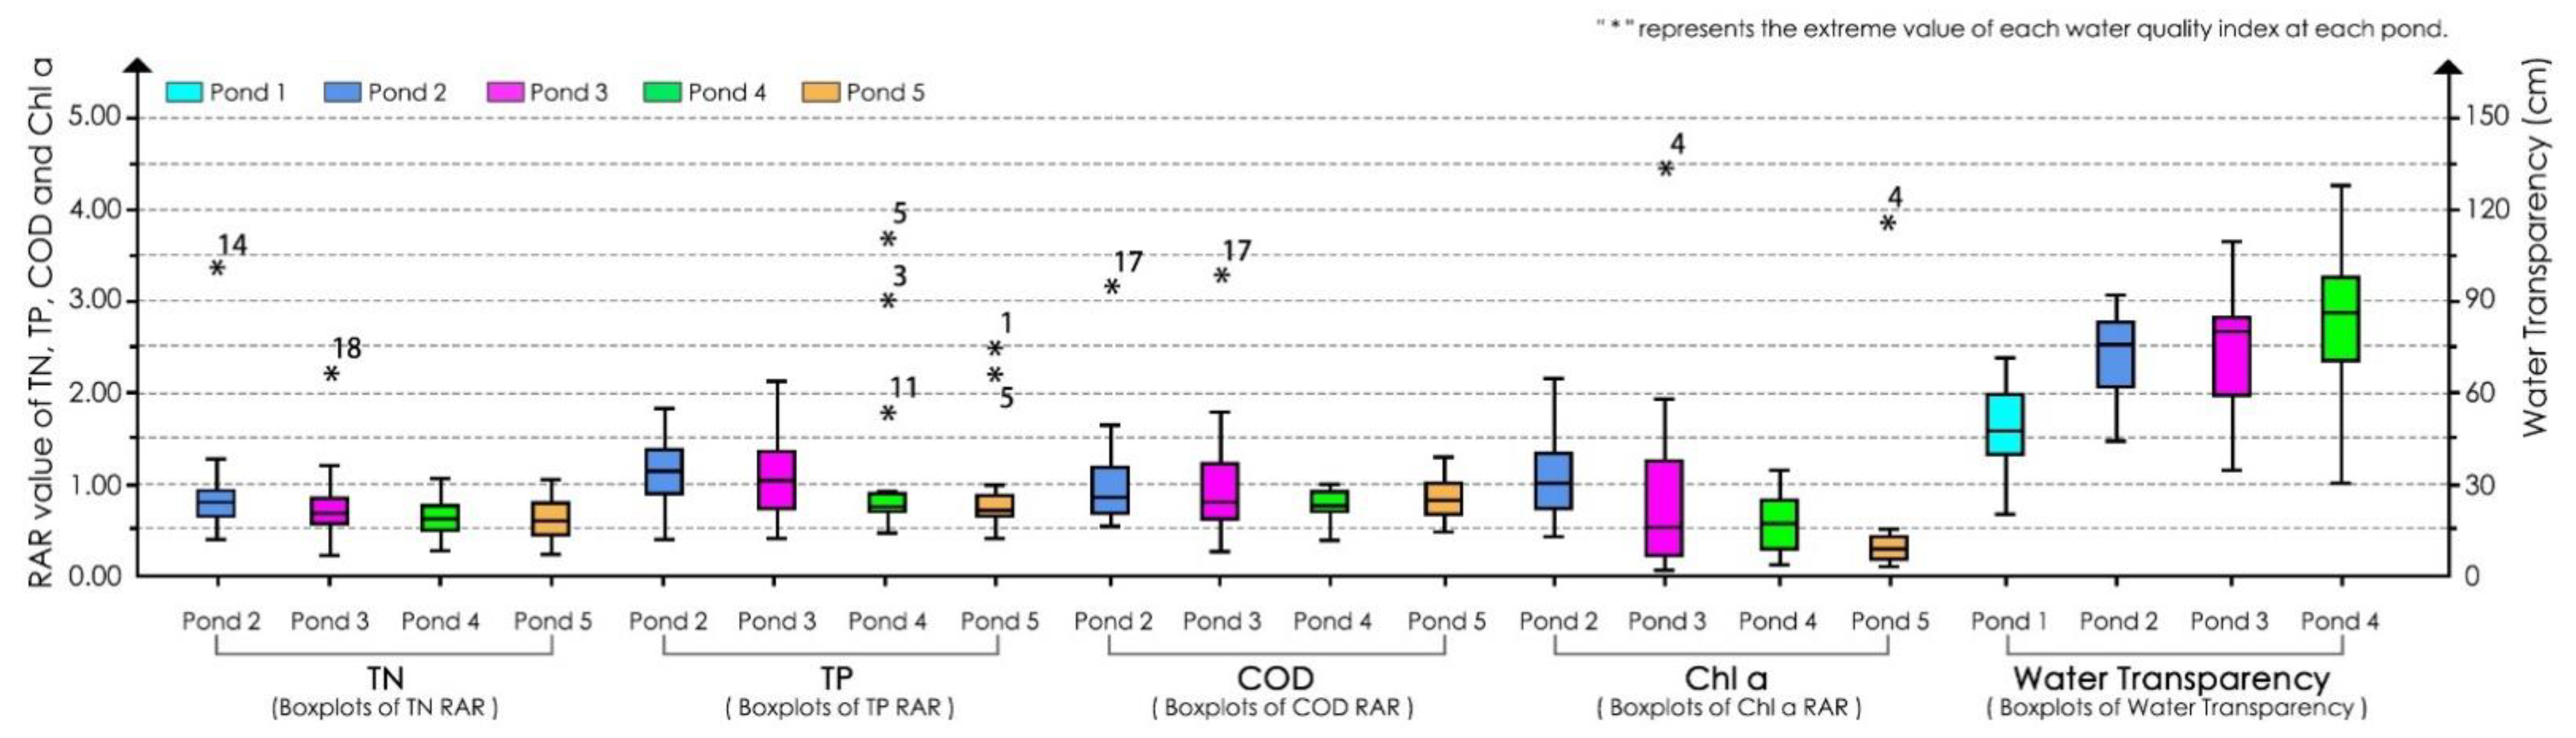
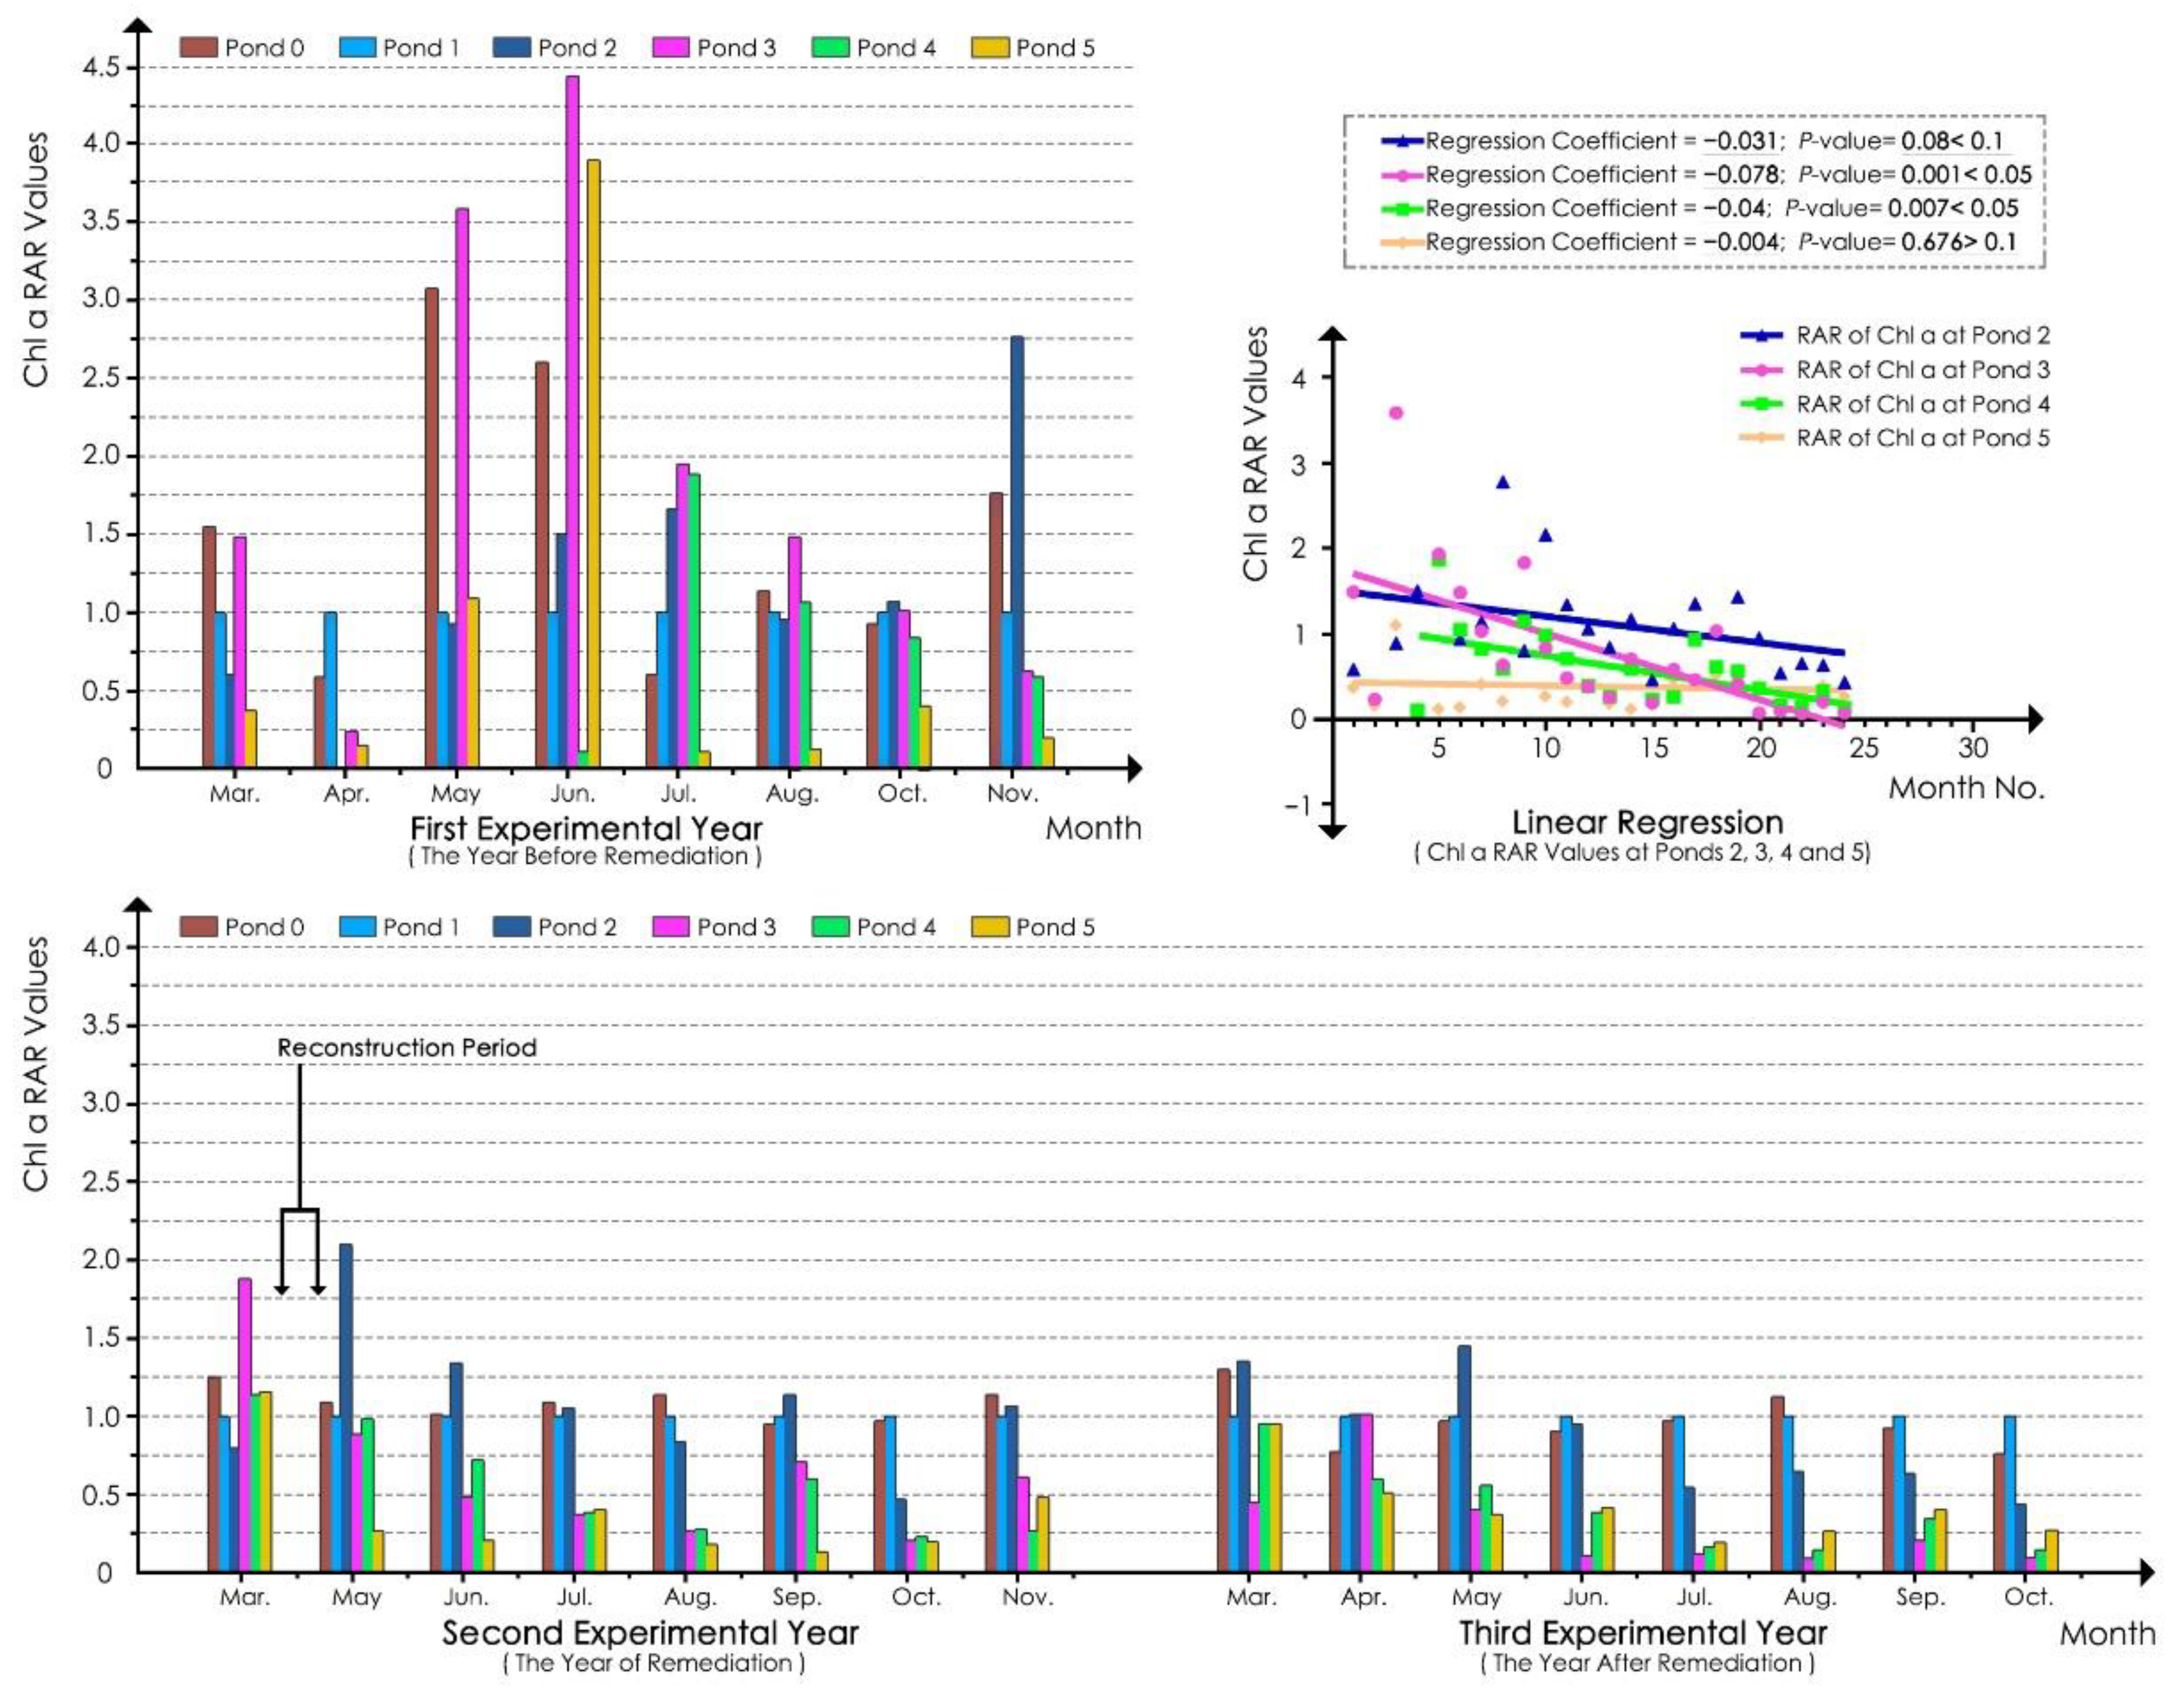
3.2. Water Transparency and Chl a Concentration

The monitoring results of water transparency and Chl a concentration showed that ecological remediation improved the water transparency, reduced the Chl a value, and inhibited algal growth (Figure 3 and Figure 4).
According to linear regression analyses of the water transparency values of samples at each pond for the whole experimental process (Figure 3), the regression coefficients of the pond 2, 3, and 4 models were 0.887, 1.569, and 2.296, respectively, and the p-values were all less than 0.05. These results indicated that the water transparency of ponds 2, 3, and 4 was significantly improved. In addition, the improvement effects in ponds 3 and 4 were much better than that in pond 2, and that in pond 4 was better than that in pond 3. In contrast, the regression coefficient of the pond 1 model was 0.112, and its p-value was 0.794, indicating that its water transparency did not significantly increase or decrease during the experimental period.
According to the bar chart in Figure 3, the water transparency of the reference pond (pond 1) remained low throughout the entire experimental process. The values were slightly higher in the spring of the second experimental year, whereas they were much lower in the summer and autumn than those in the summer and autumn of the first experimental year. In the third experimental year, the water transparency of pond 1 increased compared with that in the second experimental year, especially in spring, whereas the values in summer and autumn were still lower than those in the first experimental year. These results showed that, without any remediation measures, the water transparency fluctuated from year to year, remaining at a relatively low value, especially in summer and autumn. Before ecological remediation, the water transparency of each remediated pond was lowest in summer and increased gradually in autumn. After ecological remediation, the water transparency of the ponds that were remediated gradually improved in summer. The transparency of ponds 2, 3, and 4 increased by 23 to 68 cm in summer of the third experimental year compared to the transparency in the first experimental year, especially at pond 4, in which the transparency values in July and August increased by 53 cm and 68 cm, respectively. In terms of the RAF values of the quarterly average water transparency (Table 5), the improvement in the water transparency of ponds 2, 3, and 4 in spring and summer was better than that in autumn, especially in the summer of the third experimental year. In addition, the RAF values at pond 4 in summer and autumn were higher than those at pond 3 in the third experimental year, and the RAF values at pond 3 were higher than those at pond 2. These findings revealed that pond 4 was more improved than pond 3 and much more improved than pond 2, which was consistent with the results of the regression coefficient. In addition, in terms of the RAF values in the second and third experimental years, the water transparency improvement effect was much better in spring and summer than in autumn.
According to linear regression analyses of Chl a RAR values of the water samples of each pond in the whole experimental process (Figure 4), the regression coefficients for pond 2, 3, and 4 models were −0.031, −0.078, and −0.04, respectively. The p-values for ponds 3 and 4 were less than 0.05, whereas the p-value for pond 2 was between 0.05 and 0.1, indicating that the Chl a values of ponds 3 and 4 were significantly decreased during the experimental period and that the reduction at pond 2 was marginally significant. According to the regression coefficients and scatterplot, the decline effect at pond 3 was better than that at pond 4. For the natural pond (pond 5) model, the regression coefficient was −0.004, and the p-value was 0.676, which was greater than 0.1. These findings indicated that the Chl a value at pond 5 did not significantly decrease or increase in the experimental process.
According to the bar chart in Figure 4, before ecological remediation, the Chl a RAR values at ponds 2, 3, and 4 were generally higher in summer compared with spring and autumn. As shown in Table 6, in the first experimental year, the RAR values at ponds 3 and 4 were greater than 1.00 in summer (pond 3 was also higher in spring) and were less than but close to 1.00 in autumn. The value of pond 2 was less than 1.00 in spring, but higher than 1.00 in summer and autumn. These results indicated that ponds 2, 3, and 4 generally had Chl a values that were greater than or close to those found in pond 1 most of the time. After ecological remediation, the high values in summer declined gradually at ponds 2, 3, and 4. In the second experimental year, the RAR values at ponds 2, 3, and 4 were less than 1.00 except in spring, and the values at ponds 3 and 4 were similar and much lower than those at pond 2. In the third experimental year, the variation trend of the RAR values in the second experimental year was extended. The RAR values at ponds 2, 3, and 4 decreased further, and those at ponds 3 and 4 were more significantly reduced. For instance, the RAR values at ponds 3 and 4 were only approximately one-ninth to one-fourth of that at pond 2 in summer and only approximately one-quarter to one-half of that in autumn. Furthermore, the RAR values at ponds 3 and 4 were much lower than 1.00 in spring and were generally lower than those in the second experimental year. Although the RAR value at pond 2 decreased in spring compared with that in the second experimental year, it was still greater than 1.00. This result revealed that the Chl a values at ponds 2, 3, and 4 largely decreased and were much lower than those at reference pond 1 (except for the value at pond 2 in spring) in the third experimental year, and the values at ponds 3 and 4 were generally less than those at pond 2. In addition, the values at pond 3 were less than those at pond 4, particularly in summer and autumn, when the values at pond 3 were only approximately half of those at pond 4. The results showed that the effect of Chl a reduction at ponds 3 and 4 was much better than that at pond 2 and that the effect at pond 3 was better than that at pond 4. Although pond 2 had a Chl a reduction effect in summer and autumn, it was not obvious in spring. In general, after remediation, the effect of Chl a reduction in summer and autumn was better than that in spring. Regarding the trend of high values in summer, according to the bar chart in Figure 4, although the values at pond 2 declined after ecological remediation, the summer values were still much higher than those at ponds 3 and 4. In contrast, the values at ponds 3 and 4 remained very low in summer, and the high value trend in summer was greatly alleviated in the third experimental year.
According to Table 6 and the bar chart in Figure 4, the Chl a RAR values at pond 5 remained very low for most of the months in the 3 years of the experimental period, and the values were relatively stable compared with those at ponds 2, 3, and 4 with approximate values of 0.5 in spring, 0.2 in summer, and 0.3 in autumn (except in autumn of the second experimental year). Although the values at ponds 3 and 4 were higher than those at pond 5 in the first and second experimental years, they were close to those at pond 5 in the third experimental year, and even lower than those at pond 5 in summer and autumn. These results indicated an obvious algal inhibition effect of ecological remediation at ponds 3 and 4.
According to the above results of the water transparency and Chl a concentration tests, the water transparency increased, and the quantity of algae was reduced significantly after ecological remediation. On the one hand, according to the data analyses of water transparency, the improvement effect of the ecological remediation design on the water transparency of the ponds was better in spring and summer compared with autumn. The end of spring to summer is the suitable time period for algal growth in northern China, indicating that the remediated ponds maintained a relatively high water transparency in the period that was prone to algal blooms. Furthermore, the improvement in pond 4 was better than that in pond 3, which may have been due to the presence of more species of floating-leaved and emergent plants in pond 3 than in pond 4, thus better inhibiting algal overproduction. Moreover, the improvement in ponds 3 and 4 was better than that in pond 2. On the other hand, regarding Chl a data analysis, the Chl a concentration at ponds 3 and 4 decreased significantly in all three seasons, especially in summer, when the Chl a concentration was even lower than that at the natural pond (pond 5). Although the values at pond 2 declined in summer and autumn, they were still much greater than those at ponds 3 and 4, and the values increased in spring. Therefore, this result revealed that ecological remediation effectively inhibited the overproduction of algae (Table A1 and Table A2). Additionally, the algal inhibition effect in ponds with submerged plants was much better than that in ponds without submerged plants and even slightly better than that at the natural pond (pond 5) in summer and autumn. This result is consistent with Scheffer’s research conclusion on the relationship between the growth of aquatic macrophytes and water clarity [21]. In addition, the Chl a RAR values at pond 3 were generally lower than those at pond 4 after remediation, indicating that the quantity of algae in pond 3 was less than that in pond 4. Therefore, compared with pond 3, the better improvement in water transparency at pond 4 may be because pond 4 was slightly deeper than pond 3, and its initial water transparency in the first experimental year was lower than that in pond 3 most of the time. A relatively high water transparency and a low algal content are important visual principles of waterscape design in urban parks that can enhance people’s enjoyment of the parks. The test results of water transparency and Chl a showed that ecological remediation generally improved the visual effect of the waterscape in this study.

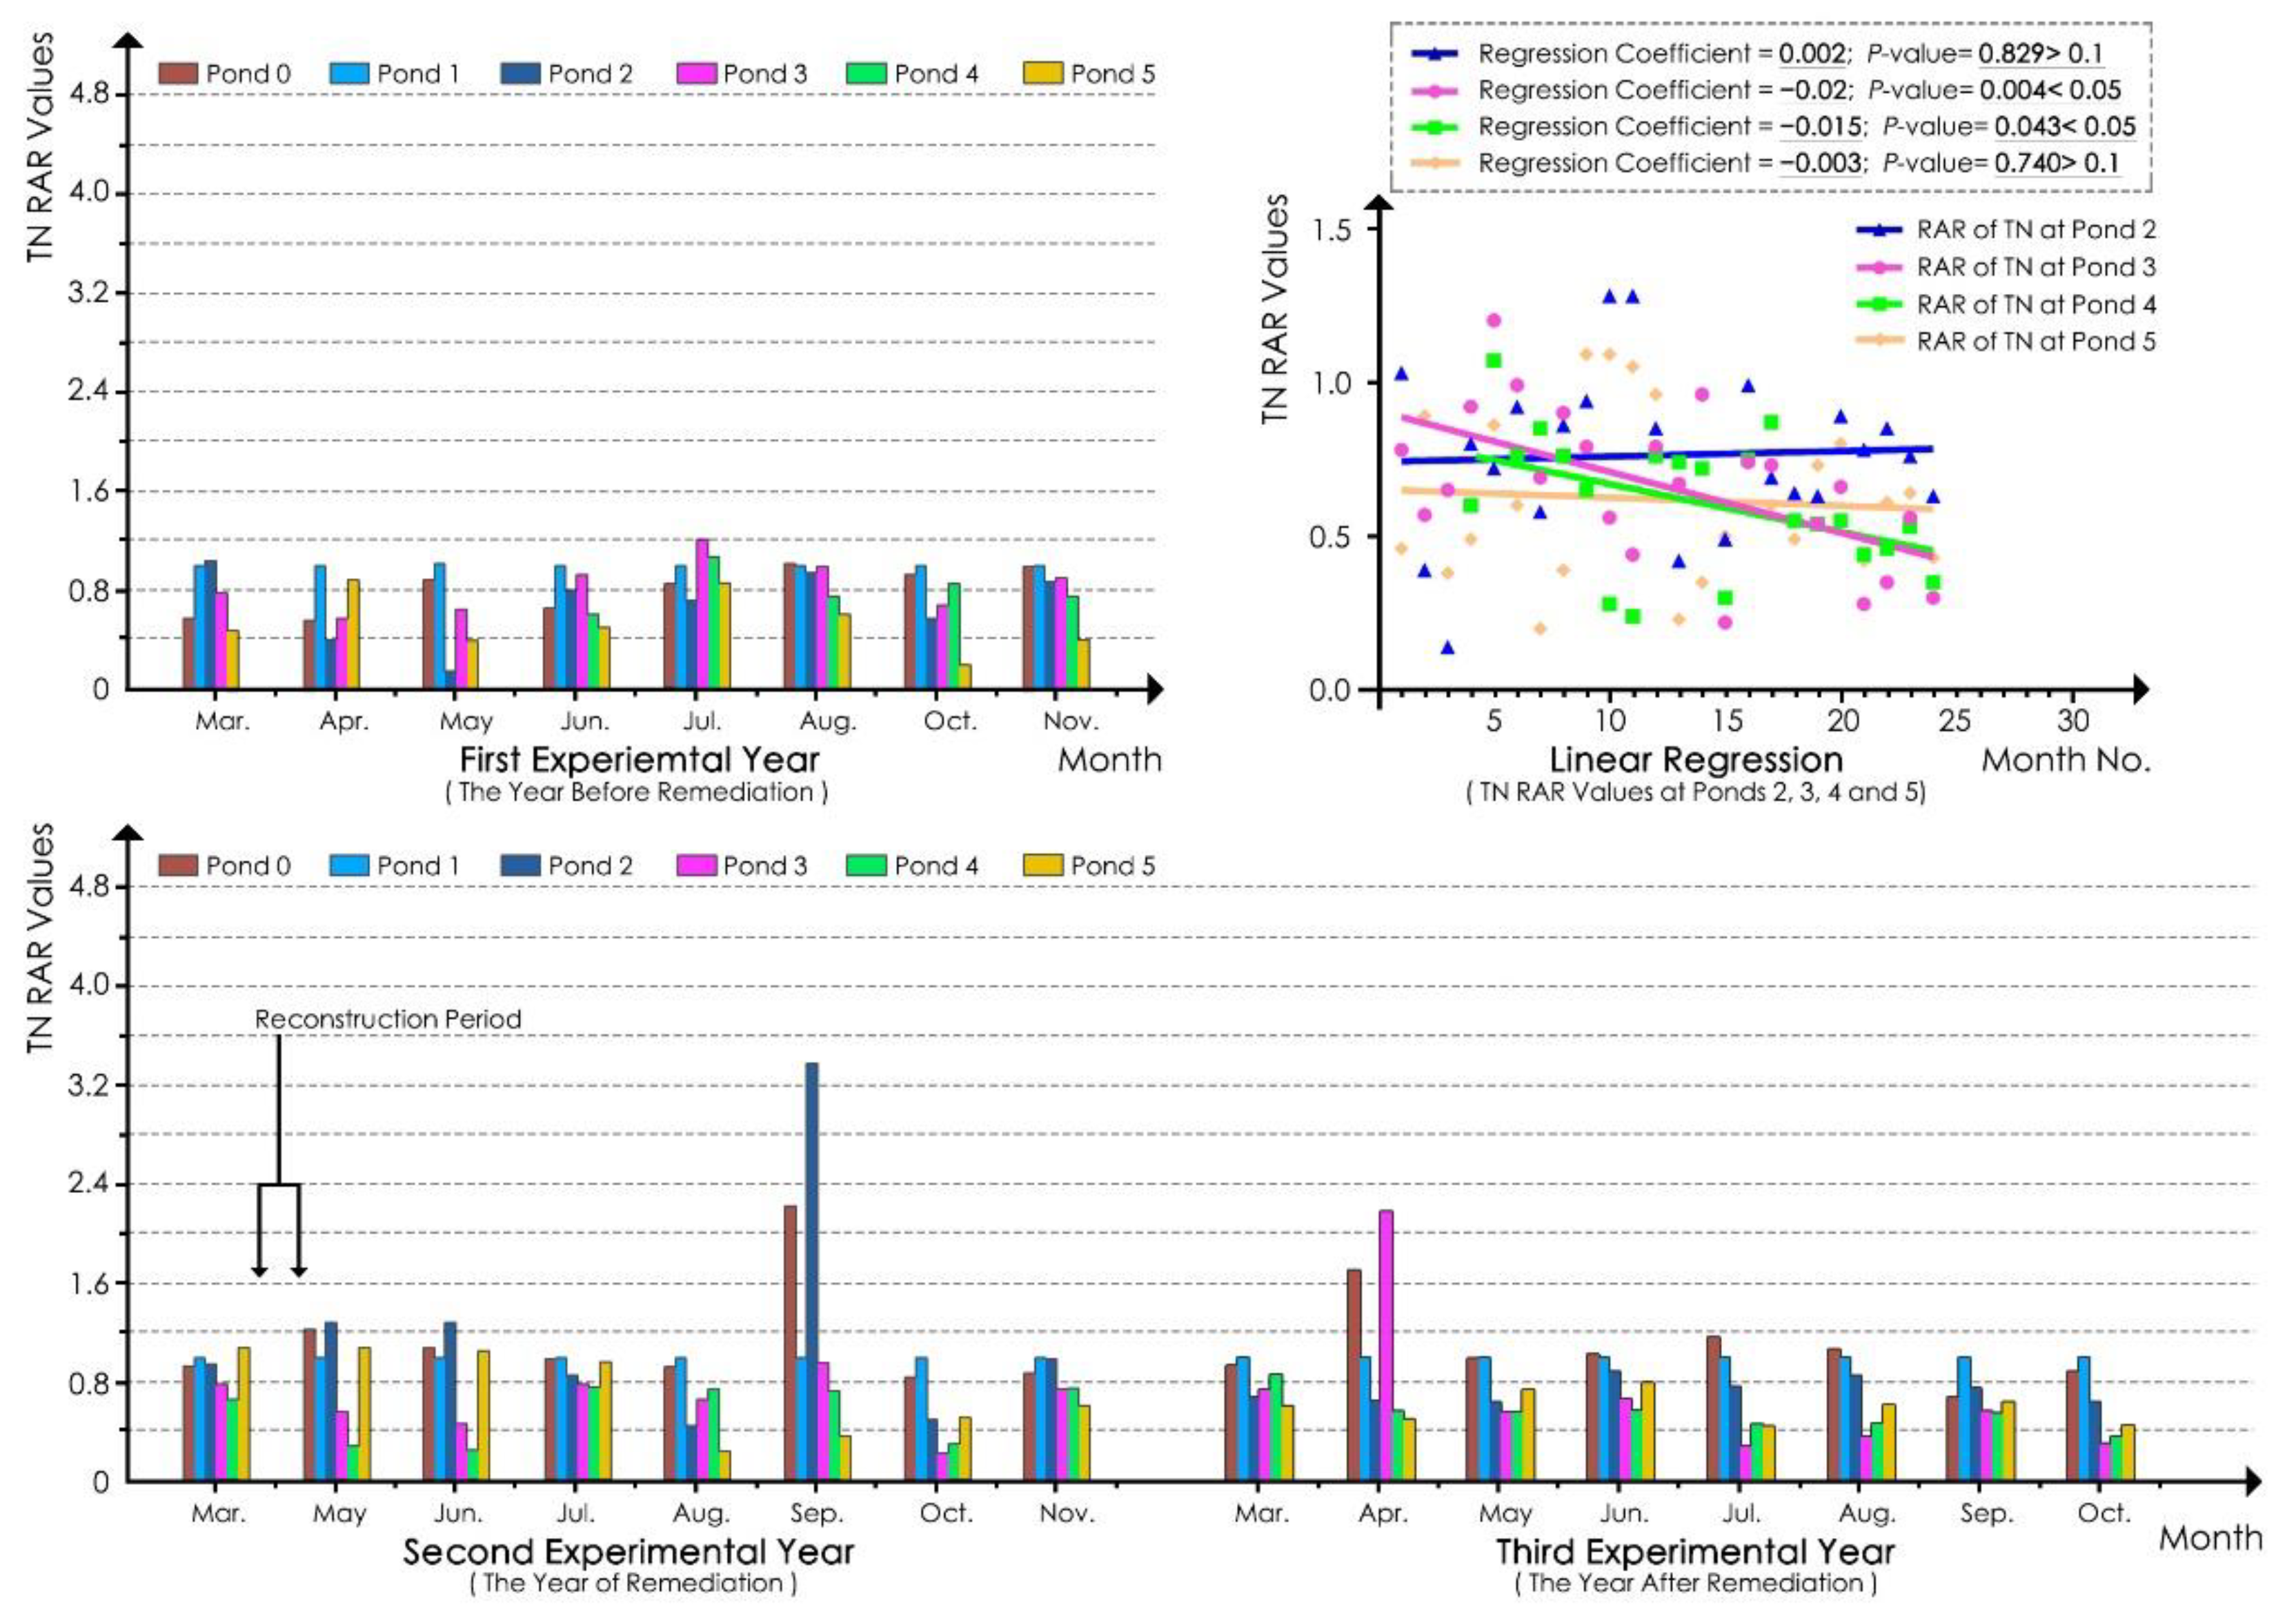
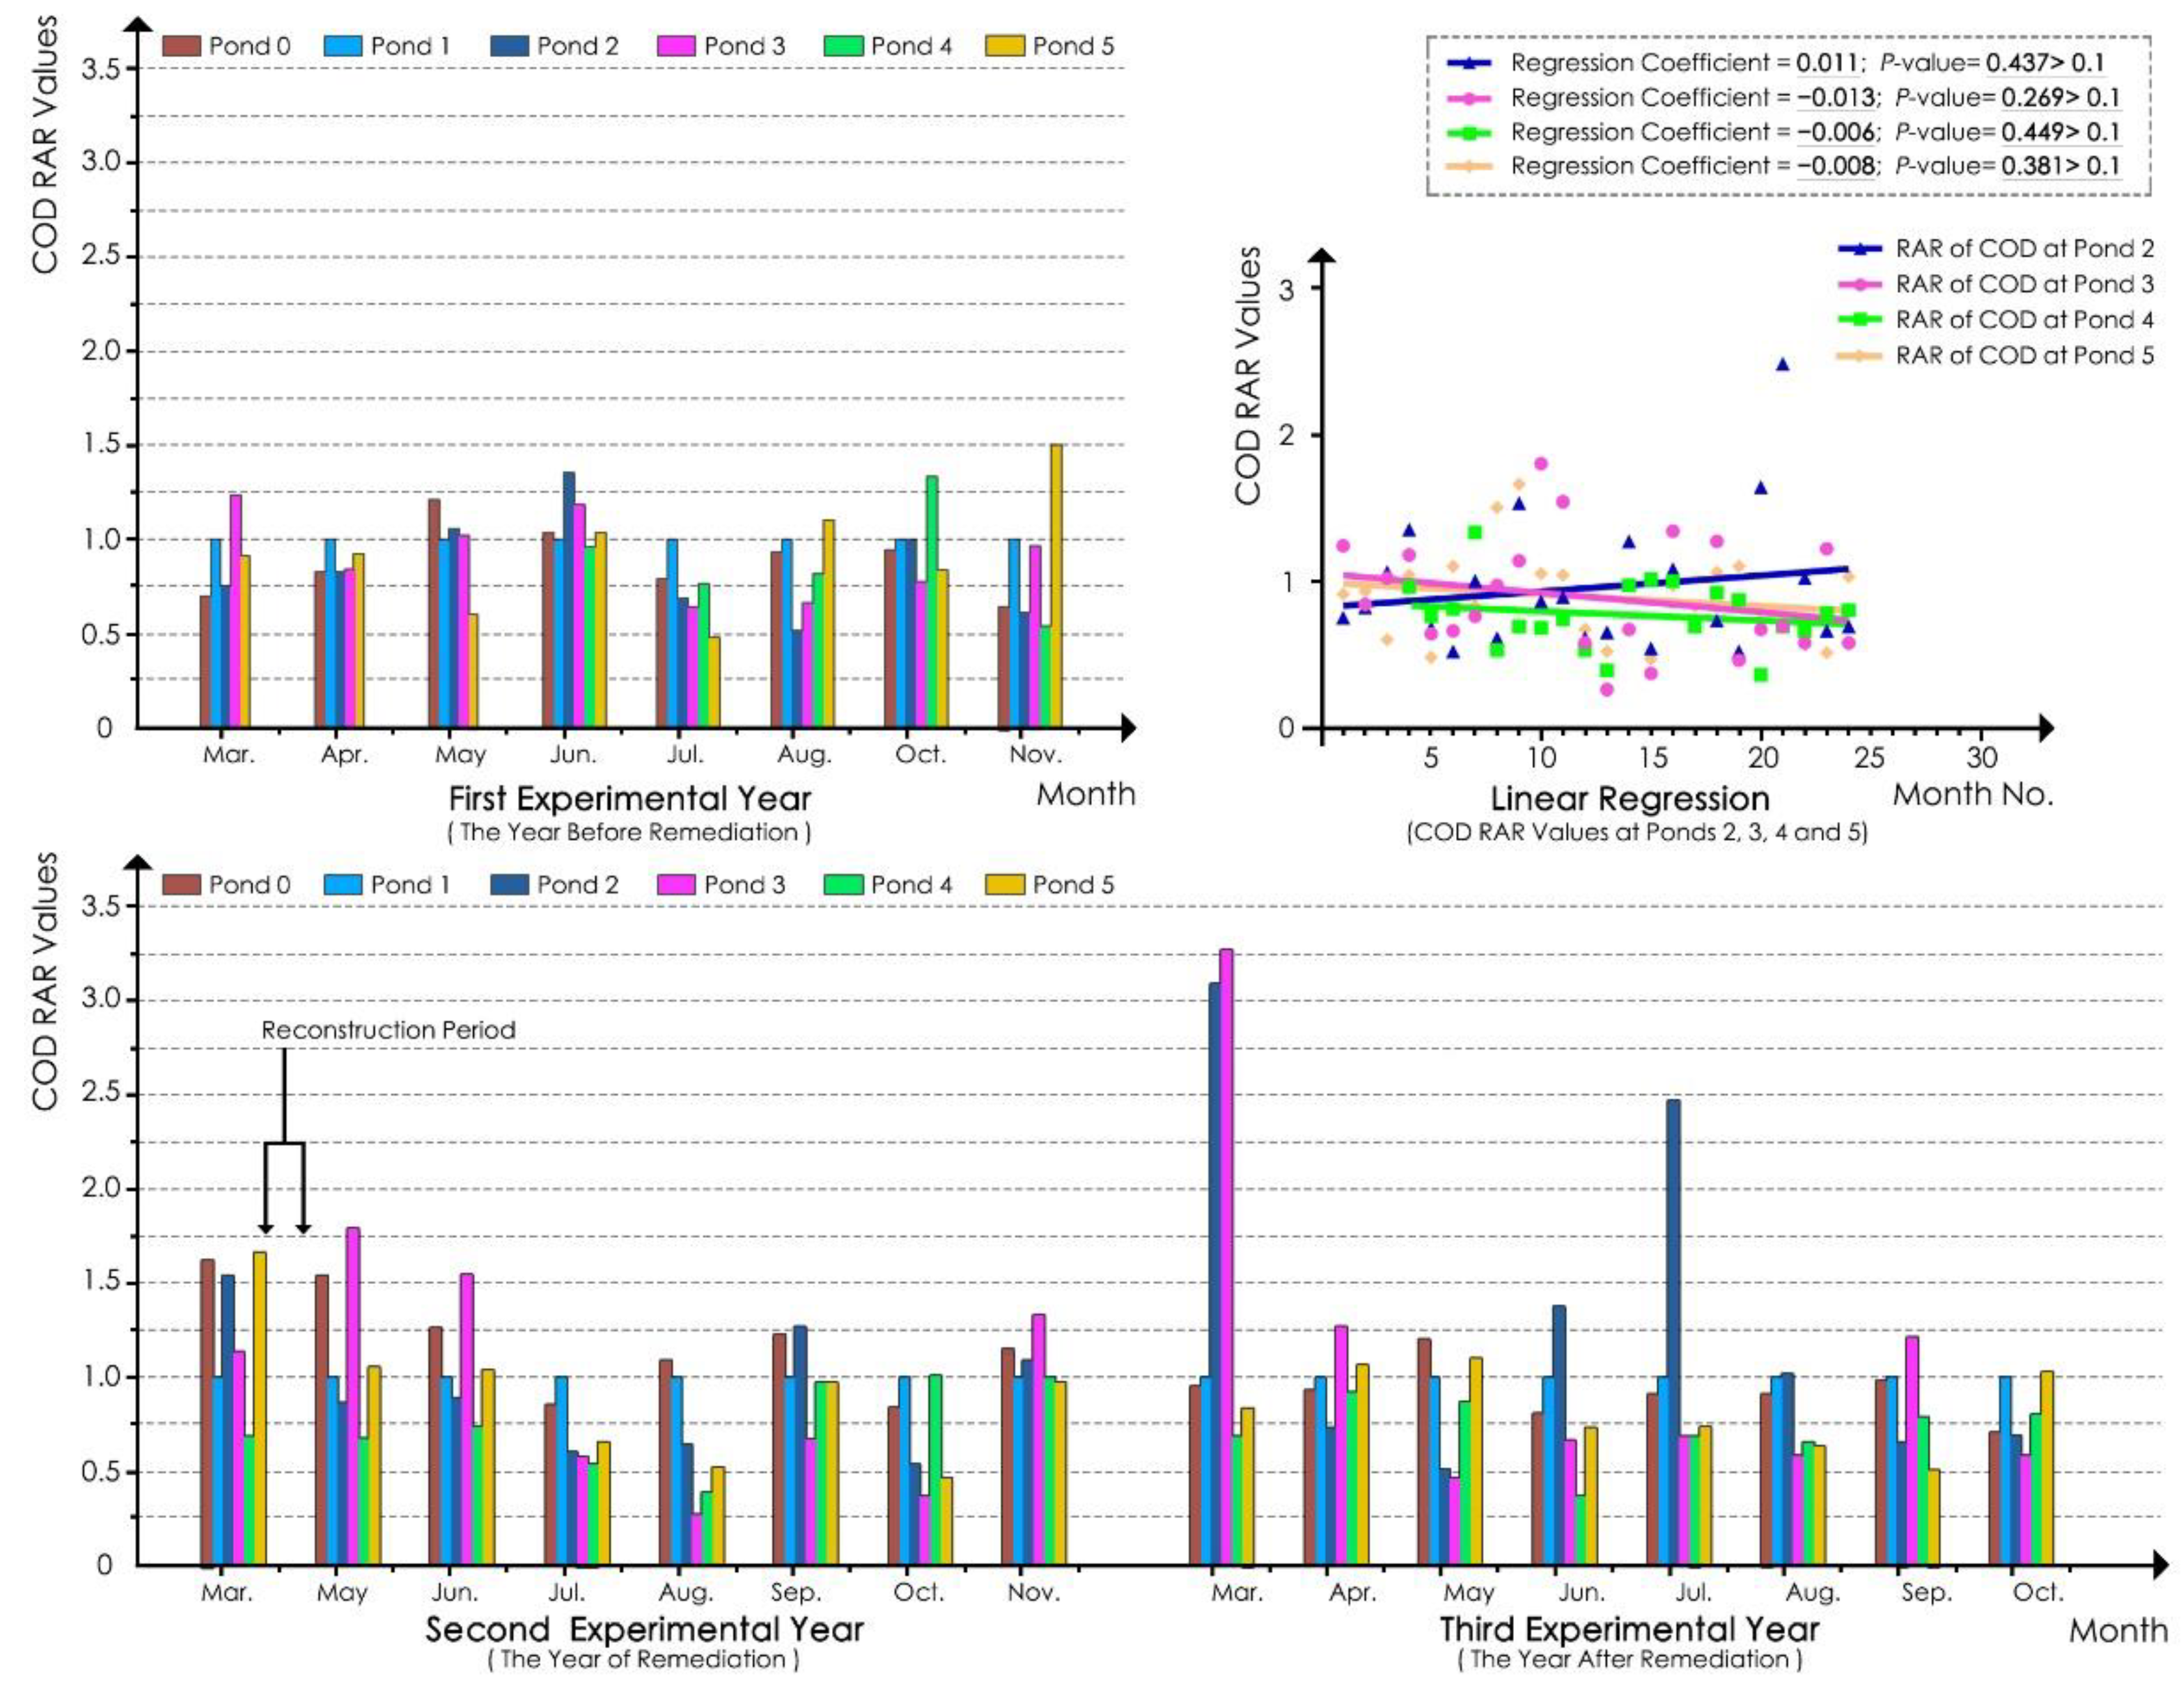
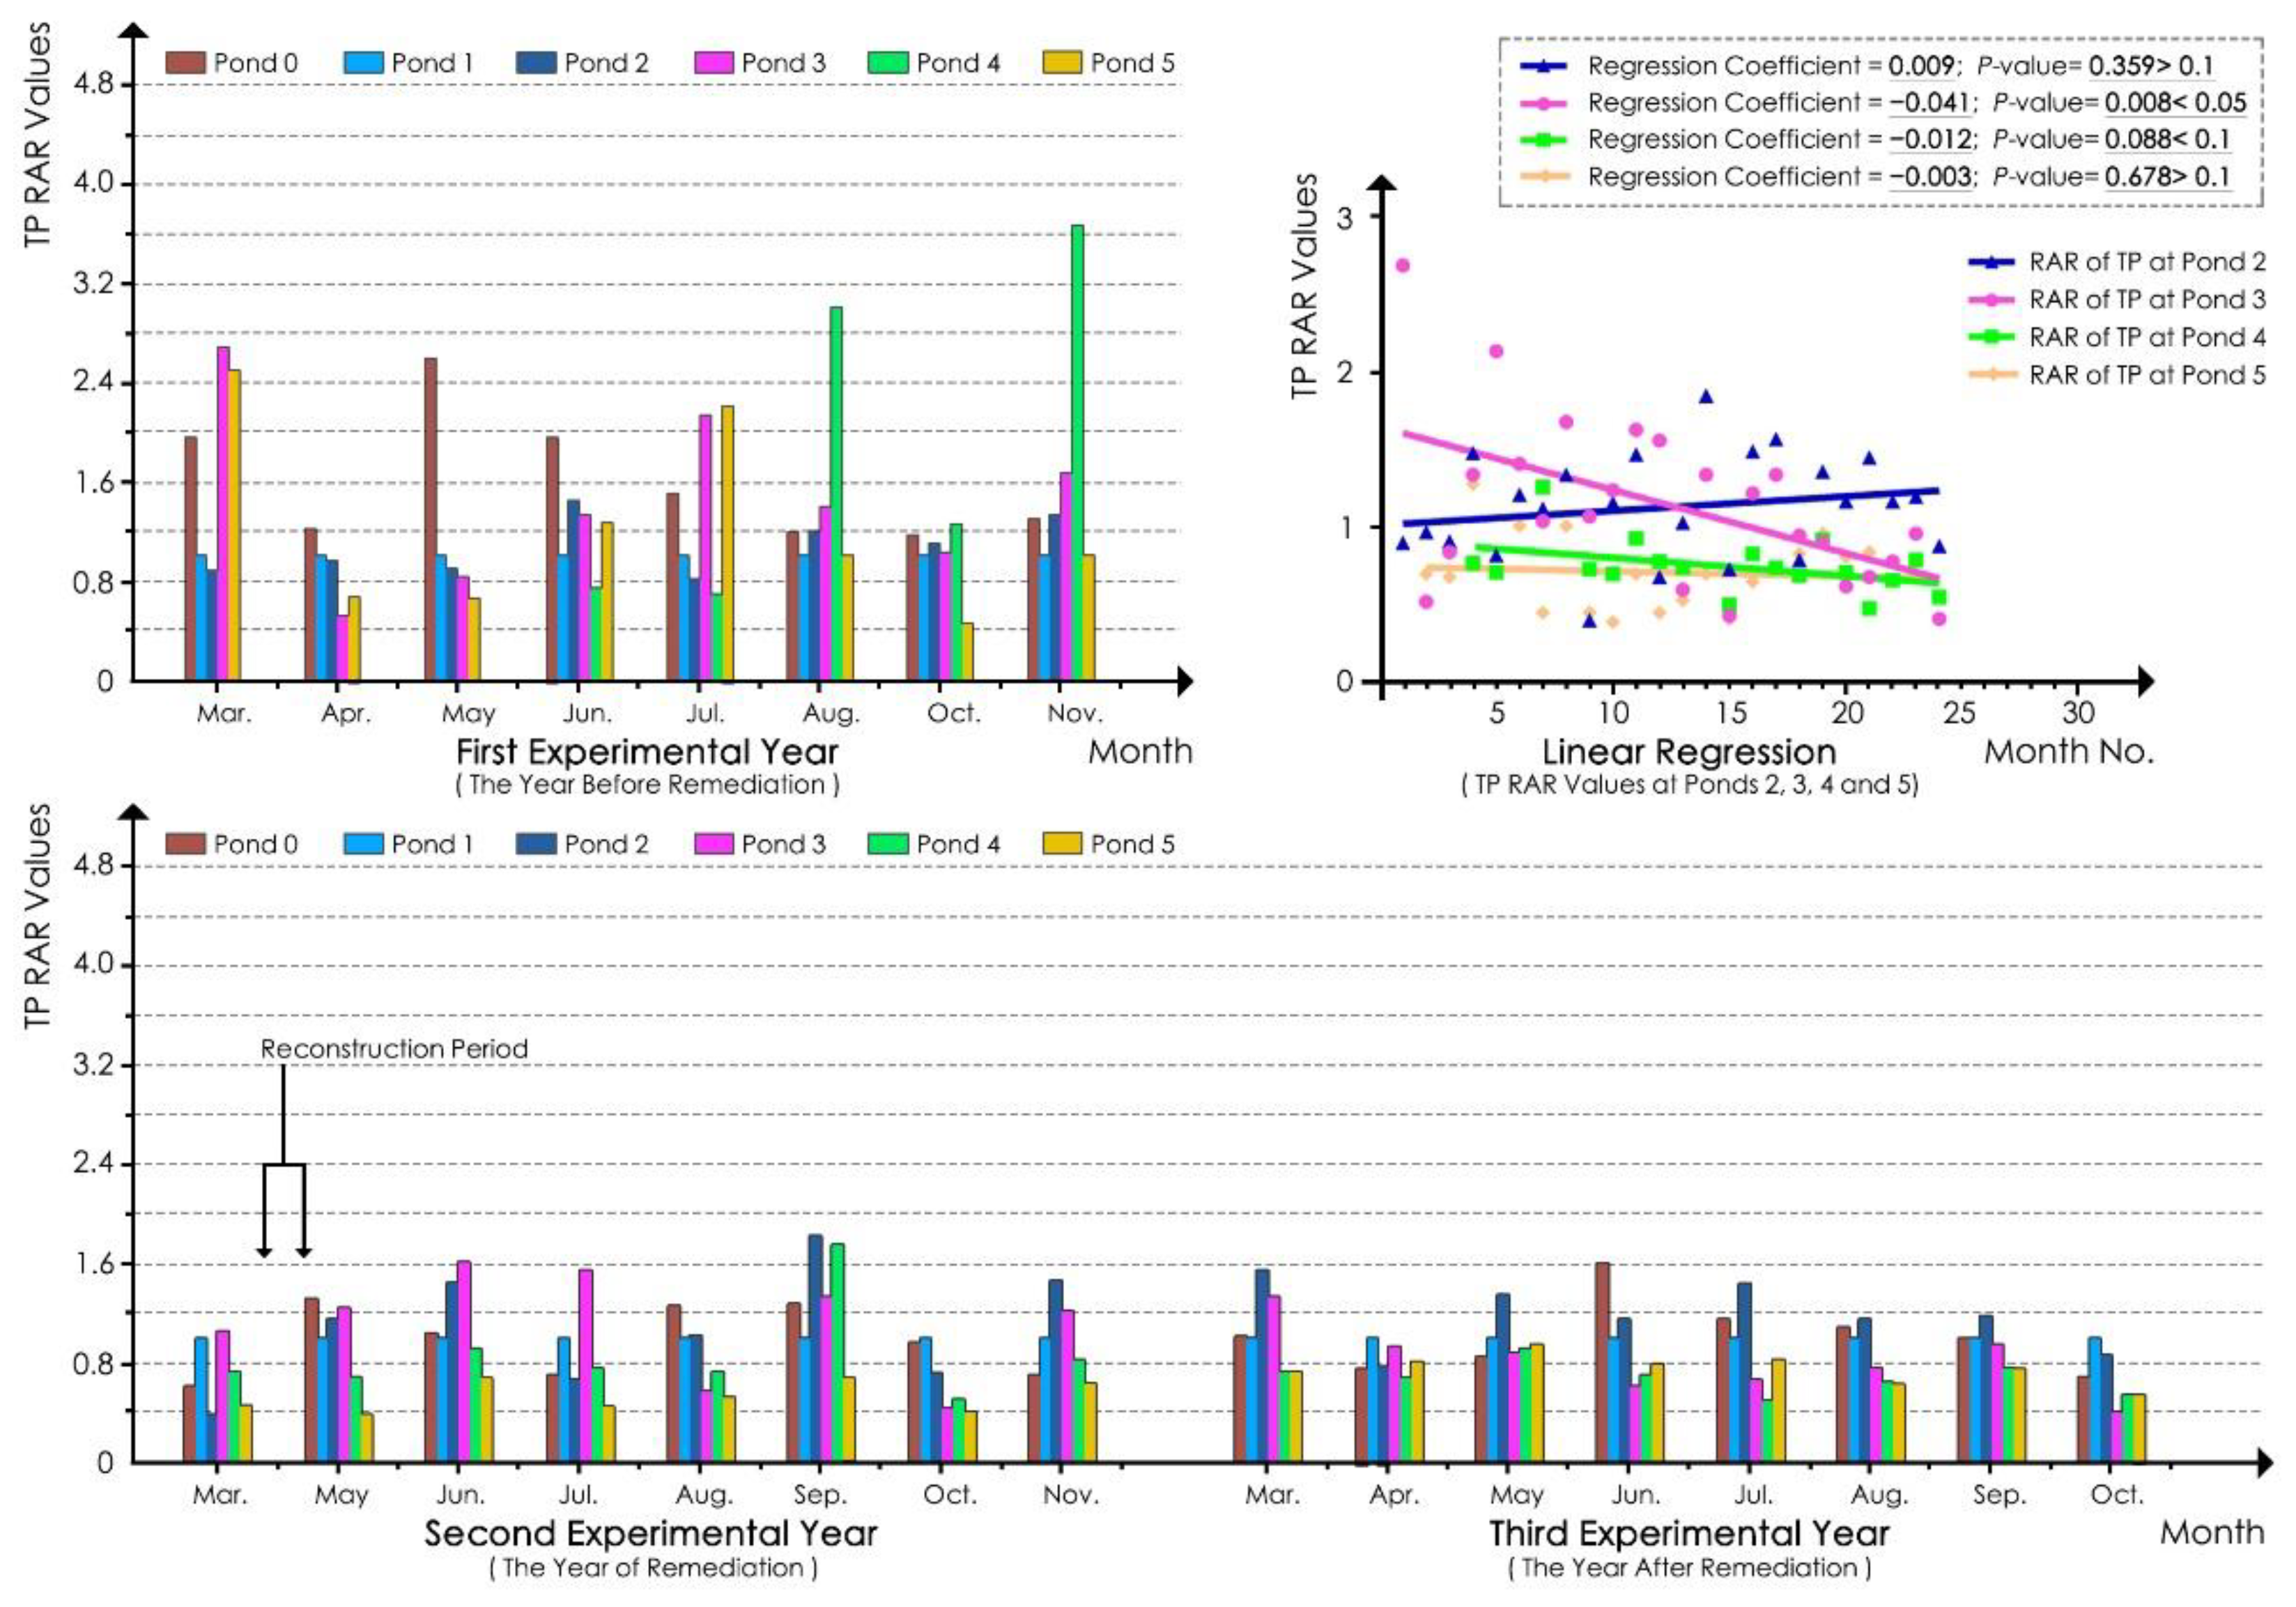
3.3. Water Quality Indices of Ponds

According to the linear regression analyses of the TN RAR values of the water samples at each pond in the whole experimental process (Figure 5), the regression coefficients of the models of ponds 3 and 4 were −0.02 and −0.015, respectively, and the p-values were all less than 0.05. These findings indicated that the TN in ponds 3 and 4 was significantly reduced during the experimental period, and the reduction at pond 3 was more obvious. In contrast, the regression coefficient of the pond 2 model was 0.002, and the p-value was greater than 0.1, indicating that its TN value did not obviously decrease in the experimental process. For the natural pond (pond 5) model, the regression coefficient was −0.003, and the p-value was 0.740, which was greater than 0.1. These findings indicated that the TN values at pond 5 also did not significantly decrease or increase in the experimental process.
As shown in Table 7, in the first experimental year, the RAR values at ponds 2, 3, and 4 were close to or surpassed 1.00 in summer and autumn and were relatively low only in spring. After ecological remediation, in the second experimental year, the RAR values at ponds 3 and 4 decreased in summer and autumn with greater declines noted at ponds 3 and 4 compared with pond 2. The reductions in the RAR values at pond 2 in summer and autumn were small, and the values even increased and exceeded 1.00 in spring. In the third experimental year, the RAR values at ponds 3 and 4 decreased by approximately half in summer and autumn compared with those in the same period of the first experimental year. For instance, the RAR value at pond 3 was 0.38, which was less than 50% of that in the same period in the first experimental year. In addition, the values at pond 3 were all lower than those at pond 4 in the three seasons, whereas the RAR values at pond 2 did not decline significantly, and even surpassed those of the first experimental year in spring and summer. The results showed that the TN reduction effect was better in summer and autumn and best in summer, and the effect at ponds 3 and 4 was much better than that at pond 2. No obvious decreasing trend was noted in spring.
According to Table 7, compared with ponds 3 and 4, the RAR values at pond 5 were relatively stable in the 3 year experimental period, with approximate values of 0.6 in spring (except in the second experimental year), 0.6 in summer, and 0.5 in autumn (except in the first experimental year). In summer and autumn, the values at ponds 3 and 4 were higher than those at pond 5 in the first experimental year, close to those at pond 5 in the second experimental year, and lower than those at pond 5 in the third experimental year. These results indicated that the TN reduction effect of ecological remediation at ponds 3 and 4 was gradually improved until it was ultimately better than that at pond 5 in the third experimental year.
With regard to TP, according to the linear regression analyses of the TP RAR values of the water samples at each pond in the whole experimental process (Figure 6), the regression coefficient of the pond 3 model was −0.041, and its p-value was less than 0.05. These results indicated that the TP of pond 3 significantly decreased. The regression coefficient of the pond 4 model was −0.012, and its p-value was between 0.05 and 0.1, indicating that the TP of pond 4 decreased slightly with marginal significance. In the pond 2 model, the regression coefficient was 0.009, and the p-value was greater than 0.1, indicating that the TP of pond 2 did not decrease significantly. For the natural pond (pond 5) model, the regression coefficient was −0.003, and the p-value was 0.678, which was greater than 0.1. These results indicated that the TP values at pond 5 did not significantly decrease or increase in the experimental process.
According to Table 8, before ecological remediation, the RAR values of ponds 2, 3, and 4 were all close to or surpassed 1.00 in the three seasons of the first experimental year, indicating high TP values at the ponds. After ecological remediation, in the second experimental year, the RAR values at ponds 3 and 4 decreased in summer and autumn, and the values at pond 3 obviously decreased in both of these seasons. However, the RAR value at pond 3 reached up to 1.13 in spring, which was more than that noted in the first experimental year. The RAR values at pond 2 also decreased to a small extent in spring and summer, whereas they increased slightly in autumn. In the third experimental year, the RAR values at ponds 3 and 4 were similar, decreased significantly in summer and autumn, and were considerably less than 1.00. Nonetheless, the RAR value at pond 3 in spring was 1.02, which was higher than that in the first experimental year. The results at pond 4 were similar to those at pond 3, and the RAR value at pond 4 in spring was higher than that in the second experimental year. In general, the values at pond 3 were similar to those at pond 4 except in spring. At pond 2, the RAR values in spring and summer were both higher than those in the first and second experimental years, and only the value in autumn was lower than that in the two previous years. The results showed that the effect of TP reduction at the ponds was obvious in summer and autumn and was best in summer. The effect at ponds 3 and 4 was significantly better than that at pond 2, whereas no obvious downward trend was noted in spring.
According to Table 8, the variation trend of the values at pond 5 fluctuated in the 3 year experimental period. The values were relatively high in the first experimental year, whereas they were much lower in the second experimental year. In the third experimental year, the values increased again and were greater than those in the second experimental year. This result indicated that pond 5, which was a natural pond, had a complicated ecosystem, and that factors other than aquatic macrophytes affected the TP values. However, the TP RAR values at ponds 3 and 4 declined throughout the whole experimental period. In summer and autumn, the values at ponds 3 and 4 were higher than those at pond 5 in the first experimental year, gradually decreased in the second experimental years, and were ultimately lower than pond 5 in the third experimental year, indicating that the TP reduction effect of ecological remediation at ponds 3 and 4 gradually improved.
With regard to COD, according to the linear regression analyses of the COD RAR values of the water samples at each pond in the whole experimental process (Figure 7), the regression coefficients of the models of ponds 2, 3, 4, and 5 were 0.011, −0.013, −0.006, and −0.008, respectively, and the p-values were all greater than 0.1. These findings indicated that the COD concentrations of ponds 2, 3, 4, and 5 did not significantly decrease during the experimental period.
According to Table 9, before ecological remediation, the COD RAR values at ponds 2, 3, and 4 were approximately 0.9–1.0 in spring, approximately 0.80 in summer, and approximately 0.80–0.90 in autumn of the first experimental year, indicating that ponds 1, 2, 3, and 4 had similar COD concentrations. After ecological remediation, the RAR values at ponds 2, 3, and 4 decreased in the summer, and the greatest decline was noted for pond 4. However, the RAR values did not decrease in spring and autumn (except the value at pond 3 in autumn) and even increased in these two seasons. In the third experimental year, the RAR values at ponds 3 and 4 remained relatively low in summer, whereas that at pond 2 in summer was higher with a value that was more than twice that noted in the same period in the first experimental year. The values at the ponds showed no obvious decrease in spring and autumn and even slightly increased compared with the first experimental year. Only the values at pond 4 in autumn and pond 2 in spring decreased slightly. In addition, the values at pond 4 were lower than those at pond 3 after remediation (with the exception of the value noted in autumn of the second experimental year). The results showed that ponds 3 and 4 had a slight COD reduction effect in summer, and the effect in spring and autumn was not obvious. Pond 2 did not exhibit a COD reduction effect in all three seasons.
According to Table 9, the RAR values at pond 5 were relatively stable in summer (with values of approximately 0.7–0.8) compared with those in spring and autumn across the 3 year experimental period. In summer, the values at ponds 3 and 4 were close to that at pond 5 in the first experimental year and gradually became lower than those at pond 5 in the second and third experimental years, indicating an improved COD reduction effect at ponds 3 and 4 in the summer after remediation that was ultimately better than that noted for pond 5. Moreover, in autumn, the COD RAR values at ponds 3 and 4 were lower than that at pond 5 in the first experimental year and close to or greater than those at pond 5 in the second and third experimental years. In spring, the values at pond 3 fluctuated and were greater than those at pond 5 throughout the experimental process. Although the values at pond 4 were lower than those at pond 5, they also fluctuated and eventually reached up to 0.85. These results indicated that none of the ponds showed an obviously better COD reduction effect in spring and autumn.
In terms of the results above of the water quality indices, the monitoring results for TN and TP showed that the nitrogen and phosphorus concentrations at ponds 3 and 4 significantly decreased after ecological remediation to values that were even lower than those at the natural pond (pond 5) in summer. The reductions at pond 3 were greater than those at pond 4, whereas the values at pond 2 did not obviously decline. This result revealed that the approach of planting only floating-leaved plants and emergent plants had a limited effect on TN and TP absorption under the condition of continuous water replenishment from external sources with a low water quality. In contrast, the approach of planting floating-leaved plants, emergent plants, and submerged plants performed much better. However, according to the values of TN, TP and N/P after remediation, although TN and TP decreased in ponds 3 and 4, the TN, TP (higher than 0.5 mg/L and 0.02 mg/L, respectively), and N/P values (approximately 16:1 and less than 29:1) of the two ponds were in suitable ranges for algal growth most of the time; therefore, the risk of algal outbreaks could not be eliminated through nutrient loading reduction under the planting amount of aquatic macrophytes in this experiment. Regarding COD concentration, ponds 2, 3, and 4 did not show a significant reduction in organic matter. Only ponds 3 and 4 had a reduced COD concentration in summer with values close to or slightly lower than those at the natural pond (pond 5), whereas the reduction effect was unstable in spring and autumn based on the values detected in the second and third experimental years. Therefore, ecological remediation can improve water quality indices in general; ponds with a combination of floating-leaved plants, emergent plants, and submerged plants had the best nitrogen and phosphorus absorption effect, and this approach could also reduce the COD concentration to a small extent in summer. However, the reductions in TN, TP, and COD may not have been the main reasons for algal inhibition when this approach was used. Some other studies also obtained similar conclusions, indicating that a reduction in nutrient loading of water bodies rarely leads to satisfactory water clarity [54,55].

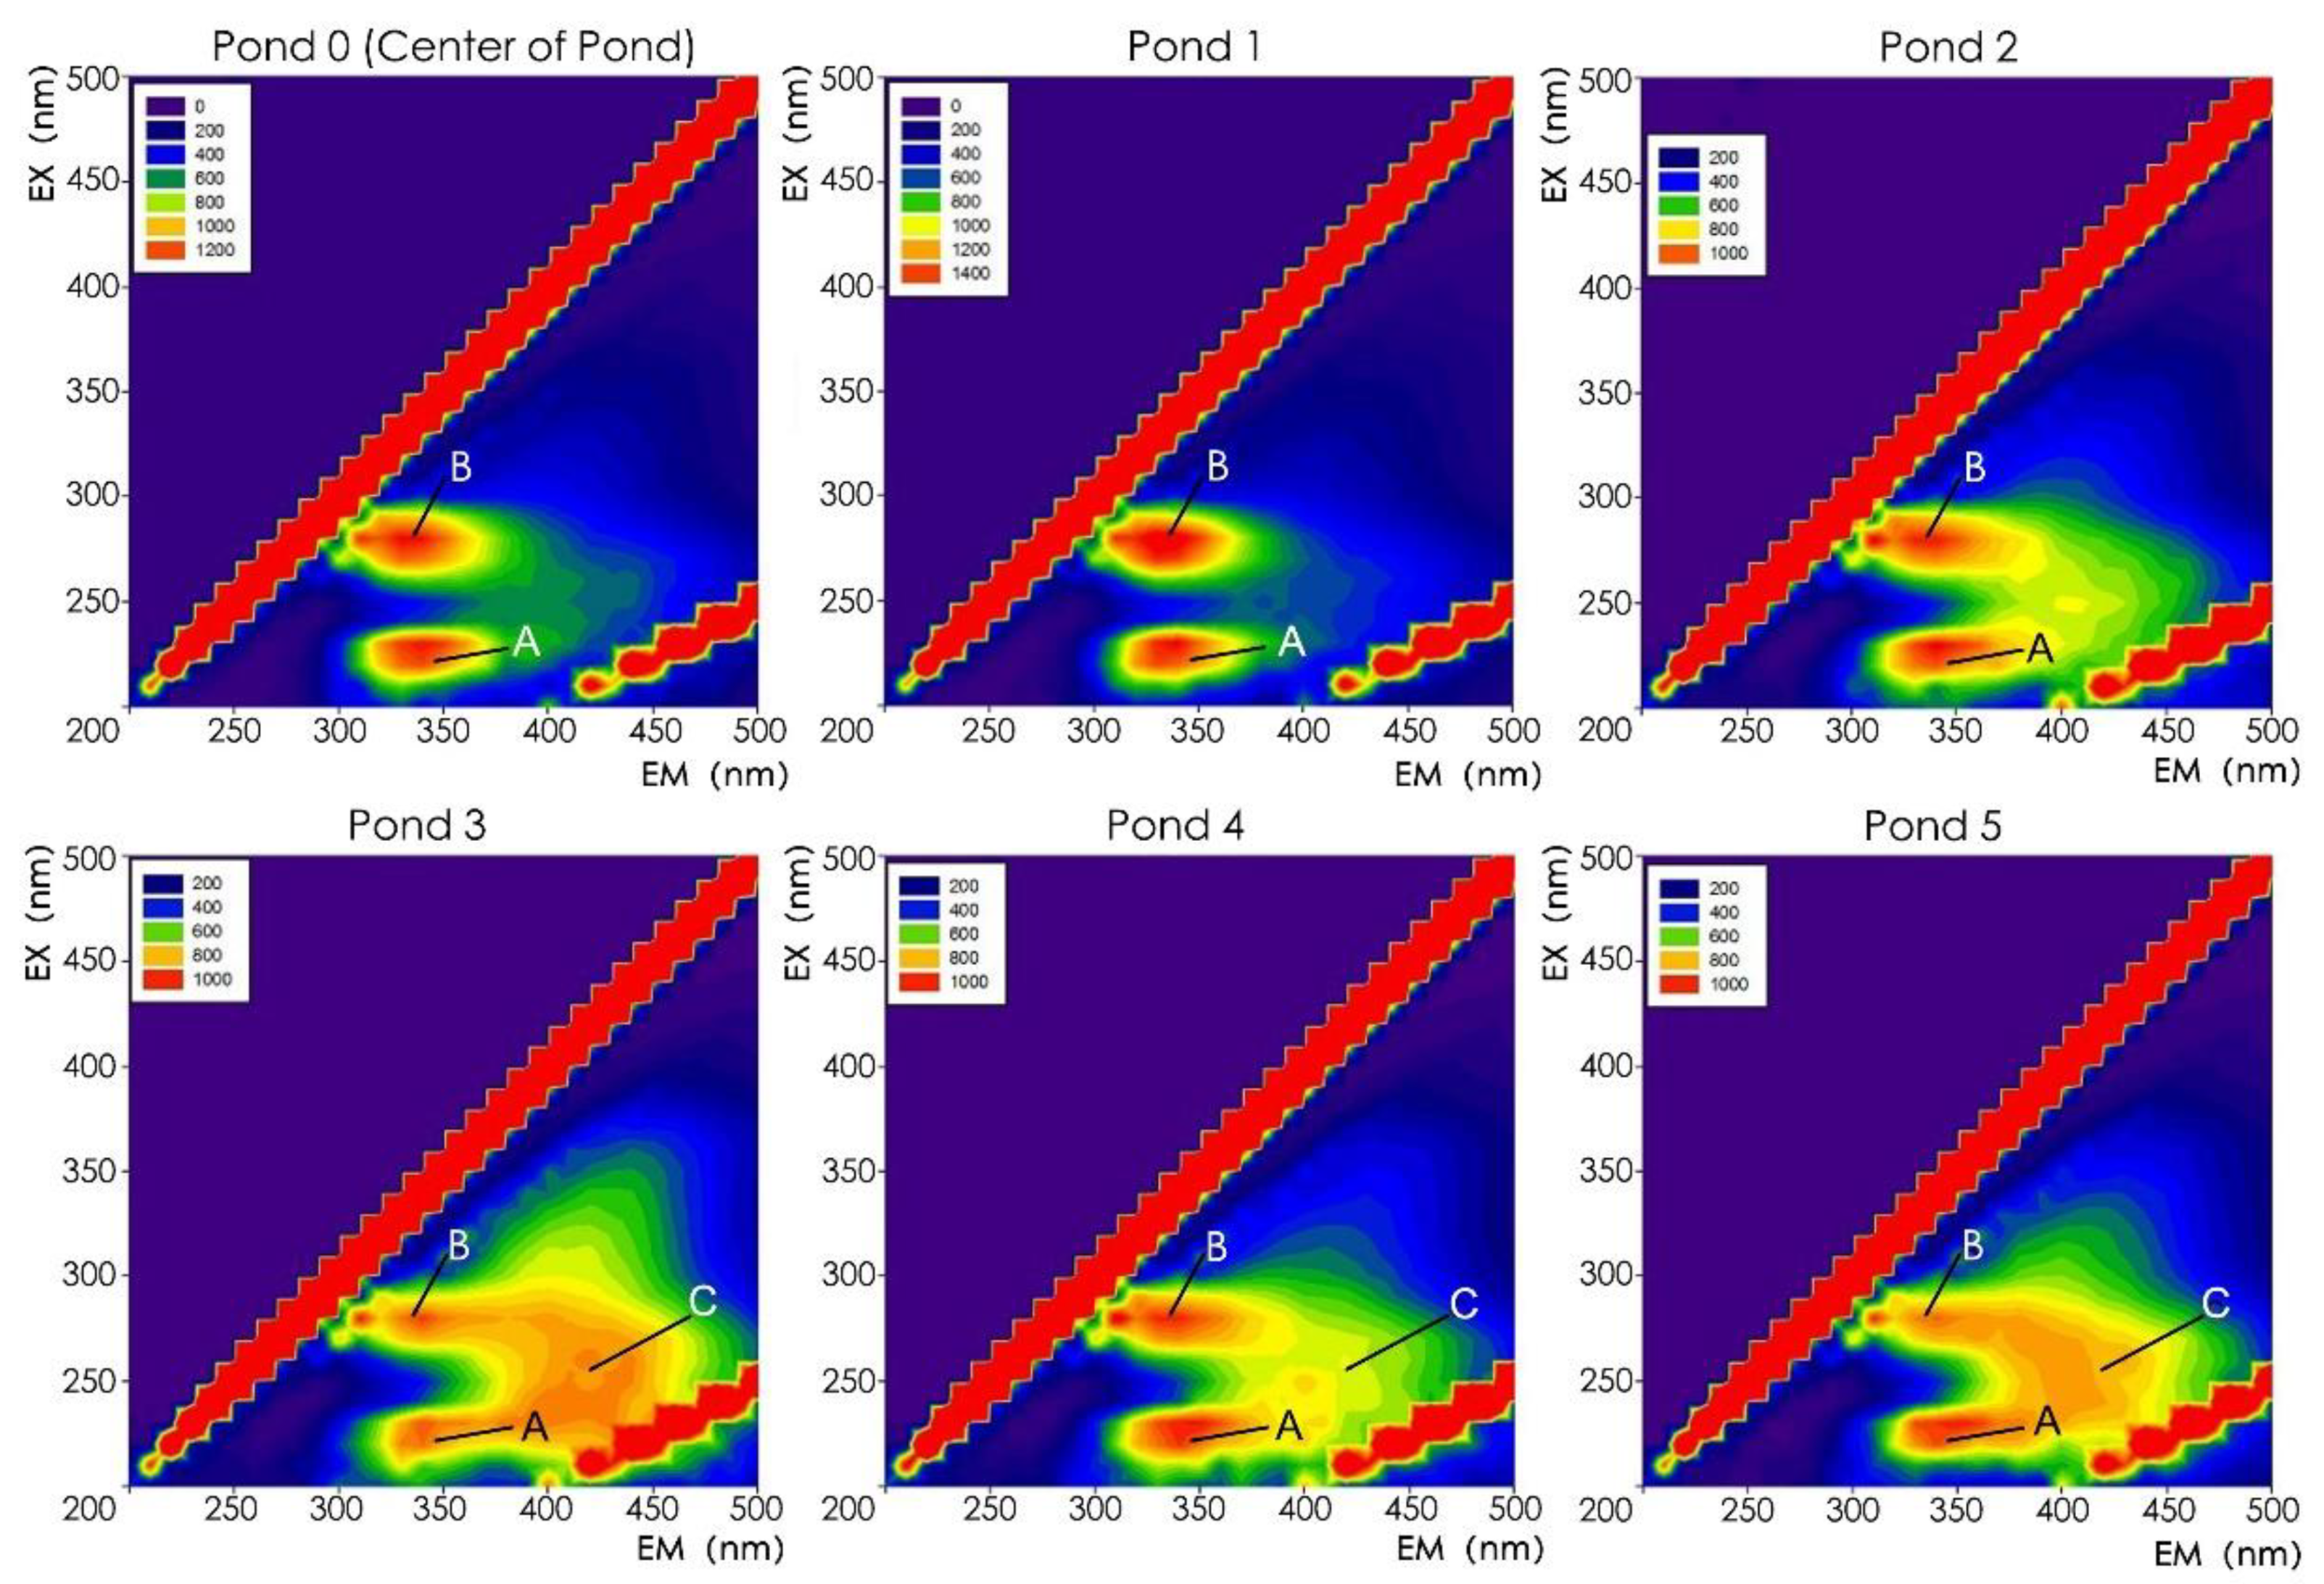
3.4. Fluorescent Organic Matter in Water Bodies

The third experimental year was the year after remediation, and the growth of aquatic macrophytes was relatively ideal in September. Thus, the 3DEEMFS of water samples at this time best reflected the concentration of allelochemicals of the aquatic macrophytes. The results showed three fluorescence areas in the spectrum that formed three peaks, which were named peaks A, B, and C (Figure 8). No significant differences between peak A and peak B were noted among these ponds, but significant differences in the values of peak C were noted. The center of peak A was near EX/EM = 280/340 nm, which is commonly considered an aromatic protein area. The center of peak B was near EX/EM = 230/340 nm, which is widely believed to be a protein-like substance area. The center of peak C was near EX/EM = 255/410 nm, which accounts for a humic acid-like substance area. Humic acid-like substances are typically derived from sediment, plant residues, and allelochemicals secreted by aquatic plants [53,56,57].
On account of the small scales and the hardened lakebeds and revetments of ponds 1, 2, 3, and 4, relatively little sediment was noted at the lakebeds. Furthermore, due to the impurity-blocking function of the submerged plants and pebble layers at the lakebed of the ponds and the regular clearing of plant residues in the park’s routine maintenance, fewer allelochemicals were released from the sediment. In addition, the peak C signals at ponds 3, 4, and 5 were relatively strong. In contrast, the signal at pond 2, which had only emergent plants, was weak, and no peak C signal was noted at ponds 0 and 1, which did not have any aquatic macrophytes. Therefore, the signal may have been mainly related to submerged plants. In addition, according to the 3DEEMFS of ponds 3 and 4 from March to November in the third experimental year, the strength of the peak C signal was very weak in the early spring and at the end of autumn. However, it became much stronger from June to September (Figure S3), which was consistent with the growth and flourishing period of submerged plants in Beijing. In June, the peak C signal was strongest, which coincided with the rapid growth period of submerged plants in Beijing. The signal began to weaken in September, which coincided with the time when submerged plants began to grow slowly, stopped growing, or died. The consistency of the intensity of the peak C signal with season at ponds 3 and 4 reflected that this peak was strongly related to the vegetation of submerged plants. In addition, the peak C signal at pond 3 was slightly stronger than that at pond 4 (Figure 8 and Figure S3). Moreover, the submerged plants in pond 3 grew better and had a higher growth density than those in pond 4 (Table 4), which also reflected the correlation between submerged plants and peak C signals. Therefore, the strong peak C signals are not presumed to be derived from sediment and plant residues; rather, they are mainly derived from the allelochemicals of submerged plants.
Therefore, the allelochemicals produced by the allelopathy of aquatic macrophytes could have been the main reason for algal inhibition and the improvement of the ponds’ water transparency. Furthermore, the algal inhibition effect using a macrophyte configuration with floating-leaved plants, emergent plants, and submerged plants was much greater than that using a configuration without submerged plants. As a consequence, we argue that the effect of in situ ecological remediation on inhibiting algal blooms in still-water ponds is attributed more to the allelopathy of plants than to the absorption of nutrients by the plants.

4. Conclusions

According to the data analyses of TN, TP, COD, Chl a, water transparency, and 3DEEMFS, in the case of continuous water replenishment from an external, low-quality water source in still-water ponds, the ecological remediation approach of planting only floating-leaved plants and emergent plants had very limited effects on reducing nutrient loading, improving water transparency, and inhibiting algae. In contrast, the ecological remediation design using a combination of floating-leaved plants, emergent plants, and submerged plants showed a significant positive effect on the three aspects above. Moreover, the water quality of the ponds using the above ecological remediation measures was better than that of the pond without any remediation measures at all. Therefore, still-water ponds with hardened vertical revetments and lakebeds in urban parks should be designed with these three types of aquatic macrophytes, specifically with stepped planting beds to plant floating-leaved and emergent plants on the revetment, submerged planting beds to plant submerged plants at the lakebed, and pebble layers to weaken sediment overturning. The stepped planting beds, submerged planting beds and pebble layers form a “multilevel” mini-engineering design, and the floating-leaved plants, emergent plants, and submerged plants form a “multilayer” aquatic macrophyte configuration, which together constitute a more stable in situ ecological self-purification model for still-water ponds (Figure 9 and Figure A2). The model can significantly reduce TN and TP in a water body; however, nutrient loading reduction is not the fundamental reason to inhibit algal blooms. The self-purification mechanism of this model mainly seeks to inhibit algal overproduction and prevent algal blooms through the allelochemicals released by aquatic macrophytes. As still-water ponds are widely used in modern urban parks, this model can help avoid the landscape damage caused by water quality problems in the design stage, greatly reduce the costs of long-term maintenance and management, and improve the ability of still-water ponds to create pleasant waterscapes.
In addition, ponds that only had three floating-leaved and emergent plant species reduced TN and Chl a better than ponds that had six floating-leaved and emergent plant species, particularly in terms of the reduction in Chl a. In contrast, the latter showed no better reduction effect on the other indices compared with the former, except for a slightly better COD reduction effect. Therefore, it seems that simply increasing the number of floating-leaved and emergent plant species did not have a significantly better effect than using fewer species. Therefore, the species of floating-leaved and emergent plants may not have been the key design factors in this model, and further comparative experiments are needed to verify the optimal macrophyte species and planting quantity to improve the water quality.
Admittedly, this experiment also had certain limitations. First, the risk of external pollution cannot be avoided in outdoor experiments, especially at the source of the replenishment water. In this experiment, although ecological remediation improved the water quality in the ponds, the conditions at the ponds were still suitable for algal growth. This result may have been due to the relatively poor water quality of pond 0 as the replenishment water source, resulting in repeated increases in nutrient input in the experimental ponds. In addition, in the second experimental year, the TN values of almost all the ponds were abnormally high throughout the spring and summer, which might have been related to the accidental, slight external pollution of pond 0 at that time. Fortunately, pollution did not reoccur in the third experimental year, and the RAR values showed that the TN at ponds 3 and 4 greatly declined in the second and third experimental years, especially in the summer, revealing the effectiveness of the ecological remediation design in reducing nutrient loading. In the future, in similar experiments, the negative influence of this type of potential risk could be reduced by increasing the frequency of water quality monitoring, especially in summer. In doing so, the data collected before and after external pollution occurs could regularly reflect the changes in the water quality to assess the impact of this interference in the experiments. This phenomenon indicates that the water quality of the water replenishment source has a great impact on the water quality of still-water ponds, and its improvement could help lead to a stronger and more sustainable improvement of the water quality in the other ponds receiving that replenishment water. Therefore, in urban park landscape design, replenishment water ponds should be sited in places that are not vulnerable to external pollution. Second, it is not easy to find sample ponds with the same or very similar basic conditions in complex outdoor environments. The number of ponds in this experiment was not sufficient to support a comparative experiment with more variables, such as a comparison of different planting quantities or a comparison of the purification capacity of different macrophyte species. The analysis of the relationship between algal blooms and TN and TP was based on the species and quantities of aquatic macrophytes planted in this experiment. If the quantities of macrophytes increase or the species are changed, the composition of TN and TP in the water body may change as well, such as a decrease in inorganic nutrients and an increase in dissolved organic and particulate N and P, thus affecting algal reproduction. Given that this was a long-term monitoring experiment over a 3 year period, the variables of each pond could not be adjusted every year, and the ponds could not be changed once reconstructed. These limitations could be solved in the future by expanding the experimental cycle or reconstructing each pond every 3 years and conducting further comparative experiments. Third, this study did not implement a targeted investigation and analysis on aquatic animal populations in the ponds because the study sites (ponds 1, 2, 3, and 4) were all small-scale, landscaped, still-water ponds with lakebeds and revetments that had all been hardened. During the field investigation of aquatic plants, aquatic animals were not identified in great numbers and, thus, were not included among the variables in the comparative experiment. Although the water conditions of the experimental ponds were significantly improved through this ecological remediation model, to further analyze the biological mechanism of the self-purification of still-water ponds, aquatic animals, such as fish or zooplankton, will be introduced as variables in a comparative experiment over the next 3 years.

Supplementary Materials

The following supporting information can be downloaded at: https://www.mdpi.com/article/10.3390/land11101676/s1, Figure S1. Water temperature of each pond; Figure S2. The pH value of each pond; Figure S3. The 3DEEMFS of ponds 3 and 4 from March to October in the third experimental year; Table S1. Planting area and depth of aquatic macrophytes in each pond.

Author Contributions

Conceptualization, H.Y.; data curation, W.L.; formal analysis, H.Y.; funding acquisition, W.L.; investigation, H.Y. and W.L.; methodology, H.Y.; project administration, W.L. and X.C.; resources, W.L. and X.C.; supervision, W.L. and X.C. All authors have read and agreed to the published version of the manuscript.

Funding

This research received no external funding.

Institutional Review Board Statement

Not applicable.

Informed Consent Statement

Not applicable.

Data Availability Statement

All supporting data are cited in the paper (see Section 3, Results and Discussion, and Appendix A and Appendix B).

Acknowledgments

The authors sincerely thank all the staff at Beijing Yu Park Management Office for their support of our fieldwork, and Lijun Liu, Qianlong Fan, Yixi Zhao, Hengfeng Zhang, Chao Li, and others for their experimental support.

Conflicts of Interest

The authors declare no conflict of interest.

Appendix A

Table A1. Typical types and average densities of microalgal cells in each pond in the summer of the third experimental year (1).
PondMicroalgal Cell Density/(×105/L)
MicrocystisPseudanabaenaMerismopediaChlorella vulgarisScenedesmus
0Yes41.92015.0295.073.4
1Yes14.01790.0199.066.4
2Yes21.0447.0342.062.9
3No0012.20
4No2.662.947.26.9
5Yes5.2033.26.1
Table A2. Typical types and average densities of microalgal cells in each pond in the summer of the third experimental year (2).
PondMicroalgal Cell Density/(×105/L)
CosmariumPediastrumMelosiraCyclotellaSynedra
0005.224.533.0
16.906.9048.9
26.90017.56.9
300000
40000.90.9
53.5004.46.1
Note: Summer experimental data were selected because algal blooms are most likely to occur in summer among the four seasons in northern China.
Table A3. Extreme RAR values of TN, TP, COD, and Chl a tested by boxplots in SPSS.
IndexPond No.Ordinal No. RAR ValueMonth and YearTreatment
TN2143.39September, 2nd YearDelete
3182.18April, 3rd YearDelete
TP433.00August, 1st YearDelete
453.67November, 1st YearDelete
4111.76September, 2nd YearDelete
512.49March, 1st YearDelete
552.21July, 1st YearDelete
COD2173.09March, 3rd YearDelete
3173.28March, 3rd YearDelete
Chl a344.46June, 1st YearDelete
543.86June, 1st YearDelete
Note: In combination with the water quality index values of the extreme samples and compared with the values at pond 1 (the reference site), pond 0 (the water replenishment source pond), pond 5 (the natural pond), and the other remediated ponds, these extreme values were considered to exceed the normal range. Because the experimental ponds were outdoors, there were many uncontrollable environmental factors. Therefore, these extreme values may have been caused by uncontrollable environmental factors at individual ponds in short time periods (such as surface runoff pollution) or by uneven distribution of the water bodies when collecting the water samples. As a consequence, these factors were deleted to prevent them from affecting the analyses. Extreme RAR values are also shown in the boxplot of Appendix B (Figure A1).

Appendix B

Figure A1. Boxplots of the water transparency and the RAR values of TN, TP, COD, and Chl a at each pond.
Land 11 01676 g0a1
Figure A2. (a) Construction of “multilevel” revetments and lakebeds at pond 4; (b) aquatic macrophytes were planted in the “multilevel” pond revetments and lakebeds of pond 4, forming a “multilayer” plant configuration in the second experimental year, and the water quality was relatively poor in the initial stage of remediation; (c) aquatic macrophytes grew well, and the water quality was greatly improved in the third experimental year.
Land 11 01676 g0a2

References

  1. Booth, N.K. Basic Elements of Landscape Architectural Design; Waveland Press: Long Grove, IL, USA, 1990; pp. 254–255. Available online: https://books.google.com.hk/books?hl=en&lr=&id=7a0QAAAAQBAJ&oi=fnd&pg=PR3&dq=Basic+elements+of+landscape+architectural+design&ots=zBFOufE7Ob&sig=aFNJUZtly9wzEE2diLenwpZV9pg&redir_esc=y#v=onepage&q=Basic%20elements%20of%20landscape%20architectural%20design&f=false (accessed on 23 August 2022).
  2. Li, D.; Sun, C.J.; Chen, M.M. Design of Landscape Aquatic Ecosystem in Mengqing Park. Adv. Mater. Res. 2013, 726–731, 3633–3637. [Google Scholar] [CrossRef]
  3. Nélieu, S.; Lamy, I.; Karolak, S.; Delarue, G.; Crouzet, O.; Barraud, C.; Bimbot, M.; Allaoui, F.; Hanot, C.; Delorme, A.; et al. Impact of peri-urban landscape on the organic and mineral contamination of pond waters and related risk assessment. Environ. Sci. Pollut. Res. 2020, 28, 59256–59267. [Google Scholar] [CrossRef]
  4. Chang, N.; Zhang, Q.; Wang, Q.; Luo, L.; Wang, X.C.; Xiong, J.; Han, J. Current status and characteristics of urban landscape lakes in China. Sci. Total Environ. 2019, 712, 135669. [Google Scholar] [CrossRef]
  5. Singh, S.; Singh, P. Effect of temperature and light on the growth of algae species: A review. Renew. Sustain. Energy Rev. 2015, 50, 431–444. [Google Scholar] [CrossRef]
  6. Chen, R.; Ao, D.; Ji, J.; Wang, X.C.; Li, Y.-Y.; Huang, Y.; Xue, T.; Guo, H.; Wang, N.; Zhang, L. Insight into the risk of replenishing urban landscape ponds with reclaimed wastewater. J. Hazard. Mater. 2016, 324, 573–582. [Google Scholar] [CrossRef]
  7. Pozdnyakov, D.V.; Pettersson, L.H.; Korosov, A.A. Investigation of Harmful/Nuisance Algae Blooms in Marine Environments. In Exploring the Marine Ecology from Space; Springer: Cham, Switzerland, 2017; pp. 95–140. [Google Scholar] [CrossRef]
  8. Cao, Y. Water Pollution Control and Ecological Restoration of Urban Lake Landscape. In IOP Conference Series: Earth and Environmental Science; IOP Publishing: Bristol, UK, 2020; Volume 525, p. 012064. [Google Scholar] [CrossRef]
  9. Mohan, G.; Swathy, K.S.; Aravind, R.; Raffi, S.M. Fish mortality due to cyanobacterial bloom in freshwater pond, Cochin, Kerala. J. Krishi Vigyan 2020, 9, 110–113. [Google Scholar] [CrossRef]
  10. Zhong, J.; Chen, C.; Yu, J.; Shen, Q.; Liu, C.; Fan, C. Effect of dredging and capping with clean soil on the mitigation of algae-induced black blooms in Lake Taihu, China: A simulation study. J. Environ. Manag. 2021, 302, 114106. [Google Scholar] [CrossRef]
  11. Park, J.; Son, Y.; Lee, W.H. Variation of efficiencies and limits of ultrasonication for practical algal bloom control in fields. Ultrason. Sonochemistry 2019, 55, 8–17. [Google Scholar] [CrossRef]
  12. Yang, Z.; Hou, J.; Wu, M.; Miao, L.; Wu, J.; Li, Y. A novel co-graft tannin-based flocculant for the mitigation of harmful algal blooms (HABs): The effect of charge density and molecular weight. Sci. Total Environ. 2021, 806, 150518. [Google Scholar] [CrossRef]
  13. Yue, Q.; He, X.; Yan, N.; Tian, S.; Liu, C.; Wang, W.-X.; Luo, L.; Tang, B.Z. Photodynamic control of harmful algal blooms by an ultra-efficient and degradable AIEgen-based photosensitizer. Chem. Eng. J. 2020, 417, 127890. [Google Scholar] [CrossRef]
  14. Sun, R.; Sun, P.; Zhang, J.; Esquivel-Elizondo, S.; Wu, Y. Microorganisms-based methods for harmful algal blooms control: A review. Bioresour. Technol. 2018, 248, 12–20. [Google Scholar] [CrossRef]
  15. Chen, Z.; Zhao, D.; Li, M.; Tu, W.; Luo, X.; Liu, X. A field study on the effects of combined biomanipulation on the water quality of a eutrophic lake. Environ. Pollut. 2020, 265, 115091. [Google Scholar] [CrossRef]
  16. Zhu, X.; Dao, G.; Tao, Y.; Zhan, X.; Hu, H. A review on control of harmful algal blooms by plant-derived allelochemicals. J. Hazard. Mater. 2020, 401, 123403. [Google Scholar] [CrossRef]
  17. El-Sheekh, M.; Abdel-Daim, M.M.; Okba, M.; Gharib, S.; Soliman, A.; El-Kassas, H. Green technology for bioremediation of the eutrophication phenomenon in aquatic ecosystems: A review. Afr. J. Aquat. Sci. 2021, 46, 274–292. [Google Scholar] [CrossRef]
  18. Wang, H.; Liu, F.; Luo, P.; Li, Z.; Zheng, L.; Zou, D.; Wu, J. Allelopathic Effects of Myriophyllum aquaticum on Two Cyanobacteria of Anabaena flos-aquae and Microcystis aeruginosa. Bull. Environ. Contam. Toxicol. 2017, 98, 556–561. [Google Scholar] [CrossRef]
  19. Zhou, Y.; Zhou, X.; Han, R.; Xu, X.; Wang, G.; Liu, X.; Bi, F.; Feng, D. Reproduction capacity of Potamogeton crispus fragments and its role in water purification and algae inhibition in eutrophic lakes. Sci. Total Environ. 2016, 580, 1421–1428. [Google Scholar] [CrossRef]
  20. Li, B.; Yin, Y.; Kang, L.; Feng, L.; Liu, Y.; Du, Z.; Tian, Y.; Zhang, L. A review: Application of allelochemicals in water ecological restoration—Algal inhibition. Chemosphere 2020, 267, 128869. [Google Scholar] [CrossRef]
  21. Scheffer, M.; Hosper, S.H.; Meijer, M.-L.; Moss, B.; Jeppesen, E. Alternative equilibria in shallow lakes. Trends Ecol. Evol. 1993, 8, 275–279. [Google Scholar] [CrossRef]
  22. Scheffer, M.; Nes, E.H.V. Shallow lakes theory revisited: Various alternative regimes driven by climate, nutrients, depth and lake size. In Shallow Lakes in a Changing World; Springer: Dordrecht, The Netherlands, 2007; pp. 455–466. [Google Scholar]
  23. Tazart, Z.; Douma, M.; Caldeira, A.T.; Tebaa, L.; Mouhri, K.; Loudiki, M. Highlighting of the antialgal activity of organic extracts of Moroccan macrophytes: Potential use in cyanobacteria blooms control. Environ. Sci. Pollut. Res. 2020, 27, 19630–19637. [Google Scholar] [CrossRef]
  24. Han, J.; Yin, Y.; Xu, D.; Wang, H.; Yu, S.; Han, D.; Niu, Y.; Xu, R. Growth inhibition and oxidative damage of Microcystis aeruginosa induced by aqueous extract of different submerged macrophytes. Environ. Sci. Pollut. Res. 2021, 28, 53224–53238. [Google Scholar] [CrossRef]
  25. Xu, J.C.; Gu, X.; Li, G.M.; Man, W.J. The Synergistic Ways of Waterscape Effect and Water Conservation in Urban Landscape Water. Chin. Landsc. Archit. 2015, 31, 67–70. Available online: https://oversea.cnki.net/KCMS/detail/detail.aspx?dbcode=CJFD&dbname=CJFDLAST2015&filename=ZGYL201505016&uniplatform=OVERSEAS_EN&v=bkVo6_LHm-oSsdbrT5Nmt9NGDXpZktQZQAfMTJeHDAspqAG6FeQ7YwRgLn_ibIlG (accessed on 23 August 2022).
  26. Zhang, H.; Tang, W.; Wang, W.; Yin, W.; Liu, H.; Ma, X.; Zhou, Y.; Lei, P.; Wei, D.; Zhang, L.; et al. A review on China’s constructed wetlands in recent three decades: Application and practice. J. Environ. Sci. 2021, 104, 53–68. [Google Scholar] [CrossRef]
  27. Widelska, E.; Walczak, W. Restoration of ponds in the municipal park in Zduńska Wola, Poland. J. Water Land Dev. 2020, 44, 151–157. [Google Scholar] [CrossRef]
  28. Liu, J.; Gong, X.; Li, L.; Chen, F.; Zhang, J. Innovative design and construction of the sponge city facilities in the Chaotou Park, Talent Island, Jiangmen, China. Sustain. Cities Soc. 2021, 70, 102906. [Google Scholar] [CrossRef]
  29. Liu, F.; Lu, J. Ecological engineering approaches to restoring the aquatic biological community of an urban pond ecosystem and its effects on water quality—A case study of the urban Xixi National Wetland Park in China. Knowl. Manag. Aquat. Ecosyst. 2021, 422, 24. [Google Scholar] [CrossRef]
  30. Zhang, Q.; Li, H.; Xu, Y.; Tang, J. Ecological wisdom-inspired remediation technology for aquaculture water quality improvement in ecological agricultural park. In Ecological Wisdom Inspired Restoration Engineering; Springer: Singapore, 2019; pp. 181–195. [Google Scholar] [CrossRef]
  31. Anawar, H.; Chowdhury, R. Remediation of Polluted River Water by Biological, Chemical, Ecological and Engineering Processes. Sustainability 2020, 12, 7017. [Google Scholar] [CrossRef]
  32. Horppila, J. Sediment nutrients, ecological status and restoration of lakes. Water Res. 2019, 160, 206–208. [Google Scholar] [CrossRef]
  33. Abell, J.M.; Özkundakci, D.; Hamilton, D.P.; Reeves, P. Restoring shallow lakes impaired by eutrophication: Approaches, outcomes, and challenges. Crit. Rev. Environ. Sci. Technol. 2020, 52, 1199–1246. [Google Scholar] [CrossRef]
  34. Kataki, S.; Chatterjee, S.; Vairale, M.G.; Dwivedi, S.K.; Gupta, D.K. Constructed wetland, an eco-technology for wastewater treatment: A review on types of wastewater treated and components of the technology (macrophyte, biolfilm and substrate). J. Environ. Manag. 2021, 283, 111986. [Google Scholar] [CrossRef]
  35. Khan, M.N.; Mohammad, F. Eutrophication: Challenges and Solutions. In Eutrophication: Causes, Consequences and Control; Springer: Singapore, 2014; pp. 1–15. [Google Scholar]
  36. Yan, Z.; Song, B.; Zhang, L.; Liu, M.; Liu, Y.; Wu, X.; Tian, Y.; Chen, Z.; Zhao, J. Effects of Submerged Plants on the Growth of Eutrophic Algae and Nutrient Removal in Constructed Wetlands. OALib 2016, 3, 1–11. [Google Scholar] [CrossRef]
  37. Liu, Q.; Sun, B.; Huo, Y.; Liu, M.; Shi, J.; Jiang, T.; Zhang, Q.; Tang, C.; Bi, H.; He, P. Nutrient bioextraction and microalgae growth inhibition using submerged macrophyte Myriophyllum spicatum in a low salinity area of East China Sea. Mar. Pollut. Bull. 2018, 127, 67–72. [Google Scholar] [CrossRef] [PubMed]
  38. Ralston, D.K.; Keafer, B.A.; Brosnahan, M.; Anderson, D.M. Temperature dependence of an estuarine harmful algal bloom: Resolving interannual variability in bloom dynamics using a degree-day approach. Limnol. Oceanogr. 2014, 59, 1112–1126. [Google Scholar] [CrossRef] [PubMed]
  39. Liu, H.; Song, X.; Guan, Y.; Pan, D.; Li, Y.; Xu, S.; Fang, Y. Role of illumination intensity in microcystin development using Microcystis aeruginosa as the model algae. Environ. Sci. Pollut. Res. 2017, 24, 23261–23272. [Google Scholar] [CrossRef] [PubMed]
  40. Zhang, Y.; Luo, P.; Zhao, S.; Kang, S.; Wang, P.; Zhou, M.; Lyu, J. Control and remediation methods for eutrophic lakes in the past 30 years. Water Sci. Technol. 2020, 81, 1099–1113. [Google Scholar] [CrossRef] [PubMed]
  41. Xie, L.; Xie, P.; Li, S.; Tang, H.; Liu, H. The low TN:TP ratio, a cause or a result of Microcystis blooms? Water Res. 2003, 37, 2073–2080. [Google Scholar] [CrossRef]
  42. Parsimehr, M.; Shayesteh, K.; Godini, K.; Varkeshi, M.B. Using Multilayer Perceptron Artificial Neural Network for Predicting and Modeling the Chemical Oxygen Demand of the Gamasiab River. Avicenna J. Environ. Health Eng. 2018, 5, 15–20. [Google Scholar] [CrossRef]
  43. Flores-Anderson, A.I.; Griffin, R.; Dix, M.; Romero-Oliva, C.S.; Ochaeta, G.; Skinner-Alvarado, J.; Moran, M.V.R.; Hernandez, B.; Cherrington, E.; Page, B.; et al. Hyperspectral Satellite Remote Sensing of Water Quality in Lake Atitlán, Guatemala. Front. Environ. Sci. 2020, 8, 7. [Google Scholar] [CrossRef]
  44. Redfield, A.C. The biological control of chemical factors in the environment. Am. Sci. 1958, 46, 230A, 205–221. [Google Scholar]
  45. Rhee, G.-Y.; Gotham, I.J. Optimum N: P ratios and coexistence of planktonic algae. J. Phycol. 1980, 16, 486–489. [Google Scholar] [CrossRef]
  46. Smith, V.H. Low Nitrogen to Phosphorus Ratios Favor Dominance by Blue-Green Algae in Lake Phytoplankton. Science 1983, 221, 669–671. [Google Scholar] [CrossRef]
  47. Schindler, D.W. Evolution of Phosphorus Limitation in Lakes. Science 1977, 195, 260–262. [Google Scholar] [CrossRef] [PubMed]
  48. Kong, F.X.; Song, L.R. Algal Blooms Process and Its Environmental Characteristics; Science Press: Beijing, China, 2011; p. 43. [Google Scholar]
  49. Song, F.; Wu, F.; Feng, W.; Liu, S.; He, J.; Li, T.; Zhang, J.; Wu, A.; Amarasiriwardena, D.; Xing, B.; et al. Depth-dependent variations of dissolved organic matter composition and humification in a plateau lake using fluorescence spectroscopy. Chemosphere 2019, 225, 507–516. [Google Scholar] [CrossRef] [PubMed]
  50. Li, L.; Wang, Y.; Zhang, W.; Yu, S.; Wang, X.; Gao, N. New advances in fluorescence excitation-emission matrix spectroscopy for the characterization of dissolved organic matter in drinking water treatment: A review. Chem. Eng. J. 2019, 381, 122676. [Google Scholar] [CrossRef]
  51. Gao, Y.; Dong, J.; Fu, Q.; Wang, Y.; Chen, C.; Li, J.; Li, R.; Zhou, C. Allelopathic effects of submerged macrophytes on phytoplankton. Allelopath. J. 2017, 40, 01–22. [Google Scholar] [CrossRef]
  52. Zhang, Y.C.; Liang, W.Y.; Zhao, Y.; Li, F.Z.; Cao, J.C.; Hu, S.J. Generation and release of Microcystin-lR by Microcystis aeruginosa under hydroquinone inhibition. Environ. Sci. 2014, 35, 2294–2299. [Google Scholar] [CrossRef]
  53. Jiang, J.K.; Wu, J.X.H. Fluorescence properties of lake water. Spectrosc. Spectr. Anal. 2010, 30, 1525–1529. [Google Scholar] [CrossRef]
  54. Sas, H. Lake restoration by reduction of nutrient loading: Expectations, experiences, extrapolations. Int. Ver. Für Theor. Und Angew. Limnol. Verh. 1990, 24, 247–251. [Google Scholar] [CrossRef]
  55. Gulati, R.D.; Donk, E.V. Lakes in the Netherlands, their origin, eutrophication and restoration: State-of-the-art review. In Ecological Restoration of Aquatic and Semi-Aquatic Ecosystems in The Netherlands (NW Europe); Springer: Dordrecht, The Netherlands, 2002; pp. 73–106. [Google Scholar]
  56. Ertel, J.R.; Hedges, J.I. Sources of sedimentary humic substances: Vascular plant debris. Geochim. Et Cosmochim. Acta 1985, 49, 2097–2107. [Google Scholar] [CrossRef]
  57. He, M.; Shi, Y.; Lin, C. Characterization of humic acids extracted from the sediments of the various rivers and lakes in China. J. Environ. Sci. 2008, 20, 1294–1299. [Google Scholar] [CrossRef]
Figure 1. Ponds and sampling locations.
Land 11 01676 g001
Figure 2. Landscape profile of each pond after ecological remediation design.
Land 11 01676 g002
Figure 3. Water transparencies for ponds 1, 2, 3, and 4.
Land 11 01676 g003
Figure 4. Chl a RAR values for each pond.
Land 11 01676 g004
Figure 5. TN RAR values for each pond.
Land 11 01676 g005
Figure 6. TP RAR values for each pond.
Land 11 01676 g006
Figure 7. COD RAR values for each pond.
Land 11 01676 g007
Figure 8. The 3DEEMFS of each pond in September of the third experimental year.
Land 11 01676 g008
Figure 9. Sectional perspective of the in situ ecological self-purification model.
Land 11 01676 g009
Table 1. Description of each pond.
Pond No.Description of Pond Revetment and LakebedArea (m2)Depth (m)
0Hardened vertical revetments, flat lakebed, no aquatic macrophytes411,6001.9
1Hardened vertical revetment and lakebed, flat lakebed, no aquatic macrophytes7701.1
2Same as pond 161001.6
3Same as pond 16801.2
4Same as pond 119001.5
5Natural lakebed, gentle slope revetment, healthy aquatic macrophyte communities12,1001.2 (average)
Table 2. Mini-engineering design and aquatic macrophyte configuration of each pond.
Pond No.Mini-Engineering DesignAquatic Macrophyte Species
Revetment Stepped Planting Bed
(Yes/No)
Submerged Planting Bed
(Yes/No)
Floating-Leaved Plant
(Yes/No)
Emergent Plant
(Yes/No)
Submerged Plant
(Yes/No)
1NN---
2YNYYN
3YYYYY
4YYYYY
5--YYY
Table 3. Types and species of aquatic macrophytes in each pond.
Pond No.Types Aquatic Macrophyte SpeciesNumber of Species
1---
2Floating-leaved and emergent plantsNelumbo nucifera, Acorus calamus, Scirpus tabernaemontani, Arundo donax, Lythrum salicaria, Thalia dealbata6
3Floating-leaved and emergent plantsNelumbo nucifera, Acorus calamus, Scirpus tabernaemontani3
Submerged plantsMyriophyllum spicatum, Najas marina, Najas minor3
4Floating-leaved and emergent plantsNelumbo nucifera, Acorus calamus, Scirpus tabernaemontani, Arundo donax, Lythrum salicaria, Thalia dealbata6
Submerged plantsMyriophyllum spicatum, Najas marina, Najas minor3
5Floating-leaved and emergent plantsNelumbo nucifera, Acorus calamus, Scirpus tabernaemontani, Arundo donax, Lythrum salicaria, Phragmites communis, Typha orientalis, Thalia dealbata, Sagittaria trifolia9
Submerged plantsMyriophyllum spicatum, Najas marina, Najas minor, Potamogeton crispus, Potamogeton perfoliatus5
Table 4. Planting density and density change of aquatic macrophytes in the second and third experimental years.
Pond No.SpeciesDensity 1 1
(m2)
Density 2 2
(m2)
Change 1 3
(m2)
Density 3 4
(m2)
Change 2 5
(m2)
2Nelumbo nucifera1.02.1+1.12.7+0.6
Acorus calamus12.022.3+10.329.7+7.4
Scirpus tabernaemontani20.034.7+14.746.7+12.0
Arundo donax6.09.5+3.512.3+2.8
Lythrum salicaria12.018.6+6.623.4+4.8
Thalia dealbata8.013.9+5.917.8+3.9
3Nelumbo nucifera1.01.8+0.82.7+0.9
Acorus calamus12.019.7+7.726+6.3
Scirpus tabernaemontani20.035.3+15.344.8+9.5
Myriophyllum spicatum15.020.2+5.228.9+8.7
Najas marina15.018.2+3.225.3+7.1
Najas minor15.021.6+6.631.8+10.2
4Nelumbo nucifera1.02.2+1.22.8+0.6
Acorus calamus12.024.6+12.628.4+3.8
Scirpus tabernaemontani20.043.0+23.050.9+7.9
Arundo donax6.012.8+4.814.6+1.8
Lythrum salicaria12.019.9+7.924.5+4.6
Thalia dealbata8.018.4+7.118.4+3.3
Myriophyllum spicatum15.019.4+4.427.5+8.1
Najas marina15.012.9−2.120.7+7.8
Najas minor15.019.7+4.729.1+9.4
1 Density 1: The planting density of aquatic macrophytes during reconstruction for ecological remediation from March to May of the second experimental year; 2 Density 2: The growth density of aquatic macrophytes by October of the second experimental year; 3 Change 1: Compared with “Density 1”, the growth density changes of aquatic macrophytes by October of the second experimental year; 4 Density 3: The growth density of aquatic macrophytes by October of the third experimental year; 5 Change 2: Compared with “Density 2”, the growth density changes of aquatic macrophytes by October of the third experimental year.
Table 5. Quarterly statistics of the average value of water transparency (cm) and RAF 1 at each pond.
Pond No.1st Year
(Water Transparency)
2nd Year
(Water Transparency/RAF)
3rd Year
(Water Transparency/RAF)
SpringSummerAutumnSpringSummerAutumnSpringSummerAutumn
141557146/1.1243/0.7837/0.5255/1.3449/0.8960/0.85
264528691/1.4263/1.2171/0.8385/1.3378/1.5081/0.94
355478584/1.5367/1.4383/0.9881/1.4783/1.7788/1.04
4-417599/-71/1.7399/1.32102/-96/2.3497/1.29
1 RAF: The ratio of the assessed water transparency to that of the same period in the 1st year.
Table 6. Statistics of the RAR of the quarterly average Chl a value 1 at each pond.
Pond No.1st Year
(RAR of Chl a)
2nd Year
(RAR of Chl a)
3rd Year
(RAR of Chl a)
SpringSummerAutumnSpringSummerAutumnSpringSummerAutumn
20.58 1.56 1.30 1.68 0.93 0.85 1.26 0.67 0.53
31.61 2.17 0.99 1.18 0.30 0.47 0.65 0.07 0.13
4-1.32 0.80 1.04 0.33 0.40 0.66 0.19 0.23
50.530.150.390.590.210.180.540.260.33
1 RAR of the quarterly average Chl a value: The ratio of the average value of quarterly Chl a values at the different remediated ponds to that at the reference pond (pond 1) in the same period of the current year.
Table 7. Statistics of the RAR of the quarterly average TN value 1 at each pond.
Pond No.1st Year
(RAR of TN)
2nd Year
(RAR of TN)
3rd Year
(RAR of TN)
SpringSummerAutumnSpringSummerAutumnSpringSummerAutumn
20.54 0.80 0.75 1.09 0.76 0.71 0.65 0.82 0.69
30.66 1.01 0.82 0.69 0.67 0.56 0.56 0.38 0.41
4-0.77 0.80 0.49 0.66 0.53 0.63 0.46 0.42
50.630.610.321.050.690.480.600.560.52
1 RAR of the quarterly average TN value: The ratio of the average value of quarterly TN values at the different remediated ponds to that at the reference pond (pond 1) in the same period of the current year.
Table 8. Statistics of the RAR of the quarterly average TP value 1 at each pond.
Pond No.1st Year
(RAR of TP)
2nd Year
(RAR of TP)
3rd Year
(RAR of TP)
SpringSummerAutumnSpringSummerAutumnSpringSummerAutumn
20.93 1.22 1.21 0.71 1.04 1.25 1.15 1.23 1.00
30.90 1.78 1.32 1.13 1.25 0.90 1.02 0.68 0.66
4-0.94 1.36 0.71 0.80 0.67 0.76 0.61 0.66
50.900.950.700.420.550.550.820.730.64
1 RAR of the quarterly average TP value: The ratio of the average value of quarterly TP values at the different remediated ponds to that at the reference pond (pond 1) in the same period of the current year.
Table 9. Statistics of the RAR 1 of the quarterly average COD value at each pond.
Pond No.1st Year
(RAR of COD)
2nd Year
(RAR of COD)
3rd Year
(RAR of COD)
SpringSummerAutumnSpringSummerAutumnSpringSummerAutumn
20.86 0.80 0.77 1.23 0.71 0.83 0.73 1.75 0.84
31.03 0.79 0.88 1.43 0.67 0.64 1.07 0.66 0.95
4-0.83 0.86 0.68 0.51 1.00 0.85 0.52 0.79
50.830.881.221.380.690.701.010.710.72
1 RAR of the quarterly average COD value: The ratio of the average value of quarterly COD values at the different remediated ponds to that at the reference pond (pond 1) in the same period of the current year.
Publisher’s Note: MDPI stays neutral with regard to jurisdictional claims in published maps and institutional affiliations.

