Applying SBM-GPA Model to Explore Urban Land Use Efficiency Considering Ecological Development in China
Abstract
:1. Introduction
2. Current State of the Art on Describing and Measuring ULUE
3. Data and Methods
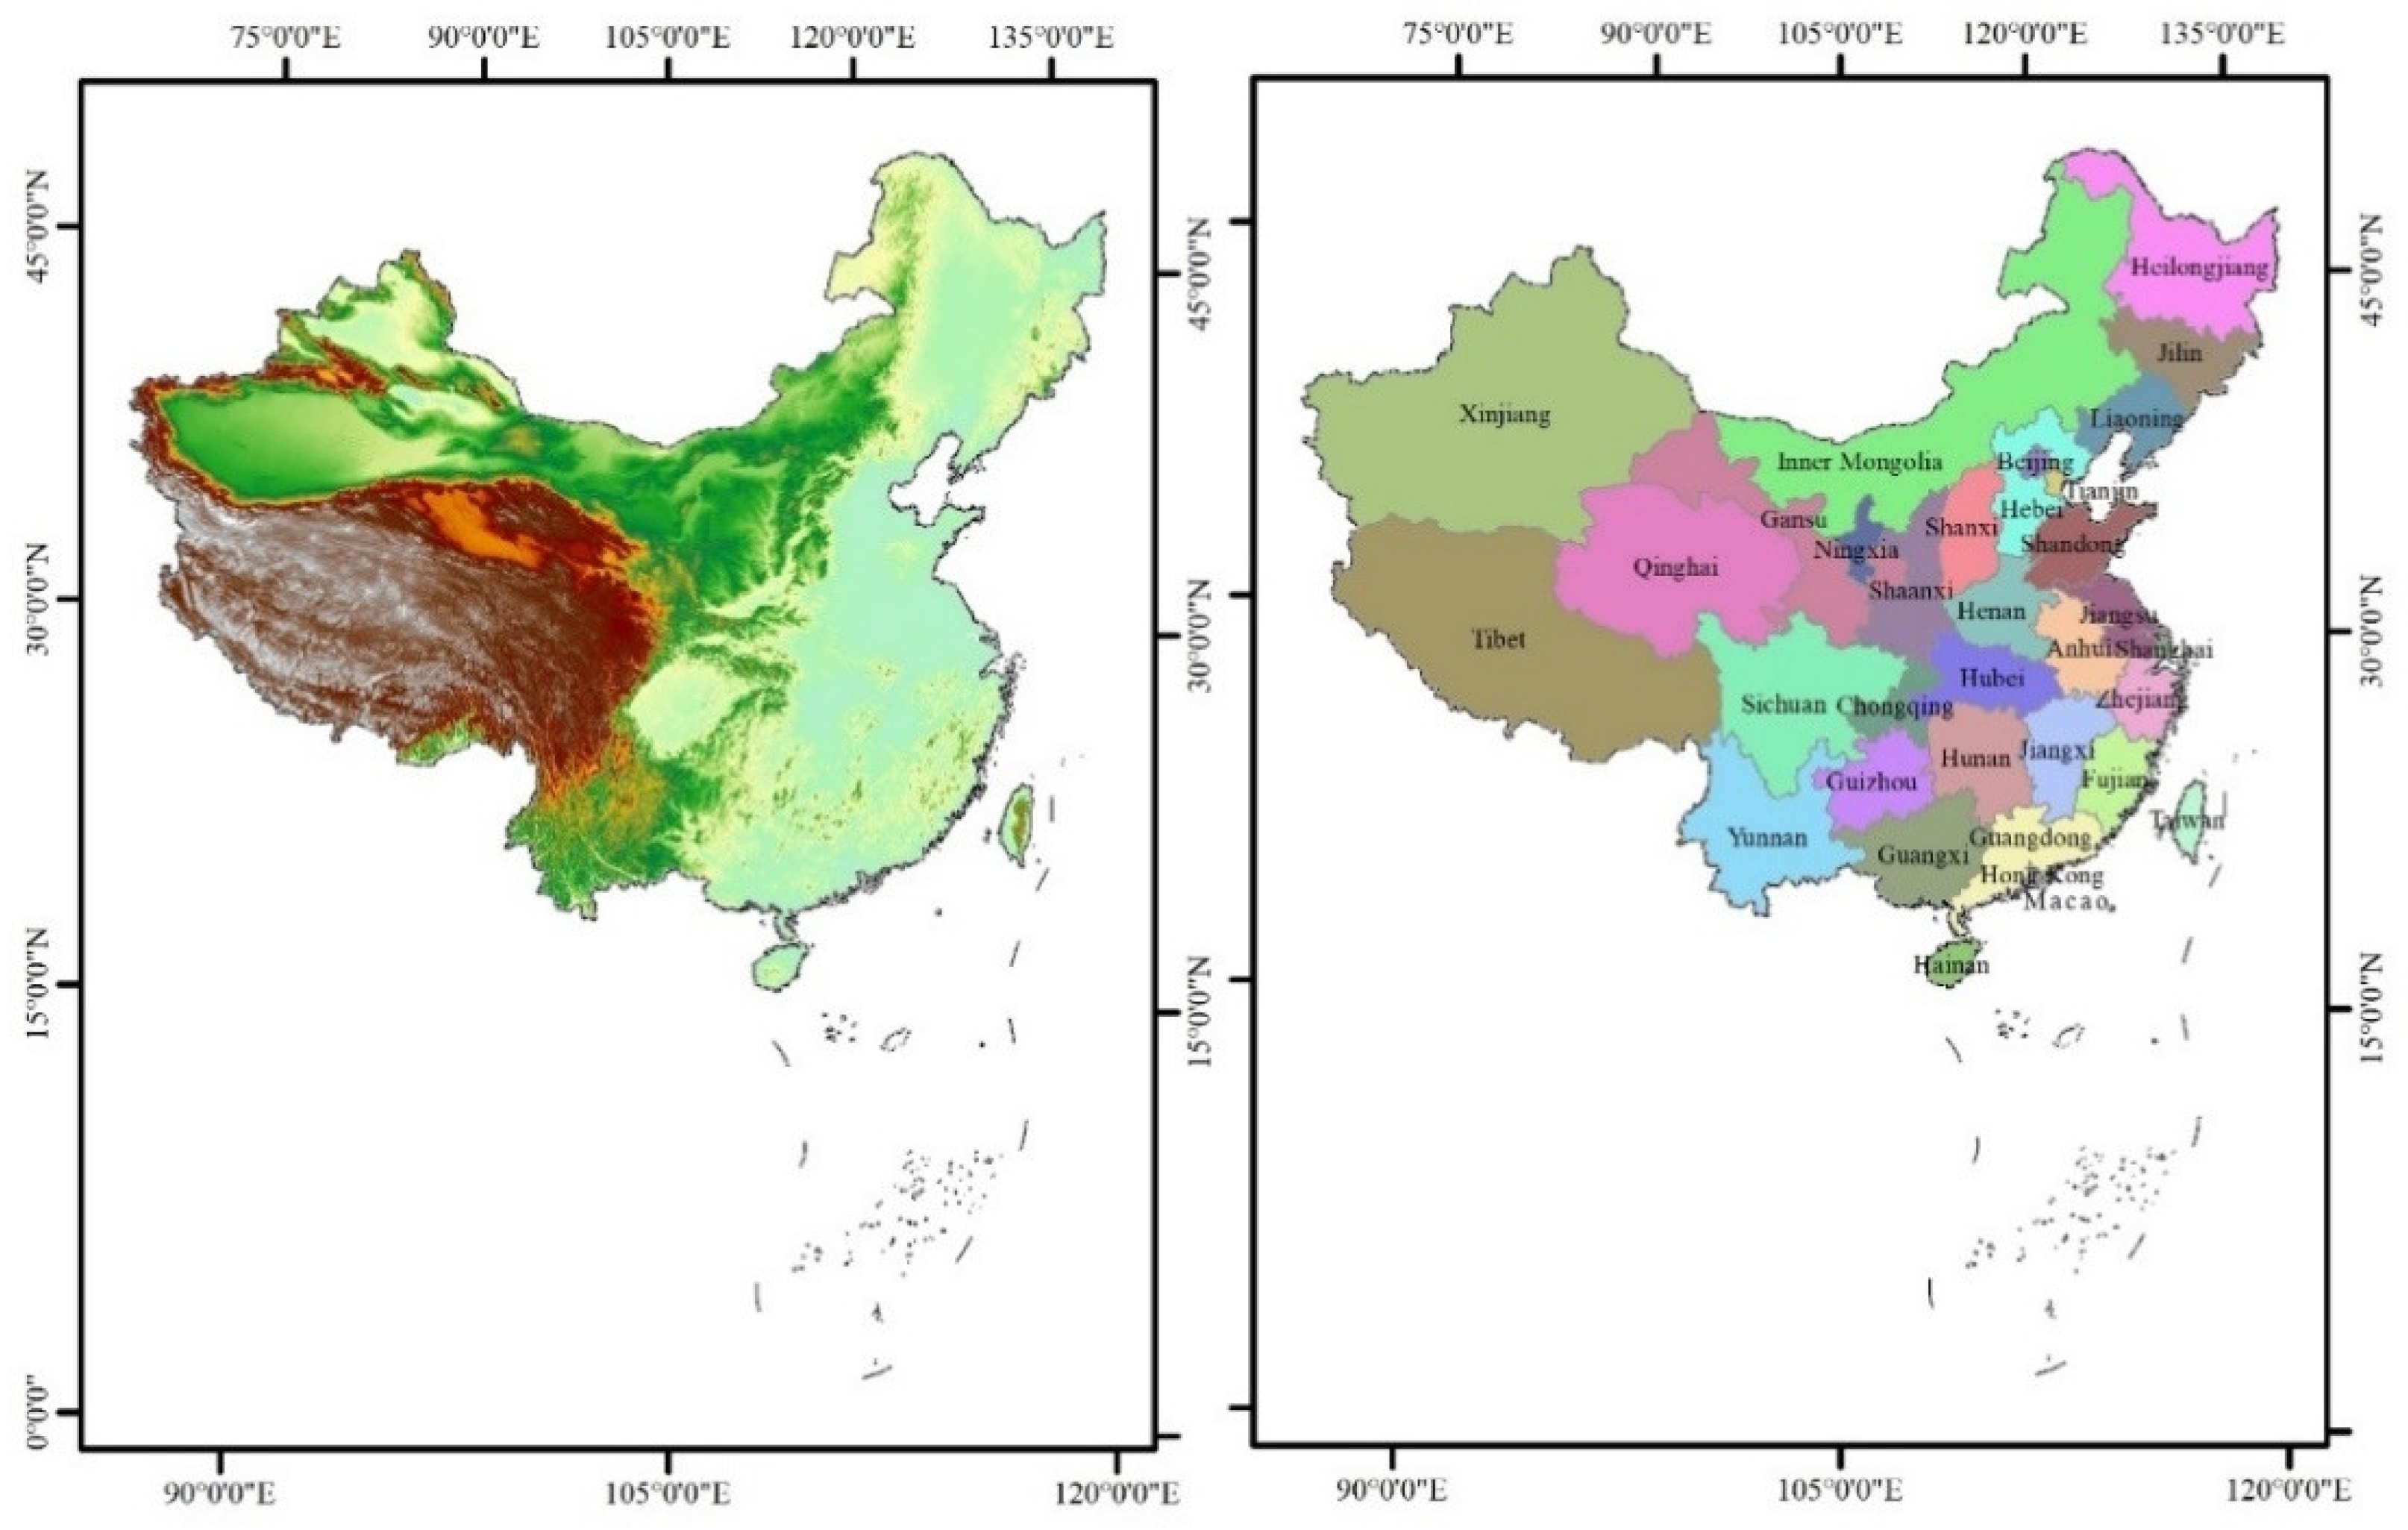
3.1. Data
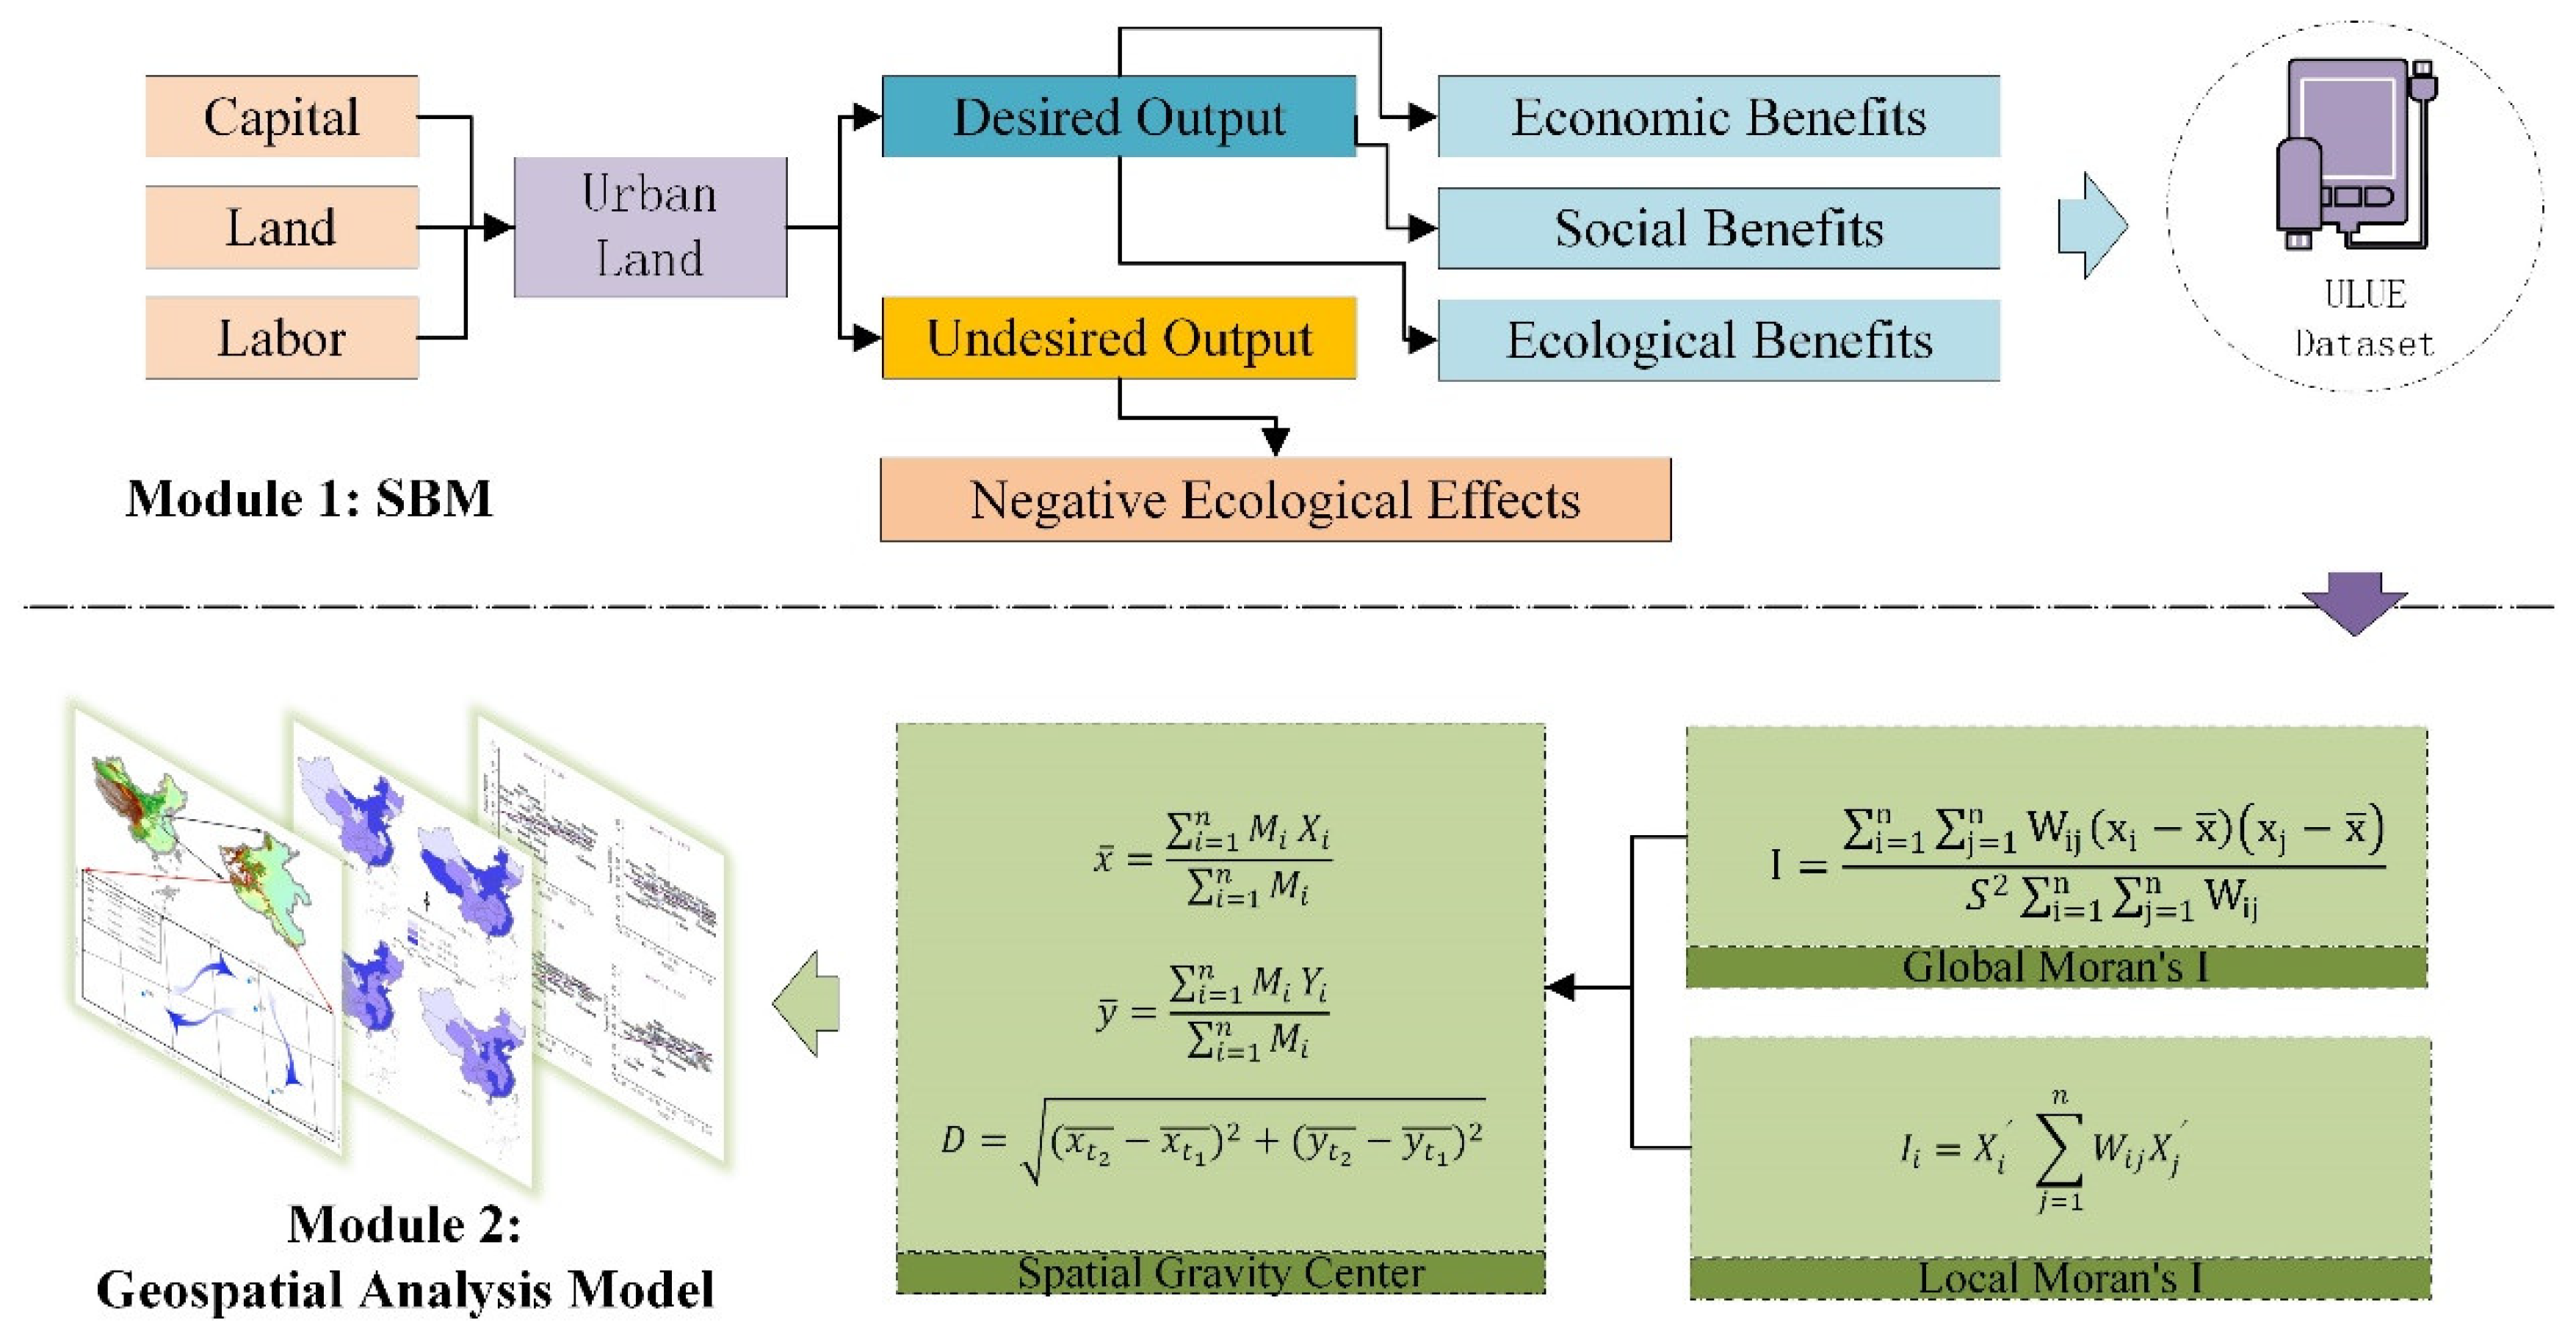
3.2. Methods
3.2.1. SBM Model
3.2.2. Geospatial Analysis Methods
Spatial Autocorrelation Model
Spatial Gravity Center Model
4. Results
4.1. Evaluation of Provincial Urban Land Use Efficiency
4.2. Geospatial Analysis of Provincial Urban Land Use Efficiency
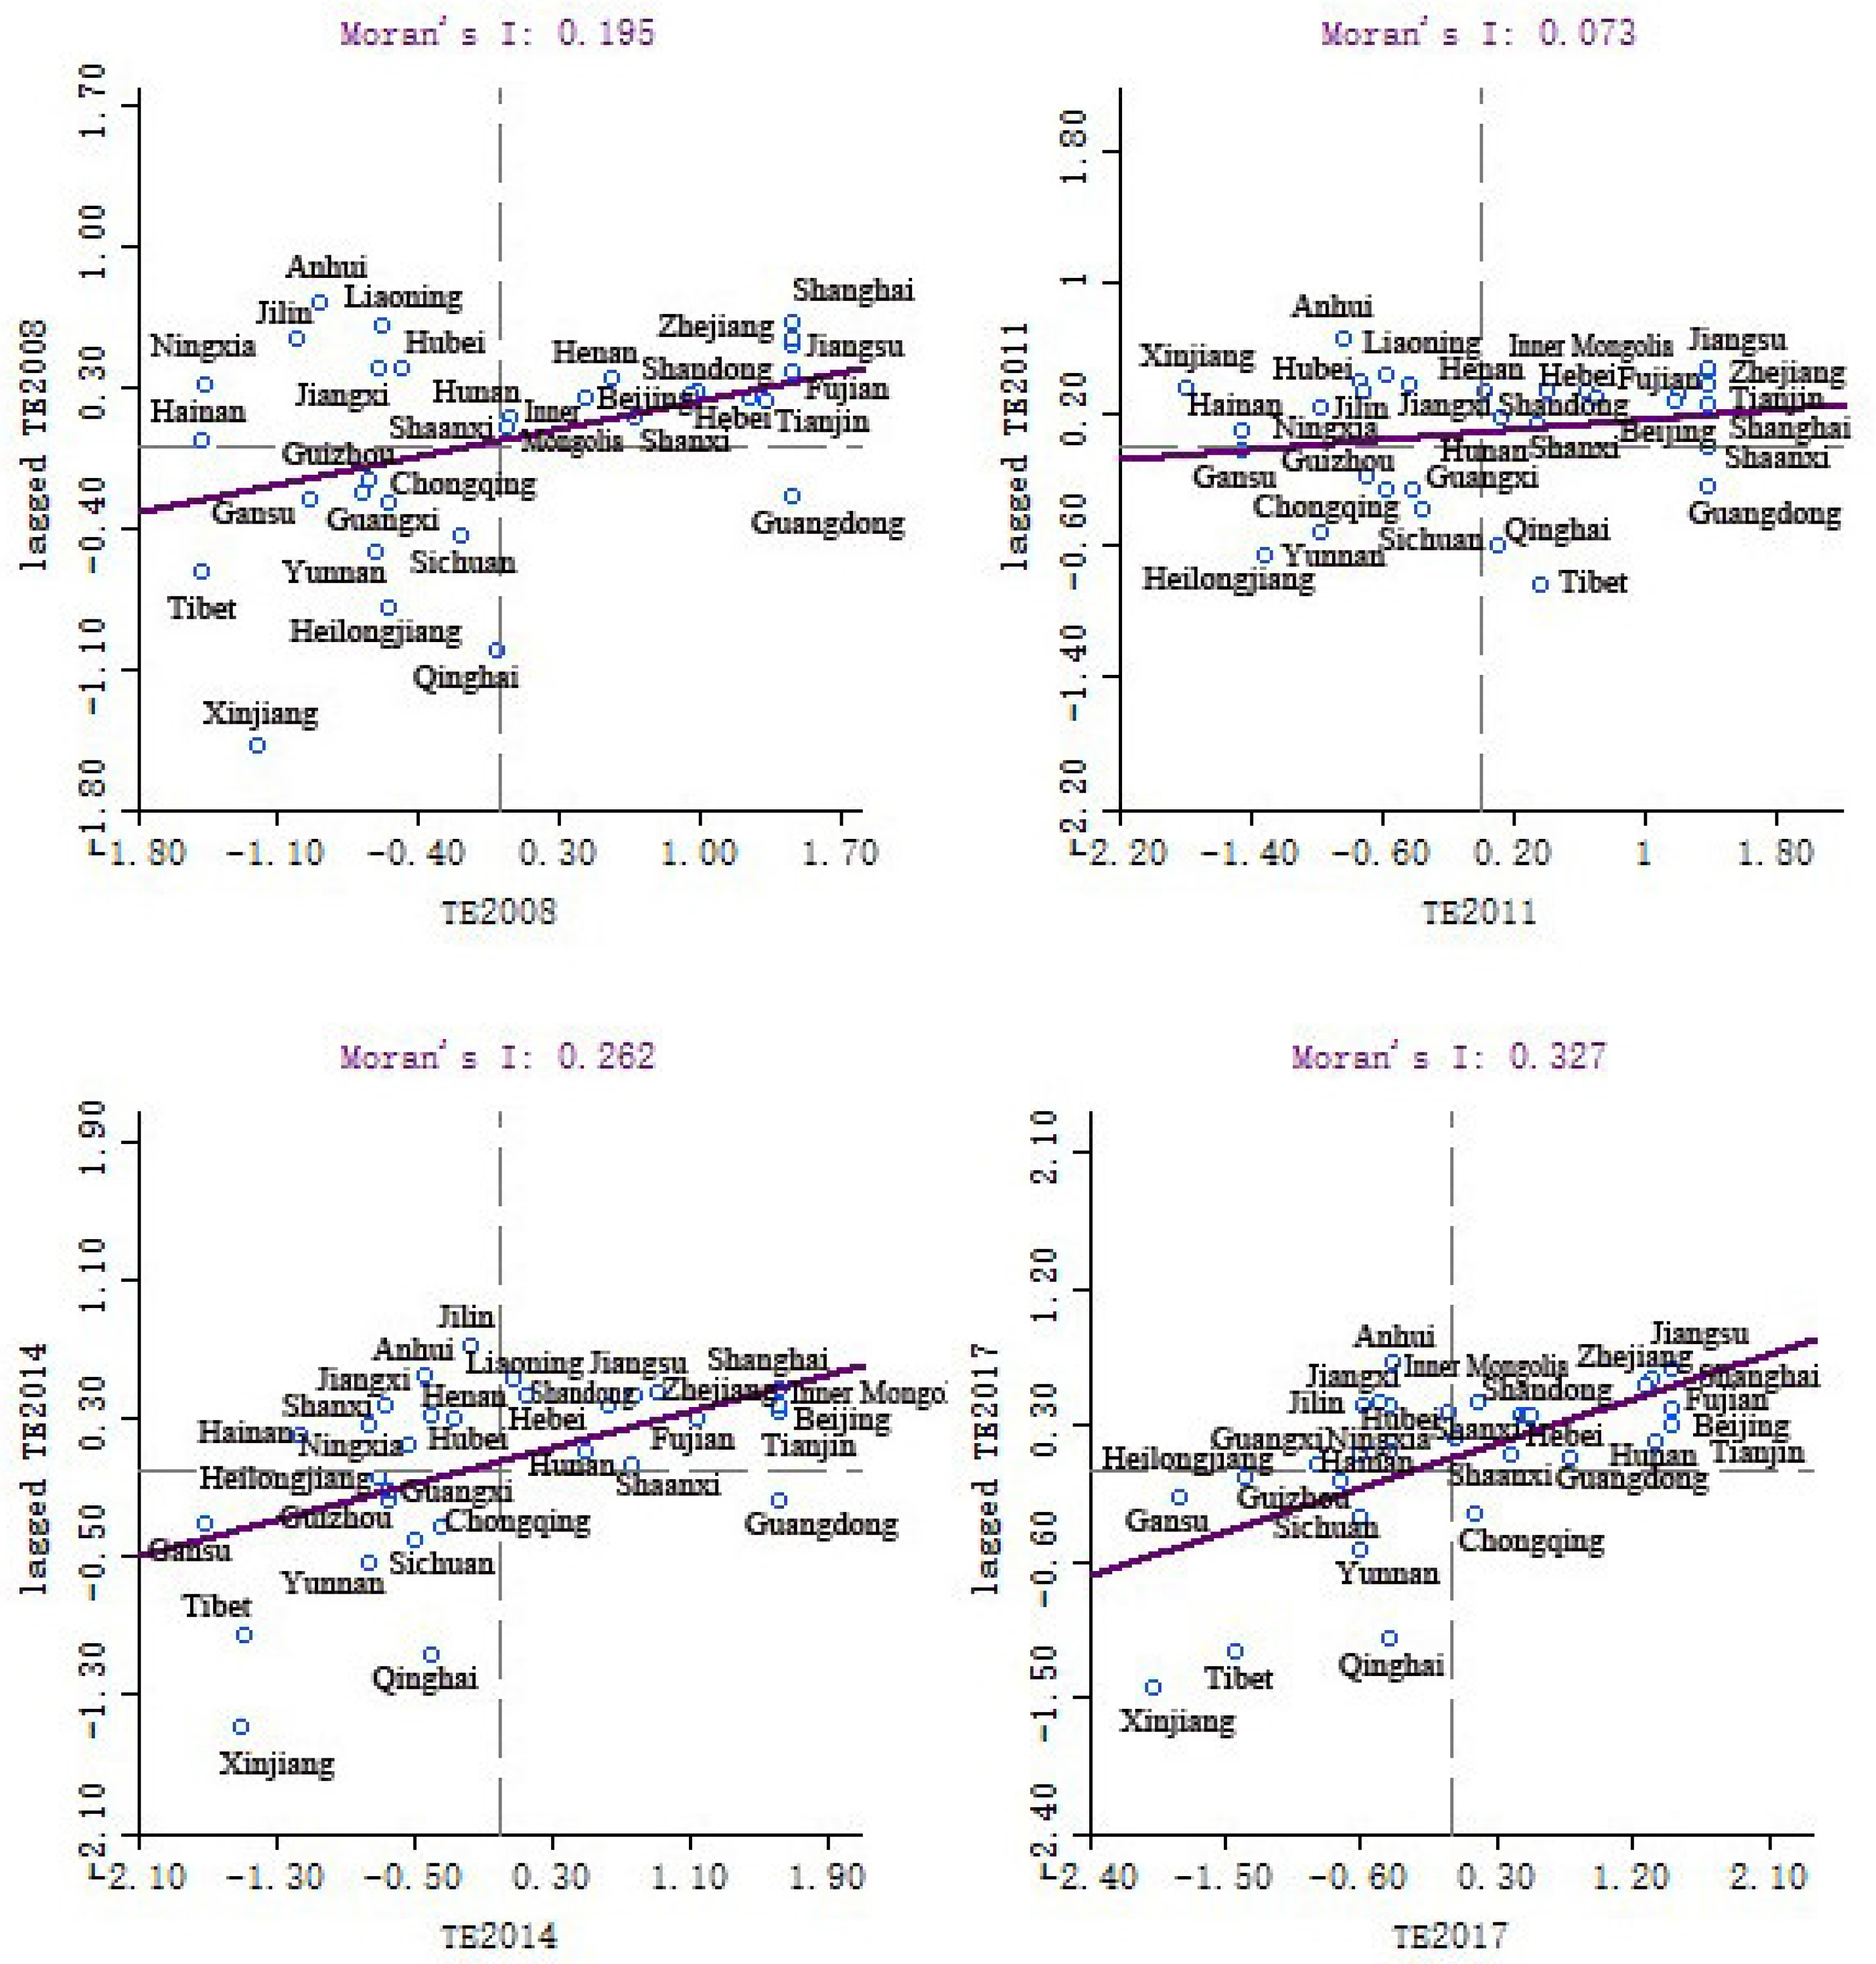
4.2.1. Spatial Correlation Analysis
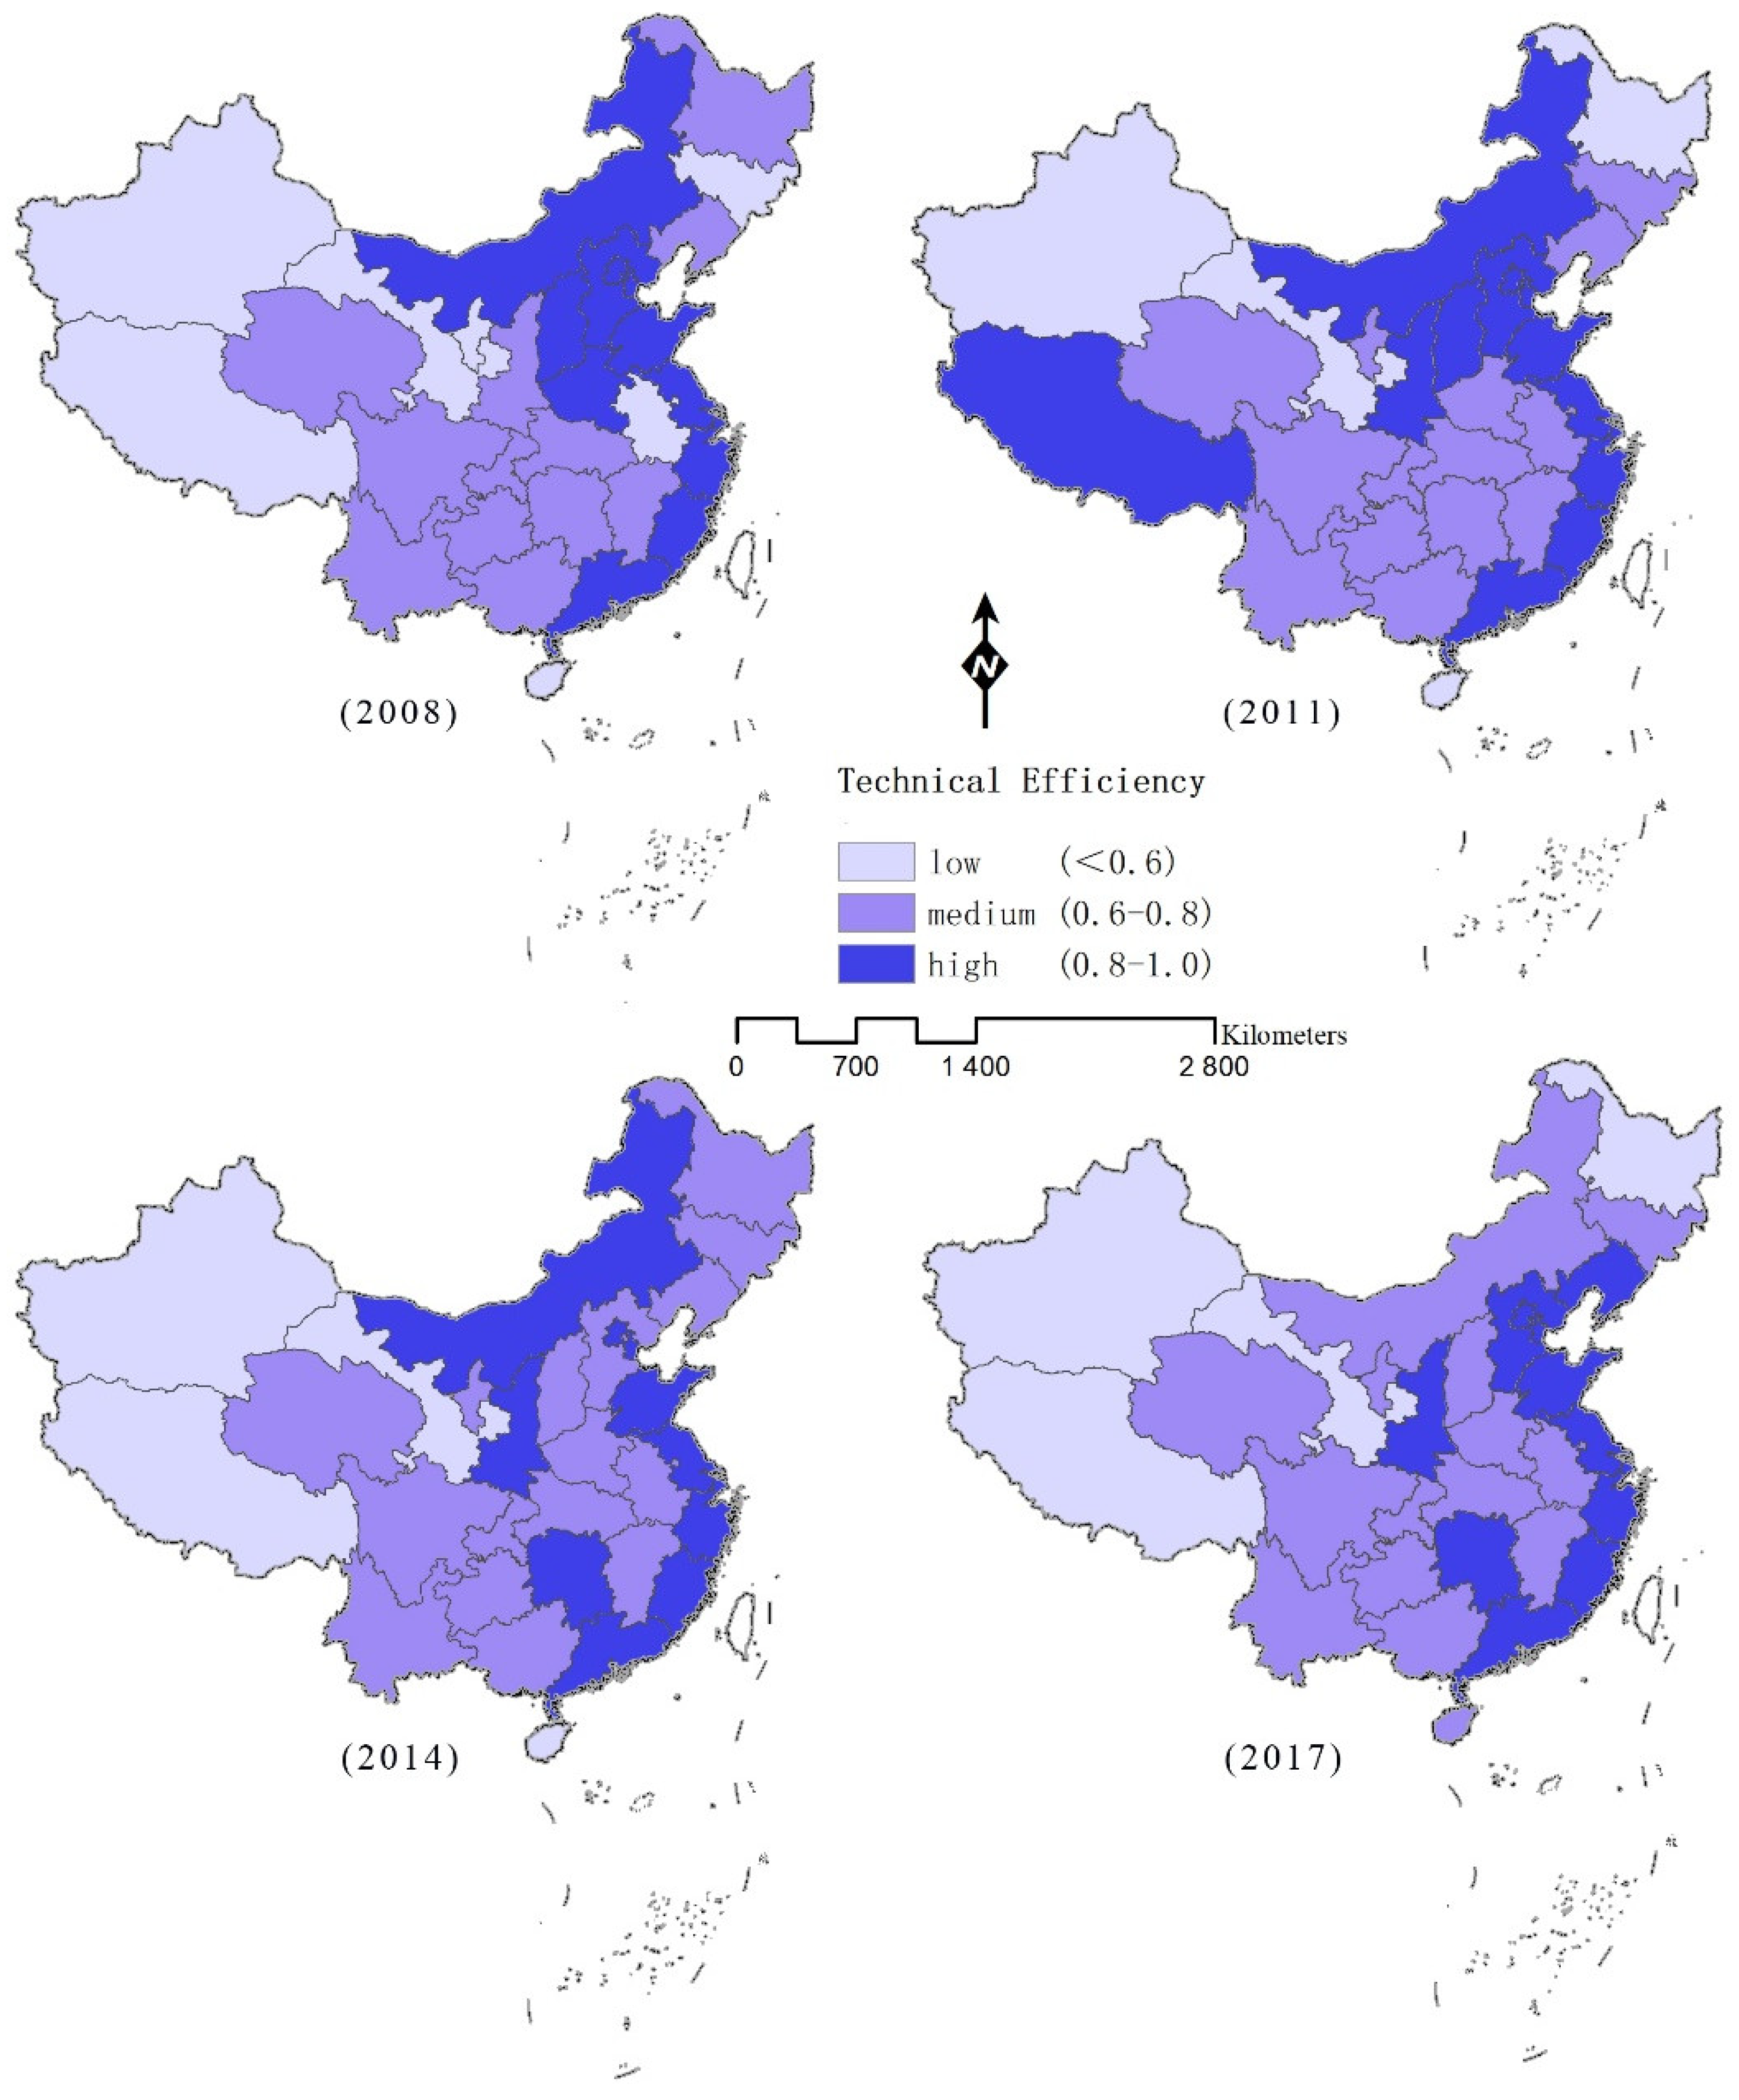
4.2.2. Spatial Feature Analysis
4.2.3. Gravity Center Analysis
5. Discussion
6. Conclusions
Author Contributions
Funding
Institutional Review Board Statement
Informed Consent Statement
Data Availability Statement
Conflicts of Interest
References
- Huang, J.; Xue, D. Study on temporal and spatial variation characteristics and influencing factors of land use efficiency in Xi’an, China. Sustainability 2019, 11, 6649. [Google Scholar] [CrossRef] [Green Version]
- Zhang, L.; Zhang, L.; Xu, Y.; Zhou, P.; Yeh, C.-H. Evaluating urban land use efficiency with interacting criteria: An empirical study of cities in Jiangsu China. Land Use Policy 2020, 90, 104292. [Google Scholar] [CrossRef]
- Zhu, X.; Zhang, P.; Wei, Y.; Li, Y.; Zhao, H. Measuring the efficiency and driving factors of urban land use based on the DEA method and the PLS-SEM model—a case study of 35 large and medium-sized cities in China. Sustain. Cities Soc. 2019, 50, 101646. [Google Scholar] [CrossRef]
- Zhang, S. Land-Centered urban politics in transitional China–can they be explained by growth machine theory? Cities 2014, 41, 179–186. [Google Scholar] [CrossRef]
- Cheng, X.; Li, N.; Mu, H.; Guo, Y.; Jiang, Y. Study on total-factor energy efficiency in three provinces of northeast China based on SBM model. Energy Procedia 2018, 152, 131–136. [Google Scholar] [CrossRef]
- Chen, Y.; Chen, Z.; Xu, G.; Tian, Z. Built-up land efficiency in urban China: Insights from the General land use plan (2006–2020). Habitat Int. 2016, 51, 31–38. [Google Scholar] [CrossRef]
- He, S.; Yu, S.; Li, G.; Zhang, J. Exploring the influence of urban form on land-use efficiency from a spatiotemporal heterogeneity perspective: Evidence from 336 Chinese cities. Land Use Policy 2020, 95, 104576. [Google Scholar] [CrossRef]
- Bren d’Amour, C.; Reitsma, F.; Baiocchi, G.; Barthel, S.; Güneralp, B.; Erb, K.-H.; Haberl, H.; Creutzig, F.; Seto, K.C. Future urban land expansion and implications for global croplands. Proc. Natl. Acad. Sci. USA 2017, 114, 8939–8944. [Google Scholar] [CrossRef] [PubMed] [Green Version]
- Wang, Y.; Song, G. The benefits evaluation method and application of urban land use. Geogr. Sin. 2006, 26, 743–748. (In Chinese) [Google Scholar]
- Cui, X.; Fu, S.; Wei, Y. An integrated methodology in exploring the influential factors underlying the quality of land urbanization. J. Nonlinear Convex Anal. 2019, 20, 1065–1075. [Google Scholar]
- Liu, Y. Introduction to land use and rural sustainability in China. Land Use Policy 2018, 74, 1–4. [Google Scholar] [CrossRef]
- Zhu, X.; Li, Y.; Zhang, P.; Wei, Y.; Zheng, X.; Xie, L. Temporal–Spatial characteristics of urban land use efficiency of China’s 35mega cities based on DEA: Decomposing technology and scale efficiency. Land Use Policy 2019, 88, 104083. [Google Scholar] [CrossRef]
- Lü, G.; Batty, M.; Strobl, J.; Lin, H.; Zhu, A.-X.; Chen, M. Reflections and speculations on the progress in geographic information systems (GIS): A geographic perspective. Int. J. Geogr. Inf. Sci. 2019, 33, 346–367. [Google Scholar] [CrossRef]
- Deng, J.; Desjardins, M.R.; Delmelle, E.M. An Interactive platform for the analysis of landscape patterns: A cloud-based parallel approach. Ann. GIS 2019, 25, 99–111. [Google Scholar] [CrossRef] [Green Version]
- Chen, M.; Voinov, A.; Ames, D.P.; Kettner, A.J.; Goodall, J.L.; Jakeman, A.J.; Barton, M.C.; Harpham, Q.; Cuddy, S.M.; DeLuca, C.; et al. Position paper: Open web-distributed integrated geographic modelling and simulation to enable broader participation and applications. Earth Sci. Rev. 2020, 207, 103223. [Google Scholar] [CrossRef]
- Rana, V.K.; Suryanarayana, T.M.V. GIS-Based multi criteria decision making method to identify potential runoff storage zones within watershed. Ann. GIS 2020, 26, 149–168. [Google Scholar] [CrossRef] [Green Version]
- Jiao, L.; Xu, Z.; Xu, G.; Zhao, R.; Liu, J.; Wang, W. Assessment of urban land use efficiency in China: A perspective of scaling law. Habitat Int. 2020, 99, 102172. [Google Scholar] [CrossRef]
- He, H.; Peng, C. The spatial-temporal evolution and the interactive effect between urban industrial structure transformation and land use efficiency. Geogr. Res. 2017, 36, 1271–1282. (In Chinese) [Google Scholar]
- Lu, X.; Kuang, B.; Zhou, M. Spatial Inequality and influencing factors of utilization efficiency of urban construction land. China Popul. Resour. Environ. 2016, 26, 45–52. (In Chinese) [Google Scholar]
- Masini, E.; Tomao, A.; Barbati, A.; Corona, P.; Serra, P.; Salvati, L. Urban growth, land-use efficiency and local socioeconomic context: A comparative analysis of 417 metropolitan regions in Europe. Environ. Manag. 2019, 63, 322–337. [Google Scholar] [CrossRef] [PubMed]
- Fetzel, T.; Niedertscheider, M.; Haberl, H.; Krausmann, F.; Erb, K.-H. Patterns and changes of land use and land-use efficiency in Africa 1980–2005: An analysis based on the human appropriation of net primary production framework. Reg. Environ. Chang. 2016, 16, 1507–1520. [Google Scholar] [CrossRef]
- Huang, H.; Peng, X. Urban Land Use Efficiency changes and improvement strategies from a decoupling perspective in Nanchang city. Resour. Sci. 2016, 38, 493–500. (In Chinese) [Google Scholar]
- Zitti, M.; Ferrara, C.; Perini, L.; Carlucci, M.; Salvati, L. Long-Term urban growth and land use efficiency in southern Europe: Implications for sustainable land management. Sustainability 2015, 7, 3359–3385. [Google Scholar] [CrossRef] [Green Version]
- Cui, X.; Yang, S.; Zhang, G.; Liang, B.; Li, F. An exploration of a synthetic construction land use quality evaluation based on economic-social-ecological coupling perspective: A case study in major Chinese cities. IJERPH 2020, 17, 3663. [Google Scholar] [CrossRef]
- Ke, X.; Yang, B.; Liu, S.; Ma, C. Optimization of interregional built-up land allocation based on differences of land use efficiency: A case study of Wuhan metropolitan. Resour. Environ. Yangtze Basin 2014, 23, 1502–1509. (In Chinese) [Google Scholar]
- Zhao, W.; Luo, Y.; Wang, L. Influencing factors for the using efficiency of china’s construction land: Analysis based on the provincial panel data in 2003–2012. Urban Probl. 2016, 2, 4–13. (In Chinese) [Google Scholar]
- Jin, G.; Deng, X.; Zhao, X.; Guo, B.; Yang, J. Spatio-Temporal patterns of urban land use efficiency in the yangtze river economic zone during 2005–2014. Sci. Geogr. Sin. 2018, 73, 1242–1252. (In Chinese) [Google Scholar]
- Yue, L.; Li, W.; Economics, S.O.; University, L. Typical urban land use efficiency in china under environmental constraints based on ddf-global malmquist-luenberger index modeling. Resour. Sci. 2017, 39, 597–607. (In Chinese) [Google Scholar]
- Li, Y.; Shu, B.; Wu, Q. Urban land use efficency in China: Spatial and temporal characteristics, regional difference and influence factors. Econ. Geogr. 2014, 34, 133–139. (In Chinese) [Google Scholar]
- Choi, Y.; Wang, N. The Economic efficiency of urban land use with a sequential slack-based model in Korea. Sustainability 2017, 9, 79. [Google Scholar] [CrossRef] [Green Version]
- Herzig, A.; Nguyen, T.T.; Ausseil, A.-G.E.; Maharjan, G.R.; Dymond, J.R.; Arnhold, S.; Koellner, T.; Rutledge, D.; Tenhunen, J. Assessing resource-use efficiency of land use. Environ. Model. Softw. 2018, 107, 34–49. [Google Scholar] [CrossRef]
- Cui, X. The spatial pattern and spillover effect of land-use efficiency. Econ. Manag. 2014, 28, 19–25. (In Chinese) [Google Scholar]
- Yang, K.; Wen, Q.; Zhong, T. Assessment of urban land use efficiency in the yangtze river economic belt. Resour. Sci. 2018, 40, 2048–2059. (In Chinese) [Google Scholar]
- Zhang, R.T.; Jiao, H.F. Urban land use efficiency pattern evolution and driving mechanism in the yangtze river economic belt. Resour. Environ. Yangtze Basin 2015, 24, 387–394. (In Chinese) [Google Scholar]
- Li, C.; Miao, M. Urban land use efficiency measurement of city group in middle reaches of yangtze river:Reality mechanism and spatiotemporal diversities. China Popul. Resour. Environ. 2017, 27, 157–164. (In Chinese) [Google Scholar]
- Lee, B.S. Land use regulations and efficiency of seoul’s economy. Int. J. Urban Sci. 1998, 2, 48–72. [Google Scholar] [CrossRef]
- Tone, K. A Slacks-Based measure of efficiency in data envelopment analysis. Eur. J. Oper. Res. 2001, 130, 498–509. [Google Scholar] [CrossRef] [Green Version]
- Charnes, A.; Cooper, W.W.; Rhodes, E. Measuring the efficiency of decision making units. Eur. J. Oper. Res. 1978, 2, 429–444. [Google Scholar] [CrossRef]
- Yang, H.; Hu, Y.; Wang, Q. Evaluation of land use efficiency in three major urban agglomerations of China in 2001–2012. Sci. Geogr. Sin. 2015, 35, 1095–1100. (In Chinese) [Google Scholar]
- Lu, X.; Chen, D.; Kuang, B.; Zhang, C.; Cheng, C. Is high-tech zone a policy trap or a growth drive? Insights from the perspective of urban land use efficiency. Land Use Policy 2020, 95, 104583. [Google Scholar] [CrossRef]
- Yang, K.; Zhong, T.; Zhang, Y.; Wen, Q. Total factor productivity of urban land use in China. Growth Chang. 2020, 51, 1784–1803. [Google Scholar] [CrossRef]
- Yang, Q.; Duan, X.; Ye, L.; Zhang, W. Efficiency evaluation of city land utilization in the yangtze river delta using a SBM-undesirable model. Resour. Sci. 2014, 36, 712–721. (In Chinese) [Google Scholar]
- Shan, L.; Jiang, Y.H.; Liu, C.C.; Wang, Y.F.; Zhang, G.H.; Cui, X.F.; Li, F. Exploring the multi-dimensional coordination relationship between population urbanization and land urbanization based on the MDCE model: A case study of the Yangtze River economic belt, China. PLoS ONE 2021, 16, e0253898. [Google Scholar] [CrossRef]
- Gao, X.; Zhang, A.; Sun, Z. How regional economic integration influence on urban land use efficiency? A case study of Wuhan metropolitan area, China. Land Use Policy 2020, 90, 104329. [Google Scholar] [CrossRef]
- Moran, P.A.P. Notes on continuous stochastic phenomena. Biometrika 1950, 37, 17–23. [Google Scholar] [CrossRef] [PubMed]
- Bao, H.; Shan, L.; Wang, Y.; Jiang, Y.; Lee, C.; Cui, X. How does local real estate investment influence neighborhood PM2.5 concentrations? A spatial econometric analysis. Land 2021, 10, 518. [Google Scholar] [CrossRef]
- Chen, X. Spatiotemporal mapping and multiple driving forces identifying of PM2.5 variation and its joint management strategies across China. J. Clean. Prod. 2020, 250, 119534. [Google Scholar] [CrossRef]
- Boots, B.N.; Gaile, G.L.; Willmott, C.J. Spatial statistics and models. Econ. Geogr. 1985, 61, 199. [Google Scholar] [CrossRef]
- Zhang, J.; Zhang, K.; Zhao, F. Research on the regional spatial effects of green development and environmental governance in China based on a spatial autocorrelation model. Struct. Chang. Econ. Dyn. 2020, 55, 1–11. [Google Scholar] [CrossRef]
- Schuurman, N.; Bérubé, M.; Crooks, V.A. Measuring potential spatial access to primary health care physicians using a modified gravity model. Can. Geogr. 2010, 5, 29–45. [Google Scholar] [CrossRef]
- Chai, J.; Wang, Z.; Yang, J.; Zhang, L. Analysis for spatial-temporal changes of grain production and farmland resource: Evidence from Hubei province, central China. J. Clean. Prod. 2019, 207, 474–482. [Google Scholar] [CrossRef]
- Anselin, L.; Li, X. Operational local join count statistics for cluster detection. J. Geogr. Syst. 2019, 21, 189–210. [Google Scholar] [CrossRef]
- Tang, Y.; Wang, K.; Ji, X.; Xu, H.; Xiao, Y. Assessment and spatial-temporal evolution analysis of urban land use efficiency under green development orientation: Case of the Yangtze river delta urban agglomerations. Land 2021, 10, 715. [Google Scholar] [CrossRef]
- Liu, Y.; Fang, F.; Li, Y. Key issues of land use in China and implications for policy making. Land Use Policy 2014, 40, 6–12. [Google Scholar] [CrossRef]
- Wu, R.; Li, Z.; Wang, S. The varying driving forces of urban land expansion in China: Insights from a spatial-temporal analysis. Sci. Total Environ. 2021, 766, 142591. [Google Scholar] [CrossRef]
- Liu, S.; Xiao, W.; Li, L.; Ye, Y.; Song, X. Urban land use efficiency and improvement potential in China: A stochastic frontier analysis. Land Use Policy 2020, 99, 105046. [Google Scholar] [CrossRef]
- Wang, A.; Lin, W.; Liu, B.; Wang, H.; Xu, H. Does smart city construction improve the green utilization efficiency of urban land? Land 2021, 10, 657. [Google Scholar] [CrossRef]


| Methods | Advantages | Disadvantages | Sources |
|---|---|---|---|
| Coupling Degree Model | Reflects the harmonious degree and benign coordination relationship of system components. | Only reflects the relationship between elements; cannot reflect the internal relationship of elements. | [24] |
| Cobb–Douglas Production Function | Effectively analyzes the impact of input on output and explores the relationship between the number of various production factors. | Cannot distinguish the difference between input factors, and the calculated results may not be consistent with the actual situation. | [25] |
| Data Envelopment Analysis (DEA) | A popular non-parametric method for evaluating the relative efficiency of decision-making units (DMUs) with multiple inputs and outputs. | Lacks input–output relaxation variables and neglects data measurement errors. | [26] |
| Stochastic Frontier Analysis (SFA) | A popular parametric method for considering the influence of random factors on output. | Cannot be used for multiple outputs, but can only be used for a single output. | [27] |
| Directional Distance Function (DDF) | Widely used to process efficiency evaluation and obtains unbiased dynamic efficiency evaluation results. | Lacks theoretical basis and does not discuss the choice of direction. | [28] |
| Theil Index | Reflects the overall difference and reveals the source of regional difference. | Does not consider how subsamples within a subpopulation are distributed. | [29] |
| Gini Coefficient | Quantitatively describes the characteristics of spatial differences and reveals the composition and source of spatial differences. | Reflects a general time point change, and cannot reflect the overall change process and situation. | [19] |
| Criteria Layer | Indicator Layer | Reference | ||
|---|---|---|---|---|
| Input indicators | Capital investment | Fixed asset investment. | [39] | |
| Land investment | Areas of urban land. | [40,41] | ||
| Labor input | Employees in the secondary and tertiary industries. | [40,41] | ||
| Output indicators | Desired output | Economic benefits | Added value of the secondary and tertiary industries. | [19,41,42,43] |
| Social benefits | Annual per capita disposable income of urban households. | [35] | ||
| Ecological benefits | Green coverage within built-up area. | [33,39,41] | ||
| Undesired output | Negative ecological effects | Industrial sulfur dioxide emissions. | [35,40,42] | |
| Province | 2008 | 2011 | 2014 | 2017 | ||||||||
|---|---|---|---|---|---|---|---|---|---|---|---|---|
| TE | PTE | SE | TE | PTE | SE | TE | PTE | SE | TE | PTE | SE | |
| Beijing | 0.9107 | 0.9291 | 0.9802 | 0.9651 | 0.9937 | 0.9713 | 1.0000 | 1.0000 | 1.0000 | 1.0000 | 1.0000 | 1.0000 |
| Tianjin | 0.9774 | 1.0000 | 0.9774 | 1.0000 | 1.0000 | 1.0000 | 1.0000 | 1.0000 | 1.0000 | 1.0000 | 1.0000 | 1.0000 |
| Hebei | 0.9638 | 0.9651 | 0.9987 | 0.8844 | 0.9587 | 0.9225 | 0.7656 | 0.3950 | 1.9381 | 0.8460 | 0.9485 | 0.8920 |
| Shanxi | 0.8579 | 0.8752 | 0.9802 | 0.8261 | 0.8285 | 0.9972 | 0.6172 | 0.4137 | 1.4919 | 0.7618 | 0.7800 | 0.9766 |
| Inner Mongolia | 0.8137 | 0.8296 | 0.9808 | 0.8765 | 0.9102 | 0.9630 | 1.0000 | 1.0000 | 1.0000 | 0.7549 | 0.7614 | 0.9915 |
| Liaoning | 0.6315 | 0.6340 | 0.9960 | 0.6716 | 0.6756 | 0.9941 | 0.7526 | 0.5164 | 1.4574 | 0.8417 | 0.8492 | 0.9912 |
| Jilin | 0.5541 | 0.5679 | 0.9758 | 0.6463 | 0.6633 | 0.9743 | 0.7131 | 0.3262 | 2.1861 | 0.6612 | 0.6791 | 0.9736 |
| Heilongjiang | 0.6365 | 0.6614 | 0.9623 | 0.5458 | 0.5545 | 0.9844 | 0.6273 | 0.3330 | 1.8836 | 0.5339 | 0.5427 | 0.9838 |
| Shanghai | 1.0000 | 1.0000 | 1.0000 | 1.0000 | 1.0000 | 1.0000 | 1.0000 | 1.0000 | 1.0000 | 1.0000 | 1.0000 | 1.0000 |
| Jiangsu | 1.0000 | 1.0000 | 1.0000 | 1.0000 | 1.0000 | 1.0000 | 0.8649 | 1.0000 | 0.8649 | 0.9777 | 1.0000 | 0.9777 |
| Zhejiang | 1.0000 | 1.0000 | 1.0000 | 1.0000 | 1.0000 | 1.0000 | 0.8851 | 1.0000 | 0.8851 | 0.9706 | 0.9858 | 0.9846 |
| Anhui | 0.5747 | 0.5826 | 0.9864 | 0.6270 | 0.6284 | 0.9978 | 0.6697 | 0.5325 | 1.2578 | 0.6941 | 0.7737 | 0.8971 |
| Fujian | 1.0000 | 1.0000 | 1.0000 | 0.9703 | 1.0000 | 0.9703 | 0.9245 | 1.0000 | 0.9245 | 1.0000 | 1.0000 | 1.0000 |
| Jiangxi | 0.6273 | 0.6362 | 0.9860 | 0.6949 | 0.7079 | 0.9816 | 0.6328 | 0.4159 | 1.5214 | 0.6792 | 0.6858 | 0.9903 |
| Shandong | 0.9146 | 0.9557 | 0.9570 | 0.8354 | 0.8811 | 0.9482 | 0.8413 | 0.6606 | 1.2736 | 0.8334 | 1.0000 | 0.8334 |
| Henan | 0.8397 | 0.8735 | 0.9613 | 0.7716 | 0.8480 | 0.9099 | 0.6985 | 1.0000 | 0.6985 | 0.7889 | 0.8331 | 0.9469 |
| Hubei | 0.6488 | 0.6551 | 0.9903 | 0.6446 | 0.6453 | 0.9989 | 0.6772 | 0.3878 | 1.7463 | 0.6893 | 0.7804 | 0.8833 |
| Hunan | 0.7448 | 0.7519 | 0.9906 | 0.7870 | 0.8162 | 0.9642 | 0.8182 | 0.5736 | 1.4264 | 0.9825 | 0.9958 | 0.9866 |
| Guangdong | 1.0000 | 1.0000 | 1.0000 | 1.0000 | 1.0000 | 1.0000 | 1.0000 | 1.0000 | 1.0000 | 0.8865 | 1.0000 | 0.8865 |
| Guangxi | 0.6175 | 0.6312 | 0.9784 | 0.6987 | 0.7013 | 0.9963 | 0.6369 | 0.3382 | 1.8833 | 0.6108 | 0.6232 | 0.9802 |
| Hainan | 0.4667 | 0.6441 | 0.7246 | 0.5227 | 0.5597 | 0.9339 | 0.5534 | 1.0000 | 0.5534 | 0.6916 | 0.8765 | 0.7891 |
| Chongqing | 0.6362 | 0.6492 | 0.9801 | 0.6709 | 0.6716 | 0.9990 | 0.6842 | 1.0000 | 0.6842 | 0.7824 | 0.7852 | 0.9965 |
| Sichuan | 0.7032 | 0.7040 | 0.9988 | 0.7090 | 0.7503 | 0.9450 | 0.6597 | 1.0000 | 0.6597 | 0.6578 | 0.7130 | 0.9225 |
| Guizhou | 0.6114 | 0.6497 | 0.9411 | 0.6493 | 0.6574 | 0.9877 | 0.6366 | 1.0000 | 0.6366 | 0.6373 | 0.6442 | 0.9893 |
| Yunnan | 0.6252 | 0.6383 | 0.9795 | 0.6046 | 0.6081 | 0.9941 | 0.6184 | 1.0000 | 0.6184 | 0.6565 | 0.6616 | 0.9923 |
| Tibet | 0.4687 | 1.0000 | 0.4687 | 0.8293 | 1.0000 | 0.8293 | 0.5016 | 1.0000 | 0.5016 | 0.5232 | 1.0000 | 0.5232 |
| Shaanxi | 0.7435 | 0.7503 | 0.9910 | 1.0000 | 1.0000 | 1.0000 | 0.8634 | 1.0000 | 0.8634 | 0.8225 | 0.8257 | 0.9961 |
| Gansu | 0.5666 | 0.6043 | 0.9376 | 0.5229 | 0.5330 | 0.9809 | 0.4643 | 0.3399 | 1.3659 | 0.4589 | 0.4817 | 0.9525 |
| Qinghai | 0.7346 | 1.0000 | 0.7346 | 0.7857 | 0.8269 | 0.9502 | 0.6759 | 1.0000 | 0.6759 | 0.6914 | 1.0000 | 0.6914 |
| Ningxia | 0.4713 | 0.5703 | 0.8265 | 0.6054 | 0.7352 | 0.8234 | 0.6549 | 1.0000 | 0.6549 | 0.6585 | 0.8105 | 0.8124 |
| Xinjiang | 0.5172 | 0.5440 | 0.9508 | 0.4674 | 0.4747 | 0.9846 | 0.4990 | 0.5815 | 0.8581 | 0.4325 | 0.4401 | 0.9826 |
| 2008 | 2011 | 2014 | 2017 | |
|---|---|---|---|---|
| Moran’s I | 0.195 | 0.073 | 0.262 | 0.327 |
| p value | 0.006 | 0.083 | 0.002 | 0.001 |
| Z scores | 2.9321 | 1.335 | 3.6201 | 4.4723 |
Publisher’s Note: MDPI stays neutral with regard to jurisdictional claims in published maps and institutional affiliations. |
© 2021 by the authors. Licensee MDPI, Basel, Switzerland. This article is an open access article distributed under the terms and conditions of the Creative Commons Attribution (CC BY) license (https://creativecommons.org/licenses/by/4.0/).
Share and Cite
Cui, X.; Huang, S.; Liu, C.; Zhou, T.; Shan, L.; Zhang, F.; Chen, M.; Li, F.; de Vries, W.T. Applying SBM-GPA Model to Explore Urban Land Use Efficiency Considering Ecological Development in China. Land 2021, 10, 912. https://doi.org/10.3390/land10090912
Cui X, Huang S, Liu C, Zhou T, Shan L, Zhang F, Chen M, Li F, de Vries WT. Applying SBM-GPA Model to Explore Urban Land Use Efficiency Considering Ecological Development in China. Land. 2021; 10(9):912. https://doi.org/10.3390/land10090912
Chicago/Turabian StyleCui, Xufeng, Sisi Huang, Cuicui Liu, Tingting Zhou, Ling Shan, Fengyuan Zhang, Min Chen, Fei Li, and Walter T. de Vries. 2021. "Applying SBM-GPA Model to Explore Urban Land Use Efficiency Considering Ecological Development in China" Land 10, no. 9: 912. https://doi.org/10.3390/land10090912
APA StyleCui, X., Huang, S., Liu, C., Zhou, T., Shan, L., Zhang, F., Chen, M., Li, F., & de Vries, W. T. (2021). Applying SBM-GPA Model to Explore Urban Land Use Efficiency Considering Ecological Development in China. Land, 10(9), 912. https://doi.org/10.3390/land10090912


