Abstract
Climate factors and human activities are the leading causes of changes in the hydrological cycle. In addition to being an important part of the hydrological cycle, runoff is also an important indicator for assessing the amount of available water. Therefore, it is necessary to explore the reasons that have caused changes in runoff. In this study, the causes of runoff changes in the alluvial fan of the Choshui River from 1980–2018 are explored. Two simple methods, including a decomposition method based on the Budyko structure and a method based on climate elasticity, for which the necessary data are easy to obtain, are used to quantify the impact of climate factors and human activities on runoff changes. The results show that the runoff in the long term shows a significant transition point in 2003, where climate factors have contributed more than 90% of the change, while the influence of human activities on the changes in runoff appears to be relatively small. Moreover, the Budyko method and the Normalized Difference Vegetation Index (NDVI) show that the vegetation cover has decreased. In addition to providing a simple method to assess the causes of changes in runoff, this study also analyzes the causes of changes in the runoff of the alluvial fan of the Choshui River to provide a reference for water resource policy and land use management.
1. Introduction
Runoff is an important indicator to measure whether available water can be supplied continuously. Evaluating the changes in runoff over time is an important challenge in water resources management [1,2]. Since the hydrological process is affected by climatological and human factors, the changes in runoff are due to climate factors and human activities. Therefore, understanding the causes of changes in runoff can help decision-makers formulate policies on managing water resources more efficiently [3,4,5]. Climate change can alter the availability of water and threaten water security [6]. Due to climate change, it is estimated that by 2050, more than 600 million people will have their available water reduced by more than 10% compared to current levels. The reduction in available water directly impacts agriculture, industry, domestic water supply, and water conservancy applications in rivers, including hydropower, navigation, entertainment, and ecological protection [7].
In the early days of the discussion on how climate factors and human activities change runoff, the classic paired catchment method was often used to analyze the impact of climate factors and human activities on runoff. This method needs to find catchment areas with similar conditions (e.g., climate environment, vegetation status, soil properties, area), and it is only suitable for small catchment areas. Subsequently, some scholars used the concept of ecohydrology to propose a simple method to assess the impact of changes in runoff. However, the main disadvantage of this method is the need for data of precipitation, actual evapotranspiration, meteorological parameters in the long term to estimate potential evapotranspiration, and historical records of changes in land use. Moreover, the method can only give qualitative results [8,9]. The more widely used methods in recent research studies can be roughly divided into the hydrological model and the Budyko framework. The hydrological model uses a series of equations and parameters to describe the characteristics of the watershed and estimate the runoff [10]. For example, Ma et al. [11] used the Geomorphology-Based Hydrological Model (GBHM) to explore the catchment area of the Miyun Reservoir in China, showing that climatic factors are the main influencing factor of changes in runoff flow. Wang et al. [12] used the Variable Infiltration Capacity (VIC) model to infer that the main reason for the changes in the flow of the Kuye River Basin in China is human activity. Dong et al. [13] used the Soil and Water Assessment Tool (SWAT) to assess the mechanism of flow rate change of the Jinghe River Basin in China from 1957 to 2008. The analysis results revealed human activity as the main influencing factor. The advantages of using hydrological models are based on the complete consideration of model parameters, boundary conditions, and the geometric characteristics of the catchment area, such that the results of the analysis are not only highly reliable but also consider spatial differences. However, many studies use data of a single point to represent the entire study area, leading to a high degree of uncertainty in hydrological models. In contrast, although the Budyko framework needs large-scale space and time for its establishment to avoid deviations, it can obtain the required information more easily and has a clear physical meaning [14,15,16].
Xu et al. [17] used the Budyko framework combined with climate elasticity to explore the mechanism that causes changes in runoff of the Haihe basin of China. This study divided the causes of runoff changes into climate and land use changes and found that land use changes were the main cause of changes in runoff. Wang and Hejazi [18] further proposed a decomposition method based on the Budyko framework to understand the causes of changes in runoff and used 27 catchment areas in the United States to verify the feasibility of the proposed method. Wu et al. [19] used the Budyko framework combined with climate elasticity to explore the reasons for the changes in runoff during the low-flow season and the high-flow season for the Loess Plateau. The results show that the main reason for the changes in runoff in the high-flow season is human activity, while the main reason for the changes in runoff in the low-flow season is climate factors.
The precipitation in Taiwan is significantly unevenly distributed in both time and space. The ratio of high and low rainfall periods is as high as 8:2 in the Choshui River Basin, and the precipitation decreases from mountainous areas to plains. The alluvial fan of the Choshui River, located in the plains, has an average annual precipitation lower than that of Taiwan, showing obvious uneven distribution in time and space [20]. The water use of the alluvial fan of the Choshui River was mainly for agriculture and fishery in the first half. Therefore, the development of groundwater that can provide a stable supply of water is required. However, the recent development of Yunlin and the Changhua Coastal Industrial Park has significantly increased water demand. The extraction of a large amount of groundwater has caused disasters such as stratum subsidence in many areas of the alluvial fan of the Choshui River. Therefore, to reduce the demand for groundwater and effectively allocate water resources, the government completed the Ji Ji Conjunctive Diversion Project in 2001. Currently, there is a lack of research studies on the causes of runoff changes in central Taiwan. This study takes into consideration the complex background of natural factors such as global warming, uneven distribution of precipitation in time and space, and human activities such as agricultural irrigation, industrial area development, and large-scale water diversion projects that occur to the alluvial fan of the Choshui River, and assesses the causes of changes in runoff in an attempt to obtain a better understanding of the mechanisms that affect runoff in the long term. As mentioned above, there is a lot of reference information and scientific evidence for using the Budyko framework to explore the mechanism of changes in runoff. As such, this study considers the availability of data and adopts the Budyko framework to evaluate the reasons for the changes in the runoff of the alluvial fan of the Choshui River. This study mainly uses simple and flexible methods to quantify the contribution of climate factors and human activities to changes in runoff.
2. Methodology
2.1. Runoff Analysis
This study collects annual evapotranspiration and annual precipitation data and uses the long-term annual steady-state water equilibrium equation, such as Equation (1), to evaluate runoff data. Subsequently, the Mann–Kendall test method [21,22] and Sen’s slope estimator [23,24] are used to understand the significance of the trend of runoff in the long term. In addition, this study uses the Pettit test method [25] and Sequential Mann–Kendall test method [26] to find the change point of runoff.
P = E + Q + ΔS
Here, P is the precipitation, E is the actual evapotranspiration, Q is the flow rate of the runoff, ΔS is the change in water storage including groundwater, which in comparison to precipitation in the long term (e.g., more than 30 years) can be neglected and is hence assumed to be zero [9,27,28,29]. The change in water storage is not considered in steady-state Budyko framework and should be processed in non-state Budyko framework; therefore, the advantages of ignoring the change in water storage is that a simpler steady-state Budyko framework can be used rather than a complex non-steady Budyko framework. While ignoring the change in water storage may result in deviations in estimated runoff, we can reduce deviations by means of complementary characteristics of intra-annual water storage fluctuations at the annual scale.
2.2. Budyko Framework
Budyko assumed that the ratio of the actual average annual evapotranspiration to the average annual precipitation (E/P) is a function of the ratio of the annual potential evapotranspiration to the average annual precipitation (PET/P) [30]. Since PET/P is also called the aridity index (φ), the Budyko formula can be expressed as follows:
where E is the actual evapotranspiration, PET is the potential evapotranspiration, and P is the precipitation. In a dry climate (φ > 1), the actual evapotranspiration is limited by the supply of precipitation. On the contrary, in a humid climate (φ < 1), the actual evapotranspiration is limited by the supply of energy. Due to the limitations of water and energy equilibrium, the boundary conditions of the Budyko formula are:
In the subsequent research, many scholars have rewritten the Budyko formula from Equation (2) into different forms, divided into non-parametric and parametric forms. Since the parametric form of the Budyko formula leads to results that are closer to the observation data in southern Taiwan as compared to the non-parametric form [31], it is adopted in this study to carry out the subsequent analyses. Different forms of the Budyko formula are suitable for different environmental conditions, as shown in Table 1.

Table 1.
Budyko-type equations with single parameter.
The Budyko parameters represent the watershed characteristic, such as vegetation and topography, and we treat the watershed characteristic changes as being caused by human activities. To understand the influence of human activities on runoff, the individual Budyko parameters of the first half, second half, and the whole period should be determined. The Budyko parameters of the three different periods are obtained by using the corresponding average climatic variables (i.e., the ratio of the annual evapotranspiration to the annual precipitation and aridity index), substituting Budyko equations.
2.2.1. Decomposition of the Budyko Curve
Wang and Hejazi [18] proposed the Budyko curve decomposition method to determine the influence of climate factors and human activities on changes in flow. As shown in Figure 1, the points will only move on the same Budyko curve if only climate factors are at work. Similarly, the points will only move vertically if only human activities are at work. Therefore, the contribution of human activities to changes in flow is shown in Equation (8):
where are the average precipitation and the average actual evapotranspiration in the second half, respectively; is the ratio of the average actual evapotranspiration and the average precipitation in the second half; is the ratio of the average actual evapotranspiration and the average precipitation obtained using the Budyko curve in the first half and the aridity index in the second half , which represents the ratio that is affected by climate factors only.
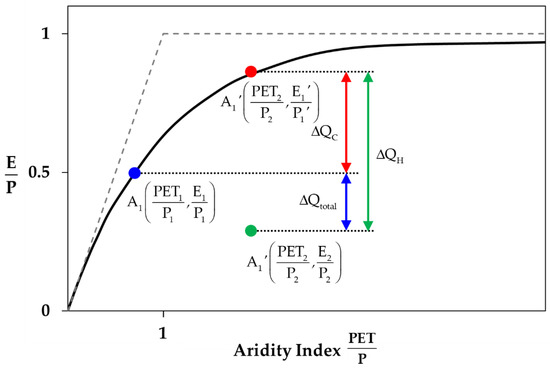
Figure 1.
Decomposition method based on the Budyko framework. (modified from [16]).
2.2.2. Climate Elasticity
In addition to the decomposition method, this study also uses climate elasticity to separate the impact of climate factors and human activities on the changes in runoff in the Choshui River alluvial fan. Schaake [36] proposed using the elasticity coefficient to estimate the sensitivity of runoff to climate factors. The elasticity coefficient is defined by Equation (9):
where f represents the influencing factors of the runoff. In this study, the influencing factors considered include precipitation, potential evapotranspiration, and the Budyko parameters, the elasticity coefficient of the runoff to which are denoted as , and , respectively. The elasticity coefficient indicates the percentage increase or decrease in the flow rate of the runoff when the respective influencing factor is increased by 1%. The elasticity coefficients for the first, second, and the whole period are obtained by using the climatic variables and Budyko parameters corresponding to the period. The influence on runoff flow rate due to climate factors comes from changes in precipitation and potential evapotranspiration, while the influence on runoff flow rate due to human activities comes from changes in the parameters of the Budyko formula. The changes in runoff due to climate factors are as shown in Equation (10):
Combining Equation (9) with Equation (10), the influence of climate factors on the runoff flow rate is shown in Equation (11):
The influence of human activities on the runoff flow rate is shown in Equation (12):
where and are the average runoff flow rate, precipitation, potential evapotranspiration, and the average of the Budyko parameters during the entire study period; ΔP, ΔPET, and Δn are the differences in the average precipitation, potential evapotranspiration, and the Budyko parameters between the first and the second halves.
2.3. Changes in Catchment Characteristics
In this study, the Normalized Difference Vegetation Index (NDVI) is used to verify the changes in the parameters of the Budyko formula. Since the Budyko parameters can represent the characteristics of the catchment area, including vegetation cover state, soil properties, and topography, the increase in the parameters corresponds to a lusher vegetation cover [34,37]. In addition, NDVI reflects the vegetation cover state using the characteristics of green objects in reflecting the light of different wavelengths to different degrees, which is defined as:
where NIR represents the reflectivity of near-infrared light, RED represents the reflectivity of the red light in visible light, taking a value between –1 and 1, such that the closer it is to 1, the higher the reflectivity of the red light and the denser the green vegetation cover. This study averages several Landsat satellite images (from 1986–2016) with low cloud cover, which are obtained from USGS EarthExplorer (https://earthexplorer.usgs.gov/ accessed on 27 June 2021). There are 10 years of images out of the first half and 8 years of images out of the second half used in the vegetation coverage analysis.
3. Study Area
The alluvial fan of the Choshui River is the largest alluvial fan in Taiwan, covering an area of approximately 2100 square kilometers that reaches the Dadu River in the north, the Beigang River in the south, the Taiwan Strait in the west, and the Bagua-Douliu Hills in the east. The administrative districts across the alluvial fan include Changhua County and Yunlin County. This study uses precipitation and evapotranspiration data collected from 1980 to 2018. The precipitation data are from nine rainfall stations near the Choshui River alluvial fan (shown in Figure 2), obtained from the annual hydrological reports published by the Water Resources Agency of Ministry of Economic Affairs [38]. There is no representative station for evapotranspiration data in the study area; hence, the GLEAM database (https://www.gleam.eu/ accessed on 27 June 2021) [39,40] jointly established by the European Space Agency and other institutions is used. The data have a resolution of 0.25° × 0.25° in the latitude and longitude (corresponding to a grid resolution of approximately 25 km × 25 km). During the 38-year study period, the averages of annual precipitation, annual actual evapotranspiration, and annual potential evapotranspiration in the long term are 1372 mm, 930 mm, and 987 mm, respectively.
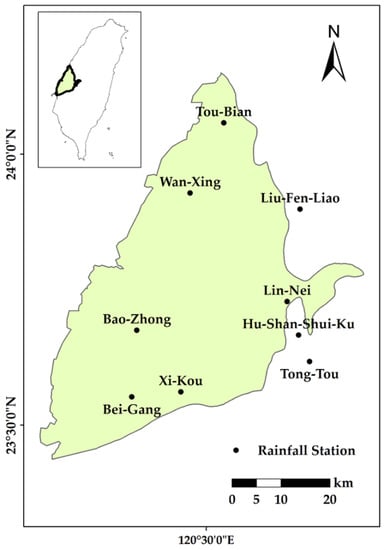
Figure 2.
Study area and spatial distribution of rainfall stations.
4. Results and Discussion
This study first analyzes the aridity index for the Choshui River alluvial fan from 1980 to 2018, and the results show that during most of the time, the climate was humid (φ < 1). Analyzing the trend reveals that the value of ZMK is 1.45, determined by the Mann–Kendall test, indicating that the flow rate of the runoff has increased. However, this result is not significant at the 90% confidence level. Nevertheless, Sen’s slope estimator gives a value of 0.49, and a positive slope indicates that the runoff is increasing over time. According to the above verification results, it is found that the runoff of the Choshui River alluvial fan has not increased significantly. The changes in precipitation and runoff flow rate over time are shown in Figure 3. In this study, the Pettit test and the sequential Mann–Kendall test determine the change point of runoff flow rate. The Pettit test shows that 2003 is probably the change point, with a probability of approximately 0.89 (Figure 4). Moreover, the sequential MK test indicates that the change point may have occurred in 2003 or 2006 (Figure 4). Therefore, this study has taken 2003 as the change point of the runoff flow rate of the alluvial fan of Choshui River based on the above verification results. The variation of the average annual precipitation and runoff from the first half (1980–2002) to second half (2004–2018) has increased by 226 mm and 14.8 cms, respectively. Compared to the first half, a runoff increase of 60% is greater than a precipitation increase of 17%.
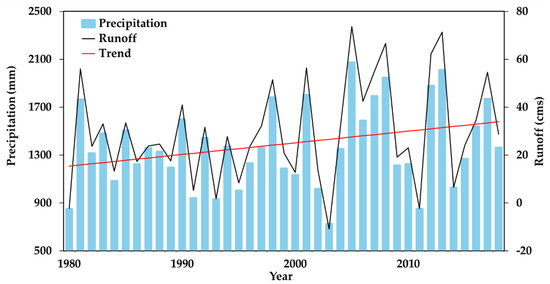
Figure 3.
Historical trends of runoff and precipitation record from 1980 to 2018.
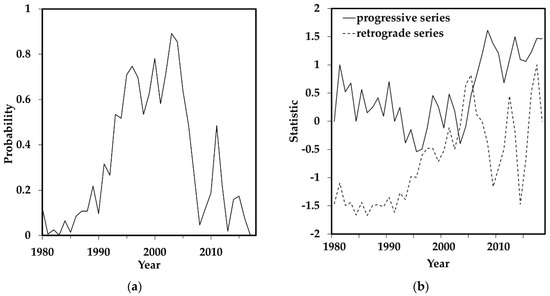
Figure 4.
Result of change point test for runoff: (a) Pettit test, (b) sequential Mann–Kendall test.
After the Budyko parameters are obtained using the method of Section 2.2, we can use the Budyko equations combined with the simple water balance equation to estimate runoff. We bring the corresponding average E/P, PET/P, and the Budyko parameter in the first and second period into Budyko equations to estimate runoff in the first and second period. In this study, the runoff estimated using different forms of the Budyko formula is compared with the observed runoff, as shown in Table 1. The results of different Budyko formulas are analyzed quantitatively with statistical indicators such as the Nash–Sutcliffe efficiency (NSE), root mean square error (RMSE), mean absolute error (MAE), and percent bias (PBIAS), which are common in hydrological models, as shown in Table 2. The analysis shows that the model proposed by Zhang [34] has led to statistical indicators (RMSE = 84.44 and MAE = 64.05), which are worse than those of the other three models, and the simulated runoff is far from the observation, indicating that the performance of this model is the worst. In contrast, the three models proposed by Fu, Choudhury, and Wang and Tang [32,33,35] all show relatively good fitting results, as shown in Figure 5. The Budyko model proposed by Wang and Tang [35], which has a relatively small standard deviation, is selected as the basis for the subsequent analysis in this study.
Table 2.
Statistical performance analysis indices of single-parameter Budyko-type equations.
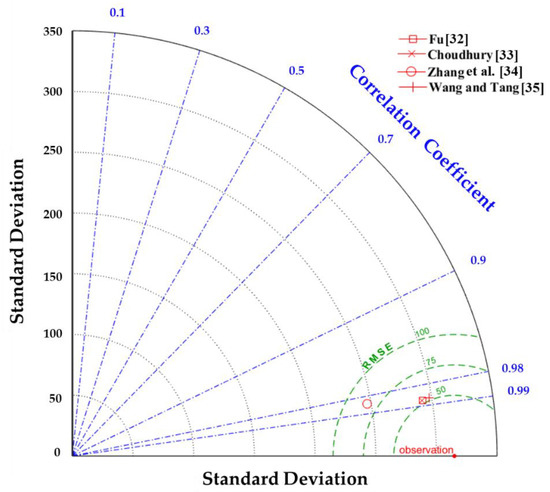
Figure 5.
Comparison of performance of runoff simulated by single-parameter Budyko equations with Taylor diagram.
Combining the model proposed by Wang and Tang and Equation (1) for water equilibrium, the runoff can be expressed in terms of precipitation, potential evapotranspiration, and Budyko parameter, as in Equation (14):
where Q, P, PET, and n are the runoff, precipitation, potential evapotranspiration, and the parameter in the Budyko formula, respectively.
According to the definition of the coefficient of elasticity in Equation (9), the derivatives of Equation (14) concerning three different factors are taken, respectively. The coefficients of elasticity of runoff with respect to precipitation , potential evapotranspiration , and the Budyko parameter are shown below:
Substituting the average precipitation, average potential evapotranspiration, and the Budyko parameter in each period into Equations (15)–(17), the coefficients of elasticity for the three factors to runoff in different periods (as shown in Table 3) can be obtained. The results of sensitivity analysis show that the absolute value of each coefficient of elasticity has decreased in the second half when compared to the first half, indicating that runoff has become less sensitive to its various influencing factors. In addition, both and are negative, indicating that the increase in the Budyko parameter will reduce the runoff. In general, for every 1% increase in precipitation, runoff will increase by 2.72%. In contrast, for every 1% increase in potential evapotranspiration and the Budyko parameter, the decrease in runoff is 1.72% and 0.94%, respectively. Therefore, the coefficient of elasticity of runoff is the largest for precipitation, indicating that the runoff is most sensitive to precipitation, which is hence determined as the main influencing factor.
Table 3.
Comparison of elasticity coefficients for pre- and post-period and variation in the Choshui River alluvial fan.
After understanding the changes in runoff and the sensitivity to factors affecting runoff, this study will use the decomposition method and climate elasticity to explore the respective contributions of human activities and climate factors to runoff. Figure 6 shows the Budyko curves for the first and second halves of the study period after fitting with the model proposed by Wang and Tang [35] Based on the results from curve decomposition, the contribution of climate factors to the change in runoff is 14.27 cms, accounting for 96.4% of the total change in runoff (which is 14.8 cms). In addition, analysis with climate elasticity shows that climate factors have caused a change of 13.94 cms in the runoff, accounting for 94.2% of the total change in the runoff. Therefore, both the curve decomposition and the climate elasticity indicate that climate factors are the main influencing factors of runoff (as shown in Table 4).
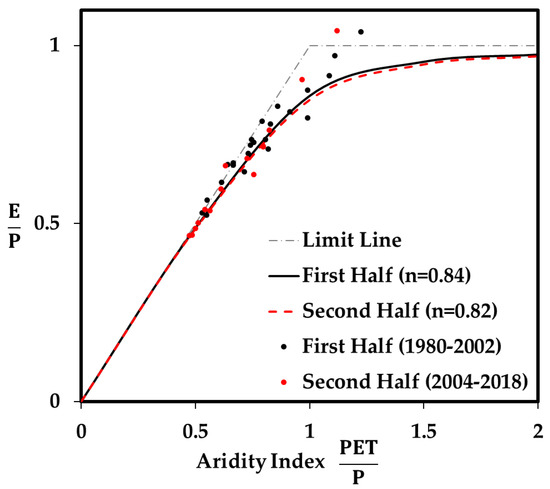
Figure 6.
Budyko-type curve of pre-period and post-period fitted by the Wang and Tang equation in the Choshui River alluvial fan.
Table 4.
Result of the contribution of runoff variation for climate factors and human activities by decomposition of Budyko curve method and climate elasticity method.
The factors affecting runoff are precipitation, potential evapotranspiration, and the Budyko parameter. Precipitation and potential evapotranspiration are classified as climatic factors, while the Budyko parameter is classified as human activity. The analysis of the coefficient of elasticity has revealed that precipitation is not only a primary influencing factor affecting runoff, but its increase will also cause the runoff to increase. Therefore, this study uses the MK test to explore the changes in precipitation over the years. The test results show that the precipitation from 1980 to 2018 is likely to have increased (ZMK = 1.19), which is consistent with the conclusion that climate factors (especially precipitation) are the leading cause of the increase in runoff. In addition to precipitation, the vegetation cover state also affects the runoff; this is because plants cause evapotranspiration. Hence, the reduction of green vegetation cover will reduce the evapotranspiration, which leads to an increase in runoff [41,42,43]. According to the changes in the Budyko curves in both the first and the second halves, as shown in Figure 6, the Budyko parameter is reduced. It is thus speculated that the vegetation cover of the alluvial fan of Choshui River has indeed decreased. Therefore, this study uses NDVI, which can reflect the true state of vegetation cover, to verify the above speculation. Figure 7a,b are the spatial distribution of NDVI in the first and second halves of the study period, respectively, where Figure 7c indicates the change in NDVI between the first and the second halves, with green indicating an increase and red indicating a decrease in vegetation cover. It can be seen that most areas of the alluvial fan of Choshui River are red, indicating that green vegetation cover has decreased, which is consistent with the results speculated from the Budyko parameter. Therefore, the Budyko parameter can describe the environmental changes in the catchment area.
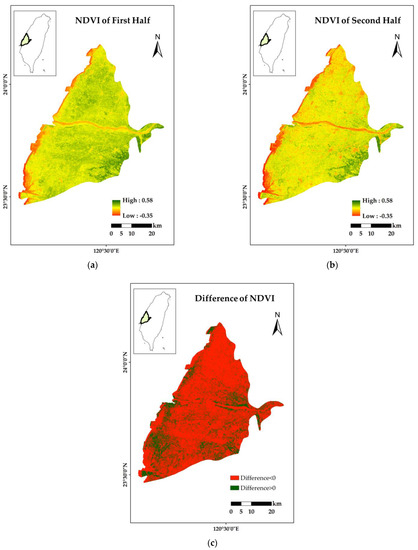
Figure 7.
Result of spatial distribution of NDVI (a) pre-period; (b) post-period; (c) variation.
The Budyko parameter reflects the characteristics of a water catchment area, such as soil properties, topography, and vegetation cover. In this study, the change in the Budyko parameter is attributed to human activities, such as the impact of economic development on vegetation cover. However, in reality, changes in the characteristics of a water catchment area may also be caused by climate factors, such as changes in vegetation cover and topography caused by heavy rainfall. It is worth mentioning that the interaction between climate change and the influence of human activities on runoff change is not easy to disentangle. As a result, this study may underestimate the indirect effects of human activities against the background that the global climate is increasingly affected by human activities, leading to the deviation of the final result. Therefore, use of the Budyko parameter to explore the interaction between human activities and climate factors is worthy of follow-up research.
Since the runoff in this study is obtained through the equation of water equilibrium in the long term, it can be found that the levels of runoff in 1980, 2003, and 2011 are all less than zero, as shown in Figure 3. In addition, the fitted Budyko curve shows that there are data points that exceed the limits of water equilibrium and energy equilibrium, as shown in Figure 6. This study explores the reasons for the above doubtful results and believes that the abnormality is related to the simple water equilibrium equation used in this study, as well as the conditions for the Budyko framework. In the long-term steady state, the change in water storage is neglected in the water equilibrium equation (as shown in Equation (1)). However, the limit of the water equilibrium is increased when underground water replenishment is considered, such that the limit exceeds the original horizontal line defined by E/P = 1, causing the phenomenon of exceeding the original limit of water equilibrium to seem reasonable [44]. The causes leading to some of the unreasonable results are related to the negligence of changes in water storage, which is affected by changes in soil water content, groundwater, and surface water [27]. To sum up, the disadvantages of ignoring the change in water storage are mainly derived from the runoff with bias, and further cause the results that exceed the water and energy limit. In order to lessen the bias of estimated runoff, the temporal scale of this study is an annual scale because the intra-annual water storage may fluctuate over the wet and dry seasons and complement the whole year [27,28]. The advantages of ignoring the change in water storage include the fact that the steady state Budyko framework is simple, rather than the more complex Budyko equation for non-steady state condition. The water storage data (e.g., soil water content) is necessary for complete water balance and the Budyko framework for non-steady condition. At present, the scarcity of parameters causing changes in the water storage changes over time, which is another reason why we adopted a simple water balance concept. In addition, the simple water equilibrium equations and steady state Budyko framework can assess the impact of runoff on future climate changes [45]. After estimating possible future precipitation and evapotranspiration data based on the severity of climate change with different models, a simple water equilibrium model can be used to explore the reasons for future changes in runoff. Moreover, if the accuracy of the assessment needs to be improved by considering the changes in water storage, it is necessary to use the Budyko framework at a non-steady state, which is a major focus of future research.
5. Conclusions
In this study, hydrological data on parameters such as precipitation, evapotranspiration, and potential evapotranspiration from the Choshui River alluvial fan between 1980 and 2018 are collected, and the contribution of climate factors and human activities to changes in runoff are quantified. The runoff calculated based on water equilibrium has experienced a change point in 2003 as indicated by two statistical test methods, while the second half (2004–2018) shows an average runoff 60% higher than that of the first half (1980–2002). The curve decomposition method and climate elasticity used in this study are both based on the Budyko framework proposed by Wang and Tang [35]. The changes in catchment area characteristics reflected by the Budyko parameter are consistent with those deduced from NDVI, showing that vegetation cover has decreased, comparing the second half to the first half. In the analysis, to quantify the contribution of climate factors and human activities to the changes in runoff, the results consistently show that the main reason for the changes in runoff is climate factors, accounting for over 90%. The impact of human activities on the runoff is less than ten, but in consideration of climate change is the affected human activities; the indirect effects of human activities may not have been estimated. The above-quantified results indicate that climate factors play an important role in the changes in the runoff of the Choshui River alluvial fan.
Author Contributions
H.-Y.C. and C.-C.H. participated in data processing and the elaboration of the statistical analysis and figures; H.-F.Y. contrived the subject of the article, performed the literature review and contributed to the writing of the paper. All authors have read and agreed to the published version of the manuscript.
Funding
The authors are grateful for the support from the Headquarters of University Advancement at the National Cheng Kung University, sponsored by the Ministry of Education, Taiwan, ROC. This research received no external funding.
Institutional Review Board Statement
Not applicable.
Informed Consent Statement
Not applicable.
Data Availability Statement
Precipitation data and evapotranspiration data used in this study are accessible online at https://gweb.wra.gov.tw/wrhygis/ and https://www.gleam.eu/ (assessed on 5 August 2021).
Conflicts of Interest
The authors declare no conflict of interest.
References
- Milly, P.C.; Dunne, K.A.; Vecchia, A.V. Global pattern of trends in streamflow and water availability in a changing climate. Nature 2005, 438, 347–350. [Google Scholar] [CrossRef]
- Yang, H.; Xiong, L.; Xiong, B.; Zhang, Q.; Xu, C.-Y. Separating runoff change by the improved Budyko complementary relationship considering effects of both climate change and human activities on basin characteristics. J. Hydrol. 2020, 591, 125330. [Google Scholar] [CrossRef]
- Delmonte Oliveira, K.; Tomasella, J.; Del′Arco Sanches, L. Spatial-temporal analysis of the climatic and anthropogenic influences on runoff in the Jucu River Basin, Southeastern Brazil. LDD 2019, 30, 2073–2087. [Google Scholar] [CrossRef]
- Wang, X.; Zhang, P.; Liu, L.; Li, D.; Wang, Y. Effects of Human Activities on Hydrological Components in the Yiluo River Basin in Middle Yellow River. Water 2019, 11, 689. [Google Scholar] [CrossRef] [Green Version]
- Yang, Q.; Luo, S.; Wu, H.; Wang, G.; Han, D.; Lü, H.; Shao, J. Attribution Analysis for Runoff Change on Multiple Scales in a Humid Subtropical Basin Dominated by Forest, East China. Forests 2019, 10, 184. [Google Scholar] [CrossRef] [Green Version]
- Cisneros, J.; Oki, T.; Arnell, N.W.; Benito, G.; Cogley, J.G.; Döll, P.; Jiang, T.; Mwakalila, S.S. Freshwater Resources. In Climate Change 2014—Impacts, Adaptation and Vulnerability: Part A: Global and Sectoral Aspects: Working Group II Contribution to the IPCC Fifth Assessment Report of the Intergovernmental Panel on Climate Change; Cambridge University Press: Cambridge, UK; New York, NY, USA, 2014; pp. 229–270. [Google Scholar]
- Connor, R. UN-Water, 2020: United Nations World Water Development Report 2020: Water and Climate Change; UNESCO: Paris, France, 2020; p. 16.
- Tomer, M.D.; Schilling, K.E. A simple approach to distinguish land-use and climate-change effects on watershed hydrology. J. Hydrol. 2009, 376, 24–33. [Google Scholar] [CrossRef]
- Dey, P.; Mishra, A. Separating the impacts of climate change and human activities on streamflow: A review of methodologies and critical assumptions. J. Hydrol. 2017, 548, 278–290. [Google Scholar] [CrossRef]
- Devia, G.K.; Ganasri, B.P.; Dwarakish, G.S. A Review on Hydrological Models. Aquat. Procedia 2015, 4, 1001–1007. [Google Scholar] [CrossRef]
- Ma, H.; Yang, D.; Tan, S.K.; Gao, B.; Hu, Q. Impact of climate variability and human activity on streamflow decrease in the Miyun Reservoir catchment. J. Hydrol. 2010, 389, 317–324. [Google Scholar] [CrossRef]
- Wang, G.; Zhang, J.; Pagano, T.; Lin, J.; Liu, C. Identifying contributions of climate change and human activity to changes in runoff using epoch detection and hydrologic simulation. J. Hydrol. Eng. 2013, 18, 1385–1392. [Google Scholar] [CrossRef]
- Dong, W.; Cui, B.; Liu, Z.; Zhang, K. Relative effects of human activities and climate change on the river runoff in an arid basin in northwest China. Hydrol. Processes 2014, 28, 4854–4864. [Google Scholar] [CrossRef]
- Wang, X. Advances in separating effects of climate variability and human activity on stream discharge: An overview. Adv. Water Resour. 2014, 71, 209–218. [Google Scholar] [CrossRef]
- Mianabadi, A.; Davary, K.; Pourreza-Bilondi, M.; Coenders-Gerrits, A.M.J. Budyko framework; towards non-steady state conditions. J. Hydrol. 2020, 588, 125089. [Google Scholar] [CrossRef]
- Zeng, F.; Ma, M.G.; Di, D.R.; Shi, W.Y. Separating the Impacts of Climate Change and Human Activities on Runoff: A Review of Method and Application. Water 2020, 12, 2201. [Google Scholar] [CrossRef]
- Xu, X.; Yang, D.; Yang, H.; Lei, H. Attribution analysis based on the Budyko hypothesis for detecting the dominant cause of runoff decline in Haihe basin. J. Hydrol. 2014, 510, 530–540. [Google Scholar] [CrossRef]
- Wang, D.; Hejazi, M. Quantifying the relative contribution of the climate and direct human impacts on mean annual streamflow in the contiguous United States. Water Resour. Res. 2011, 47, 10283. [Google Scholar] [CrossRef] [Green Version]
- Wu, J.; Miao, C.; Wang, Y.; Duan, Q.; Zhang, X. Contribution analysis of the long-term changes in seasonal runoff on the Loess Plateau, China, using eight Budyko-based methods. J. Hydrol. 2017, 545, 263–275. [Google Scholar] [CrossRef]
- Huang, C.-C.; Lin, K.-T.; Yeh, H.-F. Recent Changes in Groundwater Storage in Jhuoshuei River Basin, Taiwan. J. Chin. Soil Water Conserv. 2017, 48, 36–43. (In Chinese) [Google Scholar]
- Kendall, M.G. Rank Correlation Methods; Charles Griffin: London, UK, 1975; p. 15. [Google Scholar]
- Mann, H.B. Nonparametric tests against trend. Econom. J. Econom. Soc. 1945, 245–259. [Google Scholar] [CrossRef]
- Sen, P.K. Estimates of the regression coefficient based on Kendall’s tau. J. Am. Stat. Assoc. 1968, 63, 1379–1389. [Google Scholar] [CrossRef]
- Theil, H. A rank-invariant method of linear and polynomial regression analysis. Adv. Stud. Theor. Appl. Econom. 1992, 23, 345–381. [Google Scholar]
- Pettitt, A.N. A non-parametric approach to the change-point problem. J. R. Stat. Soc. Ser. C 1979, 28, 126–135. [Google Scholar] [CrossRef]
- Sneyers, R. On the Statistical Analysis of Series of Observations; Secretariat of the World Meteorological Organization: Geneva, Switzerland, 1991; p. 192. [Google Scholar]
- Wang, D. Evaluating interannual water storage changes at watersheds in Illinois based on long-term soil moisture and groundwater level data. Water Resour. Res. 2012, 48, 10759. [Google Scholar] [CrossRef]
- Du, C.; Sun, F.; Yu, J.; Liu, X.; Chen, Y. New interpretation of the role of water balance in an extended Budyko hypothesis in arid regions. Hydrol. Earth Syst. Sci. 2016, 20, 393–409. [Google Scholar] [CrossRef] [Green Version]
- Wang, W.; Zhang, Y.; Tang, Q. Impact assessment of climate change and human activities on streamflow signatures in the Yellow River Basin using the Budyko hypothesis and derived differential equation. J. Hydrol. 2020, 591, 125460. [Google Scholar] [CrossRef]
- Budyko, M.I.; Miller, D.H. Climate and Life; Academic press: Cambridge, MA, USA, 1974. [Google Scholar]
- Tsao, J.; Lee, C.-H.; Yeh, H.-F. Attribution of Streamflow Variations in Southern Taiwan. Water 2020, 12, 2465. [Google Scholar] [CrossRef]
- Fu, B. On the calculation of the evaporation from land surface. Chin. J. Atmos. Sci. 1981, 5, 23–31. [Google Scholar]
- Choudhury, B. Evaluation of an empirical equation for annual evaporation using field observations and results from a biophysical model. J. Hydrol. 1999, 216, 99–110. [Google Scholar] [CrossRef]
- Zhang, L.; Dawes, W.; Walker, G. Response of mean annual evapotranspiration to vegetation changes at catchment scale. Water Resour. Res. 2001, 37, 701–708. [Google Scholar] [CrossRef]
- Wang, D.; Tang, Y. A one-parameter Budyko model for water balance captures emergent behavior in darwinian hydrologic models. Geophys. Res. Lett. 2014, 41, 4569–4577. [Google Scholar] [CrossRef] [Green Version]
- Schaake, J.C. From climate to flow. Clim. Chang. US Water Resour. 1990, 177–206. [Google Scholar]
- Ning, T.; Li, Z.; Liu, W. Separating the impacts of climate change and land surface alteration on runoff reduction in the Jing River catchment of China. Catena 2016, 147, 80–86. [Google Scholar] [CrossRef]
- Water Resources Agency. Hydrological Yearly Book of Taiwan Republic of China: PARTI-Rainfall. Ministry of Economic Affairs: Taipei, Taiwan, 1980–2018. (In Chinese) [Google Scholar]
- Miralles, D.G.; Holmes, T.; De Jeu, R.; Gash, J.; Meesters, A.; Dolman, A. Global land-surface evaporation estimated from satellite-based observations. Hydrol. Earth Syst. Sci. 2011, 15, 453–469. [Google Scholar] [CrossRef] [Green Version]
- Martens, B.; Miralles, D.G.; Lievens, H.; Van Der Schalie, R.; De Jeu, R.A.; Fernández-Prieto, D.; Beck, H.E.; Dorigo, W.A.; Verhoest, N.E. GLEAM v3: Satellite-based land evaporation and root-zone soil moisture. Geosci. Model Dev. 2017, 10, 1903–1925. [Google Scholar] [CrossRef] [Green Version]
- Roderick, M.L.; Farquhar, G.D. A simple framework for relating variations in runoff to variations in climatic conditions and catchment properties. Water Resour. Res. 2011, 47, 9826. [Google Scholar] [CrossRef]
- Jaramillo, F.; Cory, N.; Arheimer, B.; Laudon, H.; van der Velde, Y.; Hasper, T.B.; Teutschbein, C.; Uddling, J. Dominant effect of increasing forest biomass on evapotranspiration: Interpretations of movement in Budyko space. Hydrol. Earth Syst. Sci. 2018, 22, 567–580. [Google Scholar] [CrossRef] [Green Version]
- Guzha, A.; Rufino, M.C.; Okoth, S.; Jacobs, S.; Nóbrega, R. Impacts of land use and land cover change on surface runoff, discharge and low flows: Evidence from East Africa. J. Hydrol. Reg. Stud. 2018, 15, 49–67. [Google Scholar] [CrossRef]
- Condon, L.E.; Maxwell, R.M. Systematic shifts in Budyko relationships caused by groundwater storage changes. Hydrol. Earth Syst. Sci. 2017, 21, 1117–1135. [Google Scholar] [CrossRef] [Green Version]
- Heidari, H.; Arabi, M.; Warziniack, T.; Kao, S.C. Assessing Shifts in Regional Hydroclimatic Conditions of U.S. River Basins in Response to Climate Change over the 21st Century. Earth’s Future 2020, 8, 1657. [Google Scholar] [CrossRef]
Publisher’s Note: MDPI stays neutral with regard to jurisdictional claims in published maps and institutional affiliations. |
© 2021 by the authors. Licensee MDPI, Basel, Switzerland. This article is an open access article distributed under the terms and conditions of the Creative Commons Attribution (CC BY) license (https://creativecommons.org/licenses/by/4.0/).