Article

Interaction between Land Financing Strategy and the Implementation Deviation of Local Governments’ Cultivated Land Protection Policy in China

1
College of Public Administration, Huazhong University of Science and Technology, Wuhan 430074, China
2
Department of Land Management, College of Public Administration, Huazhong Agricultural University, Wuhan 430074, China
3
Institute of Ecological and Environmental Economics, Huazhong Agricultural University, Wuhan 430074, China
*
Author to whom correspondence should be addressed.
Land 2021, 10(8), 803; https://doi.org/10.3390/land10080803
Submission received: 13 June 2021 / Revised: 24 July 2021 / Accepted: 28 July 2021 / Published: 30 July 2021

Abstract

:
The deviation of implementation of China’s cultivated land protection policy is the core problem urgently needing to be solved in the process of protecting the country’s cultivated land. This paper aims to explain the universality of this implementation deviation from the perspective of the spatial interaction of fiscal land strategies. Based on the data of 30 provinces in China from 2000 to 2015, the spatial Durbin model is used to validate the corresponding theoretical hypothesis. The results show that: (1) At the national or regional level, the given local government’s behavior with regard to land conveyance and land-orientation investment will aggravate implementation deviations of the cultivated land protection policy in the local area. (2) Land conveyance and land-orientation investment behaviors cause a spatial spillover effect. As a result, these behaviors not only exacerbate the implementation deviation of the cultivated land protection policy in the local area, but also exacerbate this deviation in adjacent areas. (3) The spatial spillover effects of land conveyance and land-orientation investment strategies in the eastern, central and western regions of China show marked differences. However, in general, compared with the land transfer strategy, the spatial interactions of the land-orientation investment strategy represent the more important factor that gives rise to the widespread deviation in the implementation of the cultivated land protection policy. (4) The transformation of the performance appraisal system can help to weaken the interactive behavior of the land financing strategy. This can, in turn, not only alleviate the deviation degree of the implementation of the local cultivated land protection policy, but also the deviation degree of the implementation of the latter in adjacent areas.

1. Introduction

According to Krystyna Kurowska et al. (2020), agricultural land and forests have to be protected due to the steady increase in the global population and the associated demand for food, housing, work and recreation [1]. The rapid increase in global population reflects the dynamic development of civilization, which creates unprecedented demand for land serving purposes other than agricultural or forest production [2,3,4]. Cultivated land protection is the core strategic task of China’s land management approach [5,6] and is also an important policy tool applied to govern land finance [7,8,9,10,11,12,13]. In order to cope with the rapid consumption of cultivated land resources caused by land-related financial and investment competition, and alleviate the resulting national food security problems and facilitate the modernization of the country’s agricultural industry, China has formulated and implemented a highly stringent cultivated land protection policy, with the balance between the requisition and compensation of cultivated land being the major strategy [14,15,16]. Currently, China’s cultivated land requisition–compensation balance is being upgraded from the first level to the second level, highlighting the key strategic aspect of cultivated land protection and the central government’s determination to enact the latter [17,18]. However, in practice, with the rapid development of urbanization and industrialization, challenges related to farmland conversion have become increasingly prominent. In particular, the loss of high quality cultivated land in many provinces has accelerated, giving rise to concerns that cultivated land is not being effectively protected [19,20,21]. A question that has been posed in this context is: why is the total amount and quality of cultivated land still showing a declining trend, despite the central government having established a top-down cultivated land index management system to strictly restrict the land occupation behavior of local governments? Is the protection of cultivated land far from reaching its expected effects? While this question is certainly related to China’s development stage, local governments’ deviation in the implementation of the cultivated land protection policy cannot be ignored.
It has been noted in the existing literature that land finance holds strong explanatory power with regard to the incomplete implementation of cultivated land protection policies. A series of conceptual terms describing the implementation deviations of cultivated land protection policies have been derived from the perspective of local government land financing behavior, such as the selective implementation, passive implementation and incomplete implementation of such policies [15,19,20,21,22,23,24]. However, most of the relevant studies confine their research perspective to the given local government’s land-related fiscal behavior, regarding each local government as an independent individual. Thus, these studies neglect the influence that local governments will have on one another in their process of decision making, given that they are competitors under China’s system of decentralization [14]. In fact, given China’s unique performance evaluation mechanism, the sensitivity of local governments to the land-related fiscal behavior of neighboring regions endows land financing with distinctive interactive competition characteristics and spatial overflow [16]. In other words, local governments’ land-related fiscal behavior is not born of independent decision making but can be seen as “strategic”. This may be an important reason why local governments are too hasty in their use of construction land indicators and passively implement the protection of cultivated land [8,25,26]. The question then arises: while the increase in a local area’s land finance will drive the increase in land fiscal revenues in neighboring areas, will it exert negative constraints on the implementation of cultivated land protection policies in neighboring areas? If there exists the strategic interaction of mutual increase in terms of the land financing between different regions in China, can this cause the policy of cultivated land protection among regions to also be mutually deviated from? Based on the above logic, this article uses the spatial Durbin model and takes 30 provinces in China (excluding Tibet, Hong Kong, Macao and Taiwan) from 2000 to 2015 as the empirical objects, with the aim of examining the implementation of China’s cultivated land protection policy from the perspective of land-related fiscal strategy interactions. It is hoped that the findings of this study will provide a theoretical basis and policy inspiration for China’s land-related fiscal system reform and for the joint regional protection of cultivated land.

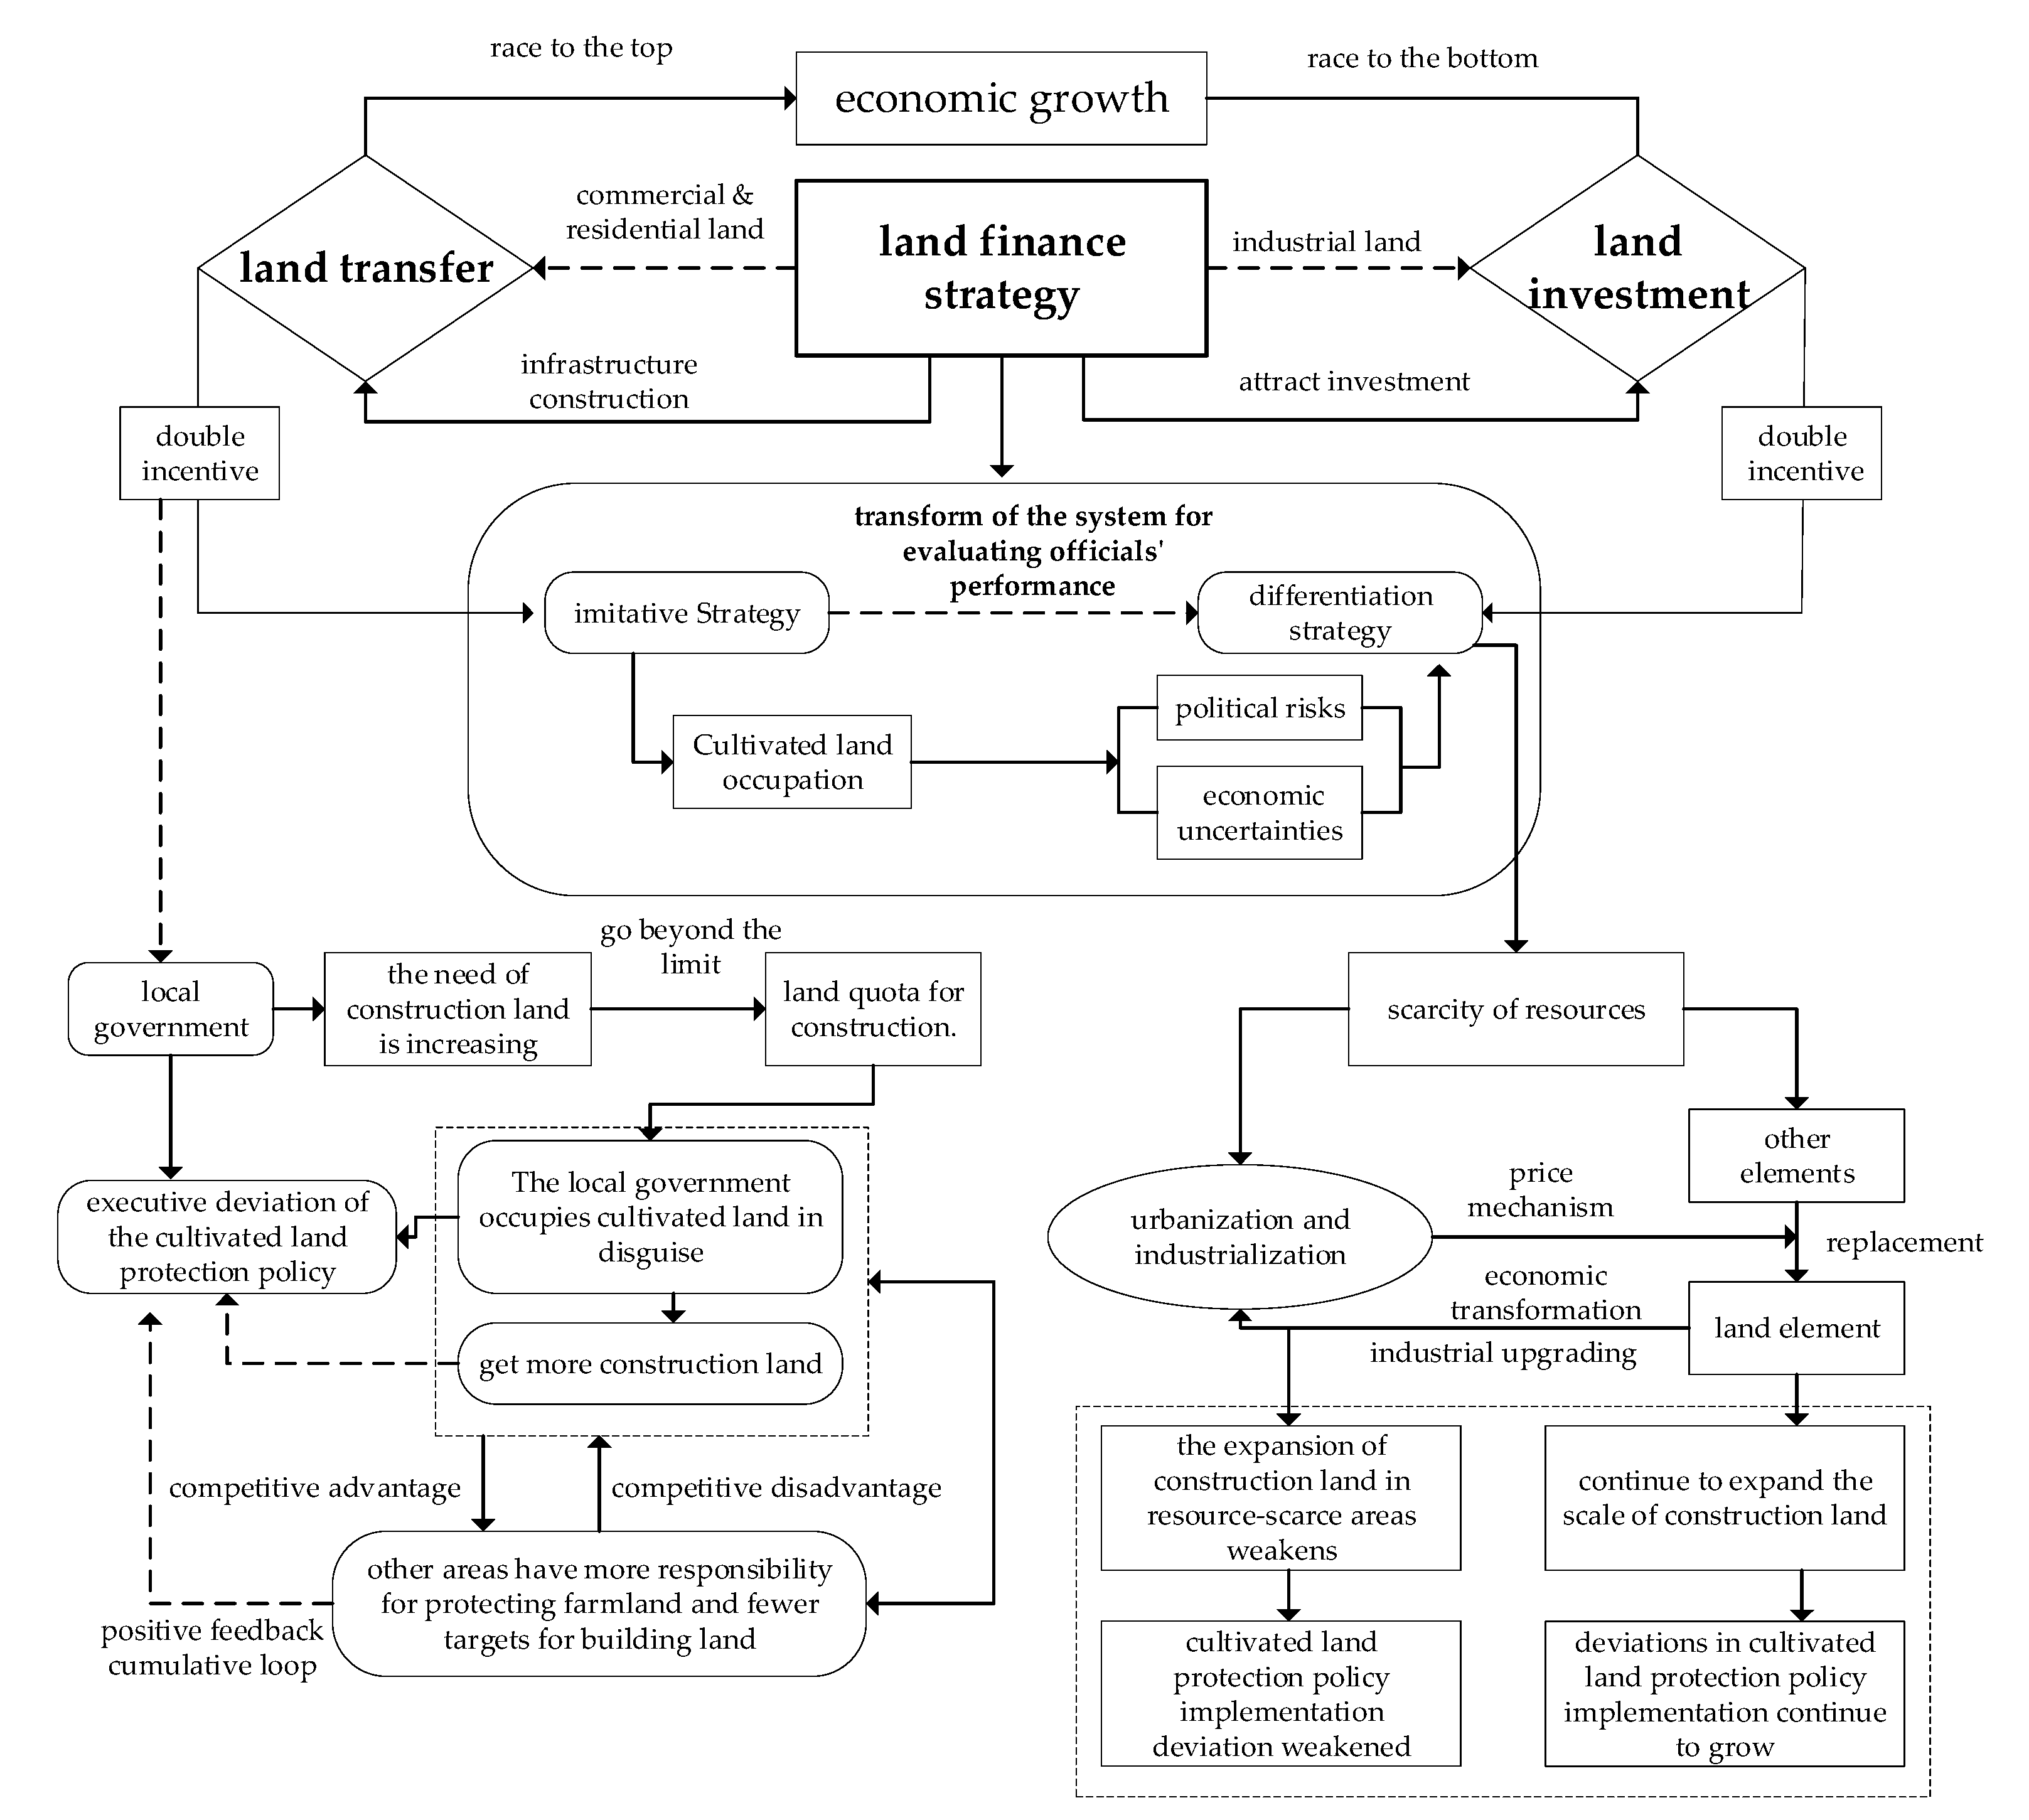
2. Analysis Framework and Research Hypothesis

From the perspective of fiscal competition, the regional externalities caused by the implementation deviation of cultivated land protection policies are mainly due to fiscal competition for scarce elements such as capital, labor and technology [27]. At this stage, the interaction between local governments’ land-related fiscal strategies usually adopts two forms: One is the imitation effect that evolved as a result of the intensified competition between local governments, whereby the given region will make the same strategic choice as the adjacent region’s land transfer or land-attracting behavior changes. The second is the substitution effect, which occurs due to the increase in the substitution between land and capital, whereby the region will make the opposite strategic choice to their neighbor’s land transfer or land-attracting behavior changes [7,9,12,28].
When local governments adopt the “mutual imitation” strategy of land transfers or a land investment strategy, due to the high cost of redeveloping stock land and the serious shortage of reserve space, these governments are keenly motivated to rapidly expand the scale of construction land available for sale in order to meet the needs of economic competition. In the process of implementing cultivated land protection policies, when the approved construction land quota cannot meet the needs of regional development, the local governments will apply policy omissions or higher level regulatory loopholes that enable them to adopt various strategies to expand construction land and so obtain land-related finance to further economic growth [29]. When one region obtains more construction land indicators by virtue of such deviation from the cultivated land protection policy, other regions may undertake more tasks pertaining to this protection and obtain less construction land indicators [6,26]. As a result, these other regions will be in a weak position in terms of economic competition. However, given that local governments are self-interested, in order to maintain their original construction land indicators that can facilitate land-related fiscal revenue and economic competition, the economic rationality of the occupation of cultivated land in other regions will further overwhelm the legal protection of cultivated land. Therefore, in order to maintain its lead in the economic competition, the region will accelerate the expansion of its construction land in the name of “development” and will take land finance as a given, which will further increase the degree of deviation in the implementation of cultivated land protection policies [30]. Under this stimulus, the spatial effect of land-related finance has resulted in a positive feedback style cumulative cyclical impact on the implementation of these policy deviations between regions. This, in turn, results in the inter-regional financial competition and strategic interaction around land being higher, and the degree of deviation in the implementation of cultivated land protection policies in other regions also further intensifying, ultimately forming a “same group effect” with regard to such policy implementation deviations [31,32].
However, with the development of urbanization and industrialization to a certain stage, the substitution effect between land and capital gradually increases. The price rise caused by the lack of land resources will then promote local governments to use land more intensively, thus creating an economic restraint mechanism to the local government’s land investment strategy [9]. Alongside this, as local governments increase their requirements for capital access, the degree of competition for land resources required by enterprises will also increase. In this case, the spatial imitation of a local government’s land transfer strategy will gradually increase and the imitation effect of the land investment strategy will also change, eventually forming a “substitution-based” land investment competition with other regions. In the long run, while the “differentiated” land finance strategy will aggravate the implementation deviation of the cultivated land protection policy in the region, it will weaken this deviation in neighboring regions.
Based on the above discussion, we proposed the first hypothesis that this study will test is as follows:
Hypothesis 1 (H1).
The “imitation” and “differentiation” of local governments’ land-related fiscal strategies will lead to the spatial dependence of the implementation deviation of the cultivated land protection policy. That is, land finance in a given region may have an indirect external impact on the implementation of cultivated land protection policies in other areas [33].
On the other hand, under China’s current GDP-centered promotion tournament system, local governments tend to manifest distorted behavioral incentives and strategic interactions. In order to obtain as much land-related fiscal revenue and competitive advantage as possible under the premise of avoiding risks, the degree of strategic complementarity and competition with regard to cultivated land indicators between regions will increase simultaneously. When the existing cultivated land indicators cannot meet the competitive demand, the implementation of the cultivated land protection policy will also be biased [25]. At the same time, with the transformation of the performance evaluation mechanism in the jurisdiction, the disguised cultivated land conversion behavior will make the local government’s land fiscal strategy relatively conservative due to its potential political risks and economic uncertainties. This will also induce the degree of competition for farmland conversion between other regions and local areas to take on a downward trend. In turn, this leads to a weakening of the strategic interaction between regional cultivated land protection policy implementation deviations.
Based on the above discussion, the second research hypothesis proposed in this paper is as follows:
Hypothesis 2 (H2).
The implementation deviation of cultivated land protection policy will be weakened the change of local government performance evaluation mechanism.
In short, the impact mechanism analysis is shown in Figure 1.

3. Methodology and Data Sources

3.1. Model Setting

Based on the theoretical framework constructed as mentioned above, it can be seen that the spatial interaction of different local governments’ land-related fiscal strategies in China will, to a certain extent, affect the implementation deviation of cultivated land protection policies. Considering the importance of this spatial effect, it is necessary for our study to consider the role of a change in own and neighboring dependent variables by an appropriate spatial econometric model [28,29]. Thus, we specify the spatial Durbin model (SDM) to control for spatial correlation in our empirical analysis. The advantage of the SDM is that, other than the spatial lag model (SLM) and the spatial error model (SEM), it can capture the spatial correlation of dependent variables and the spatial spillover effects of independent variables. Furthermore, the SDM usually has a higher level of goodness of fit compared with other spatial panel models. We developed a spatial Durbin model that included deviations in the implementation of land-related finance and cultivated land protection policies, as well as the spatial relationship between them. Taking into account the availability and completeness of the sample data, this study used provincial-level data (excluding Tibet, Hong Kong, Macau and Taiwan due to data acquisition issues) from 2000 to 2015. The basic model can be constructed as follows:
D e v i , t = α 0 + α 1 L F i , t + ρ 1 i n w i j L F i , t + ρ 2 i n w i j D e v i , t + α 2 X i , t + μ i , t + ε i t
Among them, i represents the province, t represents the year, L F i , t represents the land fiscal strategy, D e v i t represents the degree of policy implementation deviation, X i , t is a set of control variables that affect the implementation of the cultivated land protection policy and w i j is the spatial weight matrix describing the spatial relationship between region j and region i . In order to avoid the impact of the prior space weight scheme and ensure the robustness of the research conclusions, three types of space weight matrices were constructed: ① Geographically adjacent type. That is, the 0–1 matrix, based on whether the two regions are geographically adjacent or not. For the purposes of this paper, Rook’s rule was adopted to assign values whereby when the two regions have a common boundary, w i j = 1, otherwise w i j = 0. ② Geographic distance type. The weight setting method applied here is w i j = ( 1 / d i j ) / [ j = 1 N ( 1 / d i j ) ] , where d i j is the geographic distance between region j and region i , measured by the shortest railway mileage between provincial capitals. ③ Economic distance type. The weight w p g d p setting method applied here is w i j = ( 1 / | p g d p i ¯ p g d p j ¯ | ) / [ j = 1 N ( 1 / | p g d p i ¯ p g d p j ¯ | ) ] , where p g d p i ¯  is the average per capita GDP of region i during the sample period.
α 1 reflects the degree of influence of the local land finance on the implementation deviation of its own cultivated land protection policy, α 2 represents the estimated coefficient of the control variable and ρ 1 represents the impact of the land finance level of the surrounding competition area on the implementation of the cultivated land protection policy deviation in the given local area.
Land finance strategies in surrounding areas may have two effects on the implementation of local cultivated land protection policies. One is a positive effect, whereby the higher the level of land finance in the local government, the greater the positive externality of land finance in surrounding areas. Thus, a strengthening force on the deviation level of local cultivated land protection implementation will be produced in the surrounding areas. The other overall effect is a negative one, whereby the increase of the land finance scale in the surrounding areas will weaken the deviation level of the implementation of cultivated land protection policies in both the local and adjacent areas. ρ 1 > 0 reflects that the first effect is greater than the second effect. ρ 2 reflects the overflow of deviations in the implementation of cultivated land protection. To be more specific, α 1 > 0 and ρ 1 > 0 mean that there has been a competition strategy, whereby regions imitate one another in their land financing behavior and the degree of deviation in the implementation of cultivated land protection policies in this region and neighboring regions increase simultaneously. α 1 > 0 and ρ 1 < 0 indicate the existence of differentiated competitive strategies in the level of land finance between regions and that the degree of deviation in policy implementation in local regions will increase while that in neighboring regions will weaken. α 1 < 0 and ρ 1 > 0 indicate the presence of differentiated competitive strategies in the level of land finance between regions, whereby the degree of deviation in cultivated land policy implementation in local regions will weaken while that in neighboring regions will increase. α 1 < 0 and ρ 1 < 0 indicate the occurrence of mutual imitation in terms of competition strategies for land financing among regions and that the degree of the policy implementation deviation in both local and neighboring regions will be synchronously weakened. If α 1 > 0 and ρ 1 > 0, then hypothesis 1 holds.
In order to verify hypothesis 2, the full sample period was divided into two stages, bounded by 2006, and the values of the two periods were compared. If the ρ 1 value of the latter stage becomes smaller than the value of the previous stage, or the significance decreases, or the ρ 1 value changes from positive to negative, this means that the change of the political assessment mechanism was beneficial to alleviating the strategy interaction behavior of the implementation deviation of the cultivated land protection policy. This, in turn, would imply that the change in this mechanism was beneficial to alleviating the strategic interaction behavior of mutual imitation with regard to said implementation deviation, hence verifying hypothesis 2.

3.2. Indicator Selection and Data Sources

(1)
Core explanatory variables: Land finance strategy (LF). In line with the above analysis, this paper refers to the research of literature [34]. Considering that in the published data, nearly 90% of land transfer revenues comes from commercial and residential land, with industrial land accounting for only a small proportion, the indicator of the land transfer fee of each province was selected as the proxy variable by which to measure the land transfer strategy (FIN). Alongside this, and referring to the research of scholars such as Xu, N. (2019) [34], the indicator of industrial land supply was selected to reflect the land investment strategy (INV).
(2)
Explained variable: Degree of deviation in the implementation of cultivated land protection policies (DEV). At present, there are three main ways to measure the effects of protecting cultivated land in China. We have taken into account the key role of the country’s cultivated land protection policy in coordinating agricultural production and urban construction and the fact that the impact of land finance on the implementation of such policies is mainly realized through the construction-based occupation of cultivated land. Thus, we selected the amount of cultivated land occupied by construction within a year to represent the degree of deviation in the implementation of cultivated land protection policy. The faster this index grows, the more likely it is that the phenomenon of the “target substitution” of the cultivated land protection policy will occur and the greater the deviation in the implementation of the policy.
(3)
Control variables: With reference to existing research results [7,8,9,12,29,35], the following set of control variables were included that affect the implementation of the cultivated land protection policy. ① Level of economic development (gdpper), measured according to the growth rate of per capita GDP; ② level of urbanization (urban), using the measurement of the proportion of the non-agricultural population in the total population; ③ urban land development intensity (intens), using the proportion of construction land area to the total area of regional land; ④ investment in fixed assets (invest), directly measured by total investment in fixed assets; and ⑤ food production capacity (food), directly measured by per capita food production.
This study used panel data from 30 provinces in China (excluding Tibet, Hong Kong, Macao and Taiwan) from 2000 to 2015. The indicators and data required for the relevant calculations were taken from the annual China City Statistical Yearbook, China Land and Resources Yearbook and China Urban Construction Statistical Yearbook, while the indicators related to the price index were adjusted to constant prices based on the year 2000.

4. Empirical Results and Discussion

4.1. Spatial Correlation Test

In order to measure the degree of agglomeration of provincial land-related fiscal strategies and cultivated land protection policy implementation deviation in terms of geographical space and to judge the applicability of the spatial Durbin model, an exploratory spatial data analysis method was adopted. This method used the spatial autocorrelation Moran index and scatter plot to analyze whether there existed a spatial spillover effect in the implementation deviation of the latter strategies and cultivated land protection policy.
As can be seen from Table 1, in terms of land-related fiscal strategy, the Moran index pertaining to the land transfer strategy and land investment strategy are both positive and both pass the significance level test of at least 10%. These results indicate that the land finance strategies of 30 provinces in China are spatially dependent on spatial distribution, presenting a clear state of agglomeration in geographical space. With the exception of 2004, the Moran value of the implementation deviation of cultivated land protection policy passed the significance test at the level of 10% or lower and presented a wavy fluctuation trend, reaching the lowest value of 0.0459 in 2003. This finding also indicates a significant positive spatial correlation between the implementation deviation of cultivated land protection policy at provincial level in China. The study further found that, although the Moran index of the implementation deviation of land fiscal strategies and cultivated land protection policy fluctuated slightly, it generally increased year by year, in turn demonstrating the annual increase of the spatial correlation between the two. Therefore, it is necessary to use a spatial measurement model to investigate the problems studied in this paper.

4.2. Empirical Test of Hypothesis 1

(1)
Results of full sample estimation
Prior to conducting the spatial regression analysis, we tested the rationality of the model. When considering the spatial weight, the test values of the LR-lag and LR-err rejected the null hypothesis of there being no respective spatial lag term or spatial error term at the 5% level, pointing to the appropriateness of the model selection. Furthermore, considering that the existence of a spatial correlation would lead to the inconsistency of regression parameters, spatial parameters and standard misestimates of the least square estimation space model, the maximum likelihood estimation method was applied for estimation purposes. In addition, and in line with the results of the Hausman’s test, we used a fixed-effects model to estimate the impact of the interaction of the land fiscal strategy on the implementation deviation of the cultivated land protection policy. Table 2 reports the regression results under the three spatial weight matrices of geographic proximity (wcont), geographic distance (wd) and economic distance (wpgdp).
As can be seen from Table 2, under the three types of spatial weights, the estimated coefficients of the land transfer strategy FIN and w·FIN are significantly positive at the statistical level of at least 10%. This indicates the presence of imitative land transfer strategies among the studied provinces in China. This also means that the improvement to a particular province’s land financing level is not only based on its own urban construction demand, but also on the land transfer scale of neighboring local governments, which act as mutual competitors. Moreover, the land transfer behavior in a given region can be seen to have a positive spillover effect on the implementation of the cultivated land protection policy in neighboring regions. This phenomenon is particularly prominent in China and some Western countries [11]. That is to say, when the given region expands its scale of land transfer, this will stimulate neighboring regions to do the same, which will not only increase the degree of the initial region’s own cultivated land policy implementation deviation but will also contribute to the same policy implementation deviation in adjacent areas. Finally, the competition phenomenon of “if you increase, I will also increase” in land transfer scale is presented, which leads to “if you deviate from the implementation, and I will deviate from the implementation too”, thus forming a “low level” equilibrium state of policy implementation. Meanwhile, from the perspective of interaction intensity, the estimation coefficient of w·FIN under the weight of geographical distance emerged as higher than the estimated coefficient under the other two types of weights. This indicates that when regions conduct strategic interactions with regard to the scale of land transfers, they pay more attention to their adjacent areas in terms of “geographical significance”.
Second, with regard to land investment strategy, the estimated coefficients of INV and w·INV for these strategies can be seen to be significantly positive under the three spatial weights. This indicates to the presence of strategic complementary behaviors between geographically adjacent and economically similar regions in terms of attracting land investment. Moreover, the increase in the intensity of land investment in a given region will not only intensify the deviation of its own policy implementation but will also synchronously aggravate the degree of this deviation in neighboring regions. Moreover, from the perspective of interaction intensity, the estimated coefficients of w·INV under the economic distance weight emerged as higher than those under the other two weights, indicating that when regions conduct strategic interactions with regard to land investment, they pay more attention to the “economic significance” of adjacent regions. By further comparing the estimated coefficients of land transfer and land investment strategies, it was found that compared with the former, land investment strategies are wider in scope in terms of spatial spillover. This, in turn, not only leads to a greater degree of deviation in the implementation of cultivated land protection policies in geographically adjacent areas, but also in areas with similar economic levels. The possible reason is that the local government has a “free rider” tendency in farmland protection and they are not willing to increase the investment in farmland protection before the surrounding areas. Therefore, to avoid the situation in which the external benefits of cultivated land protection are shared by the competitors in neighboring areas, there is no internal incentive to protect cultivated land in the given area.
Based on the estimation results of other control variables, the estimated coefficient of per capita GDP emerged as significantly positive at the 1% level, showing that the implementation intensity of cultivated land protection policy decreases with the growth of per capita GDP. This finding is consistent with the study of Xu, G. et al. (2012) [16]. For provinces with a higher level of economic development, land appreciation could be seen to be faster and local governments more inclined to relax the protection of cultivated land in order to gain investment advantages by selling commercial land at a high price in a more market-oriented manner. Meanwhile, it also implies that the local governments’ economic investments are not inclined towards the remit of cultivated land protection. The estimated coefficient of the urbanization level is significantly positive under the weight of the geographic and economic matrices. This finding shows that the greater the financial pressure faced by local governments, the more incentives they will have to obtain more urban land by applying indicators too quickly or even breaking through the indicators of cultivated land protection, thereby exacerbating the degree of policy implementation deviations. In addition, the estimated coefficient of urban land development intensity emerged as significantly positive at 5% and lower. The impacts of fixed asset investment and grain production capacity on the implementation of the cultivated land protection policy are not marked. However, the estimated coefficient of the spatial lag term does not fully explain the impact of the interaction between land-related fiscal strategies on the implementation deviation of cultivated land protection policy. This is because this coefficient not only includes the direct impact of changes to such strategies on this deviation, but also includes the indirect impact of deviations in the implementation of cultivated land protection policies in neighboring areas.
In what follows, we analyze the impact of the interaction of land-related fiscal strategies on the implementation deviation of the cultivated land protection policy from three perspectives: direct effect, indirect effect and total effect. The results are shown in Table 3. In terms of the spatial spillover effect of the land transfer strategy FIN, taking the geographical adjacency matrix as an example, under the weight of geographic proximity every 1% increase in the scale of local land transfers will lead to an increase of 0.2228% in the implementation of the cultivated land protection policy deviation. Among this, the said deviation in the local area will increase by 0.1637% and in the adjacent area it will increase by 0.0719%. This implies that the estimated coefficient of the direct effect of FIN’s influence on the policy implementation deviation is much larger than the indirect effect. This conclusion remains valid under the other two types of weights. Similarly, under the weight of geographic proximity, for every 1% increase in land investment, the local cultivated land protection policy implementation deviation will increase by 0.2166% and in adjacent areas it will increase by 0.1033%. In contrast, the spatial spillover effect of the land investment strategy can be seen to be greater than that of the land transfer strategy and to have a stronger impact on the deviation of the implementation of the cultivated land protection policy.
(2)
Sub-regional estimation results
In order to investigate the spatial spillover effects of the interaction of land fiscal strategies in different regions on the implementation deviations of cultivated land protection policies, the paper also estimates the spatial spillover effects of the implementation deviations of land fiscal strategies on such policies in the eastern, central and western regions of China. As can be seen from Table 4, from 2000 to 2015, the land fiscal strategy (land transfer strategy and land investment strategy) of the eastern, central and western regions manifested marked imitative and regional interactions. That is, the phenomenon of “you improve, I also improve”, which led to the result of “you bias, I bias” in the implementation of cultivated land protection policies. In general, the overall effect of land finance on the implementation deviation of cultivated land protection policies in the eastern region can be seen to be the largest, followed by the central region and the lowest appearing in the western region, showing a geographical pattern of gradual increase from west to east. The reason for this may be that the contribution of incremental land expansion to the growth of land fiscal revenue increases with the improvement of the economic development level. Although the trend of promoting economic development by incremental land expansion in eastern China has slowed down in recent years, the proportion of construction land available in eastern China remains the highest among the three regions. The acceleration of industrialization and urbanization in the central and western regions has been achieved by copying the model of “using land for development” applied in the eastern region. On one hand, since the “Rise of China’s Central Region” strategy was proposed in 2000 in the central region, this area has achieved rapid economic development through intensive industrial foundation building and industrial transfers. These have, in turn, stimulated the rapid growth of land demand and incentives for the non-agricultural conversion of cultivated land. On the other hand, the increase in urban land defined in the overall land use plan and the annual land use plan is relatively large, which is more likely to induce the incomplete implementation of cultivated land protection. Regarding the western region, its fiscal revenue growth mainly depends on the expansion of its land transfer area, and the tendency to consume land is obvious. However, due to this region’s superior land resource endowment and the small proportion of cultivated land resources, the sources of incremental land tend to be diversified, serving to alleviate the deviation of the implementation of cultivated land protection policy to a certain extent. Specifically, under the three kinds of spatial matrix weights, except for the central region, the estimated coefficients of the direct effect of the land transfer strategy are greater than those of the indirect effect. This indicates that the central region’s land transfer strategy has a strong spatial “multiplier effect” on the impact of the deviation in the implementation of the cultivated land protection policy. This means that the expansion of the scale of land transfer in this region will lead to the consequences of policy implementation deviations being nearly twice that of neighboring regions. In contrast, the estimated coefficients of the indirect effects of land investment strategies in the eastern, central and western regions are all greater than the direct effects. This finding further illustrates that compared with land transfer strategies, the competition for investment in land-related fiscal strategies has a stronger impact on the implementation deviation of the cultivated land protection policy in neighboring areas.
The eastern regions studied in this article include Beijing, Tianjin, Hebei, Liaoning, Shanghai, Jiangsu, Zhejiang, Fujian, Shandong, Guangdong and Hainan; the central regions include Heilongjiang, Jilin, Shanxi, Anhui, Jiangxi, Henan, Hubei and Hunan; the western regions include Sichuan, Chongqing, Guizhou, Yunnan, Shaanxi, Gansu, Qinghai, Ningxia, Xinjiang, Guangxi and Inner Mongolia.

4.3. Empirical Test of Hypothesis 2

In 2006, for the first time, China’s central government proposed the inclusion of cultivated land protection as a “binding” indicator within local governments’ performance evaluation system. This was a milestone in reshaping local governments’ land finance and cultivated land protection behavior. In light of this, the current study took 2006 as the research node to compare changes in the interactive forms of local government land finance strategies before and after the changes in the performance evaluation system, in two different time periods, 2000–2006 and 2007–2015.
Table 5 reports the full sample estimation results for these two periods. Comparing them, it can be seen that under the three types of spatial matrix weight, the estimated coefficient and significance of the main variables do not change significantly, however, the degree of spatial spillover of land fiscal strategies does, indeed, change. The estimated coefficients of the direct effects, indirect effects and total effects of land transfer strategies and land investment strategies from 2007 to 2015 appear mostly lower than those from 2000 to 2006.This means that with the transformation of the performance appraisal system, the regional imitation characteristics pertaining to land financing strategies weakened. This further implies that, as the central government incorporated farmland protection policies into the performance evaluation system of local governments, the spatial competition for land financing among the latter was slightly eased, thereby weakening the strategic interaction of deviations in the implementation of cultivated land protection policies. Thus, Hypothesis 2 was verified.
In addition, taking into account the obvious differences in factors such as the level of economic development among different regions in China, we further examined whether there existed regional heterogeneity in the above conclusions. The study found the above conclusion to be valid in the eastern region but not in the central and western regions (Table 6). Specifically, on one hand, the weakening effect of land finance strategy interactions caused by the transformation of the performance evaluation mechanism was seen to exist in the eastern region but was not marked in the central and western regions. The reason for this may be that the eastern region has a higher economic development potential, access to more cutting-edge technology and a better land market. Therefore, local governments in this region were better able to adapt to the transformation of the performance evaluation mechanism. On the other hand, in the eastern region sample, while the spatial spillover effects of the implementation of the adjacent cities’ land transfer and land investment strategies from 2000 to 2006 passed the significance test, after 2006 the significance of this spatial spillover effect was not stable. This phenomenon also exists in the central and western regions.

5. Main Conclusions and Policy Implications

5.1. Main Conclusions

The existing literature emphasizes the analysis of the influence of land finance on the implementation deviation of cultivated land protection policy from the perspective of the local government’s own initiative, ignoring the influence of the behavior of rival local governments. Thus, this approach cannot explain the universality of the implementation deviation of China’s cultivated land protection policy. Engaging with this gap, the current paper considers the spatial interaction of the deviation of land finance and cultivated land protection policy implementation from the dual perspectives of land transfer strategy and land investment strategy. The study constructs a theoretical framework for ways in which the spatial interaction of regional land-related fiscal strategies affects the implementation deviation of cultivated land protection policies based on the data of 30 provinces in China from 2000 to 2015. The spatial Durbin model is used for empirical purposes and in order to yield policy suggestions for solving the dilemma pertaining to the implementation of China’s cultivated land protection policy. The following key findings emerged: ① Whether at the national or regional level, land transfer and land investment strategies will aggravate the degree of deviation in the implementation of local cultivated land protection policies. ② Given local governments’ mutual imitation of land transfer and land investment strategies, their land fiscal behavior has a positive spatial spillover effect. In other words, there is a marked interactive phenomenon of “you improve, I also improve” at the level of land financing. Thus, the implementation of the cultivated land protection policy presents the result of “you deviate from implementing the policy, I also deviate”. ③ There emerged clear differences in the spatial spillover effects of land transfer strategies and land investment strategies between the eastern, central and western regions of China. In general, however, compared with land transfer strategies, the spatial interaction of land investment strategies was a more important factor seen to cause widespread deviations in the implementation of cultivated land protection policies. ④ After 2006, the interactive trend of land-related fiscal strategies among provinces was seen to gradually weaken, indicating that the transformation of the local government performance evaluation method may help to weaken the interactive behavior of local governments’ land finance strategies. Therefore, this performance mechanism transformation not only alleviates the degree of deviation in the implementation of local cultivated land protection policies, but also eases the degree of this deviation in neighboring provinces. Similar conclusions have been deployed in other countries around the world. According to a study conducted by Kurowska, K.et al. (2020) in Poland, the procedure of granting approvals for the conversion of agricultural land and forests to other uses is conducted by local government departments responsible for spatial planning; local authorities are mostly responsible for land-use patterns [1].

5.2. Policy Implications

Based on the above conclusions, this paper derives the following policy implications: First, local governments in China should be guided to compete virtuously and build a regional cooperation mechanism. On one hand, the administrative behavior of local governments should be reshaped so as to guide their healthy competition in terms of economic development and reduce the indirect impact of regional scale competition on deviations in policy implementation. On the other hand, the weight of economic growth in the appraisal system of local government performance should be reduced while the weight of cultivated land protection should be increased. In addition, it would be useful to carry out a diversification of local officials’ assessments for promotion, strictly implementing a lifelong system of responsibility for cultivated land resources and alleviating the “target substitution” of cultivated land protection caused by regional growth competition. Secondly, the structure of local fiscal revenue should be adjusted and local governments’ dependence on land transfer income should be weakened. The focus here would be on adjusting the tax sharing ratio by promoting the reform of the land and real estate fiscal and taxation system, and by accelerating the construction of the local tax system. This is so local governments would be able to develop new financial sources through reasonable and stable channels to compensate for the expenditure gaps in urban construction and public services. At the same time, real-time monitoring of the land transfer situation of local governments should be carried out and the supervision and early warning system should be improved to eliminate the path dependence of land finance as soon as possible. Finally, the supervision of the quality of foreign investment should be strengthened and the traditional development model changed in order to focus on the scale of foreign investment. The quality evaluation system for investment promotion should be reconstructed, combined with the regional development positioning and industrial layout advantages in order to attract investment in a targeted manner and improve the efficiency of investment and its positive spillover effect.
Revealing the universality of deviations in the implementation of China’s cultivated land protection policies from the perspective of how local governments’ land-related finance strategies interact is arguably of great significance to the reform of China’s land finance system and to the elimination of the current dangers to the protection of cultivated. This research is only a preliminary exploration, containing certain shortcomings and highlighting the need for further research. For example, this paper focuses on the study of the impact mechanism of the strategic interaction of land finance on the implementation deviation of cultivated land protection. It does not consider the reverse impact effect of the strategic interaction of the implementation deviation of cultivated land protection on land finance. The study was also limited by difficulties in obtaining data. In addition, the selection of indicators for measuring the degree of deviation in the implementation of cultivated land protection policies was idealization and the aspect of the actual quality of cultivated land protection was not considered.

Author Contributions

Conceptualization; methodology; writing—original draft and editing, X.Z.; Funding acquisition; software; writing—review and editing, D.C.; Supervision; project administration X.L.; Data curation; visualization, Y.T.; Resources; software, B.J. All authors have read and agreed to the published version of the manuscript.

Funding

This research is funded by the Independent science and technology innovation fund of Huazhong Agricultural University, PR China (Project No: 2662020GGQD001); Interdisciplinary Funding from Huazhong Agricultural University(2662021JC002); China Postdoctoral Science Foundation (2020M67236); Shihezi University high-level talents scientific research project (RCSK201904).

Data Availability Statement

The data presented in this study are available on request from the first author.

Conflicts of Interest

The authors declare no conflict of interest.

References

  1. Kurowska, K.; Kryszk, H.; Marks-Bielska, R.; Mika, M.; Leń, P. Conversion of agricultural and forest land to other purposes in the context of land protection: Evidence from Polish experience. Land Use Policy 2020, 95, 104614. [Google Scholar] [CrossRef]
  2. Bryan, J.E.; Shearman, P.L.; Asner, G.P.; Knapp, D.E.; Aoro, G.; Lokes, B.; Chave, J. Extreme differences in forest degradation in Borneo: Comparing practices in Sarawak, Sabah, and Brunei. PLoS ONE 2013, 8, e69679. [Google Scholar] [CrossRef] [PubMed] [Green Version]
  3. Zambon, I.; Rontos, K.; Serra, P.; Colantoni, A.; Salvati, L. Population Dynamics in Southern Europe: A Local-Scale Analysis, 1961–2011. Sustainability 2019, 11, 109. [Google Scholar] [CrossRef] [Green Version]
  4. Parry, J.A.; Ganaie, S.A.; Sultan Bhat, M. GIS based land suitability analysis using AHP model for urban services planning in Srinagar and Jammu urban centers of J.&K., India. J. Urban Manag. 2018, 7, 46–56. [Google Scholar]
  5. Lu, X.; Zhang, Y.; Tang, H. Modeling and Simulation of Dissemination of Cultivated Land Protection Policies in China. Land 2021, 10, 160. [Google Scholar] [CrossRef]
  6. Su, M.; Guo, R.; Hong, W. Institutional transition and implementation path for cultivated land protection in highly urbanized regions: A case study of Shenzhen, China. Land Use Policy 2019, 81, 493–501. [Google Scholar] [CrossRef]
  7. Guo, S.; Shi, Y. Infrastructure investment in China: A model of local government choice under land financing. J. Asian Econ. 2018, 56, 24–35. [Google Scholar] [CrossRef]
  8. Huang, Z.; Du, X. Holding the market under the stimulus plan: Local government financing vehicles’ land purchasing behavior in China. China Econ. Rev. 2018, 50, 85–100. [Google Scholar] [CrossRef]
  9. Mo, J. Land financing and economic growth: Evidence from Chinese counties. China Econ. Rev. 2018, 50, 218–239. [Google Scholar] [CrossRef]
  10. Lu, J.; Li, B.; Li, H. The influence of land finance and public service supply on peri-urbanization: Evidence from the counties in China. Habitat Int. 2019, 92, 102039. [Google Scholar] [CrossRef]
  11. Huang, D.; Chan, R.C.K. On ‘Land Finance’ in urban China: Theory and practice. Habitat Int. 2018, 75, 96–104. [Google Scholar] [CrossRef]
  12. Hu, F.Z.Y.; Qian, J. Land-based finance, fiscal autonomy and land supply for affordable housing in urban China: A prefecture-level analysis. Land Use Policy 2017, 69, 454–460. [Google Scholar] [CrossRef]
  13. Fan, X.; Qiu, S.; Sun, Y. Land finance dependence and urban land marketization in China: The perspective of strategic choice of local governments on land transfer. Land Use Policy 2020, 99, 105023. [Google Scholar] [CrossRef]
  14. Zhang, W.; Wang, W.; Li, X.; Ye, F. Economic development and farmland protection: An assessment of rewarded land conversion quotas trading in Zhejiang, China. Land Use Policy 2014, 38, 467–476. [Google Scholar] [CrossRef]
  15. Zhou, Y.; Li, X.; Liu, Y. Cultivated land protection and rational use in China. Land Use Policy 2021, 106, 105454. [Google Scholar] [CrossRef]
  16. Xu, G.; Huang, X.; Zhong, T.; Chen, Y.; Wu, C.; Jin, Y. Assessment on the effect of city arable land protection under the implementation of China’s National General Land Use Plan (2006–2020). Habitat Int. 2015, 49, 466–473. [Google Scholar] [CrossRef]
  17. Kuang, B.; Han, J.; Lu, X.; Zhang, X.; Fan, X. Quantitative evaluation of China’s cultivated land protection policies based on the PMC-Index model. Land Use Policy 2020, 99, 105062. [Google Scholar] [CrossRef]
  18. Yongle, L.; Qun, W. Quantitative Change of Cultivated Land Based on the Current System of Finance and Taxation. China Popul. Resour. Environ. 2007, 17, 119–123. [Google Scholar] [CrossRef]
  19. Li, W.; Feng, T.; Hao, J. The evolving concepts of land administration in China: Cultivated land protection perspective. Land Use Policy 2009, 26, 262–272. [Google Scholar] [CrossRef]
  20. Jiang, L.; Deng, X.; Seto, K.C. Multi-level modeling of urban expansion and cultivated land conversion for urban hotspot counties in China. Landsc. Urban Plan. 2012, 108, 131–139. [Google Scholar] [CrossRef]
  21. Shen, X.; Wang, L.; Wu, C.; Lv, T.; Lu, Z.; Luo, W.; Li, G. Local interests or centralized targets? How China’s local government implements the farmland policy of Requisition–Compensation Balance. Land Use Policy 2017, 67, 716–724. [Google Scholar] [CrossRef]
  22. Liu, T.; Liu, H.; Qi, Y. Construction land expansion and cultivated land protection in urbanizing China: Insights from national land surveys, 1996–2006. Habitat Int. 2015, 46, 13–22. [Google Scholar] [CrossRef]
  23. Skinner, M.W.; Kuhn, R.G.; Joseph, A.E. Agricultural land protection in China: A case study of local governance in Zhejiang Province. Land Use Policy 2001, 18, 329–340. [Google Scholar] [CrossRef]
  24. Liang, X.; Jin, X.; Sun, R.; Han, B.; Liu, J.; Zhou, Y. A typical phenomenon of cultivated land use in China’s economically developed areas: Anti-intensification in Jiangsu Province. Land Use Policy 2021, 102, 105223. [Google Scholar] [CrossRef]
  25. Liang, X.; Li, Y. Identification of spatial coupling between cultivated land functional transformation and settlements in Three Gorges Reservoir Area, China. Habitat Int. 2020, 104, 102236. [Google Scholar] [CrossRef]
  26. Liang, C.; Penghui, J.; Wei, C.; Manchun, L.; Liyan, W.; Yuan, G.; Yuzhe, P.; Nan, X.; Yuewei, D.; Qiuhao, H. Farmland protection policies and rapid urbanization in China: A case study for Changzhou City. Land Use Policy 2015, 48, 552–566. [Google Scholar] [CrossRef]
  27. Marksbielska, R.; Lizińska, W.; Babuchowska, K.; Wojarska, M. Factors Determining the Institutional Efficiency of Self-Governments in the Economic and Spatial Area. High. Sch. Manag. Adm. Zamość 2017, 15, 67–75. [Google Scholar]
  28. Mittal, J. Self-financing land and urban development via land readjustment and value capture. Habitat Int. 2014, 44, 314–323. [Google Scholar] [CrossRef]
  29. Hong, Z.; Yi, Z.; Tiantian, C. Land remise income and remise price during China’s transitional period from the perspective of fiscal decentralization and economic assessment. Land Use Policy 2016, 50, 293–300. [Google Scholar] [CrossRef]
  30. Robinson, D.F.; Graham, N. Legal pluralisms, justice and spatial conflicts: New directions in legal geography. Geogr. J. 2018, 184, 3–7. [Google Scholar] [CrossRef]
  31. Zhang, S.; Hu, W.; Huang, L.; Du, H. Exploring the Effectiveness of Multifunctional Cultivated Land Protection Linking Supply to Demand in Value Engineering Theory: Evidence from Wuhan Metropolitan Area. Sustainability 2019, 11, 6229. [Google Scholar] [CrossRef] [Green Version]
  32. Tang, P.; Shi, X.; Gao, J.; Feng, S.; Qu, F. Demystifying the key for intoxicating land finance in China: An empirical study through the lens of government expenditure. Land Use Policy 2019, 85, 302–309. [Google Scholar] [CrossRef]
  33. Xie, H.; Huang, Y.; Choi, Y.; Shi, J. Evaluating the sustainable intensification of cultivated land use based on emergy analysis. Technol. Forecast Soc. 2021, 165, 120449. [Google Scholar] [CrossRef]
  34. Xu, N. What gave rise to China’s land finance? Land Use Policy 2019, 87, 104015. [Google Scholar] [CrossRef]
  35. Tian, L. Land use dynamics driven by rural industrialization and land finance in the peri-urban areas of China: “The examples of Jiangyin and Shunde”. Land Use Policy 2015, 45, 117–127. [Google Scholar] [CrossRef]
Figure 1. Influence mechanism of the interactive behavior of land-related finance strategies on the implementation deviation of cultivated land protection.
Land 10 00803 g001
Table 1. Moran index table of the deviation between land fiscal strategy and the implementation of cultivated land protection policy from 2000 to 2015.
Land Transfer StrategyLand Investment StrategyDeviation of Cultivated Land Protection Policy Implementation
yearMoranZMoranZMoranZ
20000.0712 **1.00430.1511 **1.72570.0611 **0.5429
20010.0915 *1.37220.1423 *1.57110.0658 **0.6022
20020.1334 **1.64910.1237 *1.32880.0997 *0.8790
20030.1035 ***1.85660.1558 **1.93710.0459 *0.2932
20040.0940 ***1.41350.1523 **1.83320.10841.4540
20050.1017 **1.79180.1527 **1.86730.1098 **1.5920
20060.1052 **1.98120.1354 **1.40140.1177 **1.7311
20070.0968 **2.11050.1377 ***1.45050.1449 ***2.0124
20080.1141 **1.96390.1262 ***1.37630.1671 ***2.7433
20090.1358 **1.81920.1627 **2.14490.1608 **2.9013
20100.1340 ***2.13110.1689 ***2.36080.1722 ***3.1204
20110.1430 ***2.01630.1848 ***2.55300.1745 ***3.2774
20120.1476 ***2.18600.1975 ***2.83340.1718 ***3.3828
20130.1502 ***2.20730.1620 **2.05450.1941 ***3.7970
20140.1688 ***2.55160.1796 **2.30040.2621 ***4.7970
20150.1853 ***2.84130.1885 **2.67520.2317 **4.2707
Notes: *, **, *** represent significance at the 10%, 5% and 1% levels, respectively.
Table 2. Estimated results of the full sample from 2000 to 2015.
Variablewcontwdwpgdp
w·DEV0.5919 ** (0.1991)0.3166 ** (0.1604)0.7502 ** (0.2051)
w·FIN0.2607 * (0.0633)0.2019 *** (0.0587)0.1711 ** (0.0757)
w·IVN0.2316 *** (0.0988)0.1449 (0.1046)0.3084 *** (0.1077)
FIN0.1556 * (0.0926)0.1531 * (0.0905)0.1382 * (0.0826)
IVN0.2075 *** (0.0793)0.1075 (0.0783)0.2107** (0.0867)
gdpper−12.2729 *** (0.4318)−12.4906 *** (0.4506)−12.3874 *** (0.4480)
urban1.1492 ** (0.6009)1.0284 (0.6319)1.6566 ** (0.6117)
intens7.1058 *** (0.7996)7.0256 ** (0.8285)7.3880 *** (0.8003)
invest0.0279 (0.1403)0.0544 (0.1884)−0.0417 (0.2012)
food11.7167 (9.9821)11.7714 (9.0277)11.8032 (9.0318)
LR-lag16.94 ***10.83 **7.94 **
LR-err7.05 **6.26 *6.96 **
R20.35600.35050.3391
Obs.480480480
Notes: *, **, *** represent significance at the 10%, 5% and 1% levels, respectively; standard errors are shown in parentheses. The same applied to the following table.
Table 3. Direct, indirect and total effect of the SDM model.
VariableDirect EffectIndirect EffectTotal Effect
wcontwdwpgdpwcontwdwpgdpwcontwdwpgdp
FIN0.1637 * (0.0968)0.1489 * (0.0877)0.1302 * (0.0811)0.0591 **
(0.0282)
0.0719
(0.0503)
0.0611 **
(0.0305)
0.2228 **
(0.1119)
0.2208 *
(0.1237)
0.1913
(0.1255)
INV0.2166 *** (0.0674)0.1005 (0.0753)0.2036 ** (0.0867)0.1033 **
(0.0439)
0.0942 **
(0.0377)
0.1102 *
(0.0477)
0.3199 **
(0.1280)
0.1947
(0.1300)
0.3138 ***
(0.1212)
R20.37520.35030.42110.37520.35030.42110.37520.35030.4211
Obs.480480480480480480480480480
Notes: *, **, *** represent significance at the 10%, 5% and 1% levels, respectively.
Table 4. Estimated results by region from 2000 to 2015.
VariableEastern ChinaCentral ChinaWestern China
wcontwdwpgdpwcontwdwpgdpwcontwdwpgdp
Direct EffectFIN0.3889 **
(0.1852)
0.3427
(0.2201)
0.3519 *
(0.1914)
0.1292 **
(0.0636)
0.1207
(0.0741)
0.1309 *
(0.0746)
0.1044 **
(0.0497)
0.1130 **
(0.0501)
0.1021 **
(0.0473)
IVN0.4745 **
(0.2259)
0.4511 *
(0.2370)
0.4673 **
(0.2201)
0.3207
(0.2056)
0.3213
(0.2508)
0.3205
(0.2137)
0.1679 ***
(0.0643)
0.1618 **
(0.0711)
0.1579 **
(0.0744)
Indirect EffectFIN0.1876
(0.3908)
0.1823
(0.3866)
0.1879
(0.3917)
0.2577 *
(0.1524)
0.2216
(0.1337)
0.2356 **
(0.1184)
0.0675 *
(0.0397)
0.0612
(0.0401)
0.0627
(0.0388)
IVN0.3674 ***
(0.1621)
0.3611 **
(0.1607)
0.3302 **
(0.1698)
0.3740 **
(0.1497)
0.3619 **
(0.1426)
0.3640
(0.1572)
0.0729 *
(0.0436)
0.0611
(0.0402)
0.0713
(0.0434)
Total EffectFIN0.5073 **
(0.2507)
0.5250 **
(0.2509)
0.5398 **
(0.2433)
0.3869 **
(0.1573)
0.3323
(0.1330)
0.3665 **
(0.1506)
0.1719 *
(0.1017)
0.1742
(0.1068)
0.1648
(0.1033)
IVN0.8419 ***
(0.3083)
0.8122 **
(0.3212)
0.8270 **
(0.3217)
0.6947 ***
(0.2508)
0.6532 *
(0.3629)
0.6745 *
(0.3842)
0.2408
(0.1544)
0.2229
(0.1437)
0.2292
(0.1477)
R20.55040.57210.56130.71550.69270.68130.43310.44760.4520
Obs.176176176128128128176176176
Notes: *, **, *** represent significance at the 10%, 5% and 1% levels, respectively.
Table 5. Time segment estimation results of the full sample.
YearsDirect EffectIndirect EffectTotal Effect
2000–2006wcontwdwpgdpwcontwdwpgdpwcontwdwpgdp
FIN0.3183 **
(0.1428)
0.3308 ** (0.1677)0.3221 *
(0.1652)
0.1319 **
(0.0580)
0.1277 ***
(0.0436)
0.1304 **
(0.0508)
0.4502 **
(0.2218)
0.4585 *
(0.2351)
0.4525 *
(0.2217)
INV0.2017 *
(0.1068)
0.2005 ** (0.1013)0.2114 *
(0.1129)
0.2356 ***
(0.0732)
0.2119 ***
(0.0718)
0.2249 ***
(0.0688)
0.4131 ***
(0.1594)
0.4361 **
(0.1708)
0.4363 **
(0.1706)
R20.71240.69160.70140.71240.69160.70140.71240.69160.7014
Obs.210210210210210210210210210
2007–2015wcontwdwpgdpwcontwdwpgdpwcontwdwpgdp
FIN0.2108 **
(0.1044)
0.2005 *
(0.1031)
0.2034 *
(0.1036)
0.1165 *
(0.0693)
0.1077 **
(0.0437)
0.1264 *
(0.0712)
0.3273 *
(0.1911)
0.3082 *
(0.1712)
0.3298 *
(0.1717)
INV0.1068 *
(0.0628)
0.1117
(0.0848)
−0.0209
(0.0306)
0.2114 *
(0.1136)
0.2049 *
(0.1105)
−0.0649
(0.0447)
0.3182 *
(0.1748)
0.3166 *
(0.1713)
−0.0858
(0.0655)
R20.81240.80130.77510.81240.80130.77510.81240.80130.7751
Obs.270270270270270270270270270
Notes: *, **, *** represent significance at the 10%, 5% and 1% levels, respectively.
Table 6. Estimation results of time segments in different regions.
YearsEastern ChinaCentral ChinaWestern China
2000–2006wcontwdwpgdpwcontwdwpgdpwcontwdwpgdp
Direct EffectFIN0.3127 **
(0.1350)
0.3008 **
(0.1312)
0.3237 **
(0.1351)
0.1445 *
(0.0855)
0.1423 *
(0.0823)
−0.0234
(0.0455)
0.1204 *
(0.0684)
0.1115 *
(0.0612)
0.1237 *
(0.0717)
IVN0.4122 *
(0.2148)
0.4099 *
(0.2123)
0.4338
(0.2719)
0.2203 *
(0.1303)
0.2238 *
(0.1301)
0.2317
(0.1512)
0.1688 **
(0.0846)
0.1673 *
(0.0922)
0.1829
(0.1190)
Indirect EffectFIN0.2913 *
(0.1720)
0.3233 *
(0.1712)
0.3527 **
(0.1726)
0.1105 *
(0.0630)
0.1036 *
(0.0544)
0.1204
(0.0774)
0.1422 *
(0.0817)
0.1537 *
(0.0718)
0.1401 *
(0.0806)
IVN0.4403
(0.2822)
0.4211 *
(0.2618)
0.4614
(0.3007)
0.2218 *
(0.1179)
0.2513 *
(0.1290)
0.2773 *
(0.1652)
0.2013 *
(0.1082)
0.1898 *
(0.1013)
0.1977 *
(0.1034)
Total EffectFIN0.6040 *
(0.3617)
0.6241 *
(0.3772)
0.6764 *
(0.3688)
0.2550 *
(0.1527)
0.2459 *
(0.1442)
0.0970
(0.0637)
0.2626 *
(0.1572)
0.2652 *
(0.1426)
0.2638 *
(0.1588)
IVN0.8525 *
(0.4511)
0.8310 *
(0.4416)
0.8952 *
(0.4611)
0.4417 *
(0.2481)
0.4751 *
(0.2571)
0.5090
(0.3214)
0.3701 *
(0.2136)
0.3571 *
(0.2030)
0.3806
(0.2412)
R20.77230.73240.75190.50320.48230.53820.63250.66170.6823
Obs.176176176128128128176176176
2007–2015wcontwdwpgdpwcontwdwpgdpwcontwdwpgdp
Direct EffectFIN0.2055 **
(0.0978)
0.2107 **
(0.1010)
0.2124 *
(0.1134)
0.2683 *
(0.1588)
0.2516
(0.1542)
−0.0317
(0.0319)
0.1309 *
(0.0696)
0.1424 **
(0.0617)
0.1327 *
(0.0722)
IVN0.2419 *
(0.1439)
0.3014
(0.1878)
0.2377
(0.1424)
0.3217 **
(0.1398)
0.3113 **
(0.1341)
0.2914 **
(0.1306)
0.2017 **
(0.0807)
0.2219 **
(0.1004)
0.1966 **
(0.0774)
Indirect EffectFIN0.1237 *
(0.0745)
0.1264 *
(0.0743)
0.1322 (0.0833)0.1377 *
(0.0830)
0.1402
(0.0922)
0.1417
(0.1012)
0.1155 *
(0.0607)
0.1224 *
(0.0644)
0.1302
(0.0822)
IVN0.2515 *
(0.1462)
0.2477 *
(0.1423)
0.2517
(0.1677)
0.3511 **
(0.1526)
0.2916 **
(0.1436)
0.3312 **
(0.1367)
0.1915
(0.1212)
0.1817 *
(0.1027)
0.1838
(0.1207)
Total EffectFIN0.3292 *
(0.1742)
0.3371 *
(0.1990)
0.3446
(0.2104)
0.4060 *
(0.2281)
0.3918
(0.1516)
0.1100
(0.0922)
0.2464 *
(0.1368)
0.2648 *
(0.1553)
0.2629 **
(0.1305)
IVN0.4934
(0.3270)
0.5491
(0.3611)
0.4894
(0.3011)
0.6728 **
(0.2691)
0.6029 **
(0.2621)
0.6226 **
(0.2909)
0.3932 *
(0.2125)
0.4036 *
(0.2315)
0.3809 *
(0.2106)
R20.57230.58340.60810.74320.75940.80330.42190.44070.4350
Obs.176176176128128128176176176
Notes: *, ** represent significance at the 10%, 5% levels, respectively.
Publisher’s Note: MDPI stays neutral with regard to jurisdictional claims in published maps and institutional affiliations.

