Article

Spatiotemporal Changes of Land Ecological Security and Its Obstacle Indicators Diagnosis in the Beijing–Tianjin–Hebei Region

1
College of Earth Sciences, Jilin University, Changchun 130061, China
2
Institute of Mining Green Development, Chinese Academy of Natural Resources Economics, Beijing 101149, China
3
School of Finance and Taxation and Public Administration, Jiangxi University of Finance and Economics, Nanchang 330013, China
4
Institute of Natural Resource Owners’ Quity, Chinese Academy of Natural Resources Economics, Beijing 101149, China
5
Institute of Geographic Sciences and Natural Resources Research, Chinese Academy of Sciences, Beijing 100101, China
*
Author to whom correspondence should be addressed.
Land 2021, 10(7), 706; https://doi.org/10.3390/land10070706
Submission received: 19 May 2021 / Revised: 29 June 2021 / Accepted: 1 July 2021 / Published: 4 July 2021

Abstract

:
Land ecological security (LES) is a cornerstone of sustainable development, and the study of the LES evaluation has become a hot field in the LES problems. The coordinated development of the Beijing–Tianjin–Hebei (BTH) region is one of China’s national development strategies. With the development of urbanization and industrialization, the conflicts between people and land in this area are increasingly prominent, and there are large regional differences in land ecological quality. To evaluate the land ecological security (LES) of this region, an evaluation index system is constructed based on the pressure–state–response (PSR) framework model, and the entropy-weighted TOPSIS method is applied to calculate the LES index. Then, the spatio-temporal changes of LES in the BTH region from 2007 to 2018 are analyzed. In addition, we adopt an obstacle degree model to analyze the obstacle indicators. The results show that the LES of the BTH region increased from 0.1934 to 0.3284 during 2007–2018, and the LES level increased from the dangerous level (I) to the critical level (III). Despite the improved LES in all areas in the BTH region, there were different trends (high in the central area, relatively low in the northern and southern areas). We identified seven obstacle indicators and discussed different development strategies. Our findings will provide guidelines for land use management and offer references for the coordinated development of the BTH region.

1. Introduction

The specific concept of ecological security was first proposed by the United States (U.S.) government, which has drawn considerable attention from the international research community [1]. Ecological security can also reflect the integrity and health of the ecosystem, which is defined as the comprehensive status of the human ecosystem [2]. Natural ecosystems provide the materials and services needed for human survival, so maintaining ecosystem security is essential for achieving sustainable socio-economic development [3].
Sustainability refers to a state or condition that can meet human demands and prevent human activities from damaging the ecosystem [4]. Rapid socio-economic development, urbanization and industrialization have caused overexploitation of resources, putting huge pressure on the natural ecological environment [5]. In this sense, human activities and socio-economic development are the main driver of many ecological problems, such as climate change and ecological degradation. As a complex natural and socio-economic ecosystem, land is strongly influenced by natural factors and human activities, and the LES is related to the level of regional sustainable development.
Land ecological security (LES) represents the environment and sustainability of land resources and ecosystems which can provide steady ecological services and meet the ecological needs of future generations [6,7]. Since the late 1970s, this idea has received considerable attention from the government and academia [8]. Numerous studies have focused on empirical research on LES [9] and the internal relationship between LES and environmental change [10]. Few international studies have performed direct investigation on LES. The relevant research mainly focused on land sustainability evaluation [11,12], land quality evaluation [13], ecosystem service value evaluation [14,15,16], ecological risk evaluation [17,18] and land health [19,20]. The research scales were mostly at global, national and regional levels. Since the 1990s, many Chinese researchers have examined four aspects of the LES in China, i.e., the connotation of land ecological security, assessment, early warning and maintenance management [7,21,22]. From the perspective of evaluation, the existing evaluation framework mostly used pressure–state–response (PSR) [23,24,25], drivers–pressure–state–impact–response (DPSIR) [26], and environment/natural–society–economic (EES/NSE) [27,28]. Many evaluation methods have been proposed. Some of them were generic statistical approaches, e.g., the principal component analysis method [29,30] and neural network model [15,31]. The others were conceptual models, e.g., the comprehensive index method, ecological footprint method [32,33], gray correlation method [34], TOPSIS method [35,36,37,38,39], matter-element model [40] and the positive cloud model method [41].
The LES exhibits obvious characteristics of spatial heterogeneity and agglomeration, and land protection strategies should be implemented in accordance with the actual conditions in various places [42]. Previous studies mainly covered provinces [41,43], cities [25], counties [40,44], towns [45] and a few regional economic zones across provinces [29,34,42,46,47,48]. Coordinated development of the BTH region is one of the three major national strategies, and has exemplary significance for the sustainable development of China. The conflict between development and land is significant in this area, with obvious regional differences in land resource endowment and land ecosystem quality [49]. Many factors (e.g., economic expansion and population growth) have caused environmental degradation, which led to ecological imbalance with a major impact on LES [50]. Whilst the BTH region has experienced restoration and transformation in recent years, the speed was quite slow [47]. There were limited studies on land ecological security assessment in the BTH region, and little attention has been paid to spatial changes and obstacles in its land ecological security assessment. So, using the BTH region as the research object to perform regional land ecological security assessment is an important foundation for promoting regional sustainable development. With the advancement of coordinated development, this article will discuss the land ecological security status, temporal and spatial changes in the BTH region, and the main obstacles that affect land ecological security.
Based on the collaborative development perspective, this paper performs an LES evaluation on the BTH region. The PSR framework emphasizes the source of environmental pressure, which is the most critical issue in the model framework, because these human activities that cause environmental pressure should be responsible for environmental changes. The coordinated development of Beijing–Tianjin–Hebei requires population, industry, transportation, ecology, etc. Many breakthroughs have been made. Therefore, choosing the PSR framework model to construct a land ecological security evaluation model can better and comprehensively reflect the expressed problems. We establish an evaluation index system based on the PSR model. We apply the entropy method to determine the weight of the evaluation index. The TOPSIS method is adopted to evaluate the LES of the BTH region from 2007 to 2018. In addition, this paper also analyzes the temporal and spatial changes of areas within the BTH region. The obstacle degree model is used to identify the limiting indicator of the LES. This study will provide a theoretical reference of LES for China and even other counties which are experiencing rapid urbanization. It will also offer a scientific basis for making regional land ecological security protection decisions and sustainable development strategies.

2. Materials and Methods
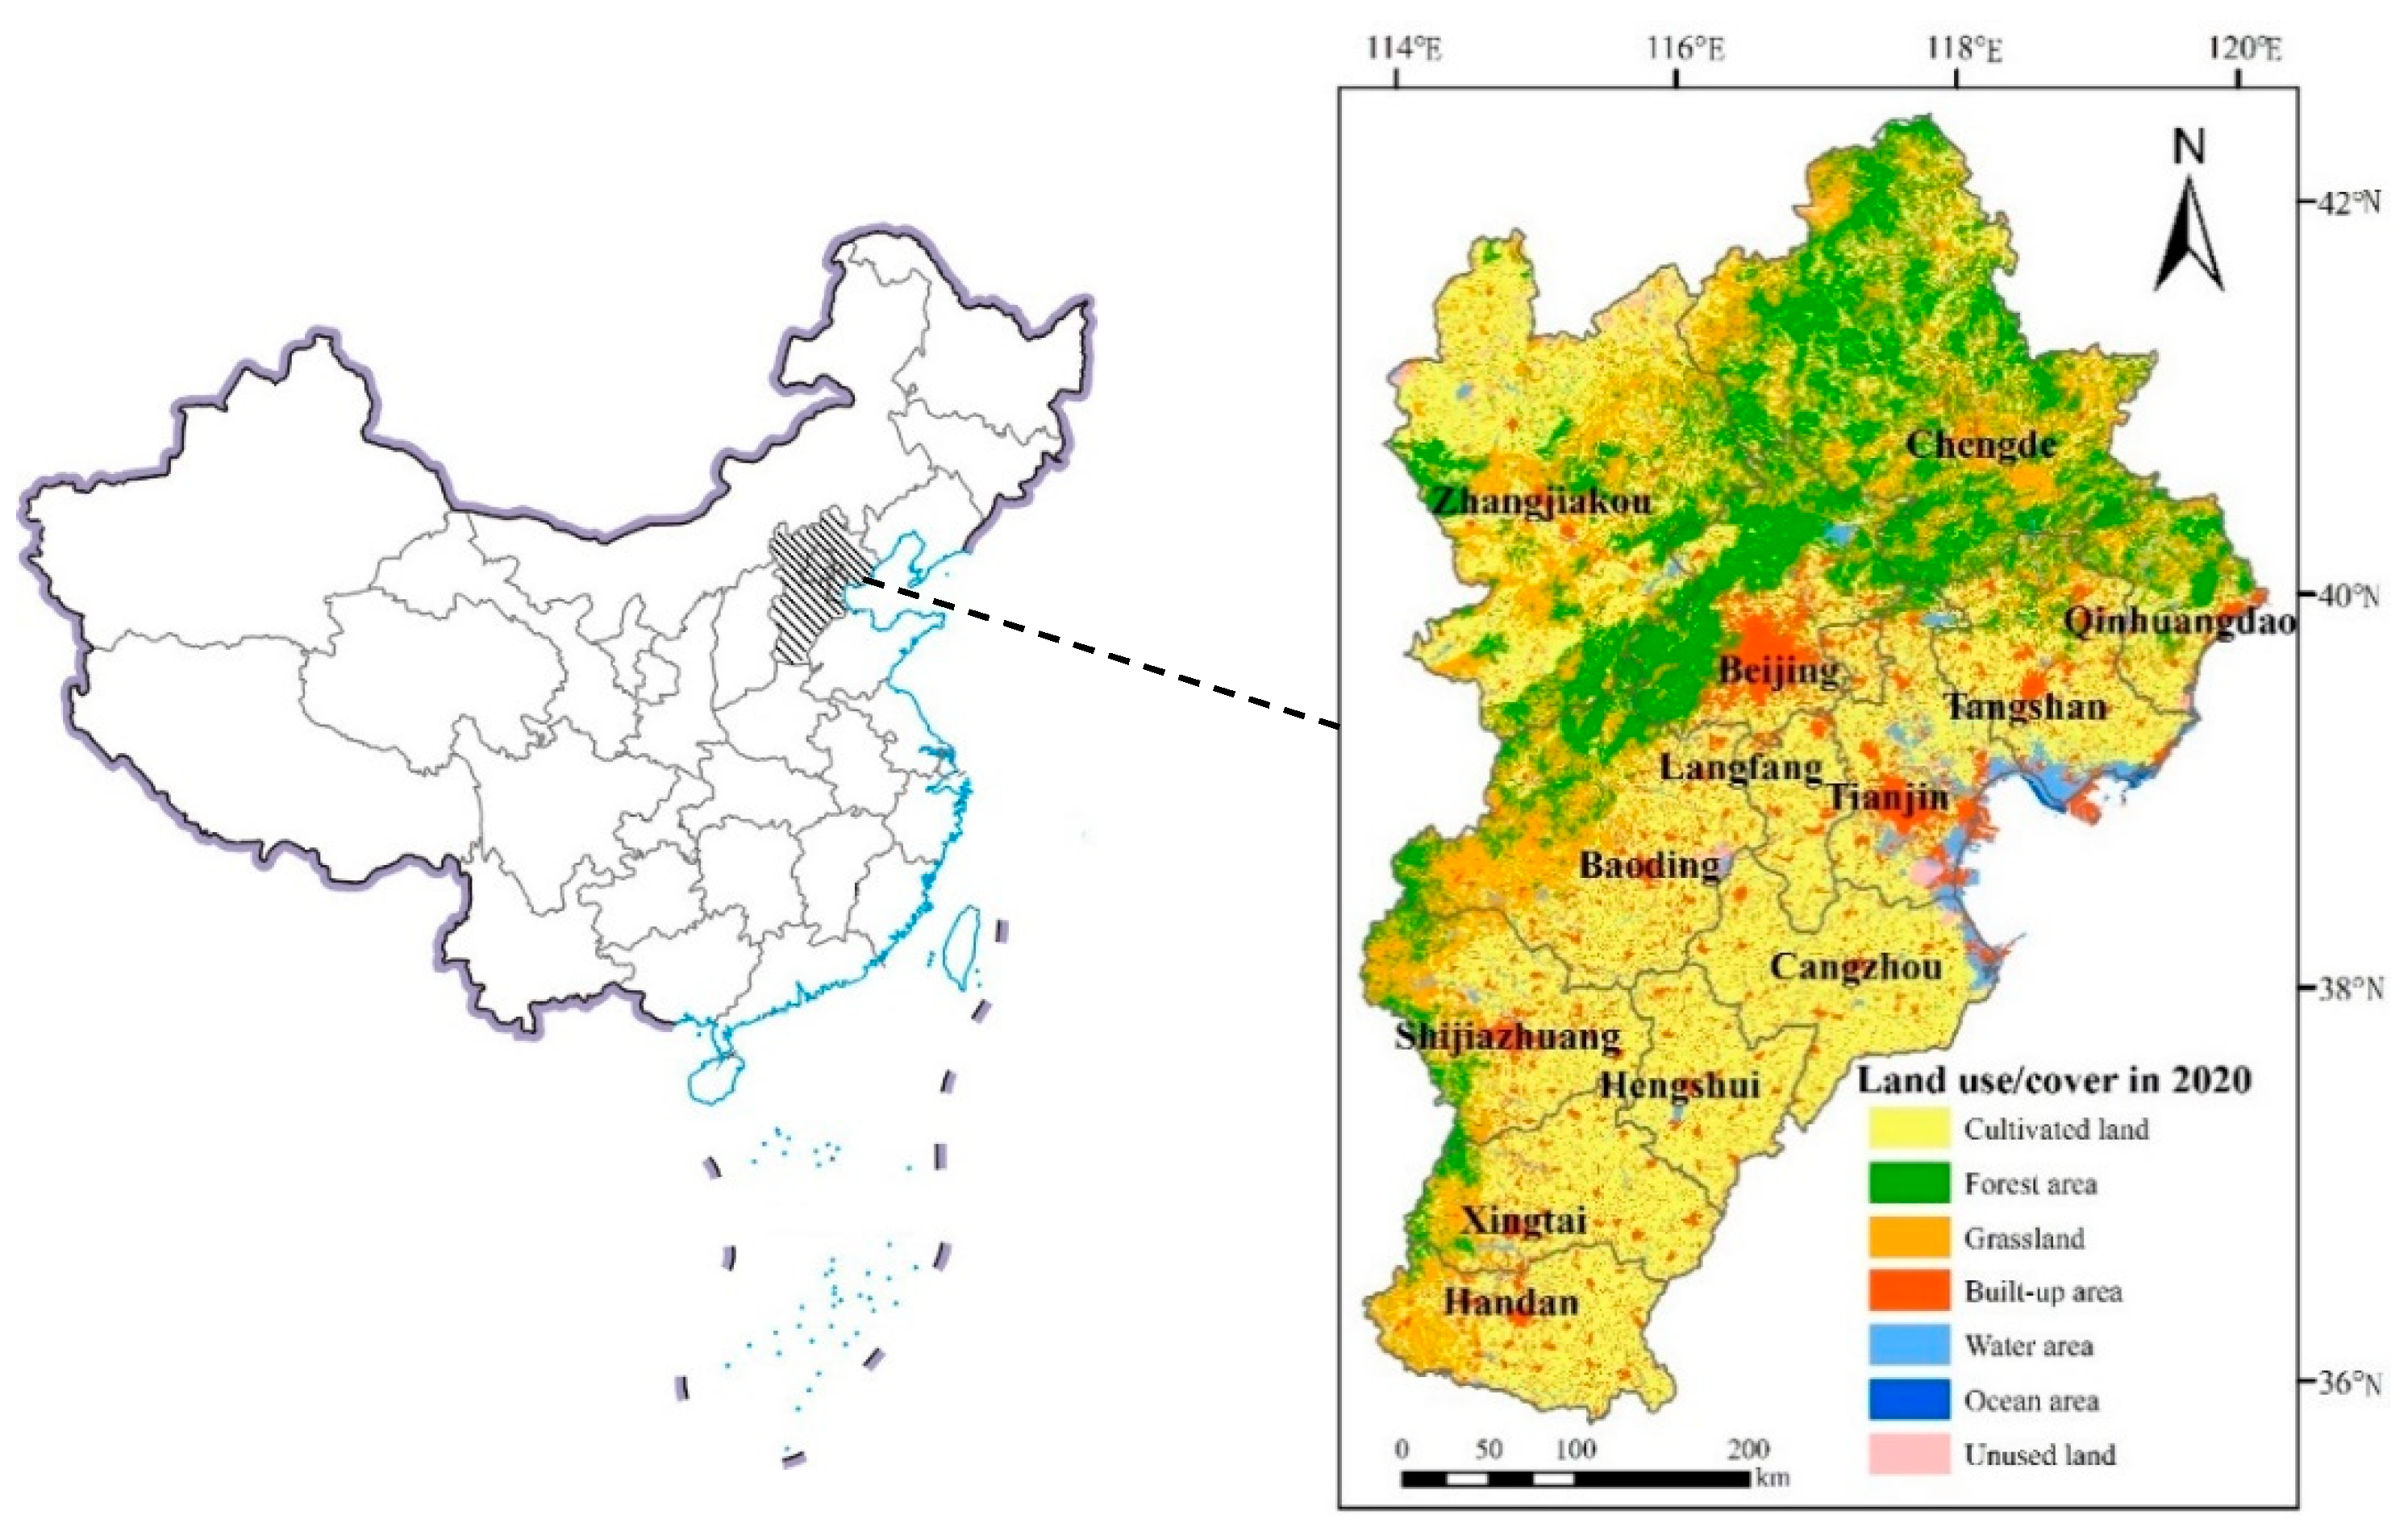
2.1. Study Area

The BTH region (113°04′ E-119°53′ E, 36°01′ N-42°37′ N) covers a sum of 13 cities, which are Beijing, Tianjin and other cities in Hebei Province (i.e., Shijiazhuang, Baoding, Cangzhou, Chengde, Handan, Hengshui, Langfang, Qinhuangdao, Tangshan, Xingtai and Zhangjiakou). Its land area is 216,000 km2, accounting for 2.3% of China’s total land area (Figure 1). In terms of topography, mountains and plains account for 48.2% and 43.8% of the total area of the BTH region, respectively. The spatial differentiation of land cover/land use types is obvious. Coastal tidal flats, coastal wetlands, farmland, cities, shrubs, forests, and grasslands alternate from southeast to northwest. The overall pattern is the transition from plantation in the southeast to forest and animal husbandry in the northwest. This area has a typical temperate continental monsoon climate, with a semi-arid area in the north and a semi-humid area in the south. The BTH region is an important economic, cultural and political region in China. As of the end of 2018, its total population was 11.27 million or about 8.1% of China’s total population; its regional GDP was 853.139 billion yuan or approximately 9.3% of the national economy; its amount of water resources was 21.72 billion cubic meters, accounting for 0.79% of the national total. With the ongoing socioeconomic development and urbanization, the intensity of land development and utilization in the BTH region continues to expand; its jurisdiction accounted for 2.3% of the country’s total area. With the development of social economy and the advancement of urbanization, the intensity of land development and construction in the BTH area has been expanding. Moreover, its population is highly concentrated and mobile. Therefore, the carrying capacity of resources and environment is weakened, the land ecological issue is getting worse, and the contradiction between human and land is serious [51,52].

2.2. Data Source

Five indexes (i.e., secondary industry ratio; green coverage of urban built-up areas; per capita GDP; tertiary industry ratio; comprehensive utilization rate of industrial solid waste) were extracted from “China Urban Statistical Yearbook” (2008–2019). Six indexes (i.e., population density; highway passenger traffic per unit land area; road freight per unit land area; industrial dust emissions per unit land area; industrial wastewater discharge per unit land area; population growth rate) were calculated using the original data from “China Statistical Yearbook” (2008–2019) and “Hebei Economic Yearbook” (2008–2019). Four indexes (i.e., the usage of fertilizer per unit cultivated area; food production per unit land area; land economic density; transportation, warehousing and postal investment per unit land area) were quantified using the original data from “China Statistical Yearbook” (2008–2019) and “Hebei Economic Yearbook” (2008–2019). Cultivated land ratio was estimated using the original data from “China Statistical Yearbook” (2008–2019) and “Hebei Rural Statistical Yearbook” (2008–2019). Raster land use/cover map in 2020 at 1000 m × 1000 m spatial resolution in the BTH region was downloaded from the Resource and Environmental Science Data Center of the Chinese Academy of Sciences (http://www.resdc.cn (accessed on 13 June 2021)).

2.3. Methodology

2.3.1. Construction of Evaluation Index System

Based on the relationship between humans and the environment, the PSR (pressure–state–response) model can effectively determine the causal relationship between the environmental state and environmental problems. Combining relevant research results, following a systematic, complete and targeted selection, this study applied the PSR model to establish the evaluation index system of LES, as shown in Table 1. The land ecological security index system includes four layers, namely, target layer A, criterion layer B, factor layer C and index layer D. The target layer A is the land ecological security value, which indicates the degree of security of the entire land ecosystem. Criterion layer B, that is, pressure, state, and response, reflects the criteria composition of the target layer. The factor layer C further subdivides the criterion layer B.
Pressure (P) reflects the fact that rapid population growth and socioeconomic development have caused pollution and affected the land ecosystem. In the context of coordinated development, population management, industrial transformation, transportation construction, and ecological protection are important tasks that need to achieve breakthroughs. Therefore, a pressure criterion layer is built around four factor layers “population-industry-traffic-environment”. The population factor is expressed by population density (D1) [35,36,37,38,39,47]. The greater the population density, the greater the intensity of land use by humans, which is a potential hazard to LES. The industry factor is expressed by a secondary industry ratio (D2). The higher the secondary industry ratio, the stronger the demand for land and the higher the threat to land ecological security. The traffic factor is expressed by highway passenger traffic per unit land area (D3) and road freight per unit land area (D4). The economic and social development of the BTH region, along with the increase in passenger and freight traffic, has increased the pressure on LES. The environment factor is expressed by the usage of fertilizer per unit cultivated area (D5) [35,36,38,39,47], industrial dust emissions per unit land area (D6) [39] and industrial wastewater discharge per unit land area (D7) [36,37,38,39]. Excessive fertilization, industrial waste dust and wastewater discharge will cause environmental pollution and threaten the LES.
State (S) reflects the actual state of the land ecosystem under the above-mentioned pressure, including two factor layers of land structure and function. Land structure factor is expressed by cultivated land ratio (D8) [36,37,47] and green coverage of urban built-up areas (D9) [36]. The higher the cultivated land ratio, the less the proportion of cultivated land occupied by construction land, and the more stable the land structure. Green coverage of urban built-up areas (D9) represents the degree of regional greening. The higher the index, the better the LES. The land function factor is expressed by food production per unit land area (D10) [35,36,37,38] and land economic density (D11) [35,36,37,38]. They, respectively, measure the grain output capacity and economic output capacity. Under the same conditions, the stronger the land output capacity, the better the land function and the higher the level of LES.
The response (R) reflects the feedback measures taken by human beings when the land ecosystem is facing problems, and the criterion layer is also constructed from the four factor layers of population–industry–traffic–environment. The population factor is expressed by population growth rate (D12) [35,36,38]. With the implementation of depopulation policy, the rate of population growth has slowed down, and the demand for land has decreased. Thus, the land ecology has turned more secure. The industry factor is expressed by per capita GDP (D13) [36,37,38,39,47] and tertiary industry ratio (D14) [35,36,37,38,39,47]. The higher the GDP per capita, the stronger the ability of land to support the sustainable development of human society and the better the land ecology. The higher the proportion of the tertiary industry dominated by the service industry in GDP, the lower the proportion of agriculture and industry, and the smaller the demand for land. This indicator is a positive indicator. The traffic factor is expressed by transportation, warehousing and postal investment per unit land area (D15). The increase in fixed investment in transportation and other industries will improve regional transportation capacity, depopulate the population and optimize the industrial structure, reduce the concentrated demand for land, and ultimately improve the level of LES. The environment factor is expressed by comprehensive utilization rate of industrial solid waste (D16). The increase in the comprehensive utilization rate of industrial solid waste can reduce environmental pollution caused by industrial solid waste discharge, thereby improving the level of ecological safety of the land.

2.3.2. Entropy-Weighted TOPSIS Model

(1)
Entropy-Weighted Method
The key issue in evaluating LES using the 16 indexes is how to determine the weight of each indicator. The commonly used methods are the expert scoring method, fuzzy comprehensive evaluation method, analytic hierarchy process and principal component analysis method. The entropy weight method is an objective weighting method, which distributes weights through the size of the index information entropy value, thereby overcoming the weight uncertainty caused by subjective reasons such as expert experience and perspective.
F i j is the index value proportion of the i th evaluation object under the j index in the matrix Y:
F i j = Y i j / i = 1 m Y i j
E j is the information entropy of the jth index:
E j = ln ( m ) 1 i = 1 m F i j ln ( F i j ) , 0 E j 1
We calculate the entropy weight Wj of the j th index using:
W j = ( 1 E j ) / j = 1 n ( 1 E j )
(2)
Technique for Order Preference by Similarity to Ideal Solution (TOPSIS)
The TOPSIS (Technique for Order Preference by Similarity to Ideal Solution) is a multi-objective decision-making method, which is widely used in engineering project site selection, road safety performance evaluation, industry performance evaluation, etc. It can systematically analyze land ecological security and the reference state difference. The TOPSIS evaluation method is a discrete, multi-dimensional decision model. By setting “positive ideal state” and “negative ideal state”, the distance between the data of each evaluation unit and the “positive ideal solution” and “negative ideal solution” is measured to obtain the relative closeness of the unit and the “positive ideal solution”, so as to sort and evaluate each evaluation unit. This study applies the TOPSIS method to the LES evaluation. It is a commonly used decision technique for the multi-objective decision analysis of finite schemes in system engineering, which is able to systematically analyze the gap between LES and ideal state. The TOPSIS method is a method of multi-attribute decision making which evaluates the level of land ecological security by the distance between each year and the positive and negative ideal solutions [53].
We create a weighted normalization matrix using:
V i j = ( Y i j × W j ) , m × n
We determine the positive and negative ideal solutions using:
V j + = { m a x V i j } , j = 1 , 2 , , m
V j = { m i n V i j } , j = 1 , 2 , , m
The Euclidian distance is calculated as:
D i + = j = 1 n ( V i j     V j + ) 2 ;   D i = j = 1 n ( V i j     V j ) 2  
We determine the LES index using:
U i = D i D i + + D i

2.3.3. Evaluation Standard

The land ecological safety index ranges between 0 and 1, the larger the value, the higher the level of land ecological security. We use the Natural Breaks of ArcGIS to classify the index. The results of this revised approach can better represent the internal differences of the LES. The LES level definitions for this study are shown in Table 2.

2.3.4. Obstacle Degree Model

The LES evaluation is a quantitative assessment of the regional land ecosystem. To explore the indexes affecting LES, it is necessary to identify the obstacles in the study area [54]. The obstacle degree refers to the degree of restriction of the index on LES. The greater the obstacle degree, the stronger the restriction effect of the index. According to the obstacle degree, the main obstacles affecting the improvement of LES can be determined, so as to provide a basis for improving the level of LES:
S i j = 1     Y i j
M i j = S i j W j j = 1 16 S i j W j × 100 %
S i j is the difference between the actual value and the ideal state of a single index; M i j is the obstacle degree of the j-th index in the i-th year.

3. Results

3.1. Evaluation and Analysis of Land Eco-Security Based on Entropy-Weighted TOPSIS

Based on the entropy-weighted TOPSIS model, we calculate the LES index of the BTH region for 2007–2018 (Figure 2, Table 3). The LES index gradually trended upward (from 0.1934 to 0.3284) over the past 12 years. The security level increased from the dangerous level (I) to the critical level (III). The land ecological pressure (P) increased a little (from 0.5777 to 0.5950), indicating that the dependence of human activities on the land has dropped slightly, and the pressure on LES has reduced. The land ecological state (S) increased slowly (from 0.1542 to 0.2446), indicating that with continued socioeconomic development, the land structure and function also continued to develop. As an important part of LES, the land ecological response (R) system shows a conscious adjustment of human beings to land ecology. During the study period, the BTH land ecological response index continued to increase (from 0.1584 to 0.3575), indicating the policy adjustments of the government in response to the limits of land resource and environmental carrying capacity. Figure 2 indicates that LES was highly correlated with state (S) and response (R). This shows that the slow improvement of the LES level in the BTH region was mainly due to the adjustment of the land ecological status and the improvement of the land ecological response. After 2013, LES was highly correlated with pressure (P), state (S) and response (R). This was mainly because after the 18th National Congress of the Communist Party of China, the coordinated development of the BTH region had become a national strategy, and more attention was paid to regional sustainability development. Among them, the largest increase in the land ecological response index reflects that the Chinese government has encouraged industrial transformation; increased transportation construction; and promoted ecological protection by guiding population deconsolidation. These improved the land ecological response index, and thereby enhanced the LES level.

3.2. Spatiotemporal Variations of LES

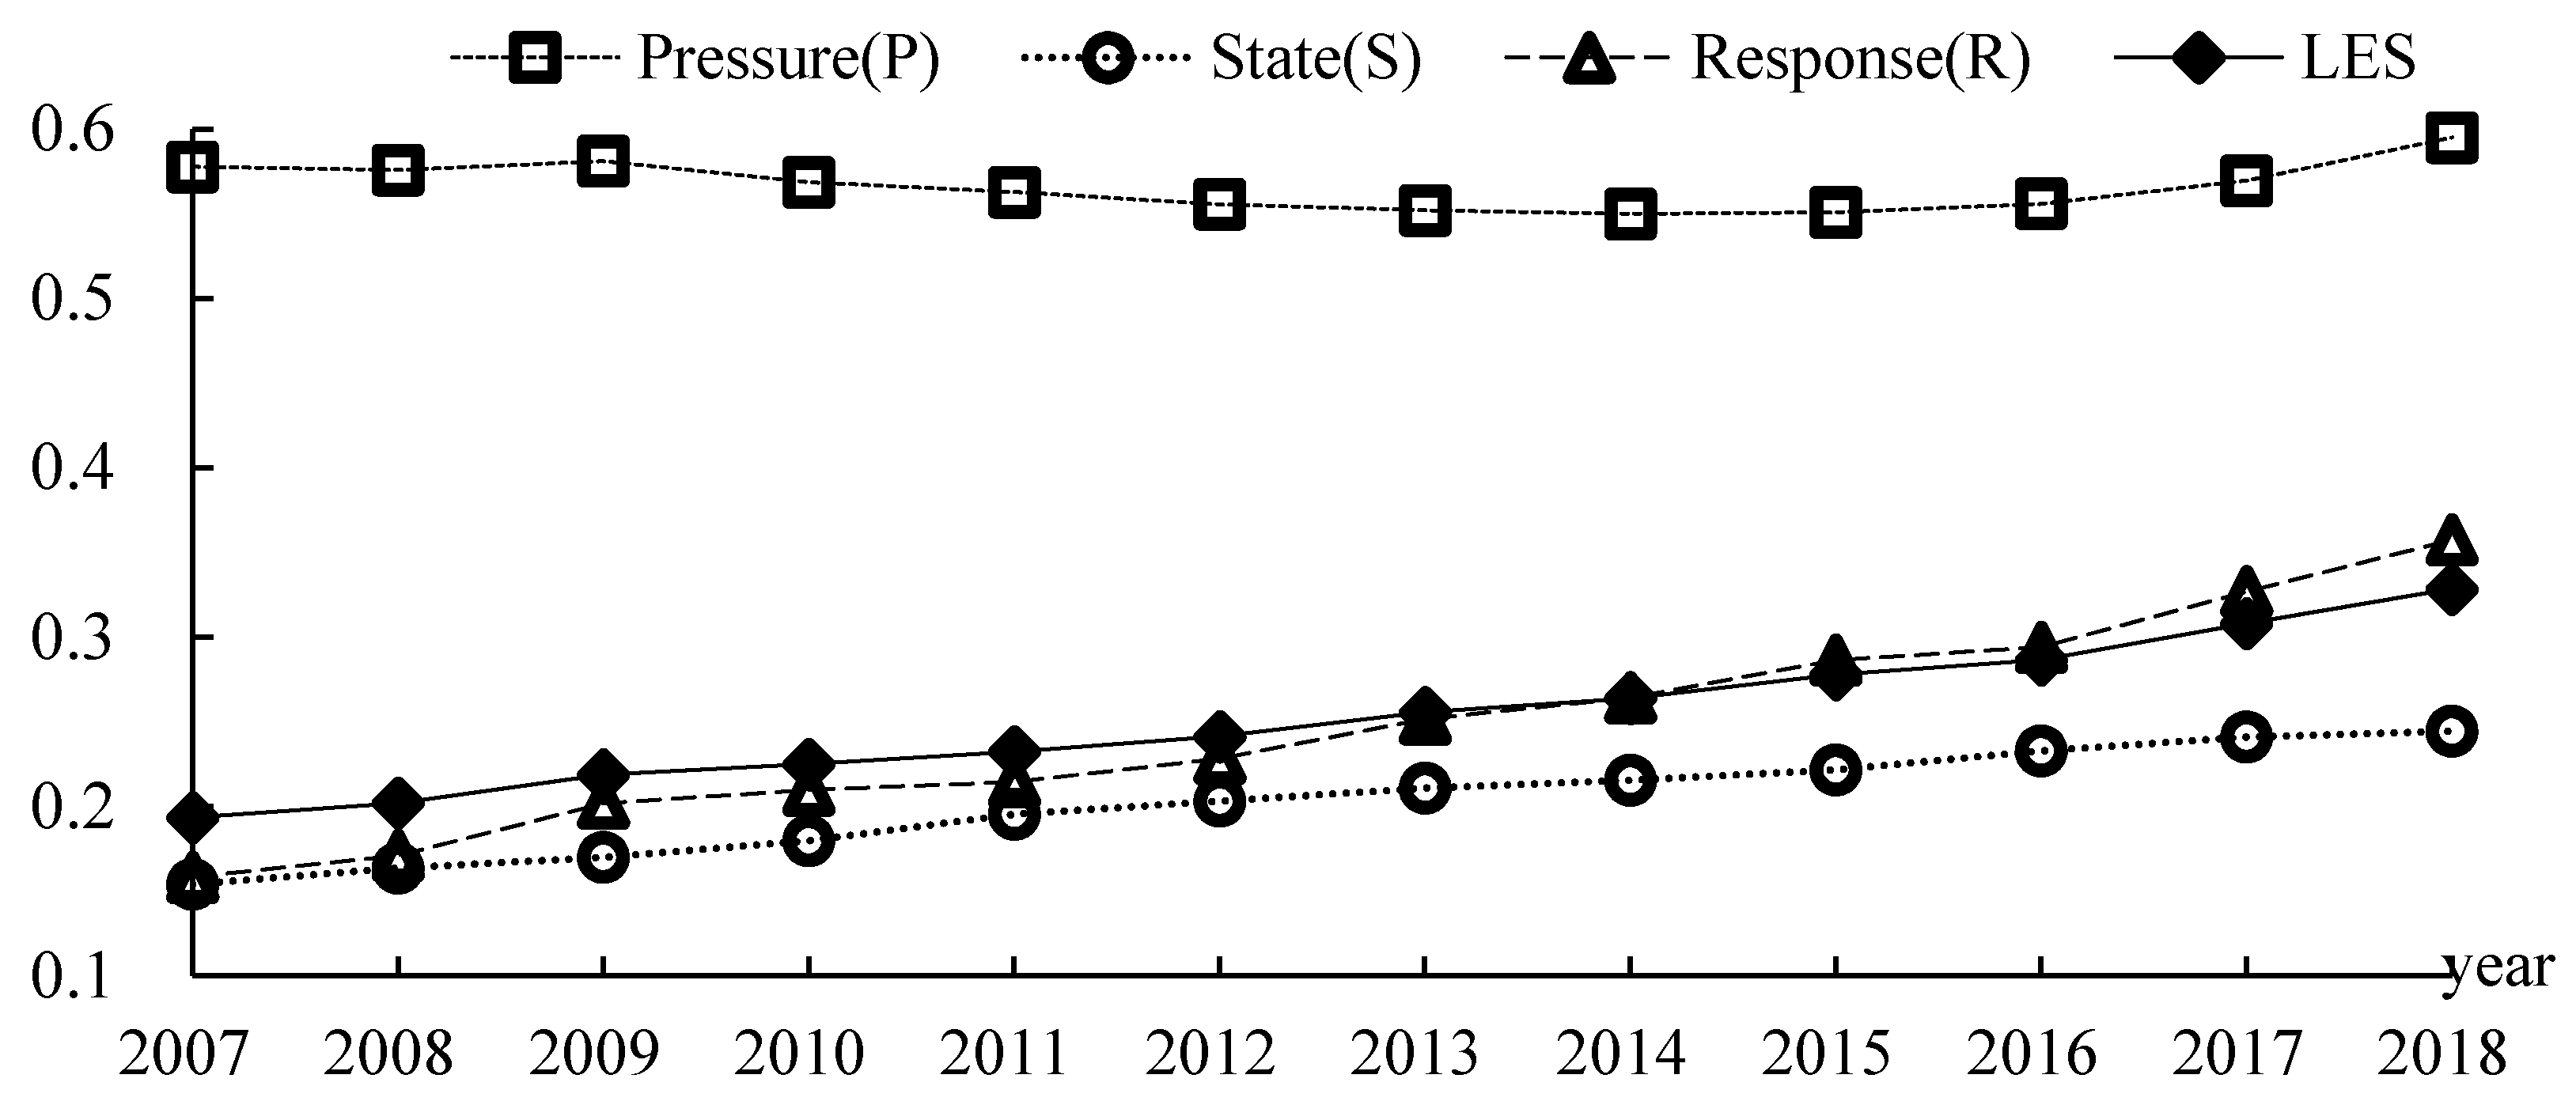
3.2.1. Time Change Analysis

From 2007 to 2018, the LES status of various regions was generally good, but the trends were different (Figure 3, Table 4). The LES indices of ten cities (Beijing, Shijiazhuang, Chengde, Zhangjiakou, Qinhuangdao, Langfang, Baoding, Hengshui, Xingtai and Handan) continued to increase. The LES indices of three cities (Tianjin, Tangshan and Cangzhou) increased first and then fell, showing an overall trend of rising fluctuations. Over the past 12 years, the absolute and relative differences in the LES level within the BTH region have trended upward, which peaked in 2018. In 2007, the LES index ranged from 0.1726 to 0.3744, where Beijing and Qinhuangdao recorded the highest and lowest levels, respectively. In 2010, the range of the LES index was 0.1779–0.4770, where Tianjin and Qinhuangdao had the highest and lowest levels, respectively. In 2015, the LES index ranged from 0.1897 to 0.6915 with the highest value in Tianjin and the lowest value in Qinhuangdao. In 2018, the LES index was around 0.2032–0.8040, where the highest and lowest levels were recorded in Beijing and Chengde, respectively.
Specifically, the growth rate of the LES index was different in different time periods. In terms of average growth rate, the highest growth rate was 21.03% in 2010–2015; the lower growth rate was 16.95% in 2007–2010; and the lowest growth rate was 9.93% in 2015–2018. From 2007 to 2010, the LES indices of all 13 regions turned upward, with Tianjin increasing the fastest at 59.27%. From 2010 to 2015, the LES indices of all 13 regions turned upward, with Tianjin increasing the fastest at 44.97%. From 2015 to 2017, the LES index improved in most of the cities (except Tianjin, Tangshan and Cangzhou), with Langfang increasing the fastest at 30.10%.

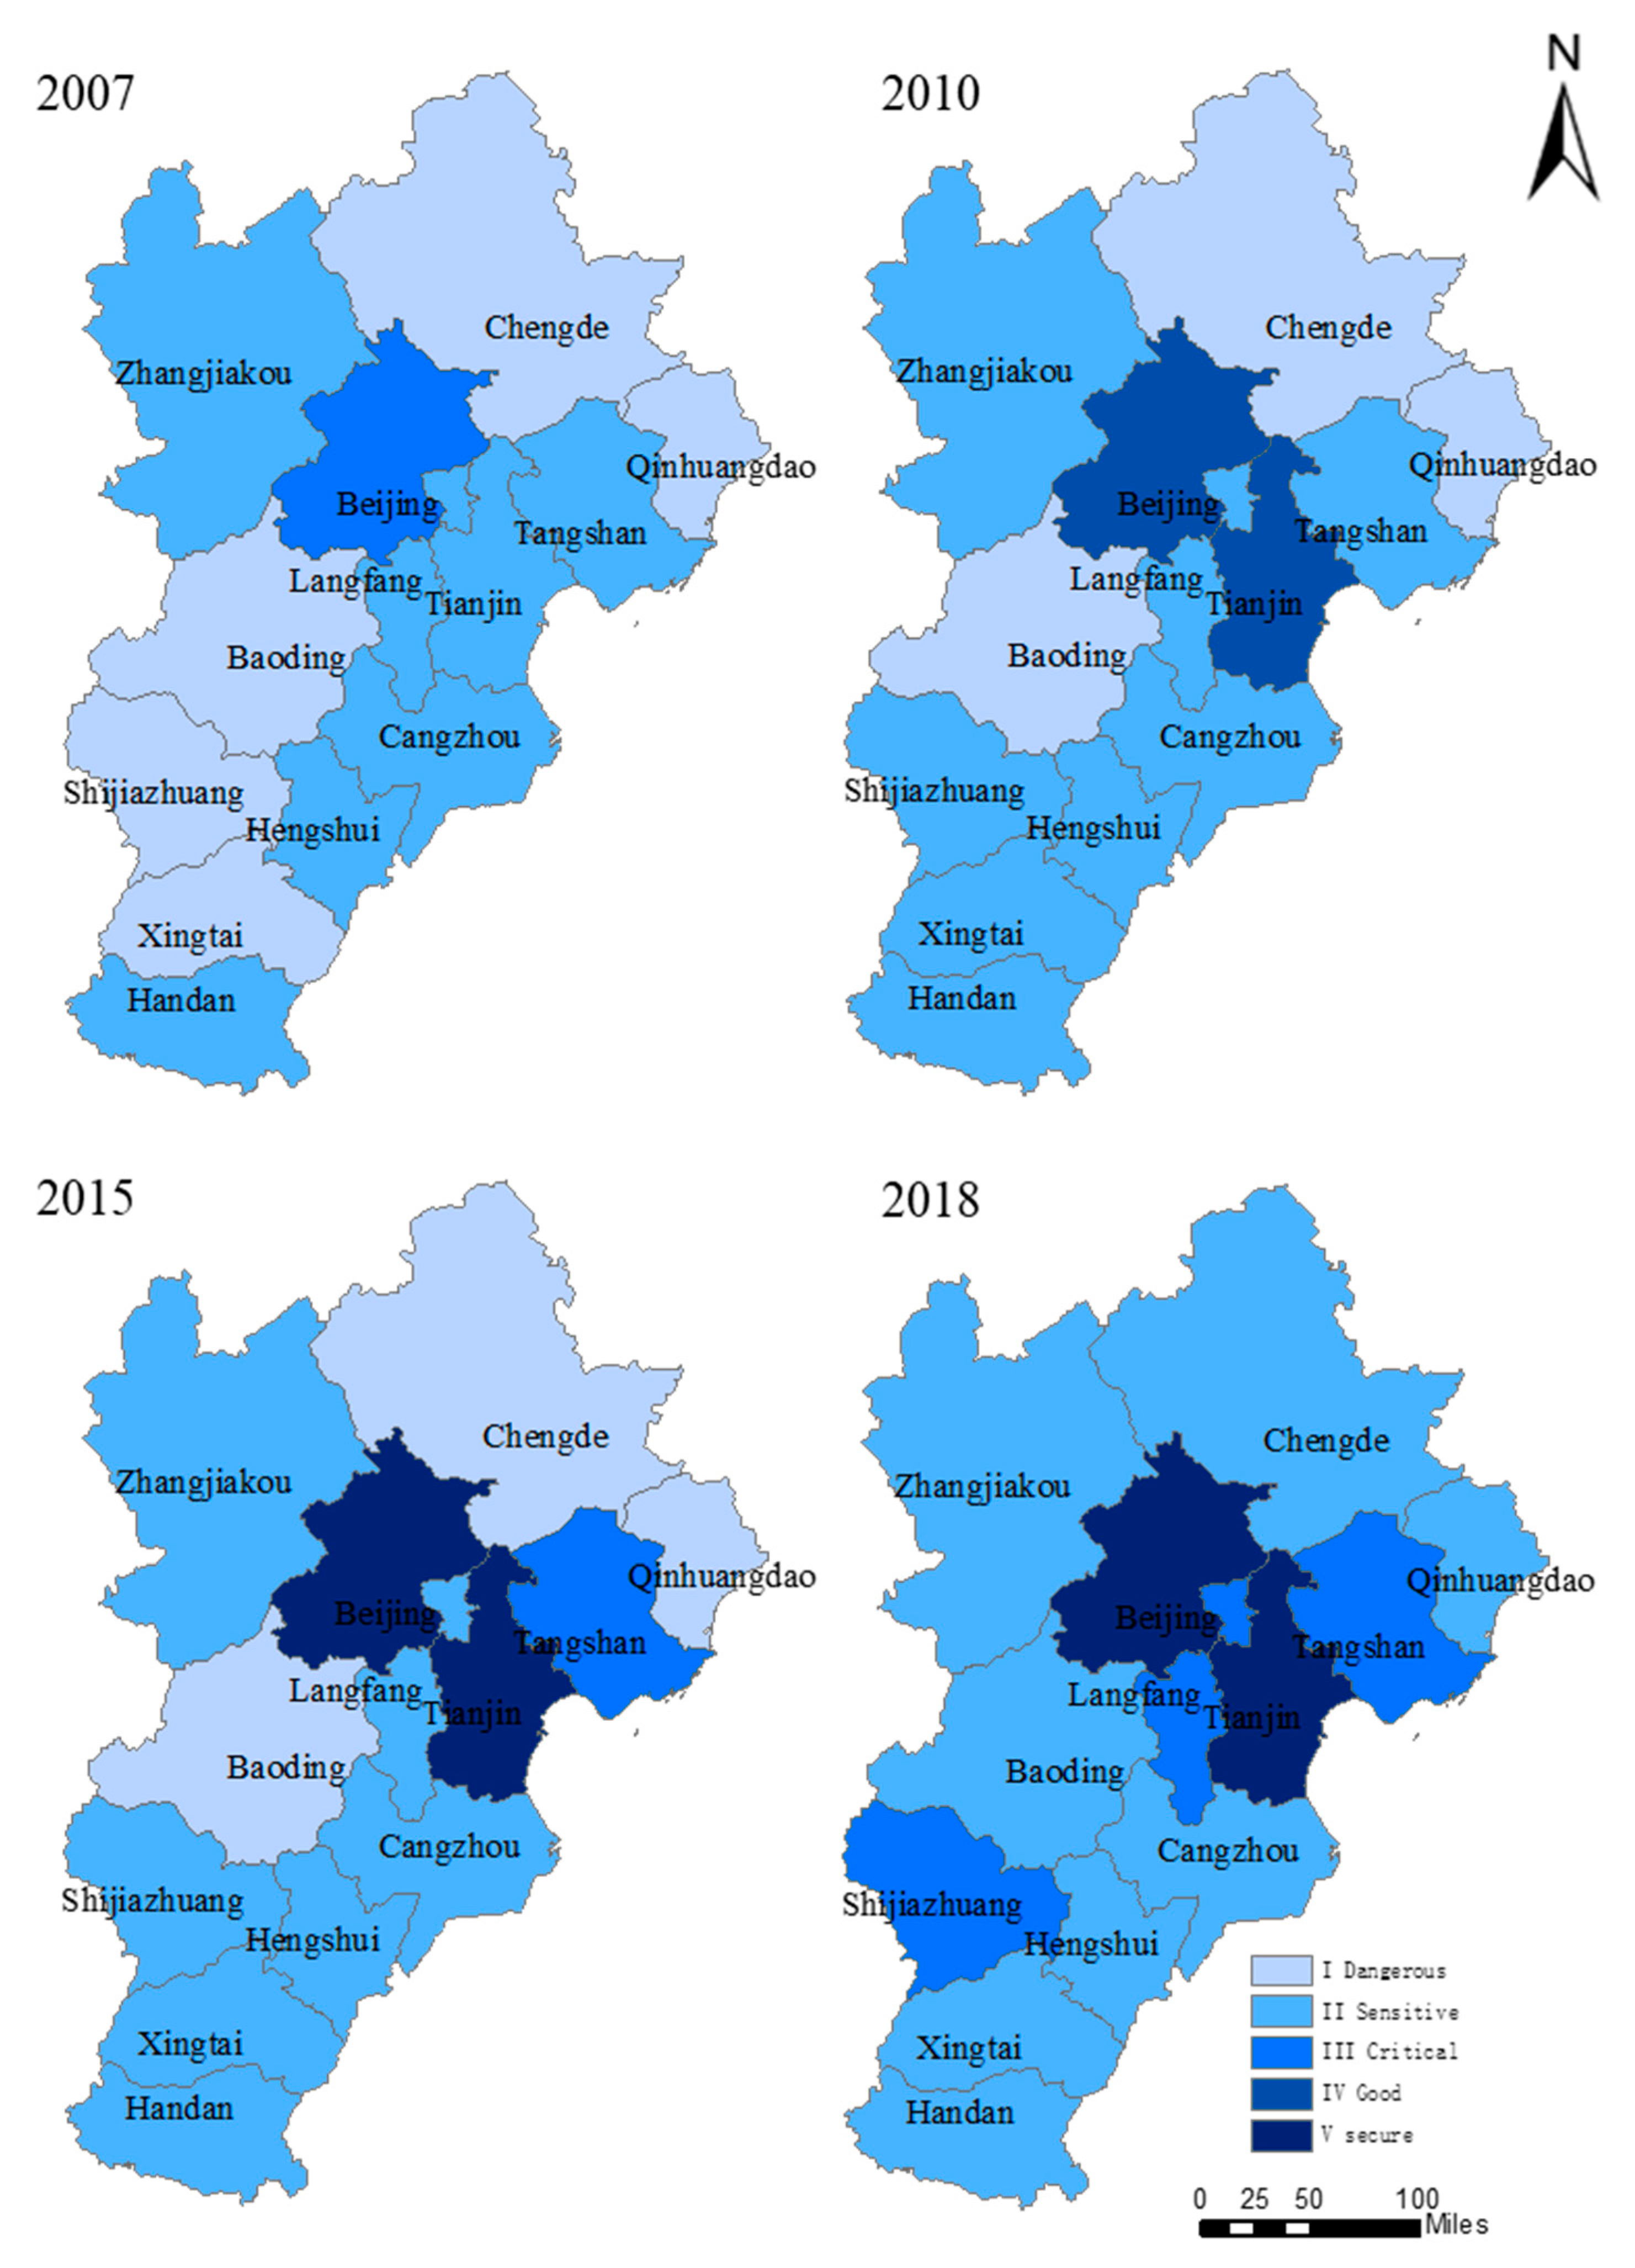
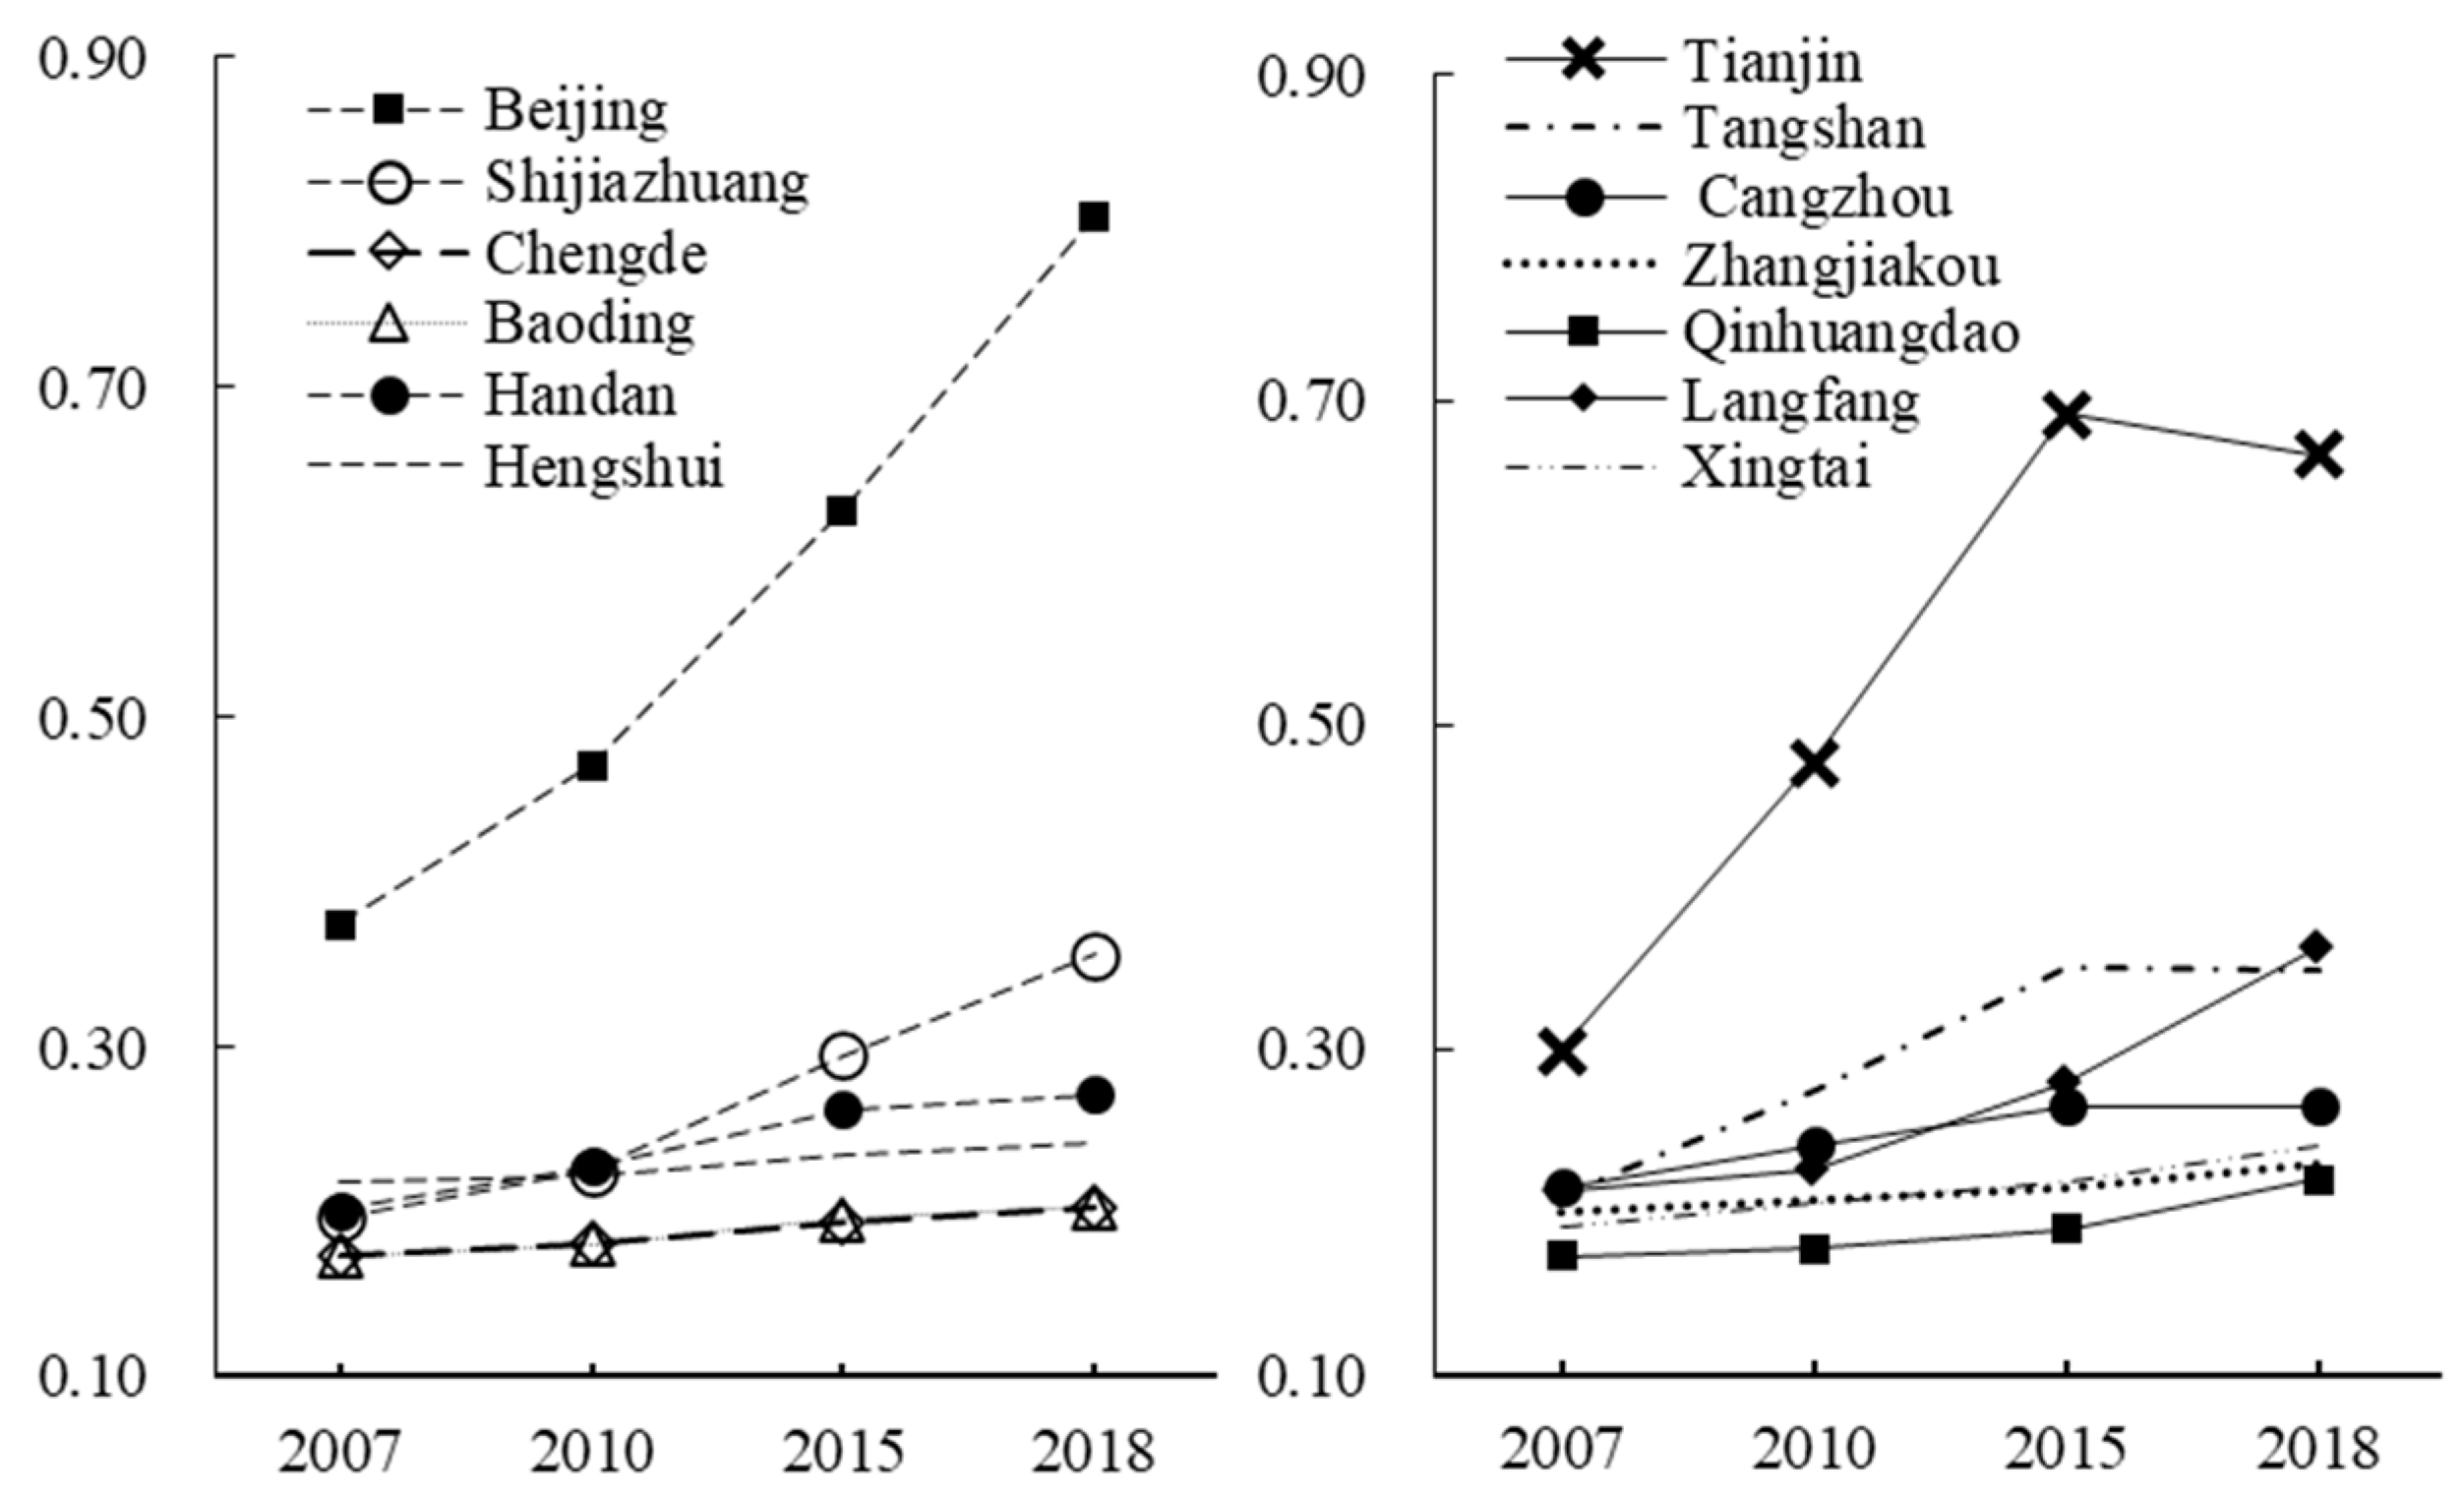
3.2.2. Spatial Change Analysis

From 2007 to 2018, the LES level in the central area was higher than those in the northern and southern areas. The LES levels of various cities were at the critical level (III), accounting for 54.30% (2007), 57.80% (2010), 52.02% (2015), and 64.63% (2018) of the study region, respectively (Figure 4). Over the past 12 years, except for Zhangjiakou, Cangzhou, Hengshui and Handan, which have been at the sensitive level (II), the LES levels of other areas have improved. In 2007, The LES level of Beijing was at the critical level (III); the LES levels of seven cities (including Tianjin, Zhangjiakou, Tangshan, Cangzhou, Langfang, Handan and Hengshui) were at the sensitive level (II); the LES levels of five cities (including Qinhuangdao, Xingtai, Shijiazhuang, Chengde and Baoding) were at the dangerous level (I). The overall situation was “Central Region > Southeast Region > Other Regions”. In 2018, the LES levels increased. The LES levels of Beijing and Tianjin were at the secure level (V); the LES levels of Tangshan, Langfang and Shijiazhuang were at the critical level (III); and the LES levels of other cities were at the sensitive level (II). In general, the trend is “Eastern and Central Areas > Other Areas”. Overall, some risks remained despite the enhanced LES situation in the BTH region. In the next step, we should concentrate on strengthening the ecological safety of land in Qinhuangdao, Chengde, Zhangjiakou, Baoding, Cangzhou, Hengshui, Xingtai and Handan.

3.3. Obstacle Indicators of LES

In this study, we calculate the obstacle degree of each evaluation index of LES in the BTH region. The top seven obstacle indicators in the order of obstacle degree were selected as the main obstacle indicators for analysis, and the cumulative obstacle degree exceeded (i.e., one in the pressure layer, three in the state layer, and three in the response layer). According to the order and frequency, for the main obstacle indicators, i.e., land economic density (D11), transportation, warehousing and postal investment per unit land area (D15), per capita GDP (D13), tertiary industry ratio (D14), cultivated land ratio (D8), the usage of fertilizer per unit cultivated area (D5) and green coverage of urban built-up areas (D9), the maximum obstacles were 30.71%, 29.75%, 14.58%, 7.26%, 6.76%, 5.36% and 4.05%, respectively (Table 5).
The main obstacle indicators in different areas were not the same (Table 6). In 2007, land economic density (D11), transportation, warehousing and postal investment per unit land area (D15) and per capita GDP (D13) were obstacle indicators for 13 areas. Tertiary industry ratio (D14) was the obstacle indicator for 12 areas (except Beijing). The usage of fertilizer per unit cultivated area (D5) was the obstacle indicator for 11 regions (except Chengde and Zhangjiakou). The cultivated land ratio (D8) was the obstacle indicator for eight regions (except Langfang, Cangzhou, Hengshui, Xingtai and Handan), and green coverage of the urban built-up areas (D9) was also the obstacle index for eight regions (except Tianjin, Qinhuangdao, Langfang, Cangzhou and Hengshui). In 2018, land economic density (D11), transportation, warehousing and postal investment per unit land area (D15) and tertiary industry ratio (D14) were obstacle indicators for 12 regions (except Beijing). Per capita GDP (D13) was an obstacle indicator for 11 areas, and is no longer an obstacle indicator for Beijing and Tianjin. The main affected areas of the usage of fertilizer per unit cultivated area (D5) and cultivated land ratio (D8) were the same as in 2007. Green coverage of the urban built-up areas (D9) was the obstacle indicator for 10 areas (except Chengde, Langfang and Cangzhou). In addition, although population density (D1), food production per unit land area (D10), comprehensive utilization rate of industrial solid waste (D16) and population growth rate (D12) were not the obstacle indicators of the BTH region, they were obstacle indicators for some cities. This can provide a reference for improving the level of LES in various cities.

4. Discussion

Ecological security is fundamental to the development of human society in the region. Hence, the LES of the BTH region should be taken seriously. Two aspects of the LES are important: (1) structure and function of land resources, and (2) natural resources required for coordinated development. Although previous studies have investigated the land ecological status [40], population and land ecological pressure [49,55,56] and LES of the BTH region [44]. There were limited studies on LES from the perspective of coordinated development. Based on the concept of collaborative development, this paper established an evaluation index system, evaluated the state of land ecological security, and performed spatiotemporal analysis and judgment of obstacle degree indicators. Compared to existing studies, this study paid more attention to the impact of the coordinated development strategy on regional LES, and put forward some suggestions for future development in different areas. So far, we have not seen any consistent method for LES assessment. The PSR (pressure–state–response) model is based on the relationship between human society and the environment, and effectively determines the causal relationship between the environmental state and environmental problems. This article attempted to build an evaluation index system under the PSR model from the perspective of collaborative development strategy. Briefly, the pressure (P) and response (R) systems build indicators around “population-industry-transportation-ecology”; and the state (S) builds indicators around “land structure-land function”. The indicator system takes into account the impact of population unraveling, industrial transformation, transportation integration, and ecological protection on LES. In this study, we used the entropy-weighted TOPSIS model to evaluate the LES situation in the BTH region. The TOPSIS model is a multi-objective decision-making method that can better compare the gap between the LES results and the ideal level. In addition, using the entropy-weighted method to determine the weight can reduce the influence of human bias.
Our results indicate that the LES index has gradually trended upward (from 0.1934 to 0.3284) over the past 12 years. The evaluation results here basically agreed with previous studies. The LES of the land in the BTH region continued to deteriorate from 2000 to 2006 and started to improve from 2007 to 2012. However, the recovery was very slow [33]. Moreover, this article examined the spatiotemporal changes and determined the obstacle indicators in different areas. This study introduced the obstacle degree model and determined the primary and secondary relationships of the impact indicators by considering the order of the obstacle degree. This can clarify the main obstacle indicators and generate the next policy recommendations. Three strategies can be adopted to improve the LES level of the BTH region. The first strategy is to focus on reducing the ecological pressure on the land; continue to improve the ecological status of the land; actively improve the ecological response of the land; and enhance the overall LES level. The second strategy is to consider the coordinated development background, pay attention to sensitive areas (e.g., Qinhuangdao, Chengde, Zhangjiakou, Baoding, Cangzhou, Hengshui, Xingtai and Handan) according to the functional positioning of each city, support infrastructure and industrial conditions, increase ecological protection, and increase the local LES level. The third strategy is to account for the seven obstacle indicators and adopt corresponding policy measures to address the shortcomings of LES. For example, the constraints of the usage of fertilizer per unit cultivated area can be addressed by cutting the amount of applied fertilizer used; the constraints of cultivated land ratio and tertiary industry ratio can be tackled by increasing the area of cultivated land and green space in built-up areas, and optimizing land structure; the increase in the food production per unit land area can promote the improvement of land functions; the constraints of per capita GDP and tertiary industry ratio can be addressed by supporting infrastructure and improving industrial conditions; the constraints of transportation, warehousing and postal investment per unit land area can be handled by planning the construction of infrastructure (e.g., high-speed rail and subway) and the integration of transportation.
Land ecological security evaluation is an important part of regional ecological security research. The current study utilized prefecture-level cities as evaluation units. Whilst a comparative analysis of the spatial distribution characteristics was performed, the socioeconomic development and land resource endowments of Beijing, Tianjin and Hebei are different. In a future study, we would further analyze the spatial differences between its counties. Furthermore, this was the first attempt to develop an LES indicator system under the background of coordinated development. Given the difficulty of unifying data calibers across provinces and cities, some indicators (e.g., forest land coverage and land tribalization) were excluded in the current study. In a future study, we would combine remote sensing, questionnaires and other methods to improve the indicator system, as well as cover more in-depth research on LES issues.
Sustainable development is currently a hot topic of global concern. In 2015, the United Nations formally adopted “Change Our World: 2030 Agenda for Sustainable Development” and announced 17 global sustainable development goals based on the Millennium Development Goals [57]. While recognizing the importance of land ecological security in sustainable development, land degradation causing impaired ecosystem functions are costing us USD 6.3 trillion per year of ecosystem service value [58]. The tropical rainforest in Indonesia has resulted in the loss of biodiversity and ecological functions due to the change of land use types [59]. Costa Rica’s research has indicated the importance of land cover/use change in the loss of land ecological service functions [60]. Unreasonable land use can cause land degradation, resulting in the loss of ecological service value and function, and poor land ecological status, which is not conducive to sustainable human development. In the future, a global land ecological security research framework should be constructed. Global or other regional land ecological security evaluation research should be conducted in order to achieve the optimal allocation and sustainable use of global land resources.

5. Conclusions

Based on the concept of coordinated development, this study considered the impacts of population, industry, transportation and ecology in order to construct a land ecological security evaluation index system. We used this system to evaluate the LES status of the Beijing–Tianjin–Hebei region from 2007 to 2018. We found that the land ecological security index of Beijing–Tianjin–Hebei region has trended upward (rising from 0.1934 to 0.3284) in the study period. The LES level increased from the dangerous level (I) to the critical level (III). In the study period, the LES status of various areas within the BTH region was generally good, but the trends were different. The LES indices of ten cities (Beijing, Shijiazhuang, Chengde, Zhangjiakou, Qinhuangdao, Langfang, Baoding, Hengshui, Xingtai and Handan) continued to increase. The LES indices of three cities (Tianjin, Tangshan and Cangzhou) increased first and then fell, showing an overall trend of rising fluctuations. The results of different years indicate that there were more sensitive (II) and critical (III) areas, implying that the overall ecological security status of the BTH region was not ideal. In general, the LES level was relatively high in the central area (compared to the northern and southern areas). Despite the satisfactory development of the ecological status of the land in Beijing, Tianjin and Hebei, the risk of deterioration continued to exist. Seven obstacle indicators (i.e., land economic density (D11), transportation, warehousing and postal investment per unit land area (D15), per capita GDP (D13), tertiary industry ratio (D14), cultivated land ratio (D8), the usage of fertilizer per unit cultivated area (D5), and green coverage of urban built-up areas (D9)) have affected the LES in the BTH region.

Author Contributions

Conceptualization, D.W. and D.G.; methodology, D.G.; software, D.G.; data curation, D.G. and L.J.; writing—original draft preparation, D.G. and X.Z.; writing—review and editing, D.W. and Y.Y.; funding acquisition, D.W. and Y.Y. All authors have read and agreed to the published version of the manuscript.

Funding

This work was supported by the National Natural Science Foundation of China (No. 42071255, No. 42071231) and Department budget project of Ministry of Natural Resources of the People’s Republic of China (No. 121102000000180076).

Institutional Review Board Statement

Not applicable.

Informed Consent Statement

Not applicable.

Data Availability Statement

All data, models, and code generated or used during the study appear in the submitted article.

Conflicts of Interest

The authors declare no conflict of interest.

References

  1. Ezeonu, I.C.; Ezeonu, F.C. The environment and global security. Environmentalist 2000, 20, 41–48. [Google Scholar] [CrossRef]
  2. Yu, G.; Zhang, S.; Yu, Q.; Fan, Y.; Zeng, Q.; Wu, L.; Zhou, R.R.; Nan, N.; Zhao, P. Assessing ecological security at the watershed scale based on RS/GIS: A case study from the Hanjiang River Basin. Stoch. Environ. Res. Risk Assess. 2014, 28, 307–318. [Google Scholar] [CrossRef]
  3. Rapport, D.J.; Maffi, L. Eco-cultural health, global health, and sustain-ability. Ecol. Res. 2011, 26, 1039–1049. [Google Scholar] [CrossRef]
  4. Lonergan, S. Global Environmental Change and Human Security, GECHS: Science Plan; IHDP: Bonn, Germany, 1999. [Google Scholar]
  5. Chu, X.; Deng, X.; Jin, G.; Wang, Z.; Li, Z. Ecological security assessment based on ecological footprint approach in Beijing-Tianjin-Hebei region, China. Phys. Chem. Earth Parts A/B/C 2017, 101, 43–51. [Google Scholar] [CrossRef]
  6. Wang, H.Y.; Qin, F.; Zhang, X.C. A spatial exploring model for urban land ecological security based on a modified artificial bee colony algorithm. Ecol. Inform. 2019, 50, 51–61. [Google Scholar] [CrossRef]
  7. Zhang, H.-B.; Liu, L.-M.; Zhang, J.-L.; Zhu, Z.-Q. A dynamic assessment of ecological security of land resources in loess hills region. Resour. Sci. 2007, 29, 193–200. [Google Scholar]
  8. Feng, Y.; Yang, Q.; Tong, X.; Chen, L. Evaluating land ecological security and examining its relationships with driving factors using GIS and generalized additive model. Sci. Total Environ. 2018, 633, 1469–1479. [Google Scholar] [CrossRef]
  9. Bächler, G.; Spillmann, K.R. Environmental Crisis: Regional Conflicts and Ways of Cooperation. In Proceedings of the International Conference at Monte Verità, Ascona, Switzerland, 3–7 October 1994. [Google Scholar]
  10. Matthew, R.A.; Halle, M.; Switzer, J. Conserving the Peace: Resources, Livelihoods and Security; International Institute for Sustainable Development: Winnipeg, MB, Canada, 2002. [Google Scholar]
  11. Hurni, H. Assessing sustainable land management (SLM). Agric. Ecosyst. Environ. 2000, 81, 83–92. [Google Scholar] [CrossRef]
  12. Bouma, J. Land quality indicators of sustainable land management across scales. Agric. Ecosyst. Environ. 2002, 88, 129–136. [Google Scholar] [CrossRef]
  13. Pieri, C.; Dumanski, J.; Hamblin, A.; Young, A. Land quality indicators. World bank discussion paper 315. Gen. Inf. 1995, 3, 37–75. [Google Scholar]
  14. Costanza, R.; Arge, R.; Groot, R.; Farber, S.; Grasso, M.; Hannon, B.; Limburg, K.; Naeem, S.; O’Neill, R.V.; Paruelo, J.; et al. The value of the world′s ecosystem services and natural capital. World Environ. 1997, 25, 3–15. [Google Scholar]
  15. Prato, T. Selection and evaluation of projects to conserve ecosystem services. Ecol. Model. 2007, 203, 290–296. [Google Scholar] [CrossRef]
  16. Reynaud, A.; Lanzanova, D. A global meta-analysis of the value of ecosystem services provided by lakes. Ecol. Econ. 2017, 137, 184–194. [Google Scholar] [CrossRef] [PubMed]
  17. Perrodin, Y.; Boillot, C.; Angerville, R.; Donguy, G.; Emmanuel, E. Ecological risk assessment of urban and industrial systems: A review. Sci. Total Environ. 2011, 409, 5162–5176. [Google Scholar] [CrossRef] [PubMed] [Green Version]
  18. Hayes, E.H.; Landis, W.G. Regional ecological risk assessment of a near shore marine environment:Cherry Point, WA. Hum. Ecol. Risk Assess. 2004, 10, 299–325. [Google Scholar] [CrossRef]
  19. Bertollo, P. Assessing landscape health:A case study from Northeastern Italy. Environ. Manag. 2001, 27, 349–365. [Google Scholar] [CrossRef]
  20. Shepherd, K.D.; Shepherd, G.; Walsh, M.G. Land health surveillance and response:A framework for evidence-informed land management. Agric. Syst. 2015, 132, 93–106. [Google Scholar] [CrossRef]
  21. Li, X.; Zhou, Y.; Zhang, T. Research on Early-Warning of Land Ecological Security Based on BP Neural Network—Take Jilin Province as an example. For. Econ. 2017, 39, 83–86. [Google Scholar]
  22. Cheng, D.; Chen, Y.; Qiao, H.; Xie, B.; Ren, X. Time Series Evaluation of Urban Land Eco-security in Eco-vulnerable Areas of Northwest China—A Case Study of Lanzhou. Nat. Resour. Econ. China 2020, 33, 83–89. [Google Scholar]
  23. Liu, Y.F.; Ming, L.C.; Kong, X.S. Land ecological security evaluation based on PSR model and matter element mode-Take Daye City in Hubei Province as an example. Jiangsu Agric. Sci. 2017, 45, 271–277. [Google Scholar]
  24. Peng, W.; Yajuan, W.; Xiaopeng, L.; Xiao, C.; Fuxing, K. Evaluation and Prediction of Land Ecological Security in Qingtongxia City Based on PSR Mode. Bull. Soil Water Conserv. 201 2018, 38, 148–153. [Google Scholar]
  25. Xu, S.; Yang, G.; Zhang, C.; Sun, D.; Sun, X. Study On Evaluation Of Urban Land Ecological Environment Security Based On PSR Model: A Case Study Of Qindao City. Environ. Eng. 2019, 37, 199–204. [Google Scholar]
  26. Zhang, B.; Han, L.; Han, F. Land based on DPSIR model Ecological security evaluation--one belt, one road and 18 provinces panel data. World Agric. 2017, 8, 101–105. [Google Scholar]
  27. Liu, S.; Zhang, J.; Tian, F.; Yang, F. Land ecological security in the Shule River Basin from 2005 to 2014. Ecol. Sci. 2018, 37, 114–122. [Google Scholar]
  28. Wang, J.; Yuan, W.; Liu, X. Time series evaluation and prediction analysis of urban land ecological security in Harbin City. Arid Land Geogr. 2018, 41, 885–892. [Google Scholar]
  29. He, R.; Lu, Y.; Zhou, Y.; Li, Q. Evaluation of Land Ecological Security in Huaihe Ecoeconomic Zone Based on Principal Component-Cluster Analysis. J. Shandong Agric. Univ. Soc. Sci. Ed. 2019, 21, 39–47. [Google Scholar]
  30. Wang, L.; Zhang, J. Evaluation of land ecological security in Shandong Province and analysis of its influencing factors based on principal component cluster analysis. Jiangsu Agric. Sci. 2017, 45, 246–250. [Google Scholar]
  31. Yang, R.; Yang, Q.; Zeng, L. Evaluation on ecological security and analysis of influence factors of rural land based on BP-ANN model. Res. Soil Water Conserv. 2017, 24, 206–213. [Google Scholar]
  32. Zhang, T.; Zhang, X. Evaluation of land ecological security in Siping based on ecological footprint. Shanghai Land Resour. 2016, 37, 17–20. [Google Scholar]
  33. Xu, D.; He, R.; Gao, C.; Sun, P. Study on the Evaluation of Land Ecological Security in Anhui Province Based on Ecological Footprint. J. Yunnan Agric. Univ. Soc. Sci. 2017, 11, 35–44. [Google Scholar]
  34. Xiang, W.; Tu, J.; Li, Q.; Zhu, Y.; Liu, L. Early-warning of urban land ecological security in Yangtze River Economic Belt based on grey forecasting model. Ecol. Sci. 2018, 37, 78–88. [Google Scholar]
  35. Lu, G.; Liao, T.; Yao, Q.; Deng, W. Spatiotemporal variation and land ecological security and its evaluation in chongqing city based on dpsir-ees-topsis model. Res. Soil Water. Conserv. 2019, 26, 249–258. [Google Scholar]
  36. Ma, Y. Evaluation of land ecological security in Hubei province based on entropy-weight TOPSIS modeling. Hubei Agric. Sci. 2019, 58, 28–34. [Google Scholar]
  37. Jiang, C.; Luo, Z.; Zhao, J.; Zhao, Y. Dynamic evaluation of land ecological security in Jiangxi Province based on DPSIR-TOPSIS model. Jiangsu Agric. Sci. 2018, 46, 294–298. [Google Scholar]
  38. Zhu, Q.; Luan, J. Evaluation of Land Ecological Security Based on Improved TOPSIS Model: Taking Anhui Province as an Example. J. Anhui Agric. Univ. Soc. Sci. Ed. 2018, 27, 36–41. [Google Scholar]
  39. Wang, L.; Guo, C.; Li, H. Evaluation of Land Ecological Security in Ningxia Autonomous Region Based on PSR-TOPSIS model. Res. Soil Water Conserv. 2016, 23, 154–159. [Google Scholar]
  40. Chen, Y.; Yang, Q.; Yang, R.; Zeng, L. Evaluation of land ecological security based on entropy weighted matter-element model: A case of Jiangjin District, Chongqing. Arid Land Geogr. 2018, 41, 185–194. [Google Scholar]
  41. Liu, B.; Wang, X.; Shuai, L.; Ruiqing, Q. Diagnosis on Cultivated Land Ecological Security in Jilin Province Based on Normal Cloud Model. Areal Res. Dev. 2019, 38, 119–124. [Google Scholar]
  42. Huang, L.; Yang, P. Spatio-temporal Evolution Characteristics and Influencing Factors of Land Ecological Security in the Yangtze River Economic Belt. Resour. Environ. Yangtze Basin 2019, 28, 1780–1790. [Google Scholar]
  43. Yu, X.; Lu, C.; Guo, X.; Zhang, Z.; Shuangcheng, L.; Hao, J. Assessment on the Status of Land Ecosystem in Beijing-Tianjin-Hebei Region. China Land Sci. 2018, 32, 89–96. [Google Scholar]
  44. Yan, C.; Zhang, A.; Shi, R.; Guo, H.; Guo, D.; Wu, S.; Rong, H. Spatiotemporal Change Analysis and Land Ecological Security Evaluation in Qianjiang District of Chongqing City. Bull. Soil Water Conserv. 2016, 36, 262–268. [Google Scholar]
  45. Yu, H.; Zhang, F.; Cao, L.; Wang, J.; Yang, S. Spatial-temporal pattern of land ecological security at a township scale in the bortala mongolian autonomous prefecture. Acta Ecol. Sin. 2018, 37, 6355–6369. [Google Scholar]
  46. Han, S.; Xiong, J.; Li, D. Evaluation index system of land ecological security in the Pearl River Delta urban agglomeration. Guangdong Agric. Sci. 2016, 43, 83–88. [Google Scholar]
  47. Jie, C.; Shi, F. Research on Evaluation and Regulation of Land Ecological Security in Beijing-Tianjin-Hebei Region. J. Agric. Manag. Inst. Minist. Agric. 2016, 1, 37–43. [Google Scholar]
  48. Xiang, L. Comprehensive evaluation and comparative study on ecological security of land in the Yangtze River economic belt. Jiangsu Agric. Sci. 2018, 46, 282–286. [Google Scholar]
  49. Peng, W. Land Ecological Pressure and Coordinated Regulation Strategy in Beijing-Tianjin-Hebei Region. China Bus. Mark. 2018, 32, 95–101. [Google Scholar]
  50. Xie, H.L.; Kung, C.C.; Zhao, Y.L. Spatial disparities of regional forest land change based on ESDA and GIS at the county level in Beijing-Tianjin-Hebei area. Front. Earth Sci. 2012, 6, 445e452. [Google Scholar] [CrossRef]
  51. Zhang, W.; Xie, G. Research on the Evaluation System of Ecological Environment Quality and Analysis of Current Situation. Sci. Technol. Inf. 2011, 1, 367+383–384. [Google Scholar]
  52. Bai, Y.; Liu, H.; Han, W. Study on Remote Sensing Monitoring of Land Ecology on Regional Scale in Beijing-Tianjin-Hebei Urban Agglomerations. J. Hebei GEO Univ. 2019, 42, 50–55. [Google Scholar]
  53. Bagherzadeh, A.; Gholizadeh, A. Parametric-based neural networks and TOPSIS modeling in land suitability evaluation for alfalfa production using GIS. Modeling Earth Syst. Environ. 2017, 3, 2. [Google Scholar] [CrossRef]
  54. Lu, Y.; He, R.; Li, Q.; Zhou, Y. Evaluation of Urban Land Ecological Security and Diagnosis of Obstacles in Bengbu City. J. Heilongjiang Bayi Agric. Univ. 2020, 32, 85–92. [Google Scholar]
  55. Wang, J.; Peng, W.; Li, R. Land Ecological Pressure of Population and Spatial Regulation Strategy in Beijing-Tianjin-Hebei Region. Popul. Econ. 2018, 5, 83–90. [Google Scholar]
  56. Li, R. Study on the Regulation and Control of Land Ecological Pressure in Beijing-Tianjin-Hebei Region; Capital University of Economics and Business: Beijing, China, 2019. [Google Scholar]
  57. Xue, L.; Weng, L. Thoughts on China’s Belt and Road Initiative for Promoting UN 2030 Sustainable Development Goals. Bull. Chin. Acad. Sci. 2018, 33, 40–47. [Google Scholar]
  58. Sutton, P.C.; Anderson, S.J.; Costanza, R.; Kubiszewski, I. The ecological economics of land degradation: Impacts on ecosystemservice values. Ecol. Econ. 2016, 129, 182–192. [Google Scholar] [CrossRef]
  59. Drescher, J.; Rembold, K.; Allen, K.; Beckschäfer, P.; Buchori, D.; Clough, Y.; Heiko Faust, H.; Fauzi, A.M.; Gunawan, D.; Hertel, D.; et al. Ecological and Socio-economic Functions across Tropical Land Use Systems after Rainforest Conversion. Philos. Trans. R. Soc. B Biol. Sci. 2016, 371, 20150275. [Google Scholar] [CrossRef]
  60. Galbraith, S.M.; Hall, T.E.; Tavarez, H.S.; Kooistra, C.M.; Ordoñez, J.C.; Bosque-Pérez, N.A. Local Ecological Knowledge Reveals Effects of Policy-driven Land Use and Cover Change on Beekeepers in Costa Rica. Land Use Policy 2017, 69, 112–122. [Google Scholar] [CrossRef]
Figure 1. Administrative boundary and land use pattern of the BTH region.
Land 10 00706 g001
Figure 2. Changes in LES for the BTH region from 2007 to 2018.
Land 10 00706 g002
Figure 3. Changes in the LES of the BTH region.
Land 10 00706 g003
Figure 4. Spatial levels of LES in the BTH region in 2007, 2010, 2015 and 2018.
Land 10 00706 g004
Table 1. LES evaluation index system for the BTH region.
Target LayerCriterion LayerFactor LayerIndex LayerWeightDirection
Land ecological securityPressurePopulationD1 Population density (person/km2)0.0463
IndustryD2 Secondary industry ratio (%)0.0085
TrafficD3 Highway passenger traffic per unit land area (ten thousand /km2)0.0103
D4 Road freight per unit land area (ten thousand ton/km2)0.0210
EnvironmentD5 The usage of fertilizer per unit cultivated area (ton/ km2)0.0629
D6 Industrial dust emissions per unit land area (ton/km2)0.0026
D7 Industrial wastewater discharge per unit land area (ten thousand ton /km2)0.0034
StateLand structureD8 Cultivated land ratio (%)0.0696+
D9 Green coverage of urban built-up areas (%)0.0314+
Land functionD10 Food production per unit land area (ton/km2)0.0421+
D11 Land economic density (ten thousand yuan /km2)0.2241+
ResponsePopulationD12 population growth rate (%)0.0201+
IndustryD13 Per capita GDP (ten thousand yuan/person)0.1234+
D14 Tertiary industry ratio (%)0.0826+
TrafficD15 Transportation, warehousing and postal investment per unit land area (ten thousand yuan/km2)0.2199+
EnvironmentD16 Comprehensive utilization rate of industrial solid waste (%)0.0319+
Note: “+” and “−” represent the positive and negative indicators, respectively.
Table 2. Evaluation criteria of LES.
LES IndexLES LevelSystem StatusSystem Characteristics
[0,0.2)IDangerousLand development and utilization seriously exceeds the land ecological carrying capacity. The structure and function of the ecosystem are severely damaged, and restoration is very difficult. The LES is seriously threatened.
[0.2,0.3)IISensitiveLand development and utilization exceeds the land carrying capacity to a large extent. The structure and function of the ecosystem are greatly damaged, and recovery is difficult. The LES is seriously threatened.
[0.3,0.4)IIICriticalLand development and utilization just started to exceed the land ecological carrying capacity. The ecosystem structure and functions are relatively complete, and can be restored. The LES is threatened.
[0.4,06)IVGoodLand development and utilization is lower than the land ecological carrying capacity. The ecosystem structure and function are relatively complete, and can be restored. The land ecological environment is relatively safe.
[0.6,1.0)VSecureLand development and utilization is way below the land ecological carrying capacity. The ecosystem structure and functions are perfect, and the system can be restored. The land ecological environment is safe.
Table 3. The LES of the BTH region from 2007 to 2018.
YearPressure (P)State (S)Response (R)LES LES LevelSystem Status
20070.5777 0.1542 0.1584 0.1934 IDangerous
20080.5758 0.1637 0.1712 0.2019 IISensitive
20090.5811 0.1701 0.2019 0.2187 IISensitive
20100.5686 0.1798 0.2098 0.2250 IISensitive
20110.5628 0.1955 0.2145 0.2323 IISensitive
20120.5557 0.2031 0.2284 0.2413 IISensitive
20130.5520 0.2108 0.2517 0.2556 IISensitive
20140.5499 0.2155 0.2643 0.2639 IISensitive
20150.5509 0.2215 0.2865 0.2779 IISensitive
20160.5559 0.2329 0.2941 0.2866 IISensitive
20170.5695 0.2410 0.3269 0.3081 IIICritical
20180.5950 0.2446 0.3575 0.3284 IIICritical
Table 4. The LES of BTH region from 2007 to 2018.
Area2007201020152018
Beijing0.37440.47130.62590.8040
Tianjin0.29950.47700.69150.6669
Shijiazhuang0.19660.22490.29520.3561
Chengde0.17290.18180.19450.2032
Zhangjiakou0.20000.20680.21480.2289
Qinhuangdao0.17260.17790.18970.2201
Tangshan0.20980.27560.35060.3498
Langfang0.21250.22610.27890.3628
Baoding0.17310.18090.19590.2035
Cangzhou0.21540.24150.26540.2651
Hengshui 0.21900.22180.23500.2428
Xingtai0.19110.20560.21780.2413
Handan0.20120.22810.26230.2720
Table 5. Main obstacle indicators of LES in the BTH region from 2007 to 2018 (%).
YearRanking and Degree of Obstacles
1 2 3 4 5 6 7
2007D11D15D13D14D8D5D9
28.63 27.89 14.58 7.26 5.47 4.55 3.64
2008D11D15D13D14D8D5D9
28.69 28.35 14.21 6.94 5.55 4.62 3.61
2009D11D15D13D14D8D5D9
29.36 27.92 14.34 6.58 5.54 4.64 3.42
2010D11D15D13D14D8D5D9
28.83 27.34 13.61 6.66 5.56 4.76 3.79
2011D11D15D13D14D8D5D9
28.64 28.26 12.82 6.87 5.64 4.87 3.42
2012D11D15D13D14D8D5D9
28.53 28.22 12.37 6.83 5.72 4.99 3.48
2013D11D15D13D14D8D5D9
28.75 28.04 12.05 6.74 5.85 5.12 3.53
2014D11D15D13D14D8D5D9
28.83 28.26 11.82 6.44 5.95 5.25 3.52
2015D11D15D13D8D14D5D9
29.27 28.38 11.82 6.12 6.00 5.35 3.62
2016D15D11D13D8D14D5D9
29.53 29.19 11.21 6.23 5.47 5.36 3.70
2017D11D15D13D8D14D5D9
29.85 29.10 10.94 6.46 5.03 5.28 3.83
2018D11D15D13D8D5D14D9
30.71 29.75 9.43 6.76 5.24 5.10 4.05
Table 6. Main obstacle indicators of LES in different areas of the BTH region in 2007 and 2018 (%).
Area20072018
1 2 3 4 5 6 7 1 2 3 4 5 6 7
BeijingD11D15D13D8D5D1D9D8D10D1D9D5D16D12
25.25 22.75 13.01 10.33 6.89 5.80 4.25 32.17 19.39 14.20 10.36 10.03 5.24 2.57
TianjinD11D15D13D14D5D8D1D15D14D8D1D11D9D5
25.99 22.72 13.57 9.12 6.02 5.12 4.80 29.38 9.90 9.67 8.88 8.65 7.21 6.73
ShijiazhuangD15D11D13D14D5D8D9D11D15D13D5D14D8D9
27.65 27.62 15.12 8.40 7.94 3.80 3.46 30.56 21.96 13.92 8.44 6.70 5.88 4.08
ChengdeD11D15D13D14D8D9D16D11D15D13D8D14D10D16
27.50 26.83 14.60 9.74 8.54 3.59 2.67 29.50 28.91 12.70 8.98 7.08 3.82 3.43
ZhangjiakouD11D15D13D14D8D10D9D11D15D13D8D14D10D9
28.83 28.14 15.66 7.90 6.67 5.41 3.43 31.27 28.66 14.42 6.88 6.35 5.18 3.46
QinhuangdaoD11D15D13D8D5D14D10D15D11D13D8D5D14D9
28.08 27.94 14.83 6.54 6.19 6.17 3.19 28.60 28.45 12.04 7.12 6.97 5.79 3.39
TangshanD11D15D13D14D5D8D9D11D15D14D5D13D8D9
28.07 25.93 13.76 10.02 6.49 4.29 3.18 27.54 24.96 10.61 8.40 8.38 5.20 3.94
LangfangD15D11D13D14D5D10D1D11D15D13D14D1D10D5
29.19 28.54 15.60 10.25 3.83 3.16 2.79 30.09 27.58 13.12 6.68 4.46 4.55 4.43
BaodingD11D15D13D14D5D8D9D15D11D13D14D5D8D9
28.32 27.58 15.99 8.91 4.77 4.62 3.35 29.27 28.88 14.76 7.33 5.17 4.88 3.28
CangzhouD11D15D13D14D9D5D1D15D11D13D14D9D5D10
29.71 29.69 16.12 9.12 3.88 3.57 2.12 31.19 30.37 13.81 7.45 3.98 3.52 2.79
HengshuiD15D11D13D14D9D5D10D15D11D13D14D5D9D1
29.77 29.57 16.66 9.63 4.24 3.92 2.42 31.57 30.22 15.03 7.76 5.82 3.59 2.38
XingtaiD15D11D13D14D5D9D1D11D15D13D14D5D9D1
28.37 28.35 16.03 10.37 4.40 3.37 2.29 30.40 29.34 15.90 7.63 4.32 3.53 3.08
HandanD15D11D13D14D5D1D9D11D15D13D14D5D1D9
28.77 28.31 15.88 9.32 6.46 3.23 3.06 29.24 26.11 15.36 8.10 7.14 4.53 3.55
Publisher’s Note: MDPI stays neutral with regard to jurisdictional claims in published maps and institutional affiliations.

