Abstract
Organization of rural tourism resources is important for optimizing rural land use based on rational resource classification. Quantitative analysis was performed to evaluate the resource control ability of rural tourism networks. This was achieved by determining the resource control relationship and assessing the structure of the rural tourism network. The ability of resource control was analyzed via resource abstraction, which included the extraction of resource nodes and corridors, control scope analysis, and network structure level evaluation. The proposed approach was applied to the Ning’an in Heilongjiang Province, China, and proved to be effective for exploring the network degree and development trends in rural tourism resources. By examining the resource control ability, the spatial characteristics and development trend in rural tourism networks were quantitatively analyzed, especially the connection mode of key tourism resources, network structure analysis, and resource linking ability. The core resources showed a lack of outward ability in the network, and the secondary resource expansion ability was limited. Via resource control ability analysis, this study focused on areas with rich tourism but an unbalanced spatial structure, combining the directional characteristics of the network to provide suggestions for the optimization rural tourism resources network in other regions of the world.
1. Introduction
Modernization, industrialization, and urbanization constitute the background and driving forces of global development. There is a notable trend in rural social decay and disintegration, as rural areas have been considered independent of social relations emerging during urbanization. This has gradually become a path for people to return to nature in a post-modern society [1,2]. In the second half of the 20th century, research on rural areas has declined in developed countries. In the 1990s, with the revival and reconstruction of rural areas, rural research received increasing attention in Western Europe, North America, and other regions [3,4,5,6].
Rural tourism is an important research topic for the effective organization of rural land use [7,8], and its success largely depends on the sustainable spatial organization of tourism resources [9,10,11]. Previous studies have emphasized the tourism spatial experience and its value-added upgrading functions [12,13,14,15].
Smith [16], in a study on the urban-rural environmental imbalance in the United States, stated that urban tourism development is key to upgrading to regional tourism, which directly affects the rural residential living and recreation experience. Innskeep [17] pointed out that the construction of a spatial resource organization mechanism for tourism is the foundation of rural tourism development. Carte [18] proposed a combination of agriculture and tourism as conducive to rural revitalization, which can feasibly promote overall regional development by considering tourism as the dominant industry. Fundeanu [19] proposed that the organization of tourism-related land resources has significantly impacted rural tourism. Through an empirical study, Streifeneder [20] also proposed that rural tourism can be achieved by upgrading to resource space organization.
In developing countries, rural decline is particularly prominent owing to the advancement of modernization and urbanization. Structure evaluation and optimization of a rural spatial tourism system are important means of achieving rural revitalization [21,22]. However, there is a lack of a quantitative network structure organization method.
The tourism network structure refers to the spatial network formed by the interaction of tourism resources in a certain region [23,24,25]. It reflects the spatial attributes of tourism activities and the relationship between spatial resources [26]. The formation of a spatial network structure results from the coupling between the destination supply and demand systems [27]. In the spatial evaluation field, the “pole-axis” theory is often used to characterize the structure of resources [28]. When applying the theory to tourism spatial analysis, the poles generally refer to tourism resource points, including central towns or tourism destinations, and the axes normally include transportation and energy corridors [29,30]. This leads to a three-stage classification of tourism structure optimization, i.e., the polar nucleus type stage, point line type stage, and mature network [31].
Generally, the focus of network research is the evaluation of resource aggregation and dispersion, where resource control ability is an effective mean [32].
The network closure, line point ratio, and connectivity indices are used to evaluate the effectiveness, interference, and closure of a network [33]. In tourism networks, in particular, tourism-related energy transfer follows traffic, people, and capital flows [34]. In other words, a rural tourism network is a directed network. The control range of resources reflects the dominance of each node in the structure. However, few studies have focused on network structure reorganization caused by changes in individual resource dominance [19].
Herein, resource dominance was analyzed by constructing an evaluation route and method to quantitatively study tourism spatial organization. The directed tourism flow—formed by transportation, tourists, and tourism industry funds—is related to tourism resources. Moreover, the basic elements of a rural tourism network were identified, and an evaluation method of the network structure, including the resource control scope and structure relationship, was developed. Finally, specific screening criteria for conducting structural evaluation were determined.
Ning’an, China, was selected as a case study to verify the analysis process and the structure evaluation results. This county contains nationally recognized tourist destinations and several secondary tourist spots, but the degree of promotion between tourism resources is limited, resulting in a relatively underdeveloped tourism network [35,36]. Analyzing the dominant relationship of tourism resources may facilitate the optimization of the regional tourism network. The results of this study have important reference significance for the evaluation and optimization of other rural areas worldwide that are rich in tourism resources but have significant imbalance in resource utilization.
2. Materials and Methods
Tourism resources were regarded as “patches, corridors, or matrices” based on the theory of landscape ecology [23,28]. Then, a network was constructed that included the resource connection relationship and direction, which were determined by the scope of resources. Following, the hierarchical structure of the network was analyzed based on the resource connections and levels, and optimization was performed.
Data processing comprised four parts: index evaluation system construction, resource qualitative index classification (questionnaire survey), remote sensing image data acquisition (using the Envi 4.7 software), and resource control ability calculation (mathematical analysis of the network structure).
2.1. Basic Network Elements
In quantitative research on spatial networks, tourism-related resources—including transportation, communication, ecology, and other spatial planning—are generally abstracted as network elements to measure the operation system and structure of the network, which is composed of nodes and corridors based on the “pole-axis” theory [37]. In this study, rural tourism resource nodes were the poles, and corridors were the axes. The mutual resource node control ability between corridors is represented by the resource control ability, as shown in Figure 1.
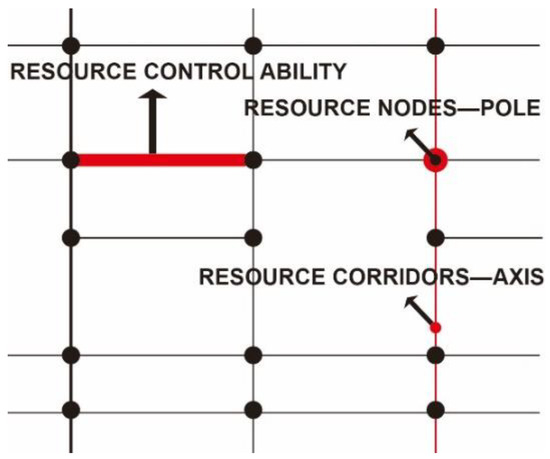
Figure 1.
Basic elements of a network model.
2.2. Rural Tourism Network Structure Analysis
As a complex network structure, the transmission of energy in the network is directional, where the control range reflects the ability of the nodes to dominate the network structure [38]. In this study, the tourism network was determined via the spatial relationships and service value of the resources (Figure 2). The spatial relationship dominates the connection of the abstract elements, whereas the resource values determine the network connection directions. The higher the value of a resource is, the higher the attraction of tourism flow is. The spatial relationships were used to determine the flow direction, from low- to high-value resources, and the spatial control relationship analysis included the element control range and network structure evaluation.
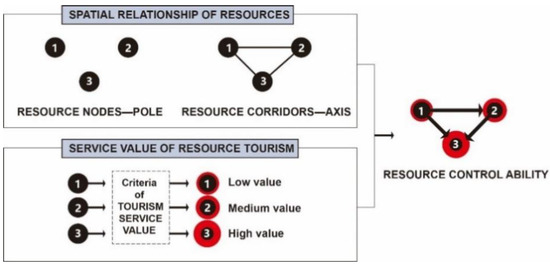
Figure 2.
Analysis path of the tourism network structure.
2.2.1. Resource Control Range
In a directional network, the control range reflects the dominant ability of the node in the entire structure. The rural tourism network, G, can be written as G (V, L), where V is the set of resource nodes and L is the collection of resource corridors. In other words, the structural essence of network abstraction is the binary relationship expression of nodes. For a linear invariant dynamic system, i.e., X(t) = AX(t) + Bu(t), the n × nm dimensional controllability matrix can be written as QC = [B, AB, A2B, …, An − 1B] [39]. Rank (QC) represents the range in the controllable subspace in a structured system (A, B). In a rural tourism network structure, the control ability of the nodes is measured using the controllable subspace range. The controllable subspace of node i was obtained using matrix simplification and rank (QC (i)) [40] as follows:
For maximum matching, M, in the rural tourism network, G, there is a corresponding minimum input control pattern, CF (V, M∪AL). When considering the control range of a single node, i, the control input matrix, B, is simplified to the column vector, b(i), and matrix A is simplified to A(M). The control range of node i was obtained as follows [41]:
In the network structure, the controllable subspace and control range reflect different control capabilities according to the structure (Figure 3). The controllable subspace of node 1 in Figure 3a is {1,3,5}. Therefore, the maximum impact range of resource node 1 is three units, without considering other impacts in the network. Correspondingly, the control range of node 1 in Figure 3b is {1,4}. In other words, only two resource nodes must be activated.
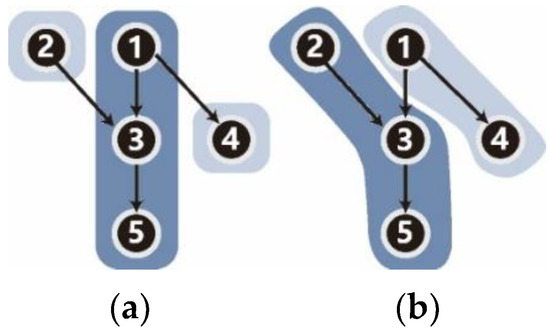
Figure 3.
Controllable subspace control range comparison diagram: (a) controllable subspace of node 1 and (b) controllable subspace of node 1.
2.2.2. Resource Service Value
Service values of resource tourism aim to reflect the attraction of tourism resources. A rural tourism index evaluation system should consider the target resources of regional construction for rural tourism [42,43,44]. Considering the case study herein, we focused on the ecological, cultural, and recreational resources of rural tourism. In the construction of the index system, 14 indicators and grading standards were proposed (Table 1), combined with GB/T 18972-2003 (“Classification, Investigation and Evaluation of Tourism Resources”), GB 50298-1999 (“Code for Scenic Area Planning”), and other standard documents in China [45,46,47,48]. Some indicators did not have a quantitative standard classification (e.g., reactional landscape quality).

Table 1.
Grade criteria for screening relevant elements of the tourism network.
The index weights were calculated using the Delphi method. Twenty experts from related fields were invited to score the index weights, including urban and rural planning, landscape ecology, and tourism economics, among others. A total of 540 questionnaires were distributed; 529 were returned and 522 were valid. Field surveys were used to obtain the results for the resource classification. In the case of Ning’an, the questionnaire survey covered seven towns; questionnaires were collected from one township and two villages per town. In the questionnaire, the use of resources was focused. Finally, each index weight was computed from the average value and variance in the scoring results of the experts. Each resource was classified on a four-grade scale (Table 1), namely, very strong (N01), strong (N02), general (N03), and weak (N04), according to the standard classification and weight of each index.
3. Case Study of Tourism Network Evaluation in Ning’an
3.1. General Situation in Ning’an
Ning’an is located in Mudanjiang City, Heilongjiang Province, China. It is a county composed of seven townships and is located in an economic corridor with rich tourism resources (Figure 4). There are 58 scenic areas, including 13 major scenic spots and 45 secondary scenic areas. Natural leisure tourism resources include the Xiaobei Lake, Jingpo Lake, and Huashuchuan scenic areas. Among them, the Jingpo Lake is a national tourist park, which has a strong reputation and influence in China. Cultural leisure tourism resources include the Shangjing Longquan site and Bohai Park, which have high cultural values. Agricultural leisure tourism is organized along national highway G201 in Ning’an, including the Bohai rice exhibition area and various ecological parks.

Figure 4.
Tourism resources distribution and location of Ning’an: (a) construction magnitude for tourism demonstration areas and (b) tourism resources distribution.
According to government statistics collected in 2020 (data available upon request from: http://zw.ningan.gov.cn, accessed on 20 December 2020) and the filed survey (see Section 2), tourism activities have an excessive dependence on the Jingpo Lake, whereas the utilization rate of other secondary tourism resources is exceedingly low (Figure 5). This has resulted in a serious imbalance in resource development. Cars or tourist buses are the main mode of transportation to the Jingpo Lake scenic area, which is the destination of most tourists travelling through Mudanjiang City. This type of tourism mainly involves 1- or 2-day tours. The influence of secondary tourism resources, such as the Bohai and Huashuchuan Scenic Areas, is relatively small. Most tourists are locals or residents of Mudanjiang City and other surrounding towns. Spatial relationship analysis and evaluation of tourism resources are important components of tourism industry reorganization. Therefore, resource spatial mode exploration has certain reference significance, especially for cities and towns with several tourism resources but medium attraction, similar to Ning’an.
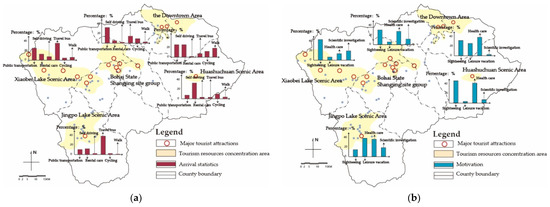
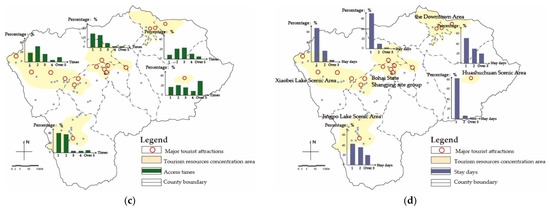
Figure 5.
Investigation of tourism resources: (a) arrival mode, (b) motivation, (c) access times, and (d) stay days.
3.2. Abstraction of Network Elements
Our primary task was to determine the quantity and spatial distribution of resource nodes and corridors in Ning’an. The data for the analysis were obtained from remote sensing images (retrieved in March 2020, with a resolution of 10 m). The land cover map was interpreted from digital orthophotos using the ENVI 4.7 software. Based on the Master Plan for Ning’an (2011–2030), the nodes of tourism resources were divided into main attractions and general attractions (Figure 6a), which were extracted from remotely-sensed images in the ENVI software, with reference to GPS control points and field excursions.
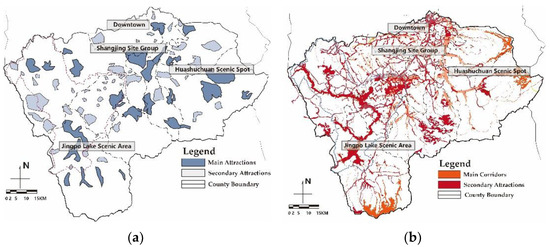
Figure 6.
Spatial distribution of tourism resources in Ning’an: (a) resource node distributions and (b) resource corridor distributions.
From a spatial distribution perspective, tourism resource corridors are mainly concentrated in town areas and large-scale scenic areas, including the Jingpo Lake scenic area and Shangjing site group. Secondary corridors present a fishbone spatial distribution structure (Figure 6b). The main corridors mainly connect downtown Shangjing site group, Jingpo Lake, and Huashuchuan scenic area. The tourism resource corridors include transportation, ecology, landscape, and industry corridors. The distribution of the corridors is scattered and does not reveal a cohesive system. The nodes of the connection network are not sufficiently close, which renders activation difficulties.
In the extraction process, the resource nodes were first abstracted and numbered. A total of 23 patch centroids were determined, including recreational, human, ecological, and industrial resource nodes. Resource corridors were abstracted in the form of connecting lines to represent the organizational relationships between nodes (Figure 7). This was used to analyze the classification and evaluation of the network level.
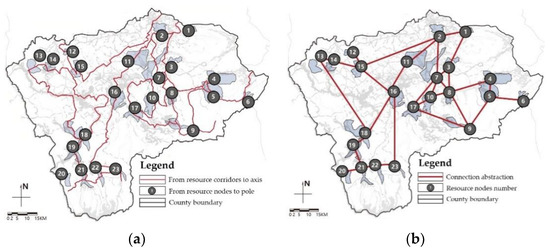
Figure 7.
Abstraction and connection of resources: (a) geometric abstraction of resource nodes and corridors, and (b) abstract resource connection.
3.3. Spatial Dominant Relationship
According to the abstract network basis, the resource control scope and network can be quantitatively analyzed, which can optimize the tourism structure.
3.3.1. Resource Control Scope
The tourism network, G, is represented by the weight matrix, W. Here, Wij represents the intensity of the tourism flow from resource nodes i to j in the network. The calculation process for the spatial control ability of the resource elements has a certain similarity. Taking resource node 1 as an example, the control range was calculated as follows:
Resource node 1 can directly or indirectly control 12 other resource nodes, such as nodes 2 and 3 (Figure 8). In the construction of a tourism network, the combination of node 1 and other resource elements has a different impact on the tourism flow of the 12 nodes related to the network. Similar to this process, the control range of the resources can be obtained from nodes 2–23.
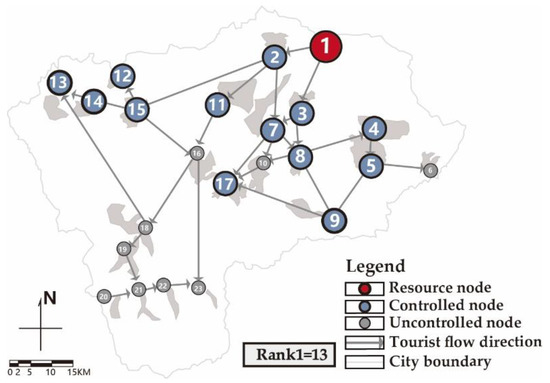
Figure 8.
Control range of resource node 1.
The characteristics of the resources themselves mainly determine the control range of the resource nodes, whereas the relationship between resource nodes determines that of the resource corridors. Specifically, an increased number of corridors that overlap in the same direction results in a stronger control ability and larger control range. For example, the tourism flow of resource corridor 2 formed via the superposition of corridors 1 and 3. Therefore, the tourism flow in resource corridors 1 and 3 can be indirectly controlled by dominating the flow in corridor 2 in the network restructuring. Figure 9 shows the relationship between resources according to their value grades.
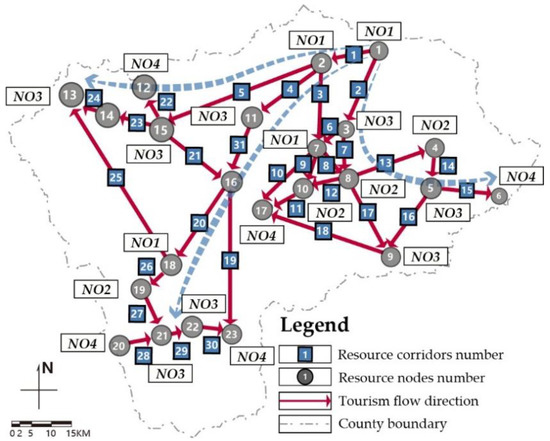
Figure 9.
Tourism flow direction.
3.3.2. Network Structure Classification of Ning’an
To classify the network hierarchy, the existing rural tourism network structure in Ning’an was divided into primary, secondary, and tertiary networks (Figure 10). In the primary structure, the spatial distribution was relatively balanced, covering the main resource nodes of each region, including the main roads, rivers, industries, scenic spots, and other skeleton elements. The secondary network structure improved the connectivity of the primary network and connected regions in the central part of the county. However, the secondary network has not formed a mature network system because the relationship between corridors is relatively weak. The tertiary level network reflected the internal connections of tourism clusters. The related resources were mainly concentrated in limited areas, including the eastern and southern clusters. Therefore, it cannot effectively play an extended role in the network. The unbalanced distribution of elements indicated that the tertiary network cannot provide a link among resources. The imbalance between the spatial distribution is the main disadvantage of the current spatial dominance relationship.
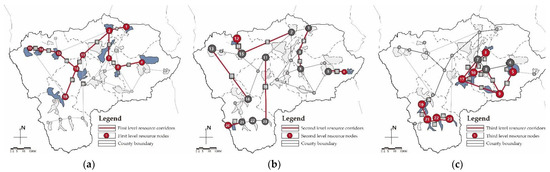
Figure 10.
Classification of the abstract network:(a) first, (b) second, and (c) third levels.
4. Results and Discussion
In this section, the structural characteristics of the network are summarized, and potential problems are identified. Further, the need for network optimization and expansion is evaluated. Based on the spatial control range of the resource nodes, we can observe the distribution of the regional core resource nodes and their relative utilization.
4.1. Spatial Characteristics of Resources
(1) Resource nodes
Analysis of the dominant characteristics of the resource nodes reveals certain differences in the distributions of the strong and weak dominant nodes. In Ning’an, nodes with strong spatial dominance are located near the central axis of the county, whereas weak dominance nodes are located in the marginal area. Strongly dominant nodes are concentrated in the core clusters. From the dominance relationships perspective of a dominance relationship, resources with more connections present the form of a centralized distribution. Among them, resource node 1 (downtown) has the highest number of control nodes, forming the core control area. Second, the control scope of resource node 18 (Jingpo Lake scenic area) covers the main tourism nodes in the western region of the county, forming an important core in the network. However, its control ability is limited within the Jingpo Lake scenic area. At present, most nodes with a weak control ability are still located within the network, such as nodes 6, 12, 13, 17, 19, and 23, which are at the end of the network, such that node integration is relatively low.
Second, the development path of core resources determines the formation of network structure, and the formation of core group relies on resources. However, the excessively uneven distribution of resources is a serious constraint to the further development of the whole network. For example, the downtown, Jingpo Lake scenic area, and other core resources constitute spatial links and function transmission in the entire region, exhibiting a strong dominance in the network. Simultaneously, they are destinations within Ning’an. However, there is a group structure in these resources, indicating that the two-core network presents an insufficient outward expansion ability.
A change in network structure directly affects the overall network benefit cost. This is not only reflected in the control power of the node itself, but also in the cost of controlling the entire network. Therefore, the spatial control scope of a rural tourism network reflects the actual demand and utility maximization of tourism resources in a network.
(2) Resource corridors
The distribution of corridors and the connected direction of the tourism flow embody the network degree of conversion efficiency between resources. This can also be used to identify low-valley areas in the network. The connection characteristics of corridors are the basic connection degree and resource integration. The lack of connection causes spatial discontinuity, and insufficient resource integration results in low space utilization.
In Ning’an, low network connectivity is the primary structural problem, as the dispersion of clusters leads to structural imbalance. Some resource corridors lack control in the network key position, while branching corridors result in limited resource allocation. Most resources with little contribution to the network organization of the tourism resources appear at the end of the network, where there are fewer network loops. The corridors along the Mudanjiang River and national highway G201 are isolated. The low valleys in the network affect the overall structure organization. The structural problem of isolation exists under the branch form and “dumbbell” corridor system. The connectivity between resource nodes is mostly discontinuous because of the number and connection mode of the corridors.
Other resources are well connected but must be further integrated. The connection between the main recreational resource nodes has fully utilized provincial roads, county and township roads, and rural roads, as well as transportation resources in Ning’an. However, integration is still required to connect existing water bodies, valleys, ridges, and other relatively stable tourism environmental resources.
4.2. Disadvantages of the Spatial Network Structure
The shortcomings of the spatial network structure are mainly associated with the connection of regional clusters, secondary tourism flow expansion, and resource cooperation. In Ning’an, the main limitations are as follows:
(1) Unbalanced dominance among clusters
At present, the network structure is divided into four clusters; however, weak links remain, as in the fringe area. Resources with a high network control ability and corridors with high tourism flow rates are concentrated in each group. Therefore, the connections must be balanced among the clusters. The network structure can be fragmented by enhancing the connectivity of network tourism flows (Figure 11).
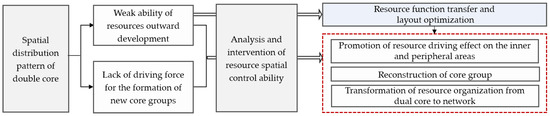
Figure 11.
Analysis on the development of core elements in the network structure of Ning’an.
(2) Limited secondary resource space expansion
The agglomeration and diffusion present a pattern of overall dispersion with a partial concentration, thus forming the core nodes and realizing the radiation of the tourism value throughout the entire region. However, secondary resource nodes are distributed in scattered clusters, resulting in a dumbbell-shaped spatial structure. If construction continues based on this trend, the regional spatial layout and development mode will become increasingly unbalanced, and it will restrict the formation of a spatial network pattern.
(3) Lack of coordinated space development
In the analysis of tourism network relationship, the lack of spatial connection is a common problem. To address this problem, we propose the direction of spatial solution (Figure 12). The construction scale of the tourism industry, with Jingpo Lake scenic area as the core, has increased, while the phenomena of functional duplication and industrial isomorphism have become more serious. From a spatial distribution perspective, although the Jingpo Lake core group and Bohai State Shangjing site group are adjacent, they do not form a spatial driving mode. In contrast, the main urban area has a strong ability to dominate the tourism resource network space. Based on the control and control ability of the two core resources, the construction of a rural tourism network is more suitable for the paradigm coordination of multicore control and balanced control in Ning’an.
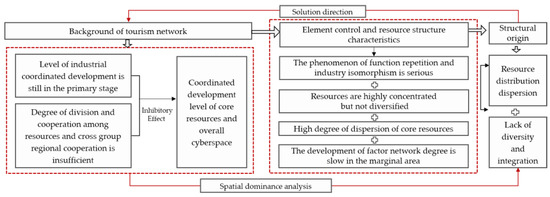
Figure 12.
Analysis of development characteristics and spatial control structure thread.
4.3. Structural Optimization Direction
Network evaluation is key to providing guidance for the optimization of a rural tourism network structure, and its results can be applied to other regions. It mainly includes the structure development direction, network structure equalization, and stability. For Ning’an, improvement must begin with a change in the resource-gathering mode, including adding new core clusters and optimizing marginal areas.
(1) Enhancing network structure balance
Spatial restructuring should adjust imbalances in the overall tourism resource system. The spatial pattern can be balanced by optimizing the structural pattern of tourism resources and guiding diffusion elements (Figure 13). This is used to drive the attraction of secondary resources and promote a balance in the entire tourism resource system. Additionally, the comprehensive benefits are improved, including improvements to the residential living environment, landscape quality, and types of entertainment activities.
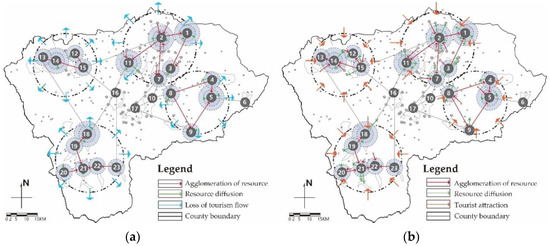
Figure 13.
Transformation of the network structure and organization mode: (a) overall dispersion with a partial concentration and (b) overall concentration with a partial dispersion.
(2) Improvement to network stability
To improve stability, it is important to strengthen the connection in the network resources and increase the number of network loops. The balance of allocation requires a reduction in the low valley area during reconstruction. As a “dumbbell” spatial structure yields instability, especially in areas outside the “four groups,” we must focus on the loop between the secondary resources and the promotion of the tourism service value in the branch ends (Figure 14), which is an effective technique for breaking through the existing network structure.
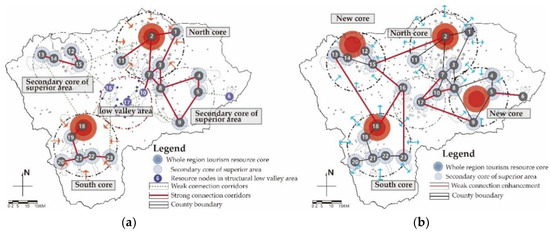
Figure 14.
Transformation of the network structure multipole core equilibrium structure: (a) existing spatial structure and (b) multi-core structure transformation.
5. Conclusions
We introduced the resource spatial dominance relationship method to evaluate tourism spatial network patterns, as this approach facilitates resource characteristic analysis and structure evaluation, thus promoting empirical network optimization. Through quantitative analysis and directed network calculation, the tourism resource nodes and corridors were abstracted. The scope of the resource control ability characterized the relationship between the tourism resources. Ning’an was selected as an example for classifying tourism resource elements classification and network evaluation. For the study area, we identified a network connection problem with the tourism resource elements and determined the direction of the structure optimization.
We demonstrated that analysis of the resource control ability can not only quantify the connection between tourism resources but also present the flow direction in the network. Therefore, this method allows for a more in-depth quantitative analysis of the spatial characteristics and development trends of a rural tourism networks in terms of the connection mode of key tourism resources, definition of the network structure through spatial layout, and analysis of the resource link ability. The study findings provide a reference for evaluating and constructing tourism network spaces. Consequently, regional tourism resources in various international rural areas can be reorganized, enhancing the vitality of rural tourism.
The reorganization of tourism resources in rural areas worldwide can also promote regional economy. Many rural areas are experiencing rapid urbanization, which has yielded economic growth but has also caused spatial structure imbalances. This study provides an effective way to accelerate the integration of regional tourism resources by providing the calculation method of resource reorganization, and promotion method of tourism resource balance. Using the study findings as a reference, we can effectively explore the tourism network valleys and provide optimization suggestions for marginal network areas with a low resource utilization rate.
Author Contributions
Conceptualization, X.J. and H.Z. (Hongyu Zhao); methodology, X.J.; software, X.J. and X.S.; validation, X.J., X.S., and H.Z. (Haoran Zhang); formal analysis, X.J.; investigation, X.J. and X.S.; resources, X.J.; data curation, X.J.; writing—original draft preparation, X.J.; writing—review and editing, X.J., X.S., and H.Z. (Hongyu Zhao); visualization, X.J.; supervision, X.J. and H.Z. (Haoran Zhang); project administration, X.J. and H.Z. (Haoran Zhang). All authors have read and agreed to the published version of the manuscript.
Funding
This study was funded by the National Social Science Fund of China project “Research on the Excavation and Protection of the Ecological Wisdom and Cultural Heritage in Traditional Villages of Northern China” (grant number 16BH130).
Institutional Review Board Statement
Not applicable.
Informed Consent Statement
Not applicable.
Data Availability Statement
Not applicable.
Conflicts of Interest
The authors declare no conflict of interest.
References
- Kidd, R.A. Rural Planning. R. Sanit. Inst. J. 1950, 70, 631–638. [Google Scholar] [CrossRef] [PubMed]
- Putu, D.R.; Karine, D.; Ying, W. Rural tourism: A systematic literature review on definitions and challenges. J. Hosp. Tour. Manag. 2021, 47, 134–149. [Google Scholar] [CrossRef]
- Bramwell, B. Rural tourism and sustainable rural tourism. J. Sustain. Tour. 1994, 2, 1–6. [Google Scholar] [CrossRef]
- Strijker, D.; Bosworth, G.; Bouter, G. Research methods in rural studies: Qualitative, quantitative and mixed methods. J. Rural. Stud. 2020, 78, 262–270. [Google Scholar] [CrossRef]
- Sharpley, R.; Jepson, D. Rural tourism: A spiritual experience? Ann. Tour. Res. 2011, 38, 52–71. [Google Scholar] [CrossRef]
- Prabhakaran, S.; Nair, V.; Ramachandran, S. Community participation in rural tourism: Towards a conceptual framework. Procedia Soc. Behav. 2014, 144, 290–295. [Google Scholar] [CrossRef]
- Chin, C.-H.; Lo, M.-C.; Songan, P.; Nair, V. Rural tourism destination competitiveness: A study on Annah Rais Longhouse Homestay, Sarawak. Procedia Soc. Behav. Sci. 2014, 144, 35–44. [Google Scholar] [CrossRef]
- Miguéns, J.I.L.; Mendes, J.F.F. Travel and tourism: Into a complex network. Phys. A 2008, 387, 2963–2971. [Google Scholar] [CrossRef]
- Martínez, J.M.G.; Martín, J.M.M.; Fernández, J.A.S.; Mogorrón-Guerrero, H. An analysis of the stability of rural tourism as a desired condition for sustainable tourism. J. Bus. Res. 2019, 100, 165. [Google Scholar] [CrossRef]
- Balezentis, T.; Krisciukaitiene, I.; Balezentis, A.; Garland, R. Rural tourism development in Lithuania (2003–2010): A quantitative analysis. Tour. Manag. Perspect. 2012, 2, 1–6. [Google Scholar] [CrossRef]
- Tao, H.; Huang, Z.H.; Ran, F.X. Rural tourism spatial reconstruction model from the perspective of ATV: A case study of Mufu Township, Hubei Province, China. Sustainability 2018, 10, 2675. [Google Scholar] [CrossRef]
- Dimitrovski, D.D.; Todorović, A.T.; Valjarević, A.D. Rural tourism and regional development: Case study of development of rural tourism in the region of Gruža, Serbia. Procedia Environ. Sci. Eng. Manag. 2012, 14, 288–297. [Google Scholar] [CrossRef]
- Zhou, B. Research on Aviation Tourism Spatial Structure in Sichuan and Its Optimization. Geogr. Geo-Inf. Sci. 2008, 24, 100–104. [Google Scholar] [CrossRef]
- Ionela, G.P.; Constantin, B.M.; Dogaru, L.-D. Advantages and limits for tourism development in rural area: Case study Ampoi and Mureş Valleys. Prod. Econ. Financ. 2015, 32, 1050–1059. [Google Scholar] [CrossRef]
- Ghaderi, Z.; Henderson, J.C. Sustainable rural tourism in Iran: A perspective from Hawraman Village. Tour. Manag. Perspect. 2012, 2, 47–54. [Google Scholar] [CrossRef]
- Smith, S.L.J. Geography of tourism and resort development: Charles A. Stansfield Jr. National Council for geographic education. Ann. Tour. Res. 1996, 23, 239–240. [Google Scholar] [CrossRef]
- Innskeep, E. Environmental Planning for Tourism. Ann. Tour. Res. 1987, 14, 118–135. [Google Scholar] [CrossRef]
- Carte, L.; McWatters, M.; Daley, E.; Torres, R. Experiencing agricultural failure: Internal migration, tourism and local perceptions of regional change in the Yucatan. Geoforum 2010, 41, 700–710. [Google Scholar] [CrossRef]
- Fundeanu, D.F. Innovative regional cluster model of tourism development. Prod. Econ. Financ. 2015, 23, 744–749. [Google Scholar] [CrossRef]
- Streifeneder, T. Agriculture first: Assessing European policies and scientific typologies to define authentic agritourism and differentiate it from countryside tourism. Tour. Manag. Perspect. 2016, 20, 251–264. [Google Scholar] [CrossRef]
- Cucari, N.; Wankowicz, E.; Esposito De Falco, S. Rural tourism and Albergo Diffuso: A case study for sustainable land-use planning. Land Use Policy 2019, 82, 105–119. [Google Scholar] [CrossRef]
- Yang, D.; Yang, X. Research on the optimization in agro-tourism spatial structure based on the fractal theory —the case of Guangxi National Agro-tourism Demonstration Sites. Tour. Forum 2013. [Google Scholar] [CrossRef]
- Shi, H.Y. Network characteristics of drive tourism destination: An application of network analysis in tourism. Tour. Manag. 2006, 27, 1029–1039. [Google Scholar] [CrossRef]
- Wang, Z.; Liu, Q.; Xu, J.; Fujiki, Y. Evolution characteristics of the spatial network structure of tourism efficiency in China: A province-level analysis. J. Dest. Mark. Manag. 2020, 18, 100509. [Google Scholar] [CrossRef]
- Nguyen, T.Q.T.; Young, T.; Johnson, P.; Wearing, S. Conceptualising networks in sustainable tourism development. Tour. Manag. Perspect. 2019, 32, 100575. [Google Scholar] [CrossRef]
- Liu, H.Y.; Wei, L.L.; Zhang, J. The research on the characteristics of network structure of area tourist flows based on the tourism routine. Hum. Geogr. 2012, 15, A484. [Google Scholar] [CrossRef][Green Version]
- Gunn, C.A. Tourism Planning: Basis Concepts Cases, 3rd ed.; Taylor & Francis: Washington, DC, USA, 1993; pp. 48–59. [Google Scholar]
- Lee, S.-H.; Choi, J.-Y.; Yoo, S.-H.; Oh, Y.-G. Evaluating spatial centrality for integrated tourism management in rural areas using GIS and network analysis. Tour. Manag. 2013, 34, 14–24. [Google Scholar] [CrossRef]
- Hong-Bo, F.U.; Chen, H.; Wang, Y.P. Based on the Suzhou city tourism travel network flow space network structure research. J. Qufu Norm. Univ. (Nat. Sci.) 2018, 44, 95–101. [Google Scholar]
- Shi, J.Z. An analysis of the regional urban tourism network structure based on Shandong province. J. Ocean Univ. China (Soc. Sci.) 2015, 1, 87–92. [Google Scholar]
- Zha, J.; Qian, X.; Zhao, Q.; Shu, H. Estimation and decomposition of total factors productivity of China’s tourism. Resour. Sci. 2018, 40, 2461–2474. [Google Scholar]
- Inskeep, E. Tourism planning: An emerging specialization. J. Am. Plan. Assoc. 1988, 54, 360–372. [Google Scholar] [CrossRef]
- Young, R.K.; Chang, K.P. The analysis of spatial network structure and characteristics of regional tourism. Int. J. Tour. Res. 2012, 26, 285–300. [Google Scholar]
- Kádár, B.; Gede, M. Tourism flows in large-scale destination systems. Ann. Tour. Res. 2021, 87, 103113. [Google Scholar] [CrossRef]
- Tosun, C.; Jenkins, C.L. The evolution of tourism planning in third world countries: A critique. Prog. Tour. Hosp. Res. 1998, 4, 101–114. [Google Scholar] [CrossRef]
- Ragin, C.C. The Comparative Method: Moving Beyond Qualitative and Quantitative Strategies; Univsity of California Press: California, CA, USA, 2014; pp. 18–40. [Google Scholar]
- Benckendorff, P.; Zehrer, A. A network analysis of tourism research. Ann. Tour. Res. 2013, 43, 121–149. [Google Scholar] [CrossRef]
- Chen, H.; Lu, L.; Zheng, S. The spatial network structure of the tourism destinations in urban agglomerations based on tourist flow: A case study of the Pearl River Delta. Acta Geogr. Sin. 2011, 66, 257–266. [Google Scholar] [CrossRef]
- Wang, B.; Gao, L.; Gao, Y. Control range: A controllability-based index for node significance in directed networks. J. Stat. Mech. Theory Exp. 2012, 4, 04011. [Google Scholar] [CrossRef]
- Barabási, A.L.; Albert, R. Emergence of scaling in random networks. Science 1999, 286, 509–512. [Google Scholar] [CrossRef] [PubMed]
- Shen, H.-W.; Cheng, X.-Q.; Guo, J.-F. Exploring the structural regularities in networks. Phys. Rev. E 2011, 84, 05611. [Google Scholar] [CrossRef] [PubMed]
- Zhang, J. Evaluating regional low-carbon tourism strategies using the fuzzy Delphi—Analytic network process approach. J. Clean. Prod. 2017, 141, 409–419. [Google Scholar] [CrossRef]
- Hashemi, N.; Ghaffary, G. A proposed sustainable rural development index (SRDI): Lessons from Hajij Village, Iran. Tour. Manag. 2017, 59, 130–138. [Google Scholar] [CrossRef]
- Blancas, F.J.; Lozano-Oyola, M.; González, M.; Guerrero, F.M.; Caballero, R. How to use sustainability indicators for tourism planning: The case of rural tourism in Andalusia (Spain). Sci. Total Environ. 2011, 412–413, 28–45. [Google Scholar] [CrossRef] [PubMed]
- Agnoletti, M. Rural landscape, nature conservation and culture: Some notes on research trends and management approaches from a (southern) European perspective. Landsc. Urban Plan. 2014, 126, 66–73. [Google Scholar] [CrossRef]
- Lun, L.-M.; Pechlaner, H.; Volgger, M. Rural tourism development in mountain regions: Identifying success factors, challenges and potentials. J. Qual. Assur. Hosp. Tour. 2016, 17, 389–411. [Google Scholar] [CrossRef]
- Erkus-Öztürk, H. The role of cluster types and firm size in designing the level of network relations: The experience of the Antalya tourism region. Tour. Manag. 2009, 30, 589–597. [Google Scholar] [CrossRef]
- Park, D.-B.; Yoon, Y.-S. Developing sustainable rural tourism evaluation indicators. Int. J. Tour. Res. 2011, 13, 401–415. [Google Scholar] [CrossRef]
Publisher’s Note: MDPI stays neutral with regard to jurisdictional claims in published maps and institutional affiliations. |
© 2021 by the authors. Licensee MDPI, Basel, Switzerland. This article is an open access article distributed under the terms and conditions of the Creative Commons Attribution (CC BY) license (https://creativecommons.org/licenses/by/4.0/).