Article

Developing an Ecosystem Services-Based Approach for Land Use Planning

1
School of Design & China Institute for Urban Governance, Shanghai Jiao Tong University, Shanghai 200240, China
2
State Key Laboratory of Urban and Regional Ecology, Research Center for Eco-Environment Sciences, Chinese Academy of Sciences, Beijing 100085, China
*
Author to whom correspondence should be addressed.
Land 2021, 10(4), 419; https://doi.org/10.3390/land10040419
Submission received: 18 March 2021 / Revised: 3 April 2021 / Accepted: 13 April 2021 / Published: 15 April 2021

Abstract

:
Rapid urbanization has altered many ecosystems, causing the decline in many ecosystem services (ES), and generating serious ecological crisis. The Yangtze River Delta (YRD) region is one of the most rapidly urbanized regions in China and has experienced a remarkable period of population growth, and built-up area expansion. To cope with these challenges, this paper proposed a four-step key ES zone delineation framework by land-use matrix for land management in a rapidly urbanizing region. This framework was applied in key ES zone delineation in the YRD region. The results showed that there was obvious spatial heterogeneity in the distribution of total ES capacities: The high-capacity levels were mainly distributed in the south of the region, while the low-capacity levels were densely distributed in the middle and north of the region. V (80–100) and II (20–40) accounted for 27.44% and 47.12% of the total area, respectively. Among the five levels, Level II occupied the largest area of the region. I (0–20) and IV (60–80) had patchy patterns in the region and clustered in the middle of the region. I and IV accounted for 13.24% and 5.48% of the total area, respectively. III (40–60) had belt distribution in the region and accounted for 6.72% of the total area. This paper not only contributes to the guidance of land management for the Ecological Redline Policy in the YRD Region but also helps to improve the application of ecosystem service approach in decision support in rapidly urbanizing regions.

1. Introduction

As one of the developing countries with rapid urbanization, China has experienced an immense population growth and built-up area expansion as the consequence of economic and political reforms in 1978 [1] over the past 40 years. In 2011, the urban population finally exceeded the rural population [2]. It is expected that by 2030, the urbanization level in China will reach 60% [2]. The ever-increasing number and scale of cities, and the emerging shift in the original landscape at different scales resulted in changes in the local biogeochemical cycles, leaving enormous challenges in mitigating biodiversity loss and maintaining ecosystem function and human well-being [3,4,5,6,7,8].
Facing the challenges, the State Council of the People’s Republic of China put forward the national-level Ecological Red Line Policy in 2011 [9]. The main objectives of this policy are to protect key ecosystem services (ES) zones, to deliver ecosystem services such as water storage, clean drinking water, and carbon sequestration, and to maintain ecological safety to support economic and social development, which is an important policy orientation of ES approach.
The Yangtze River Delta (YRD) Region is one of the most rapidly urbanized regions in China and has experienced a remarkable period of population growth (at an annual growth rate of 3.0%), and urbanization (at an annual growth rate of 9.2%) [3,10]. Rapid urbanization has dramatically changed land use/land cover patterns and ecosystems in the region, causing widespread ecological and environmental problems such as water shortages and decline in water quality, and serious air pollution (Zhang and Chen, 2011; Wang et al., 2012). These environmental problems have posed great threats to the regional ecological safety, adding new challenges to sustainable development in the region. At present, the provinces and cities in the YRD Region are carrying out provincial and prefecture-level environmental governance practice individually. However, decision makers realized that ecological conservation and environmental pollution had distinct cross-administrative boundary characteristics. It is of urgent need to integrate the environmental planning and management in this region. Due to the serious environmental and managerial problems in the YRD Region, it is necessary to identify an approach which could connect natural and socio-economic system, and also promote quick decision making in an urbanizing region.
ES are defined as conditions and processes that maintain the development of natural ecosystems and their constituent species, which enable human survival [11,12,13,14,15,16,17]. They sustain the biodiversity and the production of various ecosystem products, such as food, vegetation, wood, bio-fuels, natural fibers and many pharmaceutical and industrial products and other raw materials for production [11,12,13,14,15,16,17]. ES have the potential to become a major tool for environmental policy and decision making [18,19,20,21]. There is a growing concern in the study of ES approach for decision support in environmental management [22,23,24,25,26]. Several methodologies and frameworks using ES to support environmental management and decision making have been discussed [27,28,29,30]. The ultimate goal of ES approach is to aid decision making, providing a quantitative and visual expression of the comprehensive characteristics of ES in the study area and a detailed description of temporal and spatial changes, including static and dynamic display forms, for decision-makers, stakeholders, beneficiaries and other relevant parties involved in the decision-making process [31,32,33,34,35,36].
As an important form of human activity, land use has a strong impact on ES [37,38,39,40,41,42]. Changes of land-use type affect the main ecological processes such as energy exchange, water cycle, soil erosion and accumulation, biogeochemical cycle and so on, thus changing the provision of ES. Different land use patterns will produce corresponding ecological processes, which will have an impact on ES [37,38,39,40,41,42]. For example, Su Xiao [4] pointed out that the landscape fragmentation caused by the expansion of artificial land type in the process of urbanization would have a negative impact on ES. ES supply capacity of the natural ecosystem with less human interference is relatively weak, but its capacities of regulating and supporting services are relatively strong. In the cases with moderate human interference, the ecosystem service supply capacity is often relatively strong, while the regulating and supporting services capacities are relatively weak; when human interference is particularly strong, land degradation occurs, and the supply of various types of ES will be seriously threatened [42,43,44,45]. Therefore, several studies are devoted to the improvement of regional ES from the perspective of land-use optimization [37,44,46,47,48,49,50,51]. However, these researches failed to provide a complete and systematic framework for ES importance zone delineation as decision-support tool of land use planning.
To improve ecosystem security and secure ES, China has proposed a new ‘ecological redline policy’ using ES as a way to meet its targets [43,52]. To carry out this policy, it is fundamental and necessary to reveal the spatial pattern of different ES importance levels and delineation key zone for critical ES. Thereupon, the aims of this study are (1) to present a comprehensive framework to classify the importance levels of integrated ES supply capacities for key ES zone delineation in a rapid urbanizing region, (2) to apply the framework to the YRD region’s land use management.

2. Materials and Methods

This study presents a framework (Figure 1) for ES importance zone delineation as decision-support tool of land use planning in rapid urbanizing regions globally and to support China’s ecological redline delineation at regional scale:

2.1. Classification of Land Cover Types

The assessment system of land planning should be improved, and the application of ecosystem value assessment should be strengthened in related planning [41,50,53,54]. Regional land planning and control is an important measure of land use, but there is still a lack of attention given to the value of ecosystem services in current land use-planning, especially in urban land-use planning [41,50,53,54]. The protection of important ecosystems, such as green land and water, is often neglected due to too much attention being given to the economic benefits [41,50,53,54].
For convenience of application in environmental management and decision making practice, Burkhard’s services matrix combined land use and land cover information in assessment of the state of ecosystems and their capacities to supply ES by using the ES Classification Framework in Millennium Ecosystem Assessment [34].

2.2. Selection and Scoring Critical ES

Through the socio-ecological context analysis by academic reports and government documents review, and the objectives of management and priority conservation of critical ecosystems and their services in a region can be defined. Expert knowledge could also apply in combining land cover/use with the three ES and proved to be useful in compiling the most relevant data for the assessment of ES [46]. Before application expert knowledge in matrixes, local experts consulting, research reports studying and preliminary assessment corrections should be done. Local experts consulting: local experts from government bodies and universities were consulted instead of surveying the entire region [34,35,55]. Preliminary assessment corrections: after consulting local ecological and geographic experts, corrections about preliminary spatial assessment were made.

2.3. Classification of Importance of ES

According to the requirement of “Importance Classification Area of Key ES” delineation in the “Technical Guide of Ecological Redline Delineation”, the “Importance Classification Area” should be divided into four levels: very high, high, medium, and low based on different ES values. Given the conceptual relationship model of ecosystem function, ES, and ecosystem benefits, the ES classification separated the Biodiversity Conservation Zone with Important Ecosystem Service Zones, and made it an independent zone. Current important ES zones delineation did not separate biodiversity with ES, which would lead to double accounting. The flow chart was showed in Figure 1.
For specific ecosystem service conservation, the hotspot of one specific service is defined as the ecosystem type with the potential capacity “5”, which is the highest ecosystem service potential capacity (Table 1). For the hotspot identification of regulating, provisioning, culture, and total services, the hotspots are selected based on the following steps: The overlap method by ArcGIS was used in order to find the areas with the richest ESs.
Then we calculated the overlapping integrated capacities of the regulating, provisioning, and cultural services by rounding them to the nearest integer and classifying them into different importance.
According to the requirement of the important ES zone, we defined the level with score “0–1” as “very low” importance meaning that these areas do not have richness of ES potentials. Similarly, the level with score “1–2” as “low” importance indicates that these areas have low richness of ES potentials, the level with score “2–3” as “medium” importance representing medium richness of ES potentials, the level with score “3–4” as “high” importance meaning high richness of ES potentials, and the level with score “4–5” indicating high richness of ES potentials.

2.4. Delineation of Key ES Zones

According to the targeted region’s natural and socioeconomic characters, regionalization of critical ES should follow these principles:
Merge similar ES areas: merging areas with similar ES hotspots according to these area’s main services.
Dominant ecosystem types: the regional dominant types of a region not only determine the resources and environment of the region but also influence human development and conservation.
From the ecological conservation and regulation view: specific ecological and environmental problems, the severity of the ecological crisis in targeted region, etc. should be considered. This regionalization is expected to be a basis for ecological protection and control.

3. Case Study

3.1. Study Area

The YRD Region, located in the eastern coastal region of China (Figure 2), is the largest estuarine delta alluvial plain of the subtropical monsoon climate zone, which has warm, humid weather and abundant rainfall. As one of the most densely populated and rapidly urbanized areas in China, the YRD region consists of three basic administrative units including the Shanghai Municipality, Jiangsu Province, and Zhejiang Province.
The YRD Region has an area of 208,140 km2, approximately 2% of the whole country’s territory [3]. It is located in a strategic position, that plays a key role in regional urbanization and economic development in China [1,3,8,56]. The estuary of the Yangtze River, which is called the “Gold Coast” or “Golden Waterway (for shipping),” is located in this region [56,57,58] (Table 1).
It is both an ecologically fragile and economically developing zone. This study used further classification of arable land and forest to identify ecosystem function hotpot areas for more accurate decision support. There is large spatial heterogeneity in landforms in this region: the plain areas are mainly distributed in the Jiangsu Province and Shanghai municipality, while the hilly and mountainous areas are mostly located in the Zhejiang Province.
By the national arrangements, the provinces and cities in the YRD region are embarking on the delineation of ecological red lines and ecological functional zones. For example, Jiangsu Province has completed the delineation of provincial ecological red lines, while Nanjing has completed the work at the municipal scale.
Due to different understandings and definitions of ecological red lines, the delineation results may vary even though the delineated zones are in the same province. Moreover, Zhejiang Province has completed functional ecological zoning. For two identical zones, there can be two division versions. Now that the results are not even unified within a province, there may be greater differences when more provinces are involved and convergence can be more difficult. Therefore, it is imperative to have unified zoning at the regional scale.

3.2. Classification of Land Cover Types

Land use/cover raster data (30 m resolution) of the YRD Region was provided by the Chinese Academy of Sciences Geography Science And Resource Institute, Chinese Academy of Sciences, China (http://www.resdc.cn/DataList.aspx). The overall classification accuracy is 86.6% for 2015.
The land cover types of this case are mainly identified by local experts in the YRD region and combined with the CORINE land cover system [59,60]. The land cover types are: continuous urban fabric, discontinuous urban fabric, constructed sites, non-irrigated arable land, rice fields, forest, shrub, fruit trees, grassland, bareland, inland marshes, saltland marches, water courses and waterbodies.

3.3. Selection and Scoring Critical ES

Selection and scoring of critical ES were based on academic reports, document review and local expert interviews. For example, national environmental planning reports such as the Regional Plan for the YRD Region (2009–2020) [61], environmental reports related to natural disasters in the YRD region (Comprehensive Ecological Risk Prevention: Natural Disaster Factors and Risk Assessment in the Yangtze River Delta Region), watershed-level environmental reports), municipal environmental report related to natural resource endowments and environmental conditions (Annual Report on the Resources and Environment of Shanghai (2012)) [59].
Fourteen experts, five from government agencies (one from Shanghai, two from Jiangsu Province and two from Zhejiang Province), four from East China Normal University, one from Nanjing University, one from the Nanjing Institution of the Chinese Academy of Sciences, one from Jiangsu University and two from an environmental institution of Zhejiang Provincial government, were interviewed and asked to score each ES supply in the YRD Urban Agglomeration [59,60].
The procedure consisted of four steps: (1) the experts were given the explanation of the definition and classification of ES and provided with a supply and demand score table with the relevant explanation; (2) the experts adjusted the original score for each ES based on their own expertise with reference to the recommended indicators; (3) the median score for an ES was the final score; (4) the ES supply-demand budget matrix was established.

3.4. Classifification of Importance of ES

3.4.1. Total Capacities

In general, there is a significant spatial difference in the distribution of total ES capacities in the YRD region.
Level V was continuously and densely distributed in the south of the region and covered most areas of the Zhejiang Province. It also scattered in the middle and north of the region. Level II was densely distributed in the middle and north of the region, which covered most of the Jiangsu Province and Shanghai. Moreover, and patchily scattered in the Zhejiang Province (Figure 3).
Level V and Level II accounted for 27.44% and 47.12% of the total area, respectively. Among the five levels, Level II occupied the largest area of the region. Level I and Level IV had patchy patterns in the region and clustered in the middle of the region. Level I and IV accounted for 13.24% and 5.48% of the total area, respectively. Level III had belt distribution in the region and accounted for 6.72% of the total area (Table 2).

3.4.2. Regulating Services

Similar to the pattern of the total capacities, there is a distinct spatial difference in the distribution of regulating capacities in the YRD region (Figure 4).
Level V was continuously and densely distributed in the south of the region and covered most areas of the Zhejiang Province, while Level II was mainly distributed in the middle and north of the region, and covered most of the Jiangsu Province and Shanghai.
Level V and Level II accounted for 27.44% and 47.12% of the total area, respectively (Table 3). Level II occupied the largest area of the region in the five-levels of the region. Level I and Level III had patchy pattern in the region and clustered in the middle of the region. Level I and III accounted for 13.24% and 9.73% of the total area, respectively. Different from the pattern of the total capacities, the area with Level IV in the total capacities degraded to Level III in the regulating services. Level IV dispersed in the south of the region, which covered most areas of the Zhejiang Province and accounted for 2.48% of the total area.

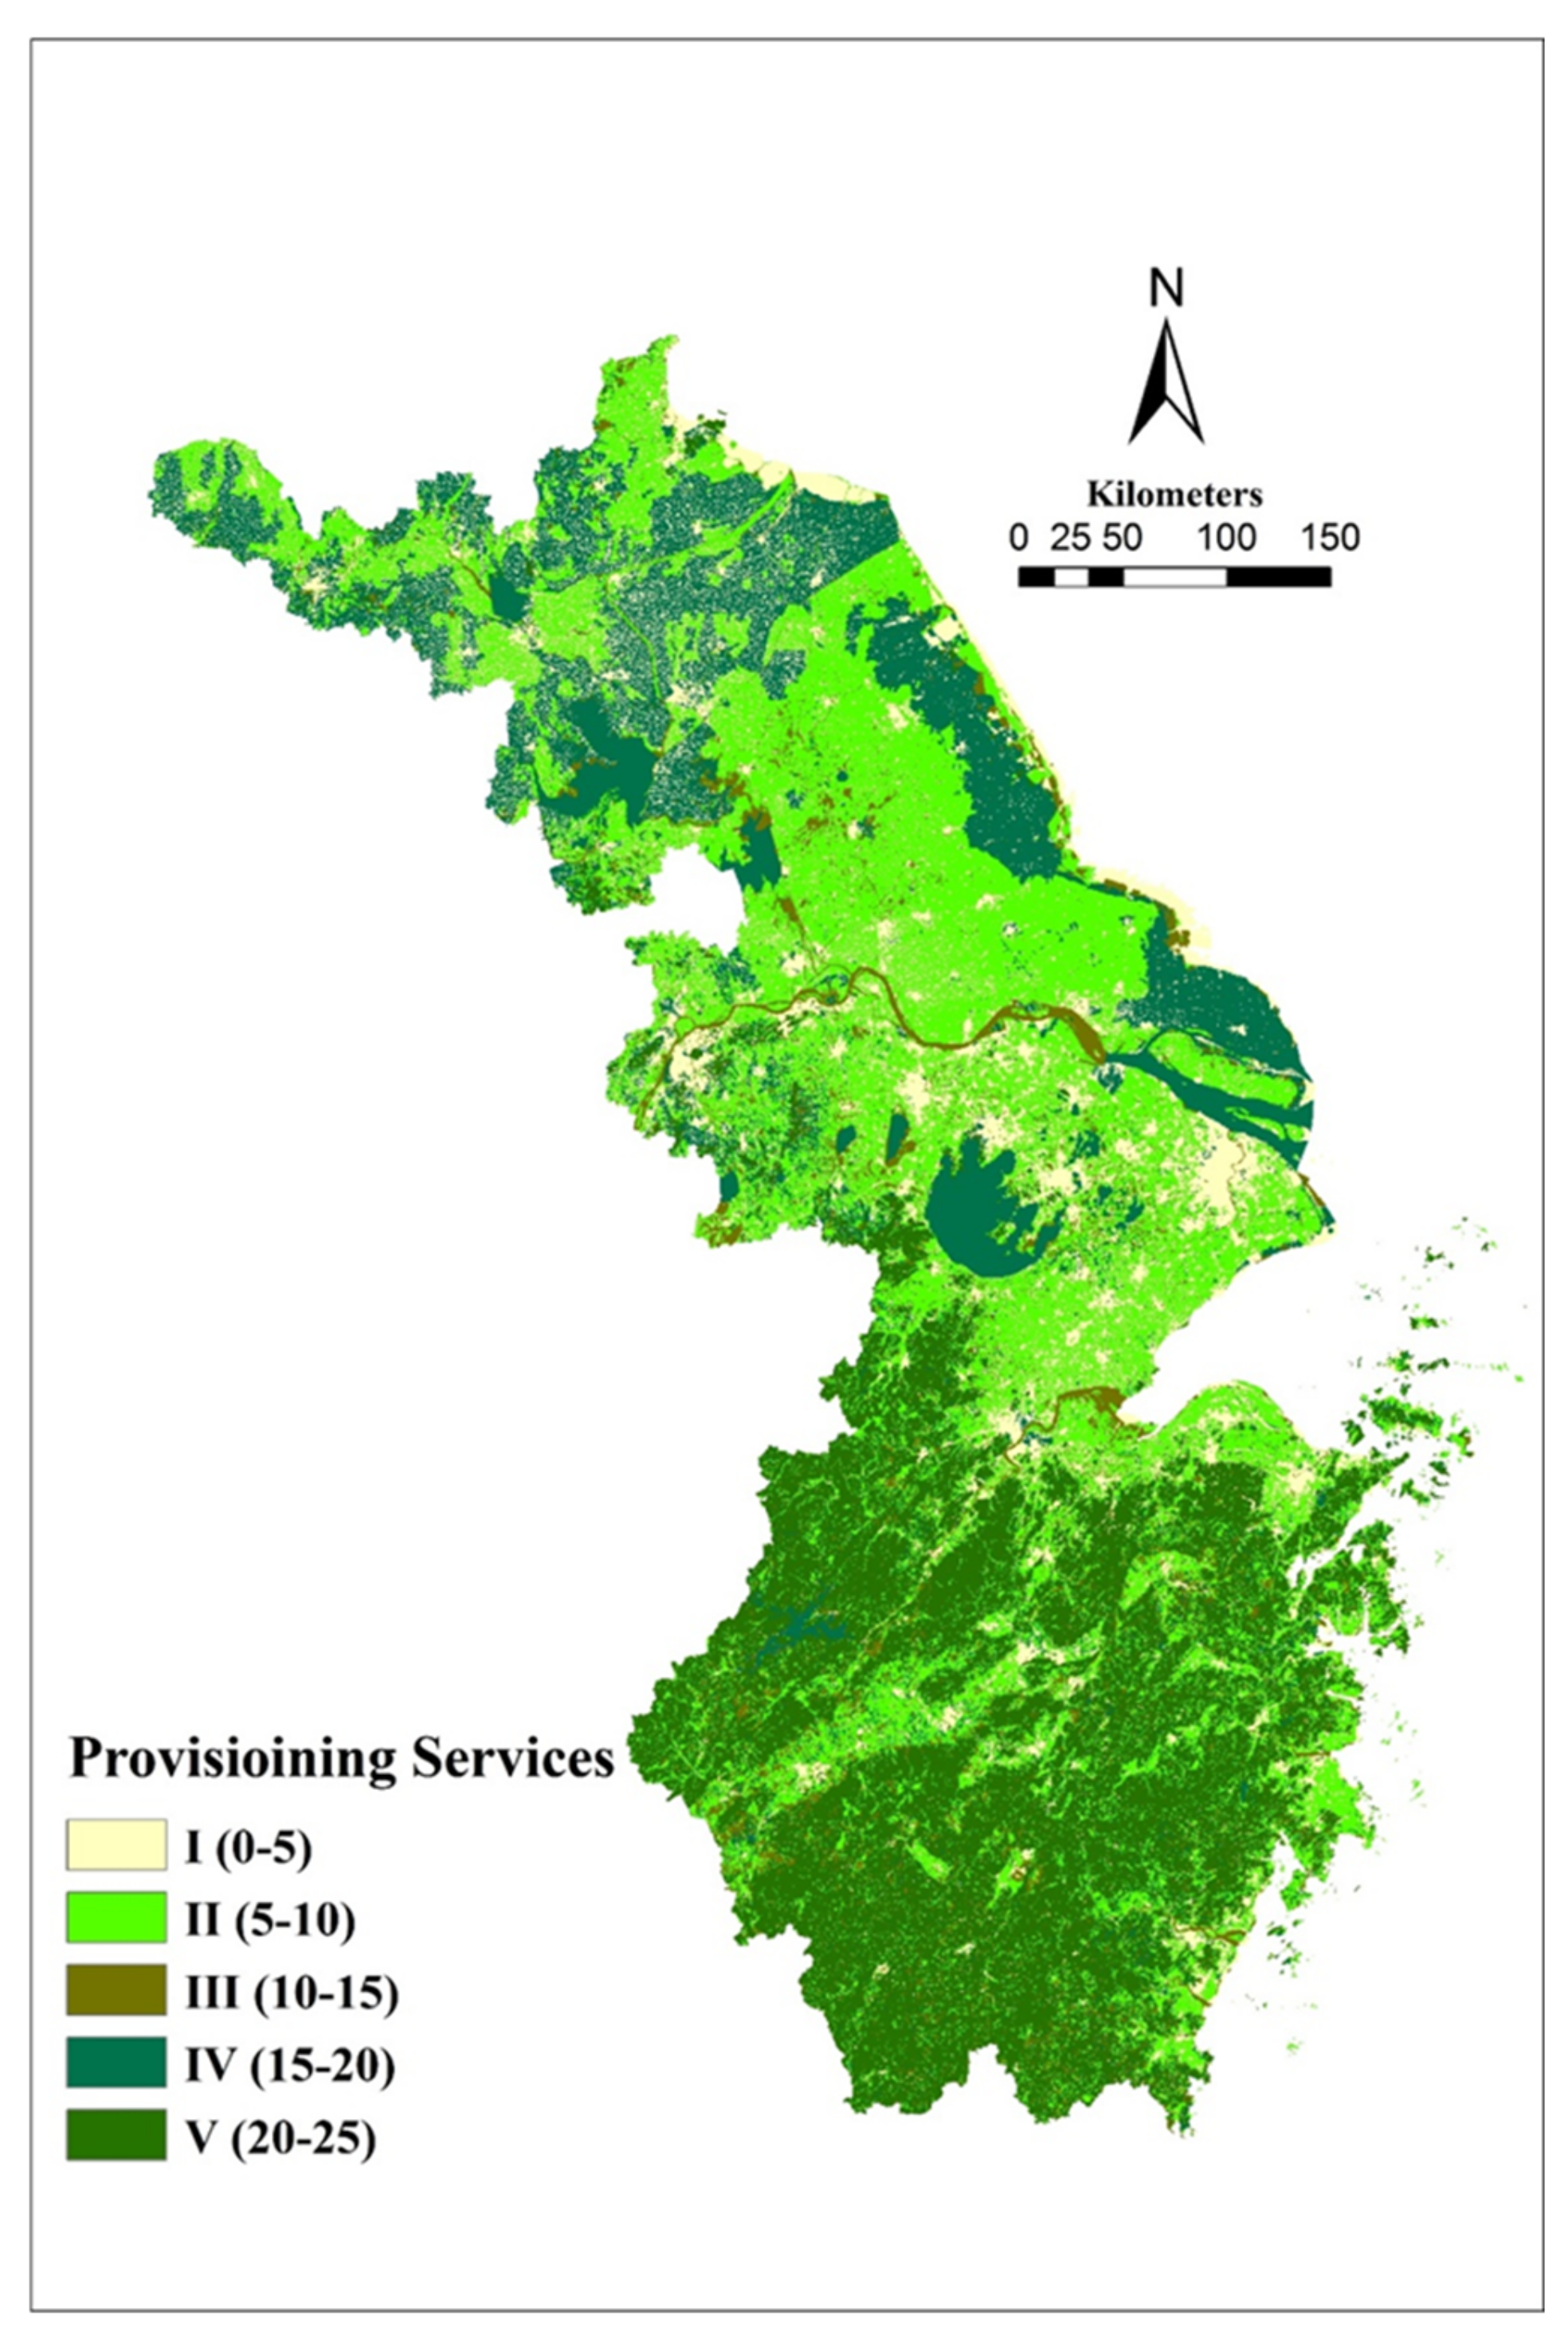
3.4.3. Provisioning Services

In general, the V, IV and III of provisioning services capacities were widely distributed in the YRD region.
Level V was continuously and densely distributed in the south of the region and covered most areas of the Zhejiang Province, while Level II was densely distributed in the middle of the region, and covered most of the middle of Jiangsu Province and Shanghai (Figure 5). Level V and Level II accounted for 27.44% and 35.36% of the total area, respectively. Level II occupied the largest area of the region in the five-levels of the region (Table 4).
Level I and Level III had patchy pattern in the region, and Level I distributed in the middle of the region. Level I and III accounted for 13.24% and 6.19% of the total area, respectively (Table 4). Level IV was densely distributed in the middle and north of the region and clustered in the north, east and south of Jiangsu Province, which accounted for 17.09% of the total area. Comparing with the pattern of total values, the area in the north and east coastal area were upgraded from Level II to Level IV in the provisioning services.

3.4.4. Cultural Services

Similarly, there is obvious spatial difference in the distribution of cultural capacities in the YRD region (Figure 6)
Level V was continuously and densely distributed in the south of the region and covered most areas of the Zhejiang Province, while Level II was densely distributed in the middle and north of the region, and covered most of the Jiangsu Province and Shanghai. Level V and Level II accounted for 27.44% and 57.64% of the total area, respectively. Level II occupied the largest area of the region in the five-levels of the region. Level I and Level III had patchy pattern in the region, and Level III relatively clustered in the middle and east coastal area of the region. Level I and III accounted by 2.01% and 6.74% of the total area, respectively (Table 5). Compared with the pattern of total values, the area with level I in the total values upgraded into Level III in the cultural services. Level IV had patchy pattern in the region and relatively clustered in the middle of the region, and accounted for 6.18% of the total area.

3.4.5. Comparison of Two Provinces and One Municipality

The spatial pattern of the “Two Provinces and one Municipality” had obvious spatial heterogeneity in the spatial pattern of total capacities and three main categories.
In Total Capacities, Zhejiang was mainly covered by “Highest” and “High” Level; Jiangsu was mainly covered by “Low” and “Lowest” Level. The “High” Level was densely distributed in the middle and west of the province. Shanghai was mainly covered by “Low” and “Lowest” Level.
In three main categories, Zhejiang was also covered by “Highest” and “High” Level; Jiangsu was divided by “High” level and “Low”/”Lowest” Level in the provisioning services. The “High” Level of the provisioning services was densely distributed in the middle and north of the province. Shanghai was mainly covered by “Low” and “Lowest” Level. The center of Shanghai was mainly covered by “Medium” level of cultural services.
The main determinants of the spatial pattern were the distribution of the main land cover and their capacities in different categories: Zhejiang was covered by closed and open forest. Lakes were mainly distributed in the west of the province. Jiangsu was mainly covered by two arable land types: rainfed cropland and paddy fields. Lakes, urban land and country residential land were densely distributed in the south of the province. Shanghai was mainly covered by urban land, country residential land and paddy fields.

3.5. Delineation of Key ES Zones

3.5.1. Total Capacities Level ‘V’

In the Level of Total Capacities “V”, Total Regulating Services Capacities, Total Provisioning Services Capacities and Total Cultural Services Capacities were all Level “V”. It had “Very High Importance” in conservation of multiple high ES supply capacities of the mountainous and hilly forest area.
The chosen of primary regulating ES was based on the conservation objectives of preventing main environmental problems in YRD Region. For instance, the air pollution problems such as Haze have also been one of the most serious environmental problems in recent years. Due to the development of manufacturing industry, the increase of exhaust gas from automobiles, the control of the air quality problems such as Haze was becoming hard in this region in the past few years [62]. For another, the flood problem has been a serious disaster in this region and occurred annually since the region involves rivers and lakes [59]. Therefore, in conjunction with local experts, “Water purification regulation”, “Nutrient regulation service”, “Erosion regulation service”, “Water flow regulation service”, “Global climate regulation service”, and “Air quality regulation service” were chosen as primary ES for regulating services. The closed forest had the highest supply capacities in these primary regulating ES. As local expert in Jiangsu Province said that “from the perspective of the effect of human pressure on the ecosystem of the YRD region, regulating services of the forest ecosystem should be paid more attention than other services”. Moreover, according to local experts in Zhejiang Province, “erosion risk existed in the low and high mountainous areas in the region, which required erosion regulation service from forest”.

3.5.2. Total Capacities Level ‘IV’

In the Level of Total Capacities “IV”, Total Provisioning Services Capacities, Total Cultural Services Capacities were Level “IV”, while Total Regulating Services Capacities were Level “III”. It had “High Importance” in conservation of multiple provisioning and cultural services of the waterbodies area.
Local experts suggested that the primary regulating services correlated with water purification and flooding (e.g., Water Purification Service, Water Flow Regulation Service) were also important to the “Recreation and Tourism Service” of waterbodies, since the water pollution problem would reduce the eco-tourism value of waterbodies. The degradation of water quality negatively affected the freshwater supply and recreation and tourism supply capacities. Environmental conservation and low-impact eco-tourism could be developed in these areas to meet the huge increasing demand of tourism and leisure activities of urban residents.
Not only the water supply for regional residents’ living relied on the rivers and lakes, but the huge demand of entertainment and leisure activities of regional residents also relied on the conservation of the waterbodies in this zone. The Core Area of this zone had two main sources of water supply for the whole region: the Qiandao Lake Watershed in the south of the region and the Taihu Lake Basin in the middle of the region.
For primary ES conservation, trans-boundary environmental cooperation mechanisms in upstream and downstream of streams should be launched in the watersheds. The establishment of payment criteria and identification of ecosystem service flow are core problems in cooperation in payment for primary ES. These needed to be done on the basis of a quantitative assessment for primary ES.

3.5.3. Total Capacities Level ‘III’

The level had “Medium Capacity” in the Total Capacities. The Yangtze River Estuary and the mainstreams of rivers s and s are dominant types in this level. Water pollution are the main ecological risks for ES conservation in this level. Therefore, water purification cooperation should also be done in the upstream watershed of the Yangtze River Estuary.

3.5.4. Total Capacities Level ‘II’

In the Level of Total Capacities ‘II’, Total Provisioning Services Capacities were Level ‘IV’, while other total capacities were relatively low. It had ‘High Importance’ in conservation of primary provisioning services.
Cropland loss and habitat fragmentation caused by urban expansion were serious in the areas of this level. For provisioning services, the local experts chose the “Crop Provisioning Service”, “Biomass of Energy”, “Fodder” and “Fiber”, as the primary ecosystem service of the dominant ecosystem (cropland ecosystem), especially the officers in Jiangsu Province. The “Highest Capacity” Score of “Crop Provisioning Service” was densely distributed in the middle and north of the plain and hilly areas of the region, which was consistent with the distribution of the cropland ecosystem. In addition, the distribution of rainfed croplands was consistent with the “High Capacity” Score of “Biomass of Energy”, “Fodder” and “Fiber”, which was also considered as primary provisioning ES.
The urban sprawling and developing residential areas occupied or destroyed many species habitats and largely decreased the services provided by ecosystems in this region. Therefore, the establishment of conservation priority areas following the “Prime Cropland” policy for restriction of urban expansion will be an arduous management task in this region.

4. Discussion

4.1. The Relationship between the Human Activies and the Pattern of Critical ESs

There is obvious spatial heterogeneity in the distribution of total ES capacities: The high-capacity levels were mainly distributed in the south of the region, while the low-capacity levels were densely distributed in the middle and north of the region. The main reasons of significant spatial heterogeneity are rapid urbanization and cultivation is in the YRD Region [63,64,65]. As the YRD region witnesses rapid economic development, the most directly visible impact from rapid urbanization, industrialization and population growth on ecosystem is the change in land utilization [1,8,10,56,66,67]. According to previous studies, the main reason for the reduced ecosystem service value in the north plain of the YRD region was the reduction of farmland and wetland areas, while between 2005 and 2010, the decline in ecosystem service value was due to the reduction in grassland (77.66%), wetland (71.04%), farmland (24.41%) and woodland (5.94%) areas [67,68]. The intensified urban expansion in the north plain caused by rapid economic development itself results in reduced woodland, grassland and farmland areas, and additionally in lower ecosystem service values. With the YRD region suffering from a sharply reduced farmland area, the remaining area experienced large agricultural investment, especially the usage of chemical fertilizers and pesticides, resulting in agricultural non-point source pollution [1,66,67,68].

4.2. Contributions and Limitations

The ES framework proposed in this study is to provide a basis for the formulation of relevant policies, expert knowledge-based assessment methods can not only achieve the above purposes, but also strengthen the relationship among ecologists, the general public and government officials taking part in the expert decision-making process, thus this method can play a certain role in the formulation and assessment of regional ecosystem policy.
Land use matrix approach based on expert knowledge has several advantages [69]: It can generate quick results for rapid decision making, provide an effective decision support tool in a data-poor region and design matrix linking spatial explicit land cover types to ecological integrity, ES supply and demand. However, this approach should be modified and adapted by the local classification system of land cover and land use system [69]. Although this approach included local environmental reading and preliminary score adjustment process, it could not completely avoid the uncertainty in expert scoring method. The method for scoring each ES mainly based on land use/cover and local expertise is relatively subjective and suitable for the data-poor region. To reduce the uncertainty of using local expert knowledge, some of the scientific process is going to be involved in the future ES assessment to improve scientific quality of the ES assessment matrix, i.e., confidence report, careful choice of the respondents, and use of consensus rounds [55,70]. In the next step of this studies, we will combine multiple data sources (if available) to validate our expert-knowledge framework and results which may not in the entire region but in local areas and make temporal ES assessment and simulation for scenarios analysis of land use planning.

5. Conclusions

Rapid urbanization has altered many ecosystems, causing declines in many ES, and generating serious ecological crisis. To cope with these challenges, this study has presented a comprehensive framework comprising four steps for key ES zone delineation for land management in a rapidly urbanizing region. The results showed that there is obvious spatial heterogeneity in the distribution of total ES capacities in the YRD region: The high-capacity levels were mainly distributed in the south of the region, while the low-capacity levels were densely distributed in the middle and north of the region. Level V was continuously and densely distributed in the south of the region. Level II was densely distributed in the middle and north of the region, and covered most of the Jiangsu Province and Shanghai. Level I and Level IV had patchy pattern in the region and relatively clustered in the middle of the region. The spatial pattern of the “Two Provinces and one Municipality” had obvious spatial heterogeneity in the spatial pattern of total capacities and three main categories: Zhejiang was mainly covered by “Highest” and “High” Level; Jiangsu was mainly covered by “Low” and “Lowest” Level. The “High” Level was densely distributed in the middle and west of the province. Shanghai was mainly covered by “Low” and “Lowest” Level. The main determinants of the spatial distribution of ES were the pressure of urbanization, landform and distribution of ecosystems and their capacities in different categories. This approach is contributed to regional-scale ES key zone delineation and priority areas identification for ecological redline policy in the YRD region.

Author Contributions

Conceptualization, W.C. and Y.C.; methodology, W.C.; software, W.J.; validation, W.C., Y.C. and W.J.; formal analysis, W.C.; investigation, W.C.; resources, Y.C.; writing—original draft preparation, Y.C.; writing—review and editing, W.J.; visualization, W.C.; supervision, Y.C.; project administration, Y.C.; funding acquisition, Y.C. All authors have read and agreed to the published version of the manuscript.

Funding

The research was funded by Big Data-Driven Ecological Security and Natural Resources Early Warning Plan, Key Projects of Philosophy and Social Science Research, Chinese Ministry of Education (Grant No. 19JZD023).

Institutional Review Board Statement

Not applicable.

Informed Consent Statement

Not applicable.

Data Availability Statement

Data available on request.

Conflicts of Interest

The authors declare no conflict of interest.

References

  1. Haas, J.; Ban, Y. Urban growth and environmental impacts in Jing-Jin-Ji, the Yangtze, River Delta and the Pearl River Delta. Int. J. Appl. Earth Obs. Geoinform. 2014, 30, 42–55. [Google Scholar] [CrossRef]
  2. UN, Department of Economic and Social Affairs, Population Division. World Urbanization Prospects: The 2011 Revision; UN: New York, NY, USA, 2012. [Google Scholar]
  3. Han, J.; Meng, X.; Zhou, X.; Yi, B.L.; Liu, M.; Xiang, W.N. A long-term analysis of urbanization process, landscape change, and carbon sources and sinks: A case study in China’s Yangtze River Delta region. J. Clean. Prod. 2017, 141, 1040–1050. [Google Scholar] [CrossRef]
  4. Su, S.; Xiao, R.; Jiang, Z.; Zhang, Y. Characterizing landscape pattern and ecosystem service value changes for urbanization impacts at an eco-regional scale. Appl. Geogr. 2012, 34, 295–305. [Google Scholar] [CrossRef]
  5. Zhou, Z.X.; Li, J.; Zhang, W. Coupled urbanization and agricultural ecosystem services in Guanzhong-Tianshui Economic Zone. Environ. Sci. Pollut. Res. 2016, 23, 15407–15417. [Google Scholar] [CrossRef]
  6. Su, S.; Li, D.; Hu, Y.; Xiao, R.; Zhang, Y. Spatially non-stationary response of ecosystem service value changes to urbanization in Shanghai, China. Ecol. Indic. 2014, 45, 332–339. [Google Scholar] [CrossRef]
  7. Qiu, B.; Li, H.; Zhou, M.; Zhang, L. Vulnerability of ecosystem services provisioning to urbanization: A case of China. Ecol. Indic. 2015, 57, 505–513. [Google Scholar] [CrossRef]
  8. Li, B.J.; Chen, D.X.; Wu, S.H.; Zhou, S.L.; Wang, T.; Chen, H. Spatio-Temporal Assessment of Urbanization Impacts on Ecosystem Services: Case Study of Nanjing City, China. Ecol. Indic. 2016, 71, 416–427. [Google Scholar] [CrossRef]
  9. Lü, Y.; Ma, Z.; Zhang, L.; Fu, B.; Gao, G. Redlines for the greening of China. Environ. Sci. Policy 2013, 33, 346–353. [Google Scholar] [CrossRef]
  10. Xu, X.; Tan, Y.; Chen, S.; Yang, G. Changing patterns and determinants of natural capital in the Yangtze River Delta of China 2000–2010. Sci. Total Environ. 2014, 466-467, 326–337. [Google Scholar] [CrossRef]
  11. La Notte, A.; D’Amato, D.; Mäkinen, H.; Paracchini, M.L.; Liquete, C.; Egoh, B.; Geneletti, D.; Crossman, N.D. Ecosystem services classification: A systems ecology perspective of the cascade framework. Ecol. Indic. 2017, 74, 392–402. [Google Scholar] [CrossRef] [PubMed]
  12. Costanza, R. Ecosystem services: Multiple classification systems are needed. Biol. Conserv. 2008, 141, 350–352. [Google Scholar] [CrossRef]
  13. Fisher, B.; Turner, R.K. Ecosystem services: Classification for valuation. Biol. Conserv. 2008, 141, 1167–1169. [Google Scholar] [CrossRef]
  14. Wallace, K.J. Classification of ecosystem services: Problems and solutions. Biol. Conserv. 2007, 139, 235–246. [Google Scholar] [CrossRef] [Green Version]
  15. MA Board. Millennium Ecosystem Assessment; Island Press: Washington, DC, USA, 2005; p. 13. [Google Scholar]
  16. Millennium Ecosystem Assessment (MEA). Strengthening Capacity to Manage Ecosystems Sustainably for Human Well-Being; World Resources Institute: Washington, DC, USA, 2003. [Google Scholar]
  17. Millennium Ecosystem Assessment (MEA). Ecosystems and Human Well-Being: Biodiversity Synthesis; World Resources Institute: Washington, DC, USA, 2005. [Google Scholar]
  18. Ouyang, Z.; Zheng, H.; Xiao, Y.; Polasky, S.; Liu, J.; Xu, W.; Wang, Q.; Zhang, L.; Rao, E.; Jiang, L.; et al. Improvements in ecosystem services from investments in natural capital. Science 2016, 352, 1455–1459. [Google Scholar] [CrossRef]
  19. Daily, G.C.; Polasky, S.; Goldstein, J.; Kareiva, P.M.; Mooney, H.A.; Pejchar, L.; Ricketts, T.H.; Salzman, J.; Shallenberger, R. Ecosystem services in decision making: Time to deliver. Front. Ecol. Environ. 2009, 7, 21–28. [Google Scholar] [CrossRef] [Green Version]
  20. Fisher, B.; Turner, R.K.; Morling, P. Defining and classifying ecosystem services for decision making. Ecol. Econ. 2009, 68, 643–653. [Google Scholar] [CrossRef] [Green Version]
  21. Turner, W.R.; Brandon, K.; Brooks, T.M.; Costanza, R.; Da Fonseca, G.A.B.; Portela, R. Global Conservation of Biodiversity and Ecosystem Services. Bioscience 2007, 57, 868–873. [Google Scholar] [CrossRef] [Green Version]
  22. Fu, N.; Li, X. Study on the Division Method of Ecological Red Line Area in Land Use Planning; Abstracts of Academic Papers of the 2007 Annual Meeting of the Chinese Geographical Society; Chinese Geographical Society: Beijing, China, 2007. (In Chinese) [Google Scholar]
  23. Rao, S.; Zhang, Q.; Mou, X. Delineating ecological red line and innovating ecosystem management. Environ. Econ. 2012, 6, 57–60. (In Chinese) [Google Scholar]
  24. Zheng, H.; Ouyang, Z. Practice and Thinking of Ecological Red Line. Bull. Chin. Acad. Sci. 2014, 29, 457–461. (In Chinese) [Google Scholar]
  25. Li, S.; Ma, C.; Wang, Y. The Geography of Ecosystem Services; Sciencep: Beijing, China, 2014. [Google Scholar]
  26. People’s Republic of China Ministry of Environmental Protection (MEP). Technical Guide for Ecological Red Line. No. 2015.5.; Chinese Ministry of Environmental Protection: Beijing, China, 2015. [Google Scholar]
  27. Burkhard, B.; Müller, F. Driver–Pressure–State–Impact–Response. In Encyclopedia of Ecology; Jørgensen, S.E., Fath, B.D., Eds.; Academic Press: Oxford, UK, 2008; pp. 967–970. [Google Scholar]
  28. De Groot, R.; Alkemade, R.; Braat, L.; Hein, L.; Willemen, L. Challenges in integrating the concept of ecosystem services and values in landscape planning, management and decision making. Ecol. Complex. 2010, 7, 260–272. [Google Scholar] [CrossRef]
  29. Kroll, F.; Muller, F.; Hasse, D.; Fohrer, N. Rural–urban gradient analysis of ecosystem services supply and demand dynamics 2012. Land Use Policy 2012, 29, 521–535. [Google Scholar] [CrossRef]
  30. Crossman, N.D.; Burkhard, B.; Nedkov, S.; Willemen, L.; Petz, K.; Palomo, I.; Drakou, E.G.; Martín-Lopez, B.; McPhearson, T.; Boyanova, K.; et al. A blueprint for mapping and modelling ecosystem services. Ecosyst. Serv. 2013, 4, 4–14. [Google Scholar] [CrossRef]
  31. Martínez-Harms, M.J.; Balvanera, P. Methods for mapping ecosystem service supply: A review. Int. J. Biodivers. Sci. Ecosyst. Serv. Manag. 2012, 8, 17–25. [Google Scholar] [CrossRef]
  32. Nedkov, S.; Burkhard, B. Flood regulating ecosystem services—Mapping supply and demand, in the Etropole municipality, Bulgaria. Ecol. Indic. 2012, 21, 67–79. [Google Scholar] [CrossRef]
  33. Palomo, I.; Bagstad, K.J.; Nedkov, S.; Klug, H.; Adamescu, M.; Cazacu, C. Tools for mapping ecosystem services. In Mapping Ecosystem Services; Pensoft Publishers: Sofia, Bulgaria, 2017. [Google Scholar]
  34. Burkhard, B.; Kroll, F.; Nedkov, S.; Müller, F. Mapping ecosystem service supply, demand and budgets. Ecol. Indic. 2012, 21, 17–29. [Google Scholar] [CrossRef]
  35. Burkhard, B.; Kandziora, M.; Hou, Y.; Müller, F. Ecosystem service potentials, flows and demands-concepts for spatial localisation, indication and quantification. Landsc. Online 2014, 34, 1–32. [Google Scholar] [CrossRef]
  36. Willemen, L.; Burkhard, B.; Crossman, N.; Drakou, E.G.; Palomo, I. Editorial: Best practices for mapping ecosystem services. Ecosyst. Serv. 2015, 13, 1–5. [Google Scholar] [CrossRef]
  37. Gong, J.; Li, J.; Yang, J.; Li, S.; Tang, W. Land Use and Land Cover Change in the Qinghai Lake Region of the Tibetan Plateau and Its Impact on Ecosystem Services. Int. J. Environ. Res. Public. Health 2017, 14, 818. [Google Scholar] [CrossRef]
  38. Keller, A.A.; Fournier, E.; Fox, J. Minimizing impacts of land use change on ecosystem services using multi-criteria heuristic analysis. J. Environ. Manag. 2015, 156, 23–30. [Google Scholar] [CrossRef] [Green Version]
  39. Metzger, M.; Rounsevell, M.; Acosta-Michlik, L.; Leemans, R.; Schröter, D. The vulnerability of ecosystem services to land use change. Agric. Ecosyst. Environ. 2006, 114, 69–85. [Google Scholar] [CrossRef]
  40. Grafius, D.R.; Corstanje, R.; Warren, P.H.; Evans, K.L.; Hancock, S.; Harris, J.A. The impact of land use/land cover scale on modelling urban ecosystem services. Landsc. Ecol. 2016, 31, 1509–1522. [Google Scholar] [CrossRef] [Green Version]
  41. Cai, Y.-B.; Li, H.-M.; Ye, X.-Y.; Zhang, H. Analyzing Three-Decadal Patterns of Land Use/Land Cover Change and Regional Ecosystem Services at the Landscape Level: Case Study of Two Coastal Metropolitan Regions, Eastern China. Sustainability 2016, 8, 773. [Google Scholar] [CrossRef] [Green Version]
  42. Gaglio, M.; Aschonitis, V.G.; Gissi, E.; Castaldelli, G.; Fano, E.A. Land use change effects on ecosystem services of river deltas andcoastal wetlands: Case study in Volano–Mesola–Goro in Po river delta (Italy). Wetl. Ecol. Manag. 2017, 25, 67–86. [Google Scholar] [CrossRef]
  43. Bai, Y.; Wong, C.P.; Jiang, B.; Hughes, A.C.; Wang, M.; Wang, Q. Developing China’s Ecological Redline Policy using ecosystem services assessments for land use planning. Nat. Commun. 2018, 9, 1–13. [Google Scholar] [CrossRef] [Green Version]
  44. Nordborg, M.; Sasu-Boakye, Y.; Cederberg, C.; Berndes, G. Challenges in developing regionalized characterization factors in land use impact assessment: Impacts on ecosystem services in case studies of animal protein production in Sweden. Int. J. Life Cycle Assess. 2017, 22, 328–345. [Google Scholar] [CrossRef] [Green Version]
  45. Tolvanen, A.; Aronson, J. Ecological restoration, ecosystem services, and land use: A European perspective. Ecol. Soc. 2016, 21. [Google Scholar] [CrossRef] [Green Version]
  46. Kopperoinen, L.; Itkonen, P.; Niemelä, J. Using expert knowledge in combining green infrastructure and ecosystem services in land use planning: An insight into a new place-based methodology. Landsc. Ecol. 2014, 29, 1361–1375. [Google Scholar] [CrossRef]
  47. Fürst, C.; Opdam, P.; Inostroza, L.; Luque, S. Evaluating the role of ecosystem services in participatory land use planning: Proposing a balanced score card. Landsc. Ecol. 2014, 29, 1435–1446. [Google Scholar] [CrossRef]
  48. Van Noordwijk, M.; Tanika, L.; Lusiana, B. Flood risk reduction and flow buffering as ecosystem services–Part 2: Land use and rainfall intensity effects in Southeast Asia. Hydrol. Earth Syst. Sci. 2017, 21, 2341–2360. [Google Scholar] [CrossRef] [Green Version]
  49. Li, Q.; Zhang, X.; Liu, Q.; Liu, Y.; Ding, Y.; Zhang, Q. Impact of Land Use Intensity on Ecosystem Services: An Example from the Agro-Pastoral Ecotone of Central Inner Mongolia. Sustainability 2017, 9, 1030. [Google Scholar] [CrossRef] [Green Version]
  50. Wu, K.-Y.; Ye, X.-Y.; Qi, Z.-F.; Zhang, H. Impacts of land use/land cover change and socioeconomic development on regional ecosystem services: The case of fast-growing Hangzhou metropolitan area, China. Cities 2013, 31, 276–284. [Google Scholar] [CrossRef]
  51. Nin, M.; Soutullo, A.; Rodríguez-Gallego, L.; Di Minin, E. Ecosystem services-based land planning for environmental impact avoidance. Ecosyst. Serv. 2016, 17, 172–184. [Google Scholar] [CrossRef]
  52. Jiang, B.; Bai, Y.; Wong, C.P.; Xu, X.; Alatalo, J.M. China’s ecological civilization program–Implementing ecological redline policy. Land Use Policy 2019, 81, 111–114. [Google Scholar] [CrossRef]
  53. Xu, C.; Pu, L.; Zhu, M.; Li, J.; Chen, X.; Wang, X.; Xie, X. Ecological Security and Ecosystem Services in Response to Land Use Change in the Coastal Area of Jiangsu, China. Sustainability 2016, 8, 816. [Google Scholar] [CrossRef] [Green Version]
  54. Long, H.; Liu, Y.; Hou, X.; Li, T.; Li, Y. Effects of land use transitions due to rapid urbanization on ecosystem services: Implications for urban planning in the new developing area of China. Habitat Int. 2014, 44, 536–544. [Google Scholar] [CrossRef]
  55. Jacobs, S.; Burkhard, B.; Van Daele, T.; Staes, J.; Schneiders, A. ‘The Matrix Reloaded’: A review of expert knowledge use for mapping ecosystem services. Ecol. Model. 2015, 295, 21–30. [Google Scholar] [CrossRef]
  56. Tian, G.; Jiang, J.; Yang, Z.; Zhang, Y. The urban growth, size distribution and spatio-temporal dynamic pattern of the Yangtze River Delta megalopolitan region. China. Ecol. Model. 2011, 222, 865–878. [Google Scholar] [CrossRef]
  57. Wei, S.; Liu, X.; Cheng, M. Global Manufacturing Center into Global Innovation Center: The Case of the Yangtze River Delta, in Transition of the Yangtze River Delta. In Transition of the Yangtze River Delta; Springer: Tokyo, Japan, 2015; pp. 49–73. [Google Scholar]
  58. Zhang, Y. Yangtze River Delta’s system integration: Institutional barriers and countermeasures. IDE Discuss. Paper. 2010, 264, 1–20. [Google Scholar]
  59. Cai, W.; Wu, T.; Jiang, W.; Peng, W.; Cai, Y. Integrating Ecosystem Services Supply–Demand and Spatial Relationships for Intercity Cooperation: A Case Study of the Yangtze River Delta. Sustainability 2020, 12, 4131. [Google Scholar] [CrossRef]
  60. Cai, W.; Gibbs, D.; Zhang, L.; Ferrier, G.; Cai, Y. Identifying hotspots and management of critical ecosystem services in rapidly urbanizing Yangtze River Delta Region, China. J. Environ. Manag. 2017, 191, 258–267. [Google Scholar] [CrossRef]
  61. Regional Plan for the Yangtze River Delta Region (RPYRDR). China’s State Council and the National Development and Reform Commission (NDRC). 2009–2020. Available online: https://wenku.baidu.com/view/4ae7c62c2af90242a895e5ee.html (accessed on 1 December 2020).
  62. Wang, T.; Jiang, F.; Deng, J.; Shen, Y.; Fu, Q.; Wang, Q.; Fu, Y.; Xu, J.; Zhang, D. Urban air quality and regional haze weather forecast for Yangtze River Delta region. Atmos. Environ. 2012, 58, 70–83. [Google Scholar] [CrossRef]
  63. Qiao, X.; Gu, Y.; Zou, C.; Xu, D.; Wang, L.; Ye, X.; Yang, Y.; Huang, X. Temporal variation and spatial scale dependency of the trade-offs and synergies among multiple ecosystem services in the Taihu Lake Basin of China. Sci. Total Environ. 2019, 651, 218–229. [Google Scholar] [CrossRef] [PubMed]
  64. Bao, J.; Gao, S.; Ge, J. Dynamic land use and its policy in response to environmental and social-economic changes in China: A case study of the Jiangsu coast (1750–2015). Land Use Policy 2019, 82, 169–180. [Google Scholar] [CrossRef]
  65. Yu, W.; Zhou, W. Spatial pattern of urban change in two Chinese megaregions: Contrasting responses to national policy and economic mode. Sci. Total Environ. 2018, 634, 1362–1371. [Google Scholar] [CrossRef]
  66. Li, J.; Jiang, H.; Bai, Y.; Alatalo, J.M.; Li, X.; Jiang, H.; Liu, G.; Xu, J. Indicators for spatial–temporal comparisons of ecosystem service status between regions: A case study of the Taihu River Basin, China. Ecol. Indic. 2016, 60, 1008–1016. [Google Scholar] [CrossRef]
  67. Liu, G.; Zhang, L.; Zhang, Q. Spatial and temporal dynamics of land use and its influence on ecosystem service value in Yangtze River Delta. Acta Ecol. Sin. 2014, 34, 3311–3319, (In Chinese, English Abstract). [Google Scholar]
  68. Zhou, F.; Tang, Q.; Ren, W. Annual Report on Resources and Environment of Shanghai 2016. Social Sciences Academic Press: Beijing, China, 2016; pp. 1–64. [Google Scholar]
  69. Campagne, C.S.; Roche, P.; Müller, F.; Burkhard, B. Ten years of ecosystem services matrix: Review of a (r)evolution. One Ecosyst. 2020, 5, e51103. [Google Scholar] [CrossRef]
  70. Hou, Y.; Burkhard, B.; Müller, F. Uncertainties in landscape analysis and ecosystem service assessment. J. Environ. Manag. 2013, 127, S117–S131. [Google Scholar] [CrossRef]
Figure 1. Framework for key ecosystem services (ES) zone delineation.
Land 10 00419 g001
Figure 2. Location of the Yangtze River Delta Region.
Land 10 00419 g002
Figure 3. Spatial pattern and levels of total capacities of ES of Yangtze River Delta (YRD).
Land 10 00419 g003
Figure 4. Spatial pattern and levels of regulating services of YRD.
Land 10 00419 g004
Figure 5. Spatial pattern and levels of provisioning services of YRD.
Land 10 00419 g005
Figure 6. Spatial pattern and levels of cultural services of YRD.
Land 10 00419 g006
Table 1. Matrix illustrating capacities of different land cover classes to supply ES.
Regulating ServicesGlobal Climate RegulationLocal Climate RegulationAir Quality RegulationWater Flow RegulationWater PurificationNutrient RegulationErosion RegulationPollinationProvisioning ServicesCropsBiomanss of EnergyFodderLivestockWild FoodsTimberWood FuelCapture FisheriesBiochemicals and MedicineFreshwaterCulturral ServicesRecreation & Asthetic ValuesIntrinsic Value of Biodiversity
Continuous urban fabric 00000000 0000000000 00
Discontinuous urban fabric 10000000 2010100000 00
Construtcted sites 10000000 0000000000 00
Non-irrigated arable land 32010001 5255000010 10
Rice fields 33010001 5120000000 10
Forest 55535555 0110555050 55
Shrub 41020002 0110002000 22
Fruit trees 42221145 2100044000 50
Grassland 42025530 0023300000 33
Bareland 20000000 0000000000 40
Inland marshes 42040400 0052000000 00
Salt marshes 41020200 0002000000 30
Water courses 41043300 0300400305 55
Water bodies 42050100 0000400305 54
The values/colors indicate the following capacities: 0 = no relevant capacity; 1 = low relevant capacity; 2 = relevant capacity; 3 = medium relevant capacity; 4 = high relevant capacity; and 5 = very high relevant capacity (after [59,60]).
Table 2. Areas and proportions of different levels of total ES capacities.
Total CapacitiesArea (km2)%
I (0–20)28,458.6013.24
II (20–40)101,286.5047.12
III (40–60)14,440.986.72
IV (60–80)11,789.345.48
V (80–100)58,975.7827.44
Total214,951.19100.00
Table 3. Areas and proportions of different levels of total regulating services.
Total CapacitiesArea (km2)%
I (0–10)28,458.6013.24
II (10–20)101,286.5047.12
III (20–30)20,904.249.73
IV (30–40)5326.082.48
V (40–50)58,975.7827.44
Total214,951.19100.00
Table 4. Areas and proportions of different levels of provisioning services.
Total CapacitiesArea (km2)%
I (0–5)29,939.3013.93
II (5–10)76,002.5235.36
III (10–15)13,305.656.19
IV (15–20)36,727.9417.09
V (20–25)58,975.7827.44
Total214,951.19100.00
Table 5. Areas and proportions of different levels of cultural services.
Total CapacitiesArea (km2)%
I (0–5)4313.862.01
II (5–10)123,893.4157.64
III (10–15)14,481.646.74
IV (15–20)13,286.506.18
V (20–25)58,975.7827.44
Total214,951.19100.00
Publisher’s Note: MDPI stays neutral with regard to jurisdictional claims in published maps and institutional affiliations.

