Abstract
The objective of this study was to compare the results of calcimetric and dry combustion methods for quantitative estimation of soil total inorganic carbon (TIC). To this aim, 117 soil samples from three localities in the Mediterranean area (one in Spain and two in Southern Italy), representing a wide range of total inorganic carbon contents (ranging from 1.9 to 54 g 100 g−1), were collected. TIC (expressed as CaCO3) was quantified using the volumetric calcimeter method, as reference, and dry combustion in order to find an accurate and rapid method, suitable for different types of soils. The results revealed a concordance between the two methods compared, as shown by the recovery values close to one, for the whole data set and for data grouped per experimental site. Specifically, the dry combustion method showed slightly greater values of TIC compared to volumetric method, probably due to soil acid pretreatments, in dry combustion, and to an incomplete decomposition of carbonates that would require more time for removal, in a calcimeter method. Linear regression equations between the two methods were not affected by different soil types. Overall, our study demonstrated that the dry combustion was a reliable method and could provide accurate estimates of TIC in soils with different calcium carbonate content.
1. Introduction
Soil carbon storage, as the third largest carbon pool in the Earth System, plays an important role in the global carbon cycle and climate change [1]. In world soils, most of carbon (C) is present as organic C (OC) in the form of more or less complex and stable organic compounds originating from plant, animal, and microbial residues. The inorganic C (IC) portion is mainly present in soils of the arid and semiarid areas, and in the form of carbonates [2,3].
More than 95% of soil IC is calcium carbonate (CaCO3) solid, which can be classified as primary or lithogenic (mainly inherited from the parent material), or secondary/pedogenic inorganic carbon, newly developed as a result of dissolution and recrystallization of primary carbonates and other soil forming processes, such as ground water and Ca2+ upward movement and biological activities [4,5].
Carbonate influences both chemical and physical soil properties and hence fertility and productivity. It directly affects the soil pH and buffer capacity and promotes the formation of stable aggregates, influencing hydraulic soil properties [6] and erodibility [7]. In addition, recent studies highlighted that the soil total inorganic carbon (TIC) could contribute in sequestering C in the terrestrial ecosystems [8,9,10]. Monger et al. [8] suggested that the source of calcium (Ca) is the main factor in CO2 sequestration by soil inorganic carbon. Lee et al. [10] demonstrated that soil biota plays an important role in the generation of secondary carbonates, highlighting potentially rapid changes in soil total inorganic carbon.
The determination of total carbonate in soil is of great interest, due to the role in terrestrial ecosystem carbon cycling, especially in arid and semi-arid areas, and to useful information on soil status, in terms of structure, texture, biological activity, or nutrient content. Furthermore, the Mediterranean region is characterized by soils containing different types and concentrations of carbonates because limestone and other calcareous rocks are the parent materials of a large proportion of them. This, added to the xeric moisture regime present in most of the region and irrigation practices, often adopted and known to alter soil C dynamics, generates optimal conditions for dissolution, leaching and re-precipitation of carbonates [11]. For this reason, the quantification of inorganic carbon fractions requires rapid and precise analytical protocols for thorough soil analysis.
There are numerous methods to determine the carbonate content in soils, the most commonly used procedures involve dissolution of the solid phase carbonates by reaction with acid. The quantification is commonly achieved by measurement of evolved CO2 volumetrically, gravimetrically, manometrically, titrimetrically. Moreover, it may be achieved quantitatively by measurement of acid consumed during the neutralization reaction.
The acid neutralization procedure is probably the most commonly used, due to its simplicity which involves addition of excess acid and back titration with standard base. Another widely used method is quantitative volumetric procedure, in which volume of CO2 evolved is determined following the addition of excess HCl. The pressure-calcimeter in which increase in pressure is measured at constant temperature, and volume, following addition of excess acid, provides an alternative procedure for determination of soil carbonate. The calcimeter was considered a precise and inexpensive method even though the precision and accuracy of measurements depended on skill, temperature, uniformity, and method of adding the acid [12]. This technique is applicable in a straightforward manner to soils with low organic matter and containing no dolomite and no appreciable quantity of MnO [13].
The soil TIC quantification can be also achieved by dry combustion procedure with automated analyzers. This procedure allows both a direct measurement of IC in soils that are pre-combusted to remove organic matter in an O2 stream [14,15] and an indirect measurement. The methodology for direct measurement of inorganic carbon consists of a combustion at 950 °C of soil samples where organic matter has been previously removed by combustion in a muffle furnace (tests at 450 °C, 500 °C, and 550 °C for 12 h) [15]. By indirect measurement, soil total carbon (soil without pretreatment with acid to remove carbonate) and soil organic carbon (SOC) are separately quantified, then, by subtraction, the TIC content can be obtained. Although the automated approach is simple, requires a minimum of equipment, and would provide accurate estimates for TIC, it is not widely used.
Therefore, the aim of this study was to perform a comparative assessment of two key quantitative methods for TIC determination, the calcimeter (reference method) and dry combustion methods in order to identify the most accurate method, as well as most suitable to be used for soils typical of a Mediterranean environment. A large number of soil samples was thus collected under different pedologic and management conditions in Southern Italy and Spain, and analyzed to quantify soil TIC content using the two techniques.
2. Materials and Methods
2.1. Soil Sampling and Characterization
One hundred and seventeen soil samples were collected from three different sites within experimental fields: two were at Fasano and Sarno, respectively, in the Apulia and Campania regions (southern Italy), one in Murcia (Spain). Specifically, sixty-one samples were collected from a farm in Fasano (40°52′24″ N 17°24′35″ E, 0 m a.s.l.) and twenty soil samples were collected from a farm located in Sarno (40°48′22″ N 14°34′12″ E, 14 m a.s.l.). Thirty-six samples were collected from a 0.5 ha orchard, located in Campotéjar–Murcia (38°07′18″ N; 1°13′15″ W).
Soil samples were taken from each experimental plot using a bucket auger and collected from the 0 to 0.20 m layer for Fasano and Murcia, 0–0.30 m layer for Sarno. Sarno site is an agricultural area dedicated mainly to horticultural crop cultivation (tomato), with the soil being subject to frequent and intensive tillage. Fasano and Murcia areas are mostly cropped to tree crops (olive grove and mandarin crop, respectively).
The climate of experimental sites is “accentuated thermo-Mediterranean”, as classified by UNESCO FAO [16], characterized by rather mild and rainy winters and warm and dry summer months.
2.2. Laboratory Analyses
Soil characterization was performed by collecting from each site of soil samples taken with regular auger. The soils were oven dried at 65 °C, crushed, and sieved to pass a mesh of 2 mm, and then ground to a fine powder (0.5 mm) using an agate ball mill (Fritsch “pulverisette 6”). In Table 1, the main soil chemical properties are reported. In addition, all the soil samples were analyzed by the two different methods: (1) the gas volumetric method by the calcimeter, and (2) the dry combustion method.

Table 1.
Main soil chemical properties of the experimental sites: total inorganic carbon (TIC), total organic carbon (TOC), electrical conductivity (EC), pH, total nitrogen (N).
2.2.1. Calcimeter Method for TIC Estimation
Soil total inorganic C determination with a gas volumetric method was obtained by a Dietrich–Fruhling calcimeter, quantifying the CO2 evolved in a closed system after HCl treatment.
Briefly, about 0.5 g of soil reacted with 10 mL of HCl (50%) in a reaction vessel; the pressure generated by the CO2 evolved from the reaction of acid with carbonates was indirectly measured and translated into carbonate concentration. The time of reaction for every sample was almost of 15 min. The equation to obtain the concentration of inorganic C takes into account the weight of the soil sample, the atmospheric pressure, the ambient temperature, and the volume of CO2 developed from dissolution of carbonates by using a calibration curve generated with known quantities of analytical-grade calcium carbonate (CaCO3).
The calcimeter was chosen as the reference method because it is the most frequently used in laboratories performing agricultural analysis of soil fertility.
2.2.2. Dry Combustion Method for TIC Estimation
For the dry-combustion procedure a vario TOC select analyzer (Elementar, Hanau, Germany) was used. The vario TOC select conducts a catalytic combustion by high temperatures in air environment. The samples are burned in the combustion tube with a copper oxide as catalyst at a temperature of 950 °C. The CO2 oxidation product is detected by a non-dispersion infrared (NDIR) detector, which is set to respond to CO2 only, and therefore, only the content of carbon could be obtained. An aliquot of 50–100 mg of finely homogenized soil was weighted on a tin foil and directly analyzed to detect the total carbon content (TC).
Subsequently, on another soil sample aliquot, the total organic carbon content (TOC) was detected: about 100 mg of soil was weighted on a silver boat and pre-treated with HCl (10%) in order to remove inorganic carbon [17], then analyzed on vario TOC.
Total inorganic carbon (TIC) was calculated as the difference between TC and TOC according to the equation:
Results were expressed multiplying the calcium carbonate concentration by the mass proportion of C in calcium carbonate (0.12 g C g−1 CaCO3).
2.3. Statistical Analysis
Soil total inorganic carbon (TIC) data were preliminary analyzed in order to investigate the data distribution, both of the whole data set and of the data grouped per experimental site. To this aim, descriptive statistics were computed. TIC data were then tested for normality using the Kolmogorov-Smirnov test and for the homogeneity of variance using Levene’s test (F test).
The relationships between total inorganic carbon, quantified by the two methods, and the other main chemical properties were examined by Person correlation analysis.
The data obtained with the calcimeter method were considered as a reference and used to measure the efficiency of the dry combustion method. Then, the recovery (R) of TIC was obtained by the evaluated method (TICDC) compared with the calcimeter method (TICCM), according to the following Equation (3):
The linear regression was carried out with values of the calcimeter method (TICCM) as independent and those of the dry combustion method as dependent variables: equations were fitted to the data grouped per experimental site (Murcia, Fasano, Sarno) and to whole data. When the intercept was not significantly different from zero (H0: a = 0), equations passing through the origin were computed. Significance of the slopes of the regression lines was tested for the null hypothesis (H0) b = 0. Statistical comparison of regression coefficients among experimental sites was also performed using analysis of covariance and contrast analysis. The linear regression equations fitted were:
where a and b are the parameters of the equation; on the other hand, when intercept was not significant, a line through the origin was fitted (a = 0): TICDC = b × TICCM.
Goodness of fit was evaluated through coefficient of determination (R2) adjusted, root mean square error (RMSE) and residual prediction deviation (RPD), which was quantified as the ratio between the standard deviation of the observed TICDC values and the RMSE [18]. The RPD values > 2 were considered excellent, values between 1.4 and 2 were almost good, and values lower than 1.4 were considered unreliable [19,20].
Statistical analyses of experimental data were performed using SAS/STAT 9.2 software package [21]. Specifically, a test for equal slopes and comparison of regression coefficients were carried out using PROC GLM and CONTRAST statement.
3. Results
The soil texture of Fasano and Murcia was classified as loam and sandy clay loam, respectively (USDA classification). Sarno site developed over alluvial and volcanoclastic deposits and soil was typically deep. The texture ranged from sandy-loam to silty-loam [22].
Table 1 reports the average values of the main chemical soil properties of the three experimental sites. Murcia soil can be classified as a calcareous soil, due to high levels of calcium carbonate (CaCO3, 54 g 100 g−1), whereas the Sarno site was characterized by a low carbonate content (about 2 g 100 g−1) and Fasano showed intermediate values (17.5 g 100 g−1). Both Murcia and Fasano soils showed a similar average TOC content of about 19 g kg−1, whereas in Sarno samples, TOC content was slightly lower than the other two study sites (16.6 g kg−1). Murcia and Fasano soils were strongly alkaline with pH values ranging from 8.5 and 8.7, probably due to the higher calcium carbonate content. Finally, Fasano and Sarno sites presented a good total nitrogen content (1.31 and 1.20 g kg−1, respectively) with lower values of soil electrical conductivity (EC) (Table 1).
The correlation coefficients (r) among the soil TIC content quantified by the calcimeter (TICCM) and dry combustion (TICDC) methods and the TOC, total N, pH, and EC were in agreement (Table 2). There were significant negative correlations between TIC and TOC content, and between TIC and total N content in all studied sites. Moreover, in the three sites, TIC content was positively correlated with pH values; whereas, the relationship between TIC and EC value showed discordant results. In fact, a significant inverse correlation was found between TIC content and EC value in Murcia, a positive one in Sarno site, whereas for Fasano, the correlation resulted not significant (Table 2).
Table 2.
Person’s linear coefficients (r) among total inorganic carbon quantified by calcimeter method (TICCM) and dry combustion method (TICDC) and TOC content, pH, electrical conductivity (EC), and total nitrogen content (N).
Descriptive statistics for TIC, detected using the calcimeter (TICCM) and dry combustion (TICDC) methods, computed per experimental site, and on the whole dataset, are reported in Table 3. Average TIC content, quantified through calcimeter method, was 26 g 100 g−1, with mean values ranging from 1.86 g 100 g−1, in Sarno, to 53.85 g 100 g−1, in Murcia.
Table 3.
Descriptive statistics of soil inorganic carbon quantified through volumetric calcimeter (TICCM) and dry combustion (TICDC) methods per experimental site and on the whole data set (n = 117).
Overall, TIC values, obtained through calcimeter and dry combustion method, varied from 0.35 to 60.06 g 100 g−1, with a range of 59.71 g 100 g−1, and 0.45 to 61.75 g 100 g−1, with a range of 61.30 g 100 g−1, respectively (Figure 1). An ample range of variation was observed for Fasano samples (from 2.45 to 53.24 g 100 g−1, range of 50.79 g 100 g−1), as shown by the highest values of the coefficient of variation (CV, Table 3).
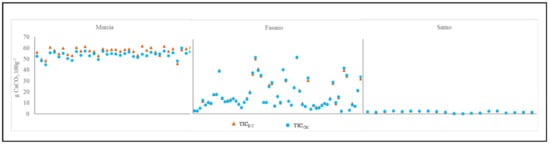
Figure 1.
Comparison of soil inorganic carbon content detected by dry combustion (TICDC) and calcimeter methods (TICCM), per experimental site. Data set consisted of 117 samples: 36 from Murcia, 61 from Fasano, and 20 from Sarno.
The data did not show a normal distribution, according to the Kolmogorov–Smirnov test, then a logarithmic transformation was carried out. Transformed TICCM and TICDC values per experimental site exhibited relatively normal distributions, as indicated by the probability levels of the Kolmogorov–Smirnov test (Table 3). On the same transformed data, the F test resulted not significant for all sites and for the whole dataset, proving the homogeneity of variance.
The average recovery (R) values, obtained for the whole data set and for three experimental sites, were found close to one. In particular, considering the whole data set (n = 117) and three experimental sites (Murcia, Fasano, and Sarno), the average R values were of 1.045 ± 0.0072 (se), 1.060 ± 0.0059, 1.036 ± 0.0094, and 1.043 ± 0.0297, respectively (Table 3).
The overall test for equal slopes indicated that the linear regression equations did not show significant differences, (P = 0.5019, Table 4). In addition, analyzing the behavior of the regression slopes by means of contrast analysis, no significant differences were observed among the experimental sites (Table 4). Consequently, the regression lines of three sites should be parallel among them. This behavior is showed in Figure 2, where linear regression equations fitted per experimental sites are reported.
Table 4.
Results of the overall test of equal slope and of the contrast analysis for regression coefficient comparison.

Figure 2.
Linear regression between soil total inorganic carbon quantified through calcimeter (TICCM) and dry combustion (TICDC) methods on the whole data set (n = 117). The fitted equation is TICDC = 0.99351 TICCM + 0.02531 (R2 = 0.9971).
The intercepts of regression equations between TIC content obtained by calcimeter and dry combustion methods, for the whole data set, Fasano and Sarno, were significantly different from zero (P < 0.05; Table 5), whereas, for Murcia, the intercept did not significantly differ from zero. Consequently, for Murcia, the best fit, to relate TICCM and TICDC, was a linear model passing through the origin with slope of 1.014 ± 0.0014 (Table 5).
Table 5.
Parameters of linear regression equations fitted to the data grouped per experimental site and to the whole data set.
Finally, the slopes of the regression lines (b) were significantly different from zero for the three experimental sites and for the whole data set (Table 5, Figure 3).
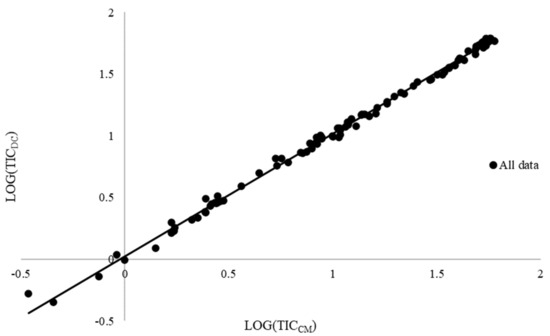
Figure 3.
Linear regression between soil total inorganic carbon quantified through calcimeter (TICCM) and dry combustion (TICDC) methods on the whole data set (n = 117). The fitted equation is TICDC = 0.99351 TICCM + 0.02531 (R2 = 0.9971).
4. Discussion
Carbonate is a key component of soils that can affect chemical and physical properties and consequently fertility. In the present study, Pearson’s coefficient showed significant negative correlation between soil total inorganic carbon (TIC) and total organic carbon (TOC) content. The relationship between soil TIC and TOC content is not very clear, in fact there are some studies addressing TIC–TOC relationship, which report inconsistent findings. Some previous researches are in agreement with our results, highlighting that the negative relationship between TIC and TOC could likely be due to differences in the oxidizing conditions induced in the soil by higher total carbonate contents [16,23,24,25,26,27]. Other studies, carried out in arid and semi-arid areas and in irrigated cropland, stated that TIC is positively correlated with TOC content [28,29]. Probably, higher levels of CaCO3 could be beneficial for TOC stabilization [30,31] because of enhanced formation of soil aggregates [32]. The discrepancies in the results observed in the TIC–TOC relationship can be attributed to many factors, including soil properties, climate conditions, and land management practices, which affect the processes of precipitation and dissolution of carbonate, soil organic matter mineralization, etc. [28,29,33]. In particular, Brombin et al. [33] observed that soil organic carbon content decreased with the age of the pear trees, while IC showed the opposite trend, probably due to the progressive formation of pedogenic carbonates and consumption of organic matter (and OC), induced by plant growth that extracts nutritive elements from soils. Moreover, the relationship between TIC and pH was significantly positive, in agreement with other researches that highlighted that high soil pH/salinity were correlated to high levels of TIC, probably owing to high levels of Ca2+/Mg2+ [34,35].
Since recent studies emphasized that soil inorganic carbon is dynamic and can contribute to CO2 emission, influencing the terrestrial carbon sequestration processes [8,9,36], the choice of analytical method for TIC determination requests particular attention.
Overall, the results of this study indicated that dry combustion method showed high concordance with the reference methodology and can be used to assess soil inorganic carbon content as an alternative to the calcimeter. TIC values quantified by dry combustion method were slightly higher than calcimeter values, as highlighted by the R values. These results could be probably due to the acid pre-treatment technique of soil prior to analysis that leads to a destruction of acid-soluble and/or volatile organic carbon [37]. Moreover, with the calcimeter method, an incomplete decomposition of acid-resistant carbonates (e.g., dolomite, magnetite, siderite), which request very long times for removal [38], the evolution of different gas volumes from different carbonates, or the presence of sulfides, which react to form H2S [39] could interfere with soil TIC quantification.
For the Murcia site, characterized by higher soil inorganic content (54 g 100 g−1), the dry combustion method showed more variability than calcimeter (Table 2), probably because acid pretreatments of soil samples can have possible effects on soil organic matter dissolution. In fact, Caria et al. [40] stated that hydrochloric acid in contact with soil can alter the thermal properties of organic materials and make them less volatile. In addition, when the acid comes into contact with the small quantity of soil sample with high inorganic C content contained in the tiny silver capsules, a vigorous reaction is generated that can cause overflow of material and, consequently, losses. This process could affect TOC and TIC determination. Moreover, the hygroscopic behavior of CaCl2 produced during acid pretreatments of soil samples made samples difficult to handle, so small losses of sample mass may occur during the wrapped phase with tin-foil before the transfer of the sample to the autosampler. This was also confirmed by the greater variability of TOC values (data not reported) in Murcia compared with other two sites.
The concordance between the two methods compared was also confirmed by the test for equal slopes that showed a similar fitting in the different sites investigated. Moreover, the slopes (b) of the regression lines were significantly different from zero for the three experimental sites and for the whole data set (Table 5), indicating the significant relationship between the variables under study. Wang et al. [3] employed an elemental analyzer and a calcimeter for TIC measurements on arid soils in order to examine the relationship between these methods. They observed that, although not significantly different, the calcimeter slightly underestimated the soil TIC content compared to the automated elemental technique, but they concluded that the two approaches could provide accurate measurements of soil inorganic carbon for the calcareous soils. Other researches carried out on soils with a wide range of calcium carbonate contents (0–60 g kg−1), comparing calcimeter with the dry combustion method, confirmed the strong correlation between these two analytical techniques [11,38]. In particular, Apesteguia et al. [11] found—on a set of 23 soil samples—that the slope of regression line between calcimeter (reference methodology) and elemental analysis data was not statistically different from 1, and the intercept was also not statistically different from 0. Moreover, regarding analytical methods to determine soil total inorganic carbon, dry combustion is automated and allows a short time of analysis, consequently, many replicates of the same sample can be performed, increasing the accuracy of the results [17]. Since a large number of samples are often needed to be analyzed, this method could replace the traditional one with the advantage to have relatively low cost and high labor efficiency.
5. Conclusions
There is clear evidence that soil inorganic carbon levels can accumulate or be lost at similar or even greater rates as total organic carbon and that the land use and management (irrigation practices, grazing management, etc.) could affect the inorganic carbon cycle in soils. Consequently, the quantification of soil total inorganic carbon is an important measure and requires accuracy and precision of laboratory analysis. By comparing of volumetric calcimeter method, which is considered the standard analytical method for soil inorganic carbon quantification, and dry combustion, it emerged that the latter method could provide an accurate estimate of total inorganic carbon in soils with a wide range of calcium carbonate contents (ranging from 1.9 to 54 g 100 g−1). In fact, our research showed a concordance between the results obtained by the two methods, as highlighted by R values close to 1 for the whole dataset (117) and for data grouped per experimental sites. In addition, analyzing the whole dataset, the best fitting of the relationship between TIC quantified through calcimeter, and dry combustion methods, was a linear regression with slope (b) significantly different to 0. Overall, the dry combustion method could be an effective alternative to the traditional method, since it allows a short time of analysis, furnishes more precise results that manually operated determination, and does not require the constant presence of operators. The validation of this method using a broader range of samples will further demonstrate its robustness for soils from the Mediterranean and other world regions.
Author Contributions
Conceptualization, R.L.; methodology, R.L. and A.M.S.; formal analysis, R.L.; investigation, F.P. and G.A.V.; data curation, R.L., C.V., and M.M.; writing—original draft preparation, R.L.; writing—review and editing, R.L., M.C., A.M.S., and C.V.; project administration, A.M.S. All authors have read and agreed to the published version of the manuscript.
Funding
This research received no external funding.
Institutional Review Board Statement
Not applicable.
Informed Consent Statement
Not applicable.
Data Availability Statement
The data presented in this study are available upon request from the corresponding author (R.L.).
Acknowledgments
The authors would like to thank the EU and MIUR for funding the present research in the frame of the collaborative international consortium DESERT financed under the ERA-NET Co-fund WaterWorks2014 Call. This ERA-NET is an integral part of the 2015 Joint Activities developed by the Water Challenges for a Changing World Joint Programme Initiative (Water JPI). This study was also supported by project “M2Q” PON03PE_00180_1, cofounded by the National Operational Program for Research and Competitiveness (PON R&C) 2007-2013, through the European Regional Development Fund (ERDF) and national resource (Revolving Fund-Cohesion Action Plan MIUR), D.M. MIUR n. 738/05.03.2014.
Conflicts of Interest
The authors declare no conflict of interest.
References
- Lal, R.; Kimble, J.M. Pedogenic carbonate and the global carbon cycle. In Global Climate Change and Pedogenic; Lal, R., Kimble, J.M., Eswaran, H., Stewart, B.A., Eds.; CRC Press: Boca Raton, FL, USA, 2000; pp. 1–14. [Google Scholar]
- Senesi, G.S.; Senesi, N. Laser-induced breakdown spectroscopy (LIBS) to measure quantitatively soil carbon with emphasis on soil organic carbon. A review. Anal. Chim. Acta 2016, 938, 7–17. [Google Scholar] [CrossRef]
- Wang, X.; Wang, J.; Zhang, J. Comparisons of Three Methods for Organic and Inorganic Carbon in Calcareous Soils of Northwestern China. PLoS ONE 2012, 7, e44334. [Google Scholar] [CrossRef]
- Bughio, M.A.; Wang, P.; Meng, F.; Qing, C.; Kuzyakov, Y.; Wang, X.; Junejo, S.A. Neoformation of pedogenic carbonates by irrigation and fertilization and their contribution to carbon sequestration in soil. Geoderma 2016, 262, 12–19. [Google Scholar] [CrossRef]
- Kuzyakov, Y.; Shevtzova, E.; Pustovoytov, K. Carbonate re-crystallization in soil revealed by 14C labeling: Experiment, model and significance for paleo-environmental reconstructions. Geoderma 2006, 131, 45–58. [Google Scholar] [CrossRef]
- Castellini, M.; Stellacci, A.M.; Tomaiuolo, M.; Barca, E. Spatial variability of soil physical and hydraulic properties in a durum wheat field: An assessment by the BEST-Procedure. Water 2019, 11, 1434. [Google Scholar] [CrossRef]
- Panagos, P.; Meusburger, K.; Ballabio, C.; Borrelli, P.; Alewell, C. Soil erodibility in Europe: A high-resolution dataset based on LUCAS. Sci. Total Environ. 2014, 479–480, 189–200. [Google Scholar] [CrossRef] [PubMed]
- Monger, H.C.; Kraimer, R.A.; Saeb, K.; Cole, D.R.; Wang, X.; Wang, J. Sequestration of inorganic carbon in soil and groundwater. Geology 2015, 43, 375–378. [Google Scholar] [CrossRef]
- Chang, R.; Fu, B.; Liu, G.; Wang, S.; Yao, X. The effects of afforestation on soil organic and inorganic carbon: A case study of the Loess Plateau of China. Catena 2012, 95, 145–152. [Google Scholar] [CrossRef]
- Lee, M.R.; Hodson, M.E.; Langworthy, G. Earthworms produce granules of intricately zoned calcite. Geology 2008, 36, 943–946. [Google Scholar] [CrossRef]
- Apesteguia, M.; Plante, A.F.; Virto, I. Methods assessment for organic and inorganic carbon quantification in calcareous soils of the Mediterranean region. Geoderma Reg. 2018, 12, 39–48. [Google Scholar] [CrossRef]
- Lamas, F.; Irigaray, C.; Oteo, C.; Chacòn, J. Selection of the most appropriate method to determine the carbonate content for engineering purposes with particular regard to marls. Eng. Geol. 2005, 81, 32–41. [Google Scholar] [CrossRef]
- Kassim, J.K. Method for estimation of calcium carbonate in soils from Iraq. Int. J. Environ. 2013, 1, 9–19. [Google Scholar] [CrossRef]
- Rabenhorst, M.C. Determination of organic and carbonate carbon in calcareous soils using dry combustion. Soil Sci. Soc. Am. J. 1988, 52, 965–969. [Google Scholar] [CrossRef]
- Natali, C.; Bianchinia, G.; Vittori Antisari, L. Thermal separation coupled with elemental and isotopic analysis: A method for soil carbon characterization. Catena 2018, 164, 150–157. [Google Scholar] [CrossRef]
- United Nations Educational, Scientific and Cultural Organization—Food and Agriculture Organization of the United Nations (UNESCO-FAO). Bioclimatic Map of the Mediterranean Zone; UNESCO: Paris, France; FAO: Rome, Italy, 1963; p. 60. [Google Scholar]
- Vitti, C.; Stellacci, A.M.; Leogrande, R.; Mastrangelo, M.; Cazzato, E.; Ventrella, D. Assessment of organic carbon in soils: A comparison between the Springer–Klee wet digestion and the dry combustion methods in Mediterranean soils (Southern Italy). Catena 2016, 137, 113–119. [Google Scholar] [CrossRef]
- Williams, P.C. Variables Affecting Near-infrared Reflectance Spectroscopic Analysis. In Near-infrared Technology in the Agricultural and Food Industries; Williams, P., Norris, K., Eds.; American Association of Cereal Chemists: St. Paul, MN, USA, 1987; pp. 143–166. [Google Scholar]
- Bellon-Maurel, V.; Fernandez-Ahumada, E.; Palagos, B.; Roger, J.M.; McBratney, A. Critical review of chemometric indicators commonly used for assessing the quality of the prediction of soil attributes by NIR spectroscopy. TrAC Trends Anal. Chem. 2010, 29, 1073–1081. [Google Scholar] [CrossRef]
- Chang, C.W.; Laird, D.A.; Mausbach, M.J.; Hurburgh, C.R. Near-infrared reflectance spectroscopy—Principal components regression analyses of soil properties. Soil Sci. Soc. Am. J. 2001, 65, 480–490. [Google Scholar] [CrossRef]
- Statistical Analysis System (SAS) Institute Inc. SAS/STAT Software Release 9.2; Statistical Analysis System (SAS) Institute Inc.: Cary, NC, USA, 2010. [Google Scholar]
- Castrignanò, A.; Buttafuoco, G.; Quarto, R.; Vitti, C.; Langella, G.; Terribile, F.; Venezia, A. A Combined Approach of Sensor Data Fusion and Multivariate Geostatistics for Delineation of Homogeneous Zones in an Agricultural Field. Sensors 2017, 17, 2794. [Google Scholar] [CrossRef] [PubMed]
- Zhao, W.; Zhang, R.; Huang, C.Q.; Wang, B.Q.; Cao, H.; Koopal, L.K.; Tan, W.F. Effect of different vegetation cover on the vertical distribution of soil organic and inorganic carbon in the Zhifanggou watershed on the loess plateau. Catena 2016, 139, 191–198. [Google Scholar] [CrossRef]
- Li, G.T.; Zhang, C.L.; Zhang, H.J. Soil inorganic carbon pool changed in long-term fertilization experiments in north China plain. In Proceedings of the World Congress of Soil Science, Soil Solutions for a Changing World, Brisbane, QLD, Australia, 1–6 August 2010; Volume 19, pp. 220–223. [Google Scholar]
- Shetye, S.S.; Sudhakar, M.; Mohan, R.; Tyagi, A. Implications of organic carbon, trace elemental and CaCO3 variations in a sediment core from the Arabian Sea. Indian J. Mar. Sci. 2009, 38, 432–438. [Google Scholar]
- Stellacci, A.M.; Armenise, E.; Caliandro, A.; Rubino, P. Relationships between soil characteristics and leaf nutrient concentrations in grapevine. Acta Horticult. 2010, 868, 135–141. [Google Scholar] [CrossRef]
- Pan, G.X.; Guo, T.; Lal, R.; Kimble, J.M.; Eswaran, H.; Stewart, B.A. Pedogenic carbonate of aridic soils in China and its significance in carbon sequestration in terrestrial systems. In Global Climate Change and Pedogenic Carbonates; Kimble, J.M., Eswaran, H., Stewart, B.A., Lal, R., Eds.; Lewis Publishers: Boca Raton, FL, USA, 2000. [Google Scholar]
- Shi, H.J.; Wang, X.J.; Zhao, Y.J.; Xu, M.G.; Li, D.W.; Guo, Y. Relationship between soil inorganic carbon and organic carbon in the wheat-maize cropland of the North China Plain. Plant Soil 2017, 418, 423–436. [Google Scholar] [CrossRef]
- Guo, Y.; Wang, X.J.; Li, X.L.; Wang, J.P.; Xu, M.G.; Li, D.W. Dynamics of soil organic and inorganic carbon in the cropland of upper Yellow River Delta, China. Sci. Rep. 2016, 6, 36105. [Google Scholar] [CrossRef]
- Tavakkoli, E.; Rengasamy, P.; Smith, E.; McDonald, G. The effect of cation–anion interactions on soil pH and solubility of organic carbon. Eur J. Soil Sci. 2015, 66, 1054–1062. [Google Scholar] [CrossRef]
- Virto, I.; Gartzia-Bengoetxea, N.; Fernández-Ugalde, O. Role of organic matter and carbonates in soil aggregation estimated using laser difractometry. Pedosphere 2011, 21, 566–572. [Google Scholar] [CrossRef]
- Rowley, M.C.; Grand, S.; Verrecchia, É.P. Calcium-mediated stabilisation of soil organic carbon. Biogeochemistry 2018, 137, 27–49. [Google Scholar] [CrossRef]
- Brombin, V.; Mistri, E.; De Feudis, M.; Forti, C.; Salani, G.M.; Natali, C.; Falsone, G.; Vittori Antisari, L.; Bianchini, G. Soil carbon investigation in three pedoclimatic and agronomic settings of northern Italy. Sustainability 2020, 12, 10539. [Google Scholar] [CrossRef]
- Oste, L.A.; Temminghof, E.J.; Riemsdijk, W.V. Solid-solution partitioning of organic matter in soils as influenced by an increase in pH or Ca concentration. Environ. Sci. Technol. 2002, 36, 208–214. [Google Scholar] [CrossRef]
- Wang, J.P.; Wang, X.J.; Zhang, J.; Zhao, C.Y. Soil organic and inorganic carbon and stable carbon isotopes in the Yanqi Basin of northwestern China. Eur. J. Soil Sci. 2015, 66, 95–103. [Google Scholar] [CrossRef]
- Yang, Y.; Fang, J.; Ji, C.; Ma, W.; Mohammat, A.; Wang, S.; Wang, S.; Datta, A.; Robinson, D.; Smith, P. Widespread decreases in topsoil inorganic carbon stocks across China’s grasslands during 1980s–2000s. Glob. Chang. Biol. 2012, 18, 3672–3680. [Google Scholar] [CrossRef]
- Nelson, D.W.; Sommers, L.E. Total carbon, organic carbon and organic matter. In Methods of Soil Analysis, Part 3, 3rd ed.; SSSA, Book Ser. 5; Sparks, D.L., Page, A.L., Helmke, P.A., Loeppert, R.H., Soltanpour, P.N., Tabatabai, M.A., Johnston, C.T., Sumner, M.E., Eds.; SSSA: Madison, WI, USA, 1996; pp. 961–1010. [Google Scholar]
- Vuong, T.X.; Heitkamp, F.; Jungkunst, H.F.; Reimer, A.; Gerold, G. Simultaneous measurement of soil organic and inorganic carbon: Evaluation of a thermal gradient analysis. J. Soils Sediments 2013, 13, 1133–1140. [Google Scholar] [CrossRef]
- Bisutti, I.; Hilke, I.; Schumacher, J.; Raessler, M. A novel single-run dual temperature combustion (SRDTC) method for the determination of organic, in-organic and total carbon in soil samples. Talanta 2007, 71, 521–528. [Google Scholar] [CrossRef] [PubMed]
- Caria, G.; Arrouays, D.; Dubromel, E.; Jolivet, C.; Ratié, C.; Bernoux, M.; Barthès, B.G.; Brunet, D.; Grinand, C. Black carbon estimation in French calcareous soils using chemo-thermal oxidation method. Soil Use Manag. 2011, 27, 333–339. [Google Scholar] [CrossRef]


Publisher’s Note: MDPI stays neutral with regard to jurisdictional claims in published maps and institutional affiliations. |
© 2021 by the authors. Licensee MDPI, Basel, Switzerland. This article is an open access article distributed under the terms and conditions of the Creative Commons Attribution (CC BY) license (https://creativecommons.org/licenses/by/4.0/).