Article

Production–Living–Ecological Conflict Identification Using a Multiscale Integration Model Based on Spatial Suitability Analysis and Sustainable Development Evaluation: A Case Study of Ningbo, China

1
Institute of Geographical Sciences and Natural Resources Research, Chinese Academy of Sciences, No. 11A Datun Road, Chaoyang District, Beijing 100101, China
2
College of Resources and Environment, University of Chinese Academy of Sciences, No. 19A Yuquan Road, Haidian District, Beijing 100049, China
3
Key Laboratory of Carrying Capacity Assessment for Resource and Environment, Ministry of Natural Resources, No. 46 Fuchengmen Road, Xicheng District, Beijing 100812, China
*
Author to whom correspondence should be addressed.
Land 2021, 10(4), 383; https://doi.org/10.3390/land10040383
Submission received: 18 February 2021 / Revised: 18 March 2021 / Accepted: 3 April 2021 / Published: 7 April 2021

Abstract

:
Production–living–ecological space (PLES) basically covers the scope of spatial activities in people’s material production and spiritual life and is the basic carrier of human social development and economic activities. The coordinated development of PLES is an effective method to mitigate land-use conflicts to achieve balanced and coordinated development of the region. However, so far, compared with the single-scale study based on administrative unit, the PLES conflicts between microcosmic grid-scale receives less attention. Considering the important scale problems of the geographical study, this study aims to analyze the synergetic degree of PLES under different scales (administrative-unit, grid, and integrated multiscale) and to scientifically diagnose land use conflicts in Ningbo, China. Results indicated that production land and ecological land in Ningbo were continuously occupied by human activities from 2010 to 2018. The lowest and lower suitability areas of ecological space in Ningbo increased from 2010 to 2018. Land ecological suitability was seriously affected by urban expansion, its ecological value was reduced, and the PLES developed towards the trend of being uncoordinated. Multiscale coupling analysis showed that the PLES in Ningbo was in less conflict on the whole, but with the development of the economy, the coupling coordination degree of PLES was also damaged. This study establishes the different scales of a PLES coupling coordination development degree evaluation index system and enriches the methods of multiscale land use fusion conflict diagnosis and also provides a scientific reference for the optimized and sustainable development of regional territorial space.

1. Introduction

1.1. Motivation and Literature Review

Those who utilize land resources, as well as other stakeholders, are now looking for diversified regional development goals, demand of different phases, and land resource multi-suitability, scarcity, etc. All these pursuits together lead to different sorts of land use conflicts, severely restricting the multi-functional use of land [1,2]. Over the past 40 years of reform and opening up, China’s economy has rapidly developed. Especially since the beginning of the 21st century, pressure on resources and the environment caused by population growth and economic development has intensified, and the conflict between humans and land has become increasingly prominent. On the basis of high land expansion and resource consumption, the land-development model overemphasizes economic growth and ignores the overall layout of resources, which leads to great changes in the relationship between humans and land. With the drastic evolution of the land use spatial pattern, the frequency of land use conflict is increasing, and its form and content are more complex and changeable. How we control land use conflict to a manageable proportion has become an important task in the process of land use [3,4]. Land use conflict has a lot to do with the relationship between humans and land. It is a complicated issue involving multiple intertwining factors, such as nature, economy, and society. The only way to manage the conflict zone precisely is to quantitatively identify their functions, and the coupling coordination of land use functions is the point of easing land-use conflict and land resource management. However, because of the complexity and comprehensiveness of land use functions and the different emphasis on the characteristics of the study area (e.g., scale and regional characteristics), there was no unified land use function classification system to scientifically evaluate and diagnose conflict. Production–living–ecological space (PLES), the shortened form for production space (PS), living space (LS), and ecological space (ES), was reclassified considering both land use functions and utilization types [5]. It was formally put forward in the 18th National Congress of the Chinese Communist Party in 2012, and its purpose was to optimize the spatial pattern of land uses by the overall coordination of PS, LS, and ES [6]. PLES basically covers the scope of spatial activities in people’s material production and spiritual life. It is the basic carrier of human social development and economic activities. The three are mutually independent and inter-related; they have a symbiotic fusion and restriction effect [7]. Therefore, starting from exploring the differences in the functions of PLES in different regions, as well as the functional relationship between them, it is an effective method to mitigate land-use conflicts to achieve balanced and coordinated development of the region by probing the shortcomings of regional development and clarifying the characteristics of regional spatial patterns. The available research on the methods of quantitative recognition of spatial conflict mainly includes the comprehensive index model, which calculates the spatial conflict index based on the complexity, fragility, and dynamics of the land use system [8]; the competitiveness evaluation model, which ranks the conflicts of the construction, agriculture, and ecology space by the establishment of a competitiveness evaluation index system based on land suitability and driving force [9]; and the suitability evaluation model, which identifies spatial conflicts by evaluating the suitability of the specific land-use types [10]. This kind of method, combined with the geographic information system (GIS), introduced the multi-criteria spatial decision support system [11,12]. Zou et al. developed the conflict identification and intensity diagnosis by this model on the basis of the suitability evaluation [13]. In addition, many scholars have established the spatial-conflict index to identify land conflicts from the perspective of PLES when the PLES concept was introduced [14,15]. However, so far, compared with the single-scale study based on administrative unit, the PLES conflicts between the microcosmic grid-scale receives less attention. Due to the scale dependence of geographical phenomena [16], the spatiotemporal pattern characteristics vary with the geographical scales; there is an urgent need to establish a multiscale integration model to scientifically diagnose land-use conflicts based on the PLES perspective.

1.2. Objective and Contribution

This study aims to analyze the synergetic degree of PLES under different scales (administrative-unit, grid, and integrated multiscale) and to scientifically diagnose land use conflicts in Ningbo, China by synthesizing an evaluation model of sustainable development, a coupling coordination degree model, and a multiscale mathematical model. This is expected to enrich the methods of multiscale land use fusion conflict diagnosis and provide scientific reference for the optimized and sustainable development of regional territorial space.

2. Materials and Methods

2.1. Study Area

The city of Ningbo is an important port on the southeast coast of China, located in the eastern part of Zhejiang province and the southern wing of the Yangtze River Delta. It is adjacent to Qiantang River and Hangzhou Bay in the north, the city of Shaoxing in the west, the city of Taizhou in the south, and the city of Zhoushan in the east across the sea. The terrain is high in the southwest and low in the northeast, and the height difference is about 1000 m. There are two mountain ranges in the city, Siming Mountain and Tiantai Mountain. Hills and mountains above 50 m account for 57% of the total land area. It is one of the 14 coastal cities opened to the rest of the world, and an important city in the Yangtze River Delta urban agglomeration [17]. The total land area of the city was 9816 km2, the population was approximately 8.5 million, and its GDP was CNY 1240.87 billion in 2020 [18]. Rapid population and economic growth have resulted in high demand for industrial and residential space, leading to unprecedented PLES evolution that poses serious challenges to ecosystems and the natural environment. Regional environmental risk at Ningbo has increased substantially over the past 40 years and will increase over the next several decades with the increasing demands of economic and social development on territorial space resources. The resource bottlenecks and environmental pressure are becoming increasingly prominent, and the contradiction between the supply and demand of land space resources is becoming progressively obvious [19,20,21]. Ningbo has attracted attention from environmentalists, local authorities, and scientists. Therefore, it is urgent and necessary to construct an ecological civilization. For the past 10 years, while the PS and LS in Ningbo have been expanding, the ES has been shrinking, and PLES contradictions in Ningbo are prominent. How to coordinate the relationship between development, livability, and protection; improve the coordinated development level of PLES in function; and promote the coordinated and sustainable development of the economy, society, and ecology are major issues for the development of Ningbo.

2.2. Research Framework

Based on the characteristics of geographical scale dependence, this study was undertaken to diagnose PLES conflicts from two aspects using a multiscale integration method: administrative-unit scale and the spatial grid scale. The administrative-unit scale highlights the sustainability of PLES, based on the sustainable development goals (SDGs), while the spatial grid scale focuses on the functional suitability of PLES. The administrative-unit scale detects PLES conflicts from the macroscopic perspective on the basis of sustainable utilization of PLES, whereas the spatial grid scale more accurately reflects the microscopic and detailed functional differences of PLES, compensating for the lack of the strong generality of the microscopic scales. Thus, the research framework was developed as follows:
Step 1: explore PLES spatiotemporal variation on the basis of PLES grid data at 1 × 1 km.
Step 2: evaluate PLES suitability on the grid scale and quantify the synergetic degree using the coupling and coordination model.
Step 2: quantify PLES sustainable development evaluation on the administration-cell scale using the coupling and coordination model.
Step 3: diagnose PLES conflicts using the multiscale integration model to combine the evaluation of the synergetic degree of PLES on the grid and administration-cell scales.

2.3. PLES classification

PLES data in Ningbo of 2010 and 2018 evolved from land use data (1 × 1 km) and were provided by Data Center for Resources and Environmental Sciences, Chinese Academy of Sciences (RESDC) (http://www.resdc.cn, accessed on 5 November 2020). Land use classification includes six first-level categories, namely, arable land, woodland, rangeland, water-area and -conservancy facility land, construction land, and unused land and 25 s-level categories. According to the second-level classification standard of the land-use/-cover classification system for remote-sensing monitoring in China, on the basis of the differentiation of land use functions and types, and the linkage table (Table 1), PLES structure and land use types were established.

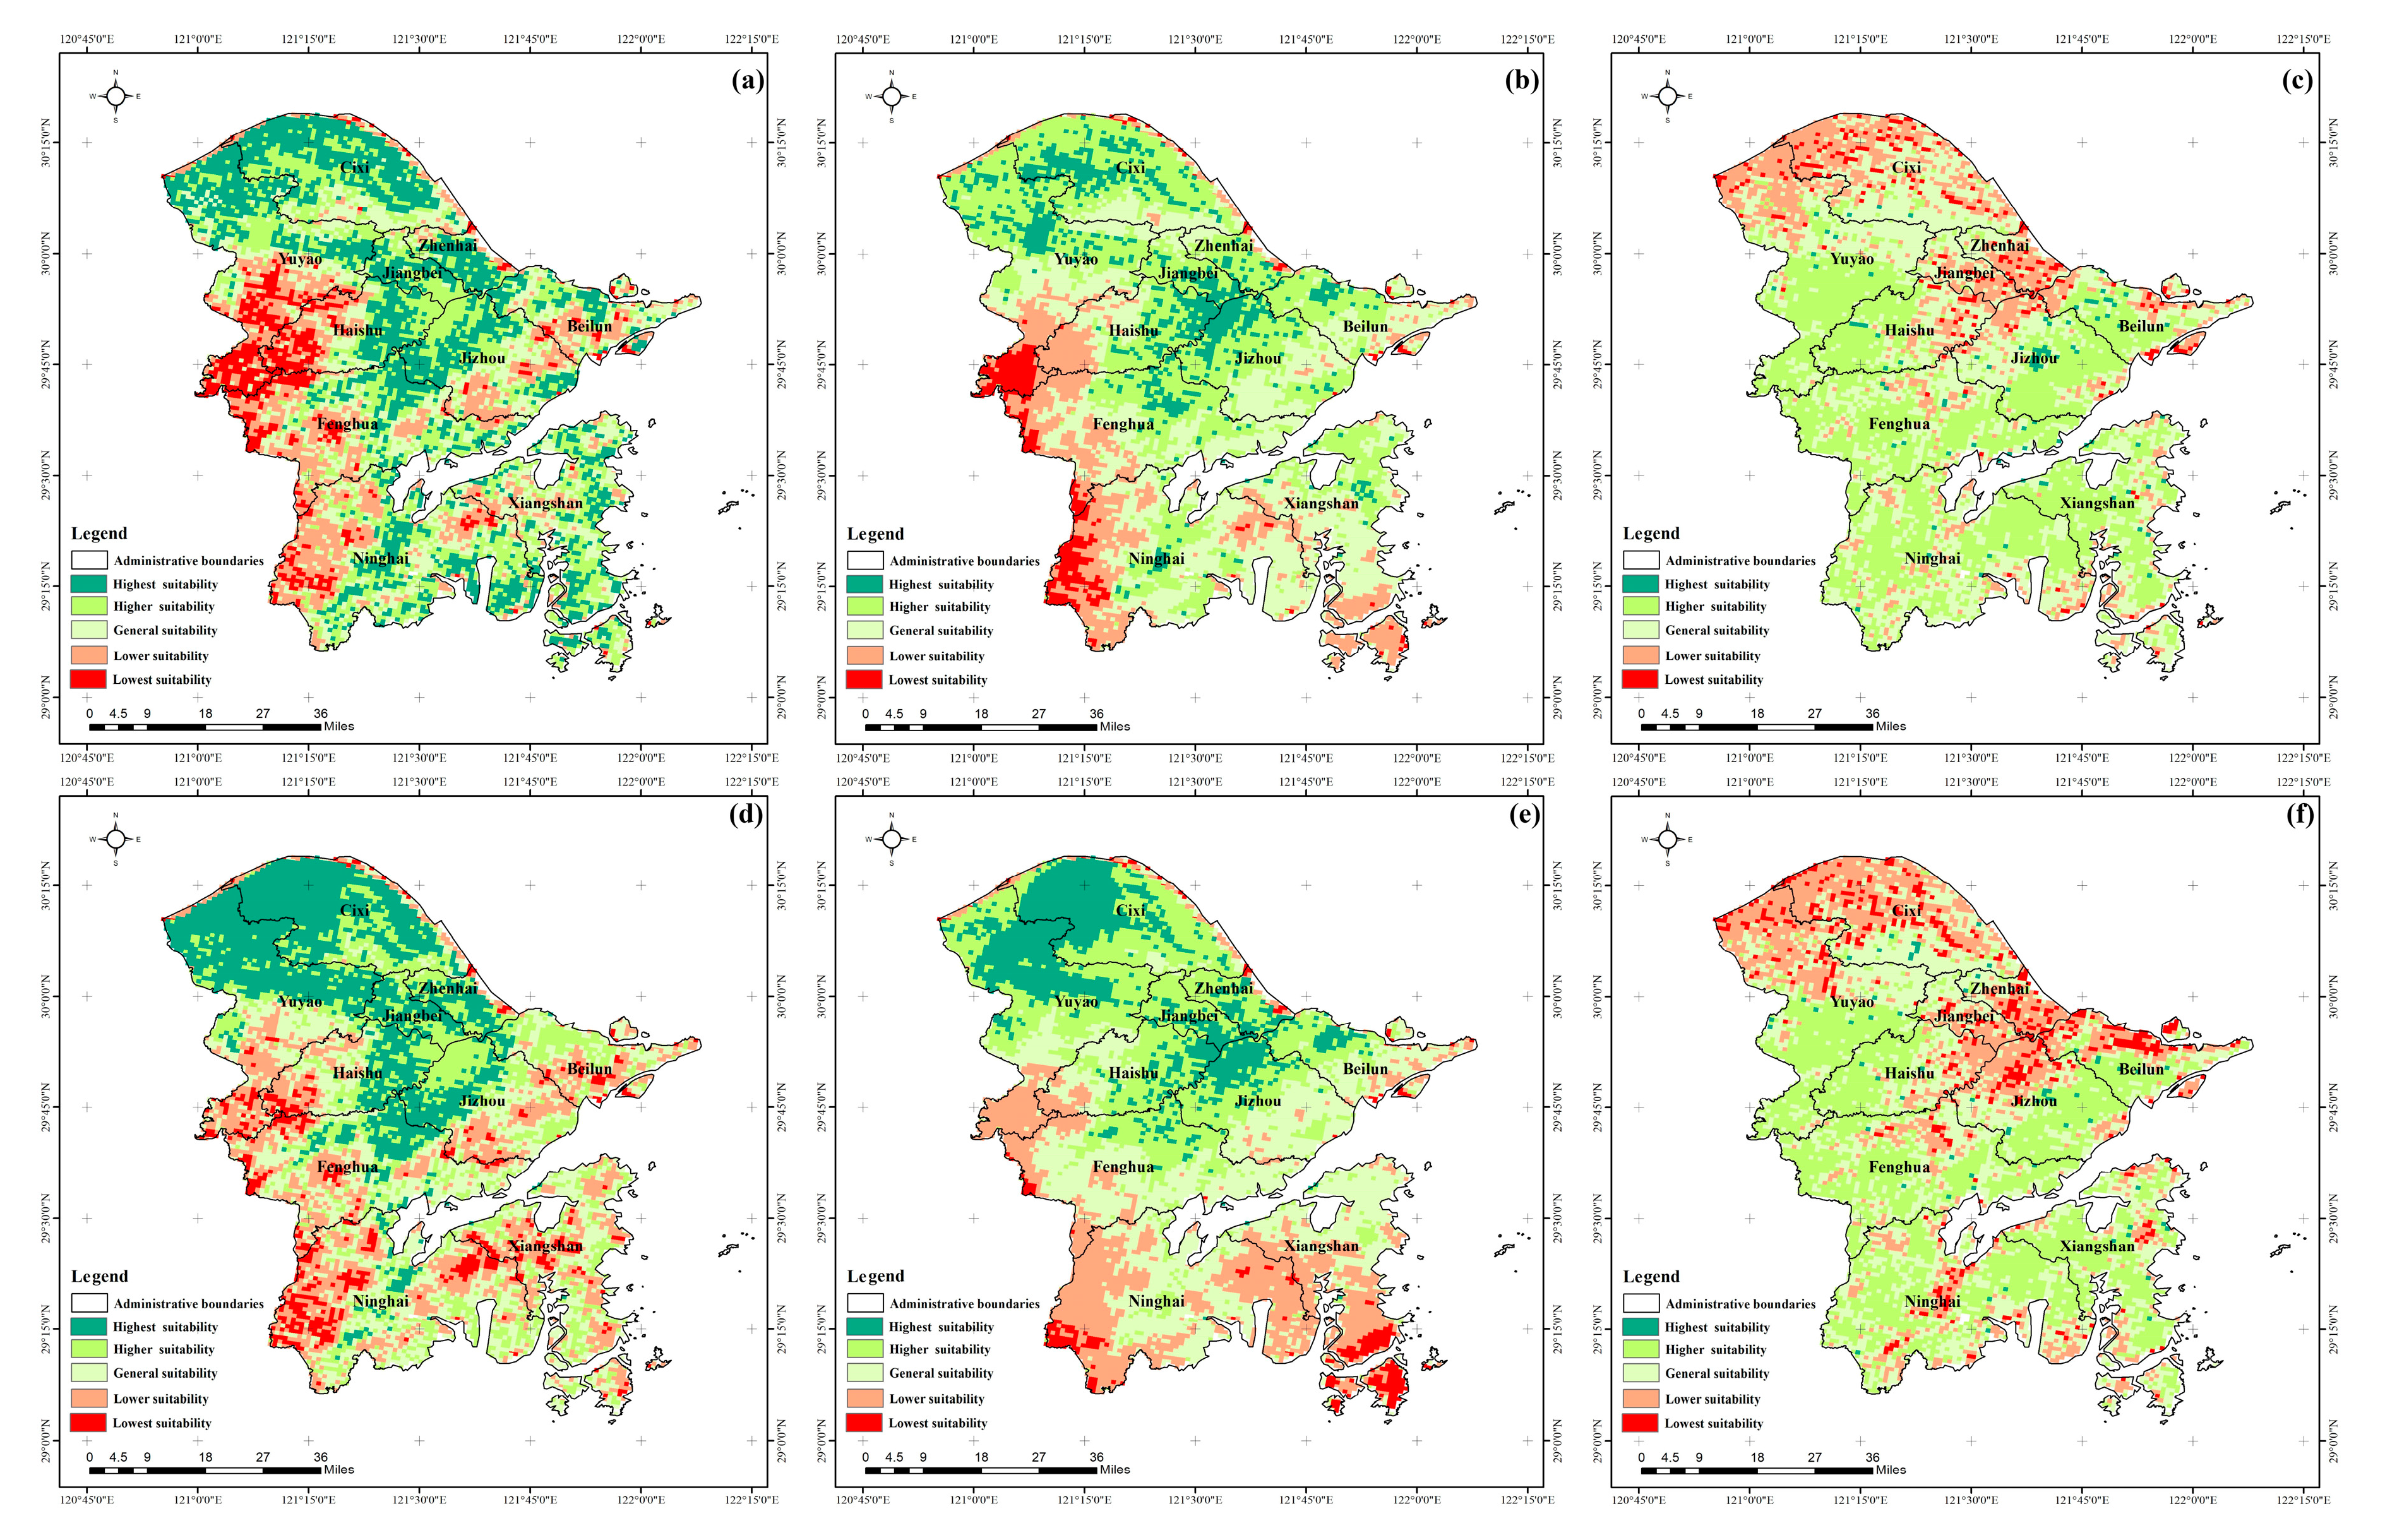
2.4. Construction of PLES Suitability Evaluation Model on Grid Scale

PLES suitability is to evaluate suitability in different land-utilization types of county territories with high vegetation coverage. In particular, production suitability refers to the suitability of county territories with high vegetation coverage in providing tangible agricultural products or industrial products or intangible products for humans. It mainly reflects the product production level of county territories, which is mainly affected by natural climate, land suitability, and development convenience. Living suitability refers to the suitability of county territories with high vegetation coverage in living conditions such as convenient facilities, housing, and public activities. It investigates the living support level of residents in county territories, which is mainly affected by public facilities, terrain, and the social economy. Ecological suitability refers to the suitability of the research area to provide direct or indirect ecological products and ecological services for humans, which is mainly affected by environmental quality and the social environment. The index system of PLES suitability evaluation in this paper is as follows (see Table 2):

2.5. Coupling and Coordination Model

The coupling coordination degree model is a relationship that can better describe the interaction and influence of two or more systems in the development process. Coupling coordination degree is the degree of mutual promotion and restriction among various systems at high and low levels and reflects the degree of interaction and coordinated development among various systems. This paper mainly adopted this model to calculate the coupling coordination degree of PLES suitability results and regional sustainable development. The coupling coordination degree (CCD) can be obtained according to the following formula. The value of CCD is in the range of 0–1. A higher value indicates a higher degree of coupling coordination [28,29].
D = C × T
T = α × U 1 + β × U 2 + + γ × U 3   ( α = β = γ = 1 / n )
C = ( U 1 × U 2 × × U n ) / U 1 + U 2 + + U n n n n
U = i = 1 n ( ω i × x i )
where D represents the coupling and coordination degree, T reflects the overall effect and level of each subsystem, C is the coupling degree, U represents subsystem performance, Wi represents the weight value of indicator I, and Xi represents the standard value of indicator i in each subsystem.
There are three subsystems in this study, namely, production, life, and ecology, so C and T are calculated by the following formulas, where Up, Ul, and Ue are the performance levels of the PS, LS, and ES subsystems, respectively; α, β, and γ represent the contributions of the PS, ES, and LS subsystems, respectively.
C = ( U p × U l × U e ) / U p × U l × U e 3 3 3
T = α × U p + β × U l + γ × U e   ( α = β = γ = 1 / 3 )

2.6. Sustainable Development Evaluation on Administration-Cell Scale

Sustainable development is the fundamental pursuit of territorial space optimization and the starting point of PLES optimization [30]. PLES optimization is consistent with the sustainable development theory of the multi-objective coordination of economy, society, and environment and is the embodiment and implementation of sustainable development theory in urbanization construction. On the basis of SDGs 1–3, 6, 8, 11–13, and 15, this study was guided by “intensive production”, “livable life”, and “beautiful ecology” to establish the coupling coordination degree evaluation index of PLES, covering the scale of space, structure of space, efficiency of space, quality of space, and other factors (Table 3). It aims to provide a scientific basis for the efficient use of PLES and the sustainable development of economy–society–environment.

2.7. PLES Conflict Identification Based on Multiscale Integration Model

In this study, the iterative method was used to establish spatial relations on different scales and perspectives [40]. According to the scores and weights of various functional evaluation factors on different scales, a multiscale mathematical model of PLES conflict weight was established:
C p , l , e = ( 1 α ) × f p , l , e + α i = 1 m f i × β ,  
where Cp,l,e represents the comprehensive evaluation value of PLES conflict weight (p, production; l, living; e, ecological) under multiscale integration; α represents the weight of evaluation results at the upper scale (administrative-unit); fp,l,e is the evaluation index of the suitability of PLES on the grid scale; fi and β represent the evaluation factor of sustainable development of PLES on the administrative-unit scale and the corresponding index weight, respectively. Using the calculated results by the multiscale comprehensive evaluation model to diagnose the PLES conflicts of Ningbo, according to the comprehensive evaluation score of each function of each grid, the level of each function was judged. With ArcGIS, conflict types were classified on average into five levels, namely, no conflict, little conflict, medium conflict, serious conflict, and violent conflict.

3. Results and Analysis

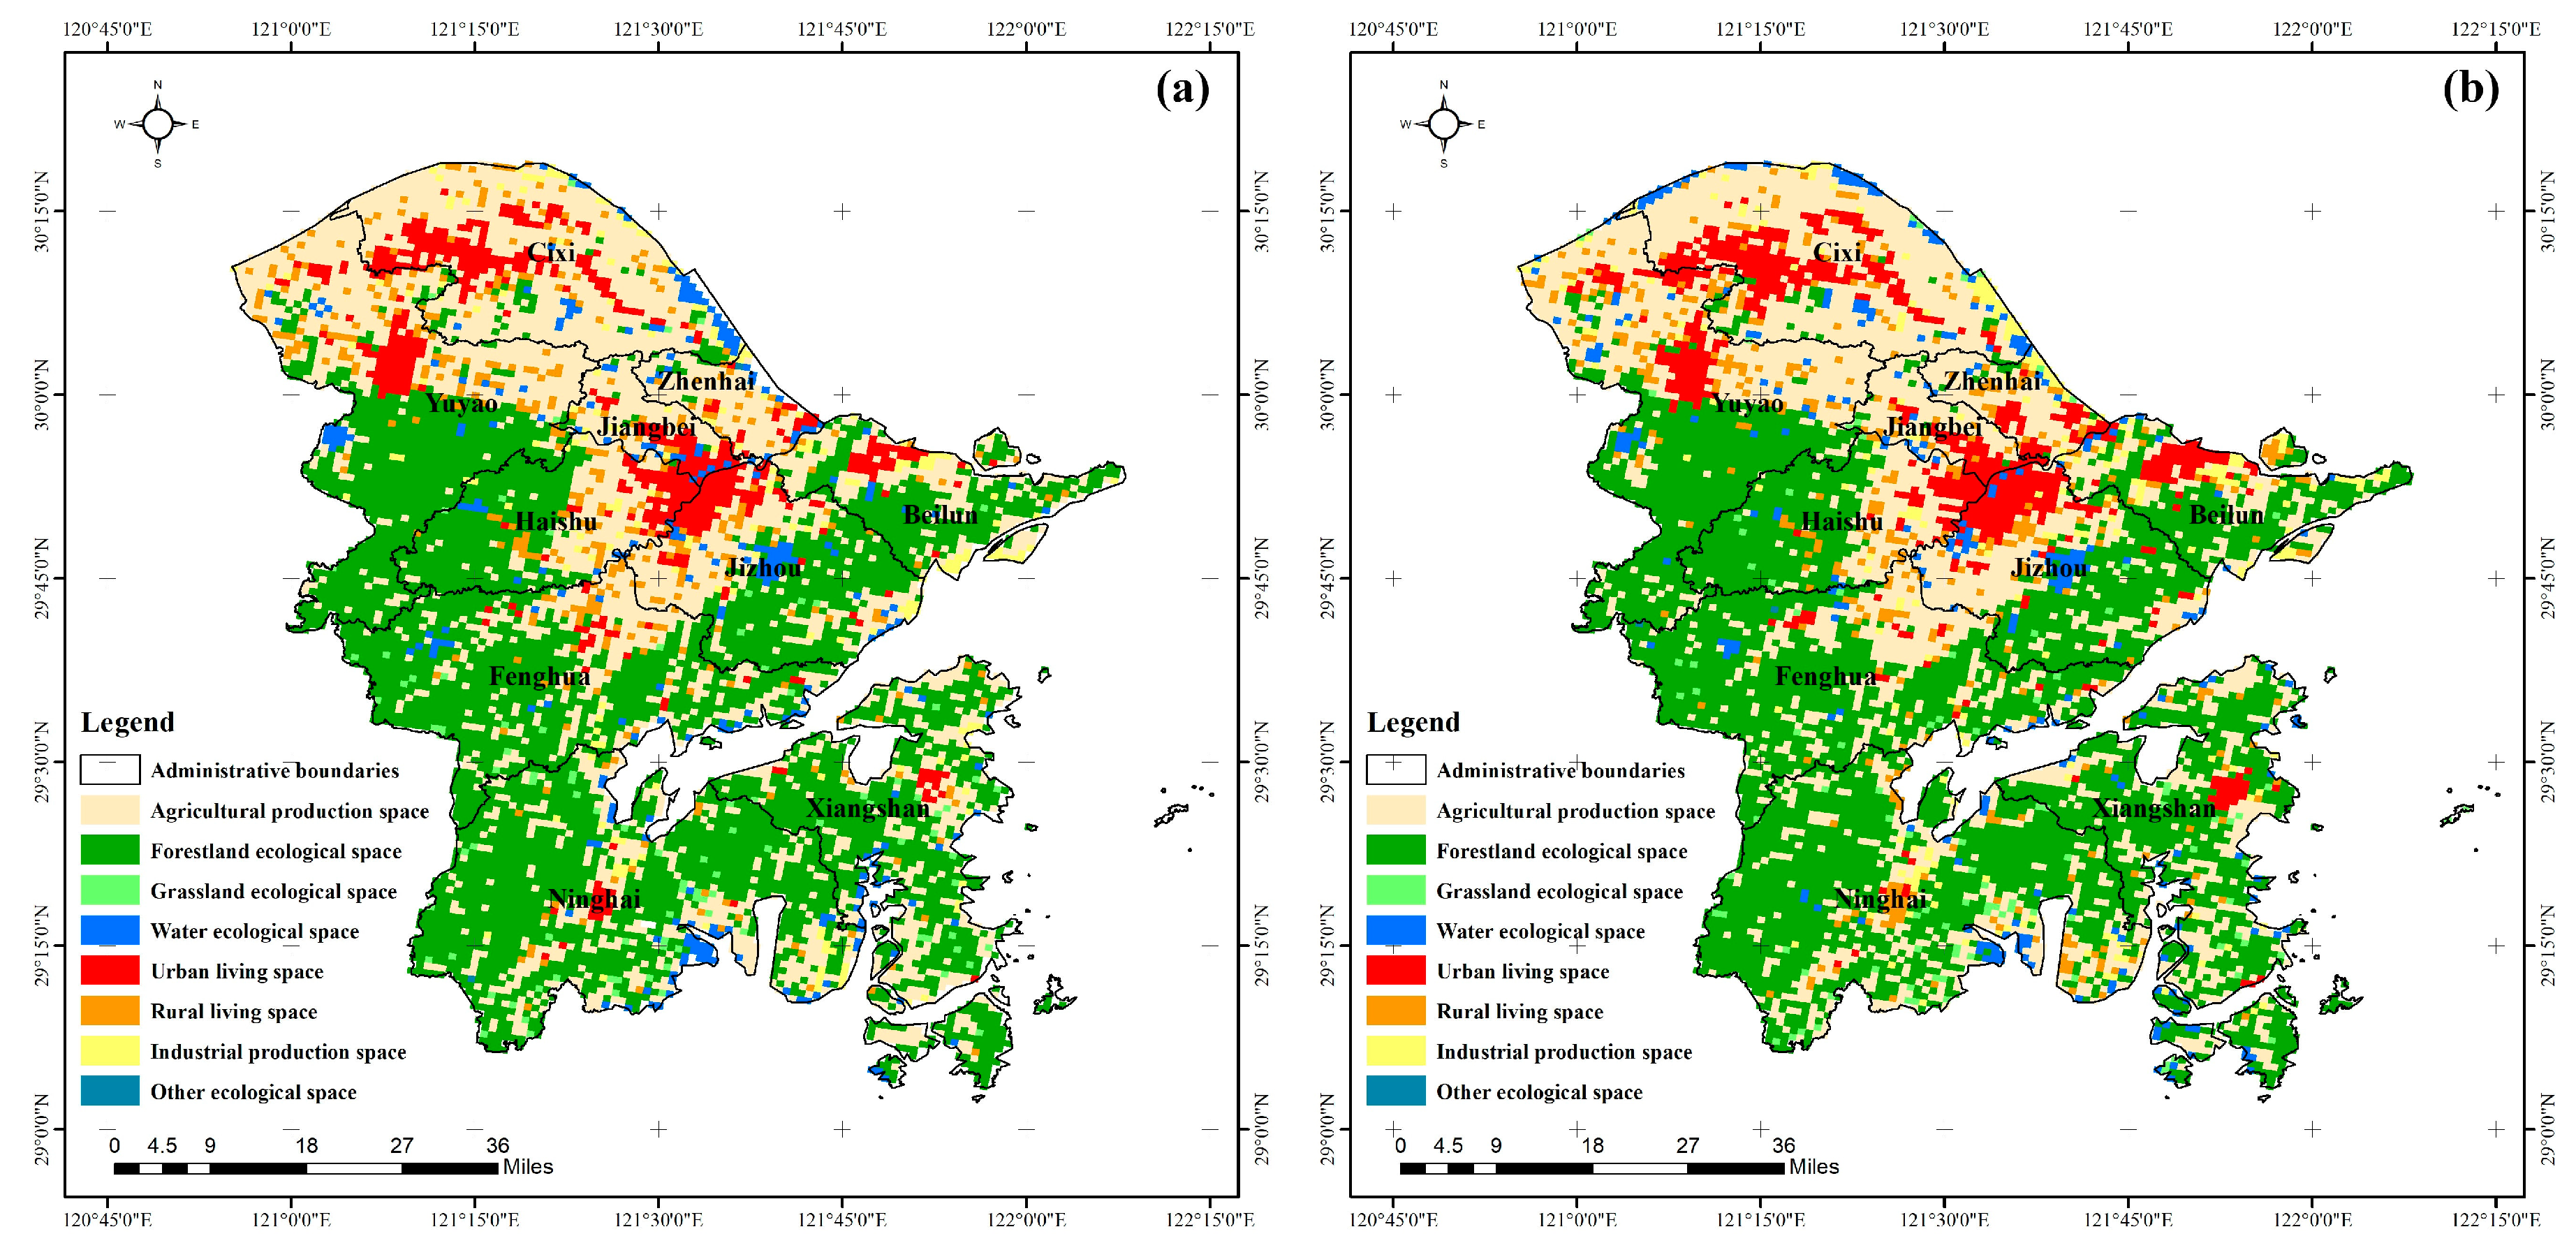
3.1. Spatial–Temporal PLES Characteristics in Ningbo

Figure 1 shows the spatial characteristic of PLES in Ningbo for (a) 2010 and (b) 2018. In general, due to the rapid development of the economy and the acceleration of urbanization in recent years, a great deal of PS and ES in Ningbo was transformed into living space, resulting in a decline of PS and ES, which decreased by 1.68% and 1.89%, respectively, while the area occupied by living space increased by 14.4%. These data show that the rapid development of urbanization and the pursuit of high-quality life in Ningbo from 2010 to 2018 led to the continuous expansion of living land. Production land and ecological land were constantly occupied under the influence of human activities, although the area of PS decreased, and the area of industrial PS slightly increased, which indicates that agricultural PS was greatly affected by human activities. Agricultural PS occupied a large area, and the level of agricultural development was affected.

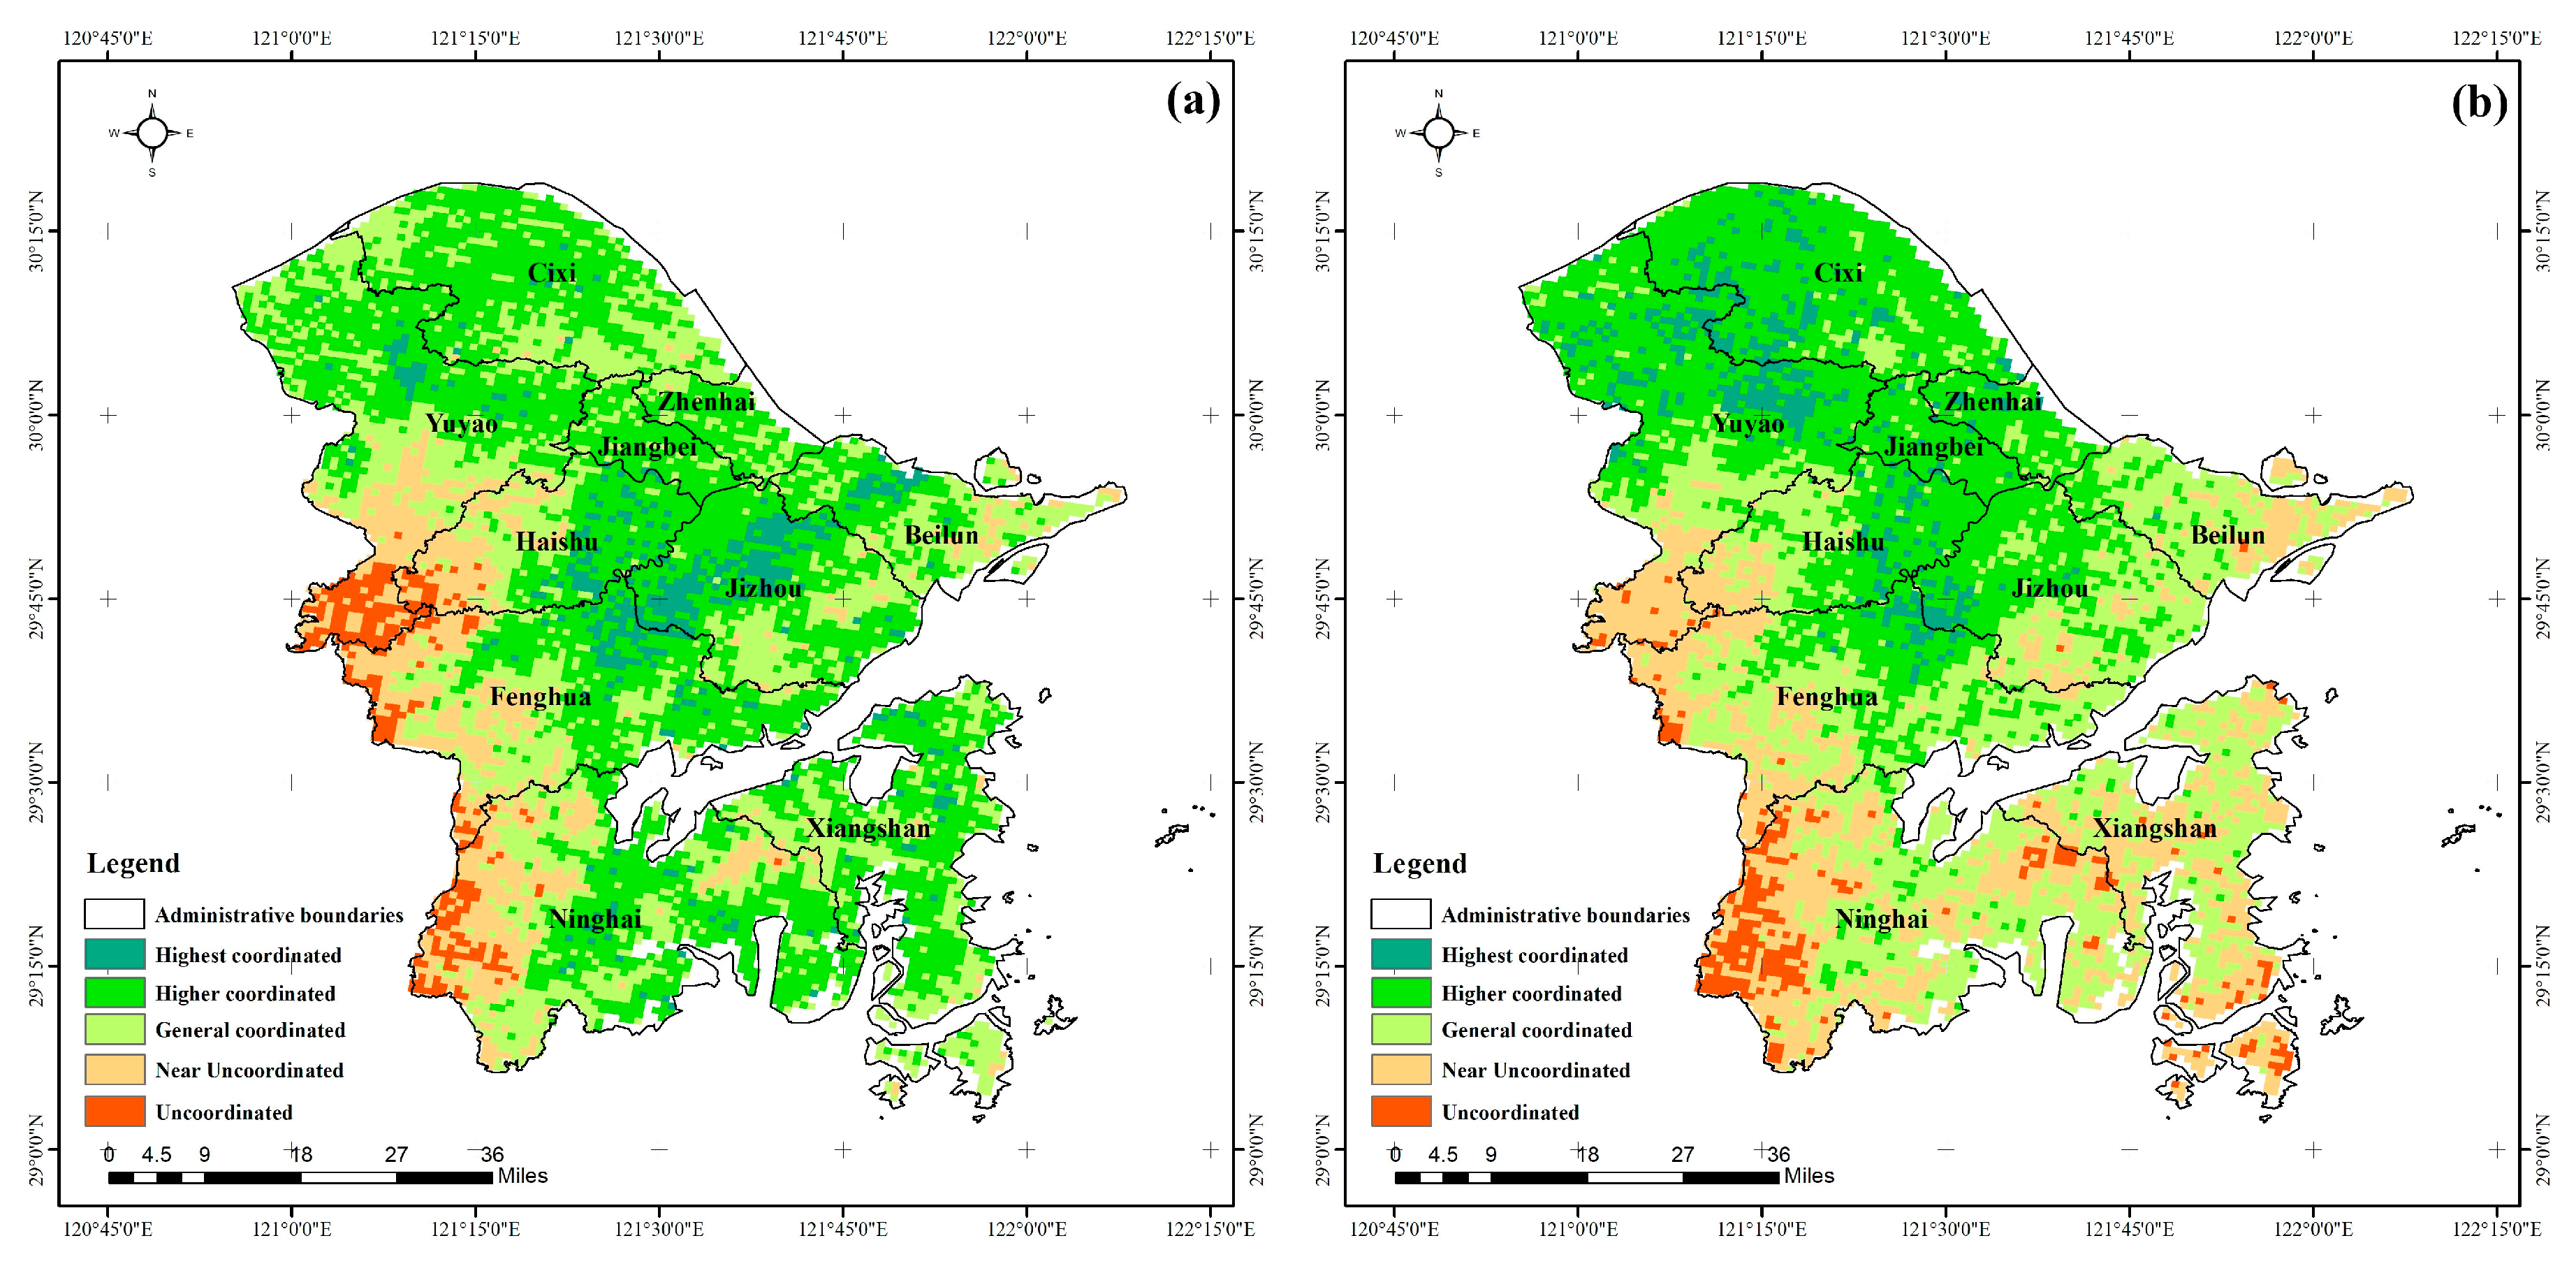
3.2. Coupling and Coordination for PLES Suitability Analysis in Ningbo

Figure 2 shows the suitability evaluation results of PLES in Ningbo. From 2010 to 2018, the areas of lowest and lower suitability of ecological space in Ningbo increased, while areas of general, higher, and highest suitability decreased, indicating that urban expansion seriously affected the ecological suitability of land and reduced its ecological value. The lowest-suitability areas were sporadically distributed in the two years and were mainly in the northern part of Ningbo in 2010. However, in 2018, lowest-suitability areas both spread to the southern part and greatly increased in the northern part, even showing a trend of aggregation. This was mainly due to the acceleration of the urbanization process and the continuous expansion of living space. Increasing amounts of ecological land with flat terrain suitable for urban construction and expansion were used for urban construction. Lower suitability areas also gradually expanded from the north to the south, and the northern area continuously expanded. From 2010 to 2018, lowest, general, and higher suitability areas of living space in Ningbo decreased, while lower and highest suitability areas increased, indicating that higher and general suitability areas were increasingly developed into urban construction areas. With the expansion of urban areas, many lowest-suitability areas were affected by the surrounding cities. Their infrastructure conditions were gradually optimized, and population density gradually increased, making development suitability also gradually increase. From the perspective of space, lowest suitability areas were mainly distributed in the western and northern parts of Ningbo, while highest suitability areas were mainly distributed in urban built-up areas and their surroundings. These areas are densely populated with a long history of development and strong infrastructure conditions to assist in daily life, which are suitable for maintaining the development of living space. Lowest suitability PS areas in Ningbo were mainly distributed in woodland and rangeland in the central and southern parts of Ningbo. These areas are generally at higher elevations, with higher slopes, inconvenient transportation, and high costs for industrial and agricultural production. Higher suitability areas and highest suitability areas of PS were mainly distributed in the northern part of Ningbo, and distribution was similar to that in higher and highest suitability LS areas. Higher suitability areas were mainly distributed in arable land, with a certain basis for agricultural production and development. Highest suitability areas significantly increased from 2010 to 2018, mainly distributed in the urban areas of Ningbo, with dense population, a high land use degree, excellent infrastructure conditions, and a long-term basis for industrial and service production.
Figure 3 shows the results of the coupling coordination degree of PLES suitability in Ningbo. From 2010 to 2018, the uncoordinated areas of PLES in Ningbo remained basically unchanged with small increases. However, near-uncoordinated areas increased by 75.82%. Highest coordinated areas had little change, increasing by only 4.56%. To be specific, the large increase in near-uncoordinated areas indicates that the development of Ningbo in recent years developed PLES towards the uncoordinated direction. From the perspective of space, uncoordinated and near-uncoordinated areas are mainly distributed in the south and west of Ningbo. Those areas are mainly woodland and rangeland. Terrain conditions make it difficult to develop and are merely suitable for maintaining its ecological value, which gradually leads to development conditions between ecological and production–living space being uncoordinated. Higher and highest coordinated areas are mainly located in the south of Ningbo. These are mainly distributed in urban areas, agricultural production space, and their surroundings. These areas have both the local basis for the development of production and living spaces and a higher ability for ecological function development because of their natural geographical factors. The suitability development of PLES in these areas is coordinated.

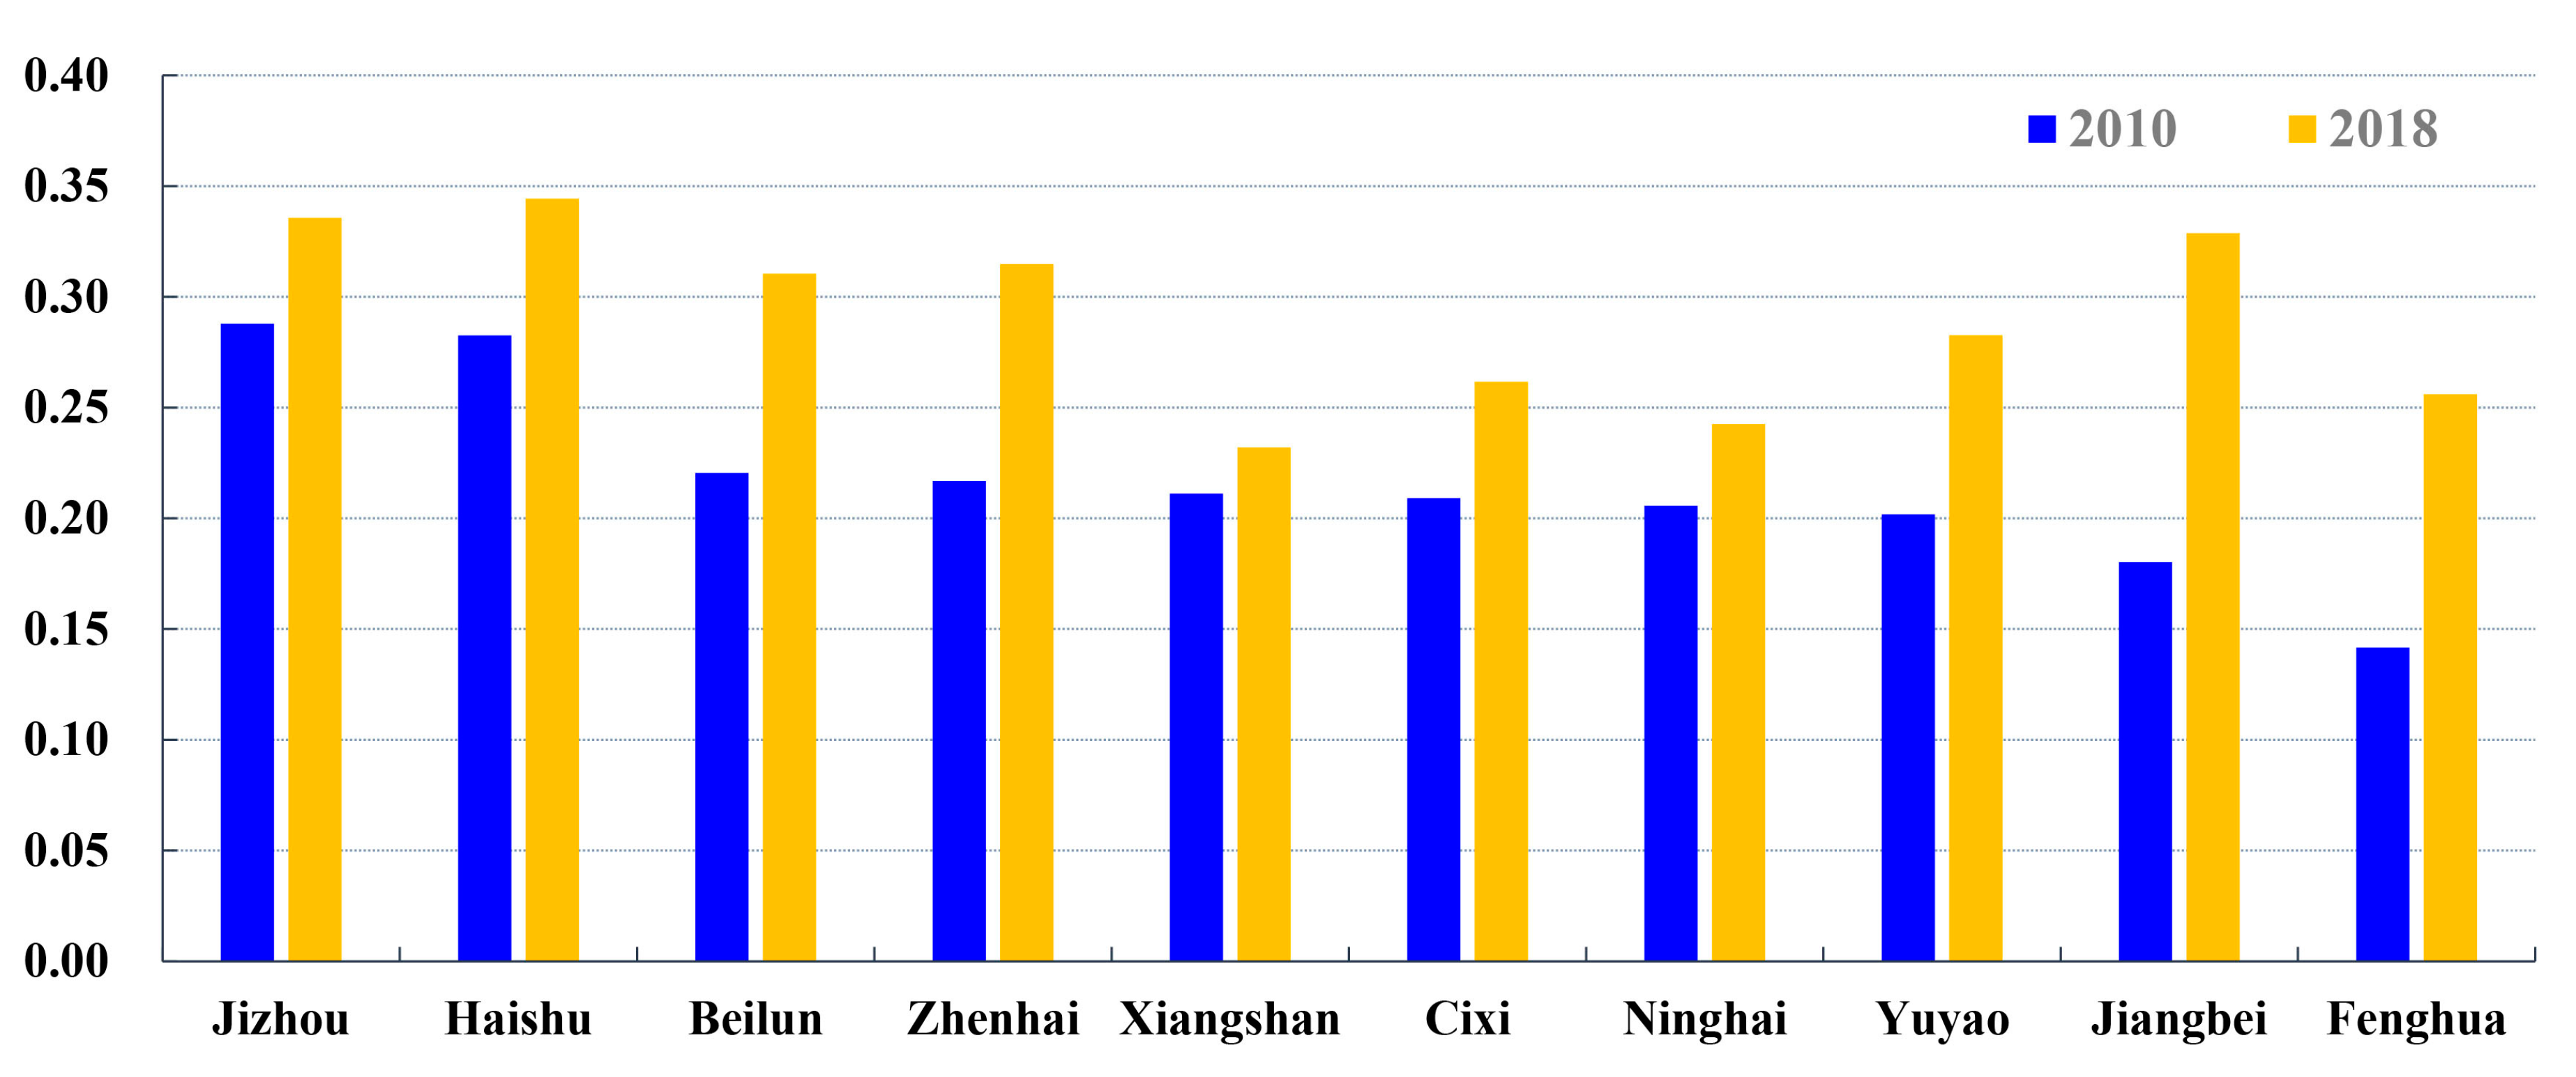
3.3. Sustainable Development Evaluation of PLES on Administration-Cell Scale in Ningbo

Figure 4 shows the result of the sustainable development evaluation of PLES on the administration-cell scale in Ningbo for 2010 and 2018. Results showed that the state of sustainable development evaluation of PLES in the districts of Jiangbei and Fenghua were uncoordinated, and other counties and districts in Ningbo were near-uncoordinated in 2010. Jiangbei is located in the central urban area of Ningbo, and there, the development of secondary industries promoted economic growth but inhibited the coordinated development of LS and ES. Thus, the development level of PS in Jiangbei was the highest, followed by ES, and the development level of LS was the lowest in 2010. Fenghua is located in the western part of Ningbo; the basic geographical conditions of high altitude and high slope were the main factors restricting the development of LS in this area. Fenghua had the highest development level for ES, PS was second, and the development level of LS was the lowest in 2010. In 2018, the state of sustainable development evaluation of PLES of all counties and districts in Ningbo was higher than that in 2010, and all counties and districts in Ningbo were in a near-uncoordinated state. Among them, Jiangbei and Fenghua paid more attention to the coordinated development of PLES after 2010, the coordination index increased by 0.15 and 0.11, respectively, from 2010 to 2018, and the improvement range of coordination index in other counties and districts was less than 0.10. Although the state of sustainable development evaluation in Ninghai and Xiangshan was higher than that in other regions in 2010, due to the lack of coordinated development of PLES and the influence of geographical conditions, the gap between the development levels of PS, LS, and ES gradually widened, the coordination index only increased by 0.04 and 0.02 from 2010 to 2018, respectively, and their state of sustainable development evaluation of PLES was the lowest in Ningbo.

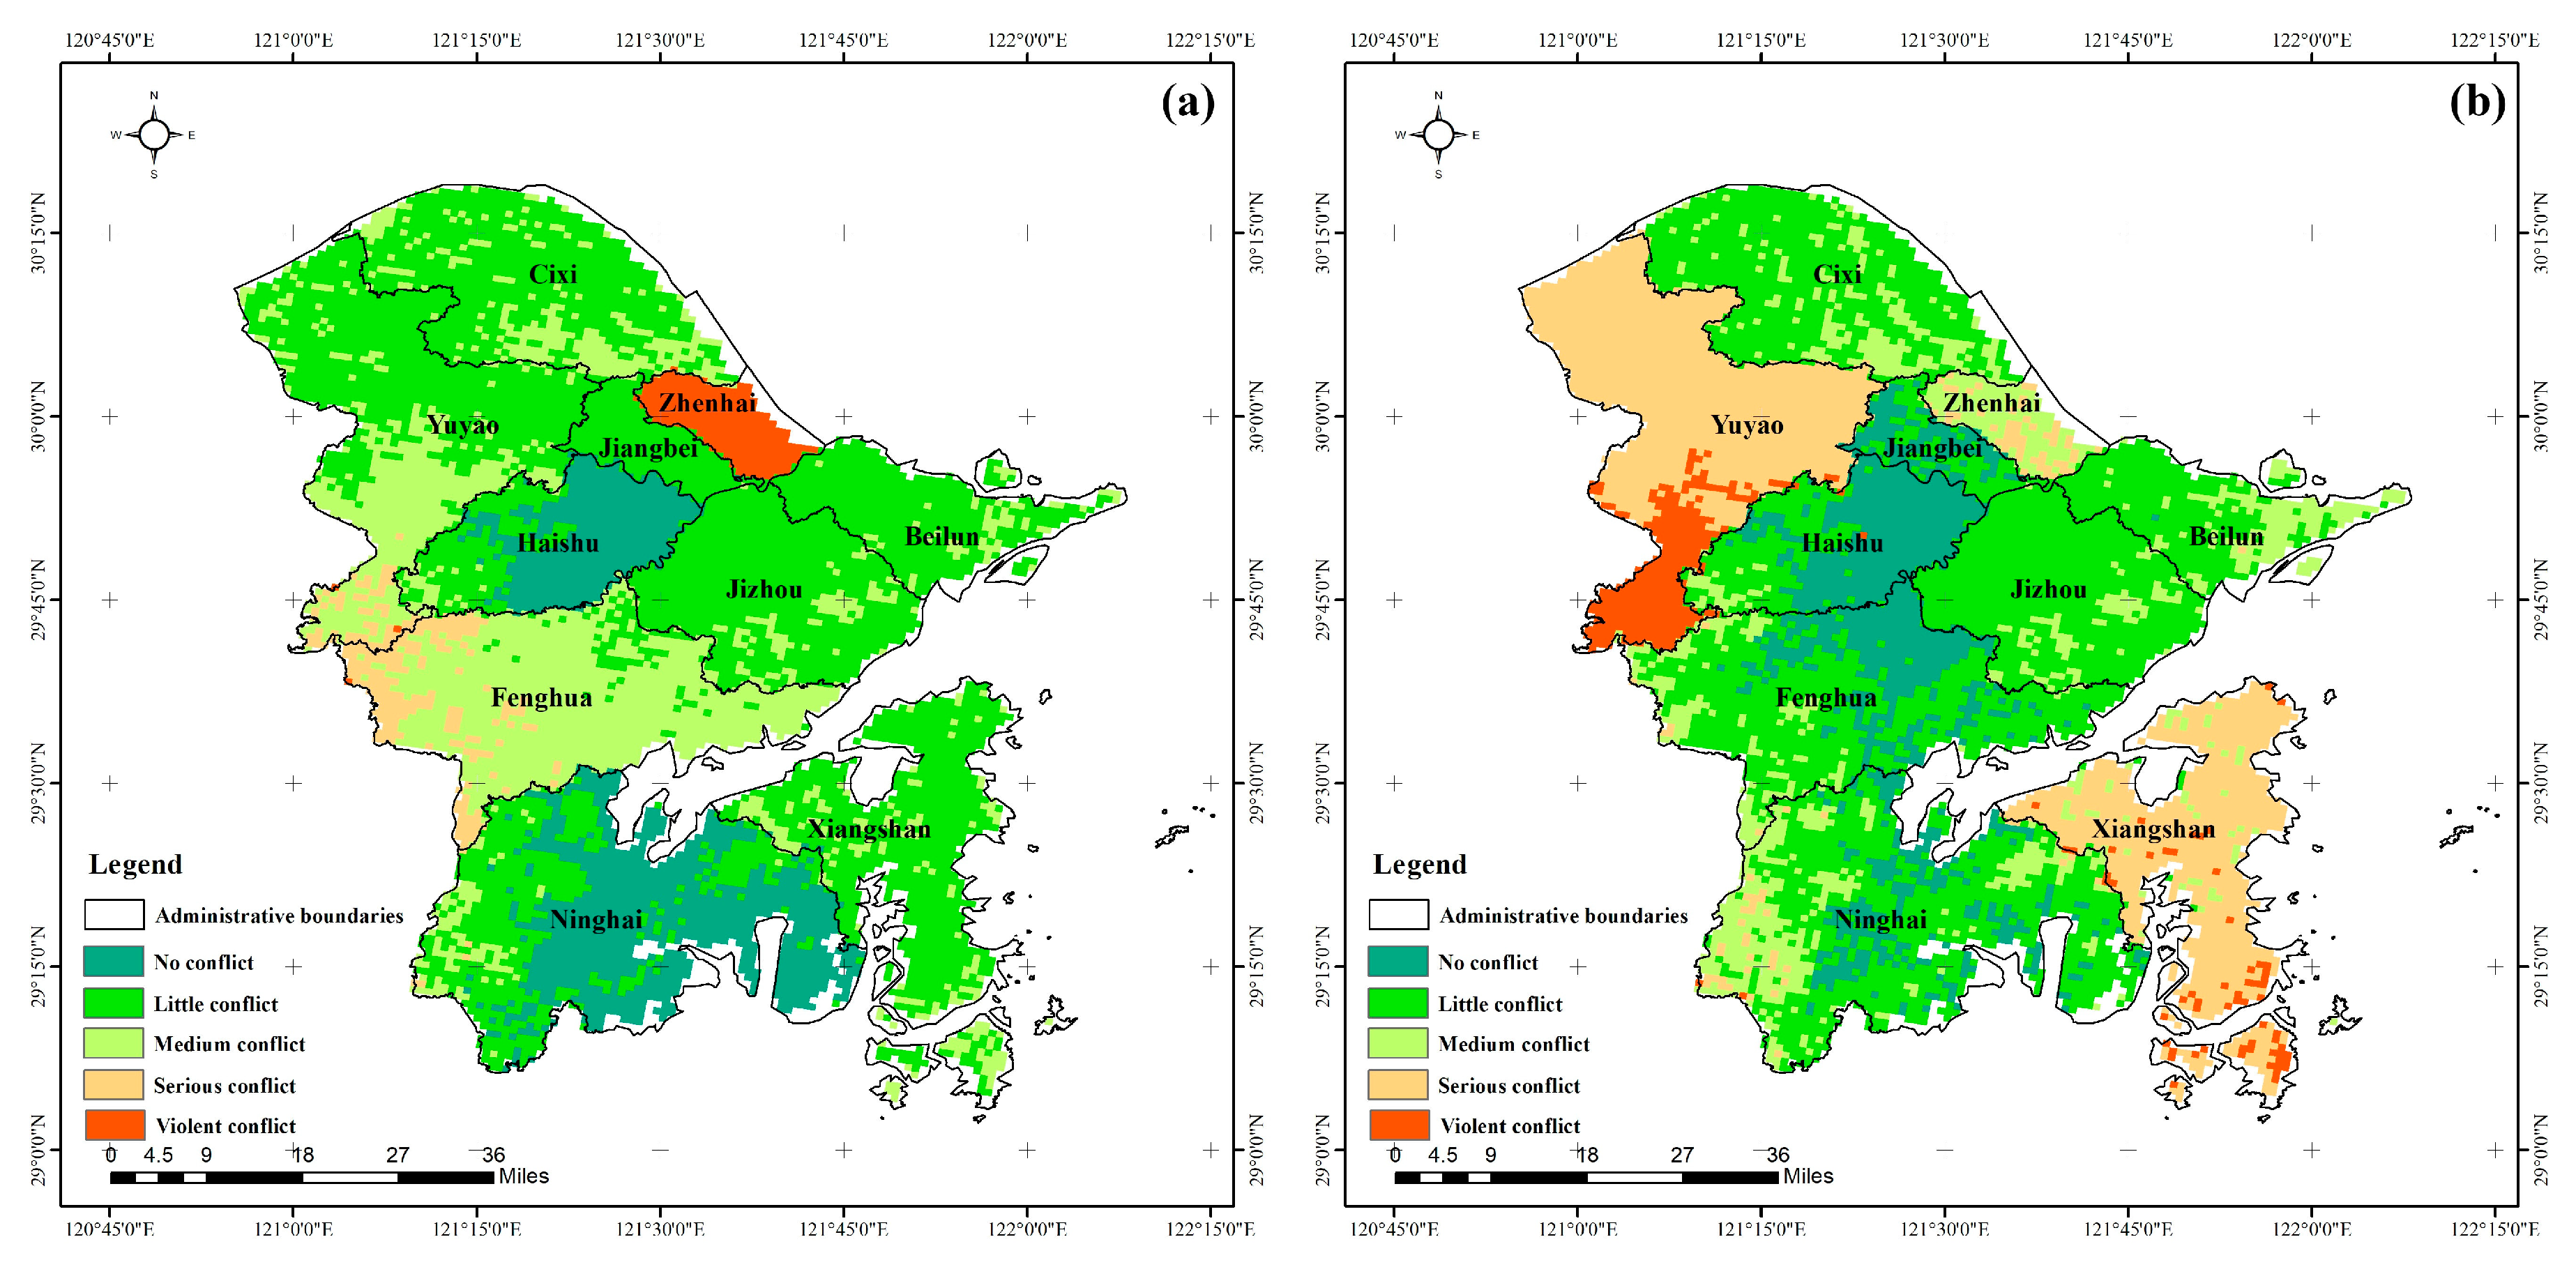
3.4. PLES Conflict Identification in Ningbo

Figure 5 shows the multiscale conflict detection results of PLES in Ningbo. In 2010 and 2018, PLES in Ningbo was in a state of coupling coordination. However, with economic development, the coupling coordination degree of PLES in Ningbo was also damaged and developing toward incoordination. The violent conflict area of PLES in Ningbo in 2010 was about 2.42%, mainly concentrated in the district of Zhenhai. In 2018, it increased to 4.01% and shifted to the western part of Ningbo and the southern part of Yuyao. Result analysis of suitability and sustainable development evaluation showed that the main reason for conflicts in Zhenhai and other areas in 2010 was the limited development of living space. The rapid urbanization of Ningbo promoted the development of living space in Zhenhai and other areas, and the increase in space utilization promoted coordinated and balanced PLES development. In the western part of Ningbo and the southern part of Yuyao, due to the effect of terrain conditions, land development was difficult, and the development of production and living space was seriously hindered. The ecological function of land remained unchanged, which led to increasing conflict in the development of PS, LS, and ES. Conflicts in Ninghai, a county in the south of the city, have been continuously increasing. Due to the large scale of ecological land, the relatively small scale of living space, low population density, and poor infrastructure conditions in Ninghai, economic development was limited, resulting in the coordinated development of PS, LS, and ES gradually decreasing, and the level of conflict gradually increasing. By contrast, Jiangbei is located in the center of Ningbo, an excellent geographical location promoting the development of the city. Driven by the great foundation of urban development, and the development opportunity of industrialization and urbanization, the economy, population scale, and environmental quality constantly improved, and the development of the three types of space gradually tended to be coordinated. Moreover, the level of conflict became increasingly lower.

4. Discussion and Conclusions

There are complex relationships among various geographical scales, and scales and processes interact and influence each other. In this study, PLES coupling coordination degree on the administrative-unit and grid scales were analyzed by multiscale fusion. It contained the administrative-unit scale of PLES function information, reflected the macrobackground of development, and focused on the microlevel of PLES coordination performance, integrating the advantages of the two kinds of scales in order to understand the space–time characteristics of coordinated PLES development. The main conclusions are as follows:
In general, production land and ecological land in Ningbo were continuously occupied by human activities from 2010 to 2018. The industrial production space had a small increase; agricultural-production space occupied a large area, and the level of agricultural development was affected. The PLES coupling coordination degree analysis on the grid scale showed that, from 2010 to 2018, the lowest and lower suitability areas of ecological space in Ningbo increased. Land ecological suitability was seriously affected by urban expansion, and its ecological value was reduced. The near-uncoordinated area of PLES suitability considerably increased by 75.82%. PLES developed towards the trend of being uncoordinated. According to sustainable development on the administrative-unit scale, all counties and districts in Ningbo in 2010 and 2018 were under the near-uncoordinated state, and the sustainable development level of PLES was low. Multiscale coupling analysis showed that the PLES in Ningbo was in less conflict on the whole, but with economic development, the coupling coordination degree of PLES was also damaged and developing towards the uncoordinated direction. From the perspective of space, violent conflict areas of PLES in 2010 were mainly concentrated in Zhenhai. In 2018, this increased to 4.01%, and shifted to the west of Ningbo and the south of Yuyao.
The available research on the methods of quantitative recognition of spatial conflicts more focus on the single scale based on administrative unit, but the PLES conflicts between microcosmic grid scale receives less attention. Considering the important scale problems of the geographical study, PLES coupling coordination degree also has scale dependence. The quantitative research on the grid scale and multi-scale fusion method should be the future of spatial conflicts. It is therefore essential to analyze the spatial conflicts of PLES on different geographical scales. This study established different scales of a PLES coupling coordinated development degree evaluation index system, namely, the administrative-unit scale, grid-unit scale, and multiscale integration, and enriched the methods of multiscale fusion conflict diagnosis. However, the mechanism of multiscale fusion is complex and requires further study.

Author Contributions

G.L. and J.F. contributed to all aspects of this work; D.J. conducted data analysis and G.L. wrote the main manuscript text. All authors reviewed the manuscript. All authors have read and agreed to the published version of the manuscript.

Funding

This work was supported by a grant Strategic Priority Research Program of the Chinese Academy of Sciences (Grant No. XDA19040305), Youth Innovation Promotion Association (Grant No. 2018068) and Institute of Geographical Sciences and Natural Resources Research, Chinese Academy of Sciences (Grant No. E0V00112YZ).

Institutional Review Board Statement

Not applicable.

Informed Consent Statement

Not applicable.

Data Availability Statement

The data presented in this study are available on request from the author.

Acknowledgments

We greatly thank MDPI English service for the editing assistance to the paper.

Conflicts of Interest

The authors declare no conflict of interest.

References

  1. Montanari, A.; Londei, A.; Staniscia, B. Can we interpret the evolution of coastal land use conflicts? Using Artificial Neural Networks to model the effects of alternative development policies. Ocean Coast. Manag. 2014, 101, 114–122. [Google Scholar] [CrossRef]
  2. Tudor, C.A.; Ioja, I.C.; Pǎtru-Stupariu, I.; Nită, M.R.; Hersperger, A.M. How successful is the resolution of land-use conflicts? A comparison of cases from Switzerland and Romania. Appl. Geogr. 2014, 47, 125–136. [Google Scholar] [CrossRef]
  3. Chapin, F.S.; Díaz, S. Interactions Between Changing Climate and Biodiversity: Shaping Humanity’s Future. PNAS 2020, 117, 6295–6296. [Google Scholar] [CrossRef]
  4. Shen, Y.; Liu, T.K.; Zhou, P. Theoretical Analysis and Strategies of Natural Ecological Space Use Control. China Land Sci. 2017, 31, 17–24. [Google Scholar]
  5. Peng, J.; Lv, D.N.; Dong, J.Q.; Liu, Y.X.; Liu, Q.Y.; Li, B. Processes coupling and spatial integration: Characterizing ecological restoration of territorial space in view of landscape ecology. J. Nat. Resour. 2020, 35, 3–13. [Google Scholar]
  6. Huang, A.; Xu, Y.Q.; Hao, J.M.; Sun, P.L.; Liu, C.; Zheng, W.R. Progress Review on Land Use Functions Evaluation and Its Prospects. China Land Sci. 2017, 31, 88–97. [Google Scholar]
  7. Adam, Y.O.; Pretzsch, J.; Darr, D. Land use conflicts in central Sudan: Perception and local coping mechanisms. Land Use Policy 2015, 42, 1–6. [Google Scholar] [CrossRef]
  8. Avriel-Avni, N.; Rofè, Y.; Scheinkman-Shachar, F. Spatial Modeling of Landscape Values: Discovering the Boundaries of Conflicts and Identifying Mutual Benefits as a Basis for Land Management. Soc. Nat. Resour. 2020. [Google Scholar] [CrossRef]
  9. Maleki, J.; Masoumi, Z.; Hakimpour, F.; Coello, C.A.C. A spatial land-use planning support system based on game theory. Land Use Policy 2020, 99, 105013. [Google Scholar] [CrossRef]
  10. Yang, S.; Dou, S.B.; Li, C.X. Land-use conflict identification in urban fringe areas using the theory of leading functional space partition. Soc. Sci. J. 2020, 10, 1–16. [Google Scholar] [CrossRef]
  11. Malczewski, J. GIS-based multicriteria decision analysis: A survey of the literature. Int. J. Geogr. Inf. Sci. 2006, 20, 703–726. [Google Scholar] [CrossRef]
  12. Demesouka, O.E.; Anagnostopoulos, K.P.; Eleftherios, S. Spatial multicriteria decision support for robust land-use suitability: The case of landfill site selection in Northeastern Greece. Eur. J. Oper. Res. 2018, 272, 574–586. [Google Scholar] [CrossRef]
  13. Zou, L.; Liu, Y.; Wang, J.; Yang, Y.Y.; Wang, Y.S. Land use conflict identification and sustainable development scenario Simulation on China’s southeast coast. J. Clean. Prod. 2019, 238, 117899. [Google Scholar] [CrossRef]
  14. Zou, L.L.; Liu, Y.S.; Wang, Y.Y. An analysis of land use conflict potentials based on ecological-production-living function in the southeast coastal area of China. Ecol. Indic. 2021, 122, 107297. [Google Scholar] [CrossRef]
  15. Yu, S.H.; Deng, W.; Xu, Y.X.; Zhang, X.; Xiang, H.L. Evaluation of the production-living-ecology space function suitability of Pingshan County in the Taihang mountainous area, China. J. Mt. Sci. 2020, 17, 2562–2576. [Google Scholar] [CrossRef]
  16. Miller, J.A.; Hanham, R.Q. Spatial nonstationarity and the scale of species-environment relationships in the Mojave Desert, California, USA. Int. J. Geogr. Inf. Sci. 2011, 25, 423–438. [Google Scholar] [CrossRef]
  17. Liang, H.D.; Guo, J.Z.Y.; Wu, J.P.; Chen, Z.Q. GDP spatialization in Ningbo City based on NPP/VIIRS night-time light and auxiliary data using random forest regression. Adv. Space Res. 2020, 65, 481–493. [Google Scholar] [CrossRef]
  18. Ningbo Municipal Statistics Bureau. Statistical bulletin of national economic and social development of Ningbo in 2020. Ningbo Munic. Stat. Bur. 2021. [Google Scholar]
  19. Feng, Y.J.; Yang, Q.Q.; Tong, X.H.; Wang, J.F. Long-Term Regional Environmental Risk Assessment and Future Scenario Projection at Ningbo, China Coupling the Impact of Sea Level Rise. Sustainability 2019, 11, 1560. [Google Scholar] [CrossRef] [Green Version]
  20. Feng, Y.J.; Yang, Q.Q.; Tong, X.H.; Chen, L.J. Evaluating land ecological security and examining its relationships with driving factors using GIS and generalized additive model. Sci. Total Environ. 2018, 633, 1469–1479. [Google Scholar] [CrossRef] [PubMed]
  21. Li, Y.; Wei, B.Q.; Suo, A.N.; Zhang, Z.F.; Xu, Y.; Liang, Y.H. Spatial and Temporal Coupling Relationships of Coastline Exploitation and Environmental Carrying Safety in Ningbo, China. J. Coast. Res. 2020, 36, 1292–1301. [Google Scholar] [CrossRef]
  22. Xu, X.L.; Liu, J.Y.; Zhang, S.W.; Li, R.D.; Yan, C.Z.; Wu, S.X. Multi Period Land Use and Land Cover Remote Sensing Monitoring Data Set in China (CNLUCC). 2018. Available online: http://www.resdc.cn/DOI (accessed on 25 January 2021).
  23. Cui, J.X.; Kong, X.S.; Chen, J.; Sun, J.W.; Zhu, Y.Y. Spatially Explicit Evaluation and Driving Factor Identification of Land Use Conflict in Yangtze River Economic Belt. Land 2021, 10, 43. [Google Scholar] [CrossRef]
  24. Zhou, D.; Lin, Z.L.; Lim, S.H. Spatial characteristics and risk factor identification for land use spatial conflicts in a rapid urbanization region in China. Environ. Monit. Assess. 2019, 191, 677. [Google Scholar] [CrossRef] [PubMed]
  25. Wassenaar, T.; Gerber, P.; Verburg, P.H.; Rosales, M.; Ibrahim, M.; Steinfeld, H. Projecting land use changes in the Neotropics: The geography of pasture expansion into forest. Glob. Environ. Chang. 2007, 17, 86–104. [Google Scholar] [CrossRef]
  26. Jiang, S.; Meng, J.; Zhu, L. Spatial and temporal analyses of potential land use conflict under the constraints of water resources in the middle reaches of the Heihe River. Land Use Policy 2020, 97, 104773. [Google Scholar] [CrossRef]
  27. Xiao, L.L.; Liu, Q.Q.; Yu, H.; Lin, M.S. Community regulation in national park based on land use conflict identification: A case study on Qianjiangyuan National Park. Acta Ecol. Sin. 2020, 40, 7277–7286. [Google Scholar]
  28. Jiang, L.; Bai, L.; Wu, Y.M. Coupling and Coordinating Degrees of Provincial Economy, Resources and Environment in China. J. Nat. Resour. 2017, 32, 788–799. [Google Scholar]
  29. Lu, H.; Zhou, L.; Chen, Y.; An, Y.; Hou, C. Degree of coupling and coordination of eco-economic system and the influencing factors: A case study in Yanchi County, Ningxia Hui Autonomous Region, China. J. Arid Land 2017, 9, 446–457. [Google Scholar] [CrossRef] [Green Version]
  30. Zhang, Z.F. Sustainable Land Use Goals, Challenges and Countermeasures in China for SDGs. China Land Sci. 2019, 33, 48–55. [Google Scholar]
  31. Zhang, X.S.; Xu, Z.J. Functional Coupling Degree and Human Activity Intensity of Production–Living–Ecological Space in Underdeveloped Regions in China: Case Study of Guizhou Province. Land 2021, 10, 56. [Google Scholar] [CrossRef]
  32. Lu, C.Y.; Li, L.; Lei, Y.F.; Ren, C.Y.; Su, Y.; Huang, Y.F.; Chen, Y.; Lei, S.H.; Fu, W.W. Coupling Coordination Relationship between Urban Sprawl and Urbanization Quality in the West Taiwan Strait Urban Agglomeration, China: Observation and Analysis from DMSP/OLS Nighttime Light Imagery and Panel Data. Remote Sens. 2020, 12, 32217. [Google Scholar] [CrossRef]
  33. Wei, C.; Lin, Q.W.; Yu, L.; Zhang, H.W.; Ye, S.; Zhang, D. Research on Sustainable Land Use Based on Production–Living–Ecological Function: A Case Study of Hubei Province, China. Sustainability 2021, 13, 996. [Google Scholar] [CrossRef]
  34. Wang, K.; Tang, Y.K.; Chen, Y.Z.; Shang, L.W.; Ji, X.M.; Yao, M.C.; Wang, P. The Coupling and Coordinated Development from Urban Land Using Benefits and Urbanization Level: Case Study from Fujian Province (China). Int. J. Environ. Res. Public Health 2020, 17, 5647. [Google Scholar] [CrossRef] [PubMed]
  35. Zhu, S.Y.; Diao, C.L.; Xiao, W.B.; Chen, Q.C.; Wang, H. Convenience Index of Public Transportation for Urban Tourist Attraction: Based on Investigation in Wuhan. J. Transp. Syst. Eng. Inf. Technol. 2021, 21, 169–175. [Google Scholar]
  36. Wan, J.; Zhang, L.W.; Yan, J.P.; Wang, X.M.; Wang, T. Spatial–Temporal Characteristics and Influencing Factors of Coupled Coordination between Urbanization and Eco-Environment: A Case Study of 13 Urban Agglomerations in China. Sustainability 2020, 12, 8821. [Google Scholar] [CrossRef]
  37. Wang, D.; Jiang, D.; Fu, J.Y.; Lin, G.; Zhang, J.L. Comprehensive Assessment of Production–Living– Ecological Space Based on the Coupling Coordination Degree Model. Sustainability 2020, 12, 2009. [Google Scholar] [CrossRef] [Green Version]
  38. United Nations. Transforming Our World: The 2030 Agenda for Sustainable Development; United Nations: New York, NY, USA, 2015. [Google Scholar]
  39. Wang, J.; Fan, X.Y. Assessment of Residents’ Health Level Based on Fuzzy Comprehensive Evaluation. J. Guizhou Univ. 2020, 37, 30–34. [Google Scholar]
  40. Wang, Z.; Ma, H. Research on Integration Model of Multi-scale Basic Geographic Information Data: Taking Xianyang City as an Example. Geomat. Spat. Inf. Technol. 2019, 42, 150–152. [Google Scholar]
Figure 1. PLES in Ningbo for (a) 2010 and (b) 2018.
Land 10 00383 g001
Figure 2. Suitability evaluation of PLES in Ningbo for (a) production space, (b) living space, and (c) ecological space in 2010; and (d) production space, (e) living space, and (f) ecological space in 2018.
Land 10 00383 g002
Figure 3. Coupling coordination degree of PLES suitability in Ningbo for (a) 2010 and (b) 2018.
Land 10 00383 g003
Figure 4. Sustainable development evaluation of PLES in Ningbo for (a) 2010 and (b) 2018.
Land 10 00383 g004
Figure 5. Multiscale PLES conflict identification in Ningbo for (a) 2010 and (b) 2018.
Land 10 00383 g005
Table 1. Corresponding table of type between production–living–ecological space (PLES) and land use.
PLES ClassificationLand-Use/-Cover Classification System for Remote-Sensing Monitoring in China [22]
PSAgricultural-production spacePaddy fields, dry land
Industrial-production spaceIndustry and mining, land use for transport construction
LSUrban-living spaceUrban land
Rural-living spaceRural residential land
ESForestland ecological spaceWoodland, shrub land, open forest land, other woodland
Grassland ecological spaceGrassland with high, medium, and low coverage
Water ecological spaceCanals, lakes, reservoir pit ponds, permanent glaciers and snowfields, tidal flats, bottomland
Other ecological spaceSandy land, Gobi, saline alkali land, swamp land, bare land, bare rock land, and other unused land
Table 2. Index system of PLES suitability evaluation.
ItemsIndexFactor Classification and Score [14,23,24,25,26,27]
100806040
Production
suitability
Average annual temperature≥21>18–21>15–18≤15
Annual precipitation≥1800>1700–1800>1600–1700≤1600
Altitude<150 m>150–300 m>300–500 m>500 m
Land use typeDry land, paddy field, other construction land Rural land, urban landGrassland with high coverageOthers
Gradient<3°3°–8°8°–15°15°–25°
Distance from road (m)500 m1500 m3000 m5000 m
Living
suitability
Average annual temperature≥21>18–21>15–18≤15
Annual precipitation≥1800>1700–1800>1600–1700≤1600
Topographic position index≤0.540.54–0.620.62–0.72≥0.72
Distance from town center500 m1500 m3000 m5000 m
Distance from school and hospital500 m1500 m3000 m5000 m
Land use typeRural land, urban landOther construction landN/AOthers
Ecological
suitability
Land use typeOpen forest land, grassland with high coverage, swamp landshrub land, canals, lakesDry land, paddy fields, woodland, shrub land, other woodlands, grassland with medium and low coverage, reservoir pit pondsRural land, urban land, other construction land, and others
Landscape fragmentationBetter regularityGood regularityGeneral regularityBad regularity
Normalized difference vegetation index (NDVI)≥0.5>0.25–0.5>0.15–0.25≤0.15
Distance from water body5000 m3000 m1500 m500 m
Note: weight of each index determined using analytic hierarchy process (AHP) and expert scoring method. The topographic position index, calculated by the slope and the elevation, was used to reflect the influence from the comprehensive geomorphic conditions of Ningbo.
Table 3. Index system of spatial coupling coordination degree evaluation for sustainable development goals (SDGs).
ItemsSDGsFirst-Level IndicesSecond-Level Indices
Production space
(intensive and efficient)
SDGs 2 and 12Scale of production spaceScale of agricultural land [31]
Scale of industrial land [31]
Structure of production spaceAdvancement of industrial structure [32]
Efficiency of production spaceGrain output rate [33]
Land output rate [34]
Industrial efficiency [34]
Living space
(livable life)
SDGs 1 and 11Scale of living spaceSize of residential space [31]
Quality of livingGreen-space coverage ratio [33]
Engel’s coefficient of urban residents [33]
Convenience of livingTransportation convenient [35]
Traffic accessibility [36]
Ecological space
(beautiful ecology)
SDGs 3, 6, 13, and 15Scale of ecological spaceScale of ecological land [31]
NDVI [37]
Quality of ecological spaceAir quality [38]
Sewage treatment rate [32]
Health level of residents [39]
Publisher’s Note: MDPI stays neutral with regard to jurisdictional claims in published maps and institutional affiliations.

