
Optical Spectral Tools for Diagnosing Water Media Quality: A Case Study on the Angara/Yenisey River System in the Siberian Region


Abstract
1. Introduction
2. Material and Methods
- (1)
- In the summer of 1995, the US–Russian environmental and hydrophysical campaign took place on the Angara and Yenisei rivers in Siberia. The following organizations participated in this mission: US Naval Research Laboratory (Washington, DC, USA), US Naval Academy (Annapolis, MD, USA), Global Technologies Inc. (Idaho Falls, ID, USA), Institute of Ecoinformatics of the Russian Academy of Natural Sciences (Moscow, Russia), Kotelnikov Institute of Radioengineering and Electronics of the Russian Academy of Sciences (Moscow, Russia), and Irkutsk State University (Irkutsk, Russia). The 44 main results of this mission have been published in [21,44].
- (2)
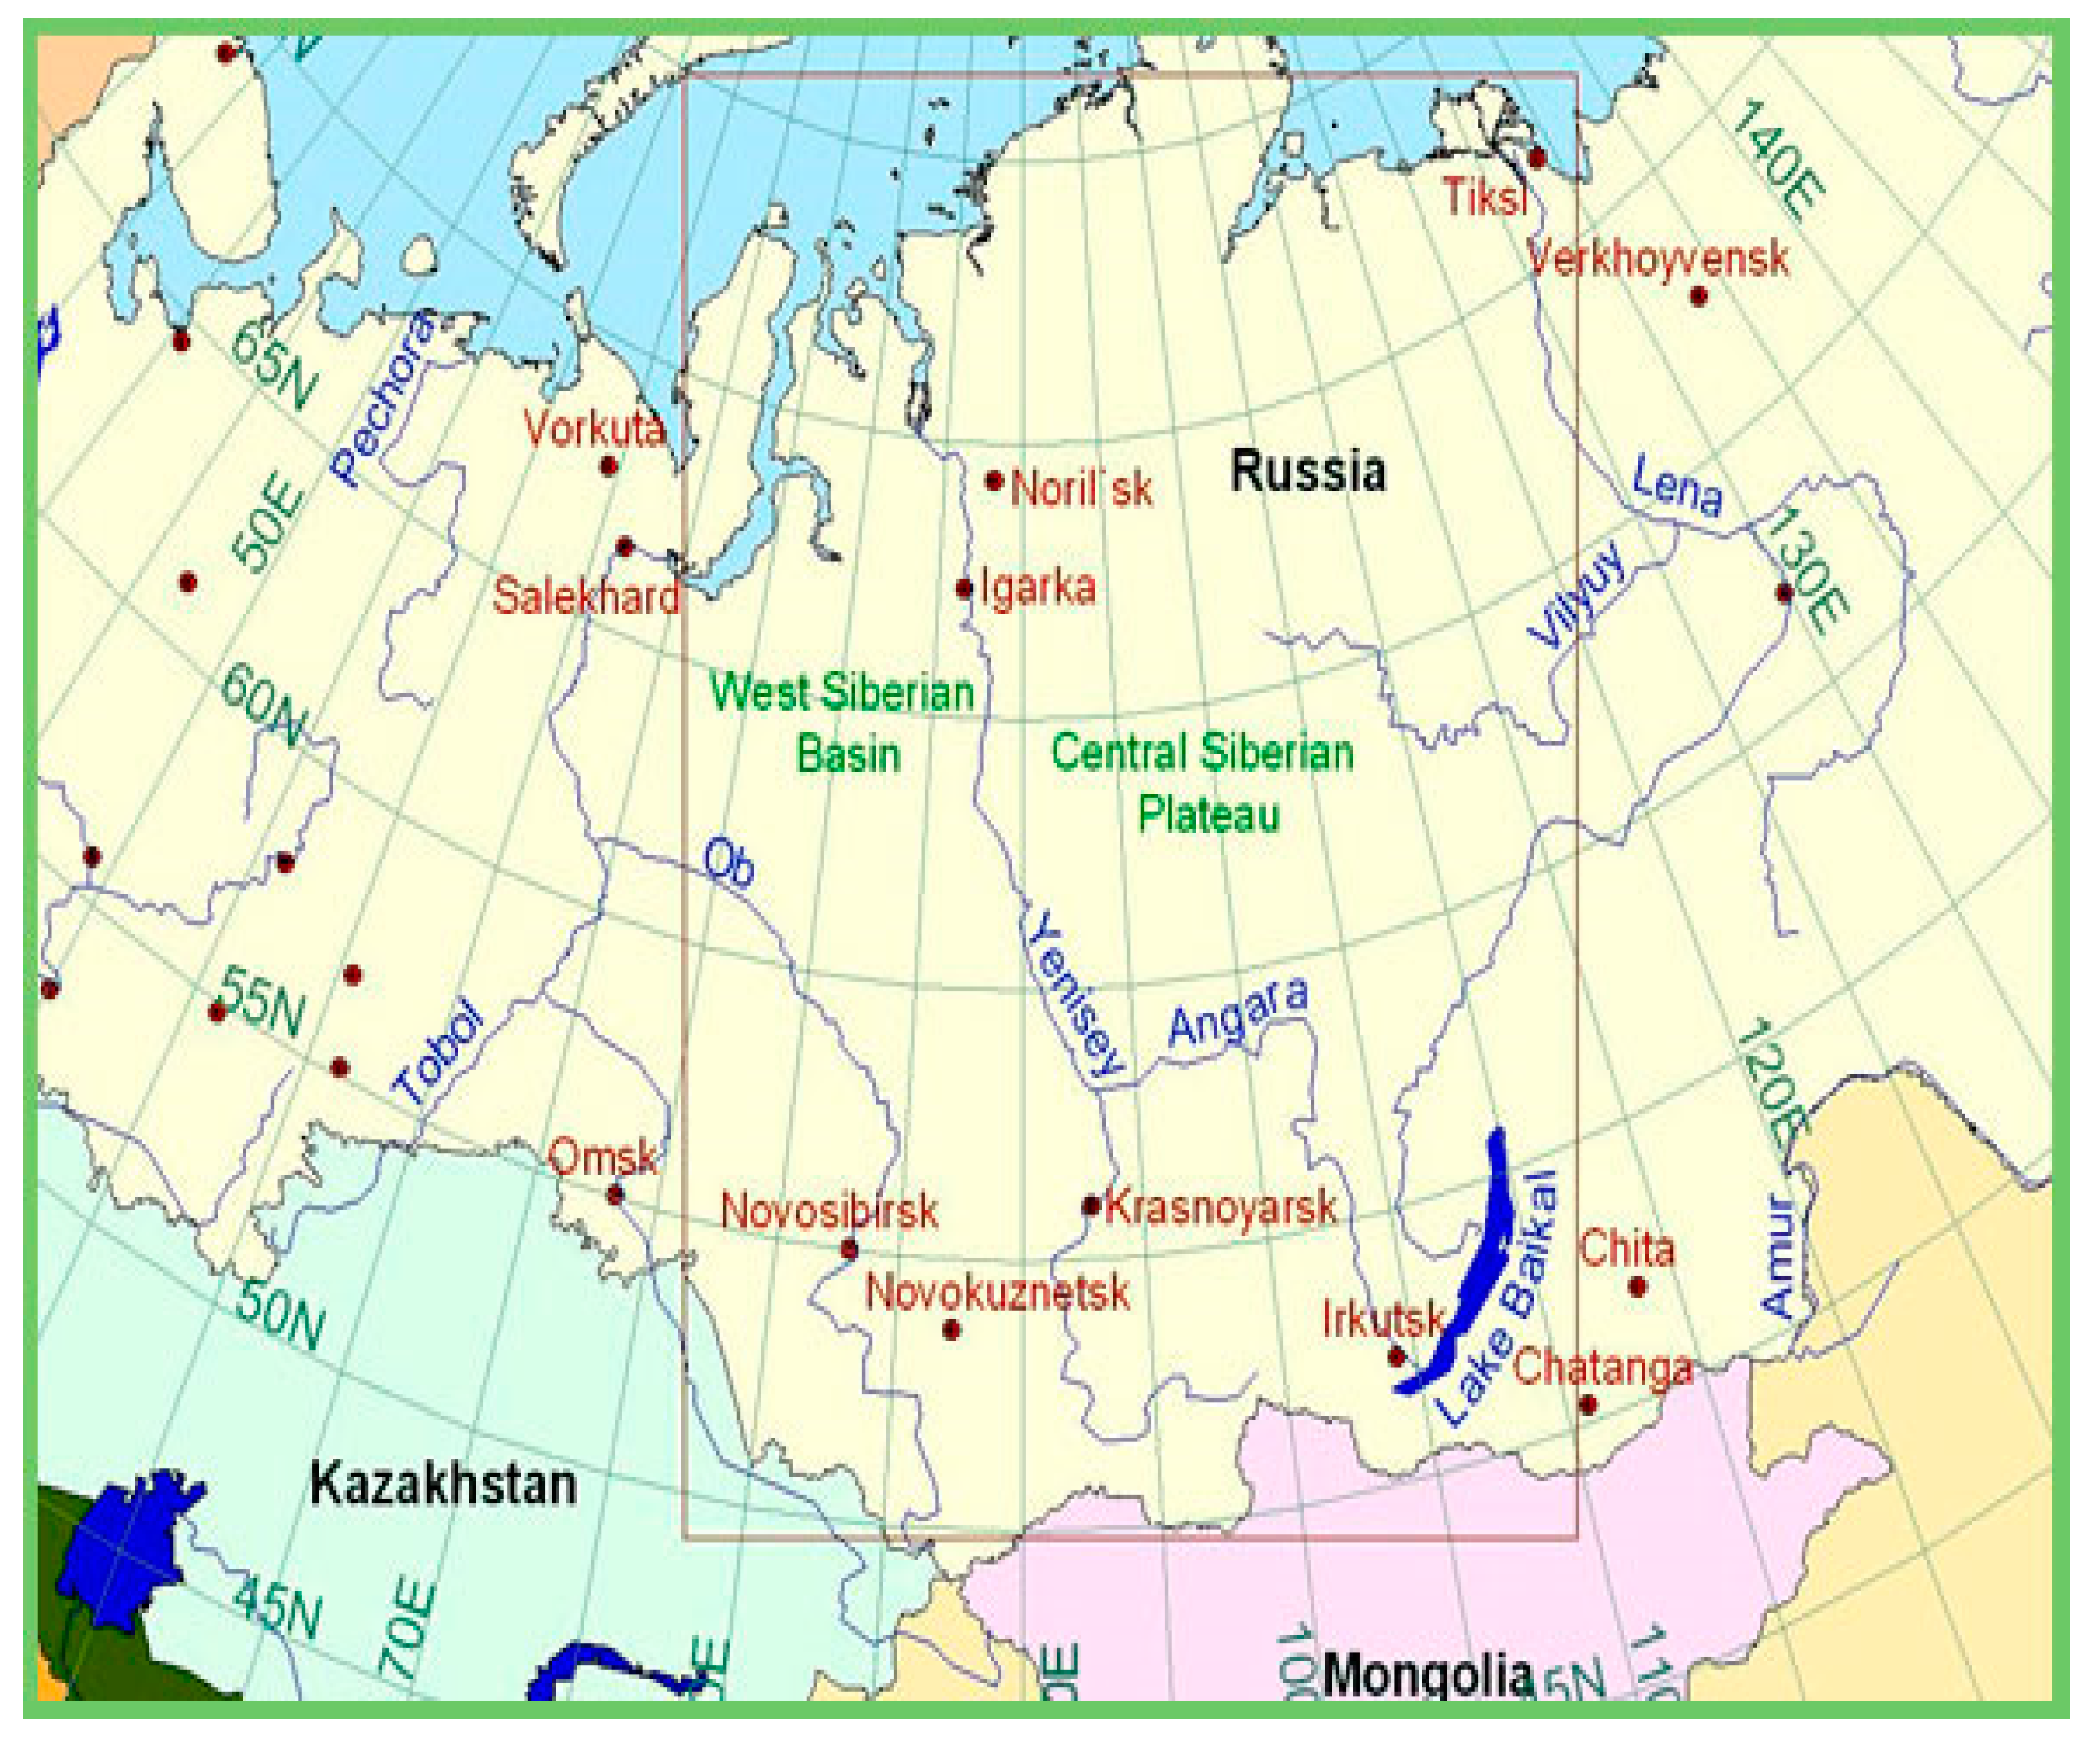
- In the summer of 2019, a hydrochemical expedition was organized by the Institute of Ecoinformatic Problems, Russian Academy of Natural Sciences (Moscow, Russia). This study was based on spectral optical field measurements and water sampling. During this mission, three optical multi-spectral devices were used to measure water quality directly in situ and by water sampling. Water samples were delivered to the laboratory where optical spectral and chemical analyses were performed. Maps of in situ measurements and sample locations are shown in Figure 2.
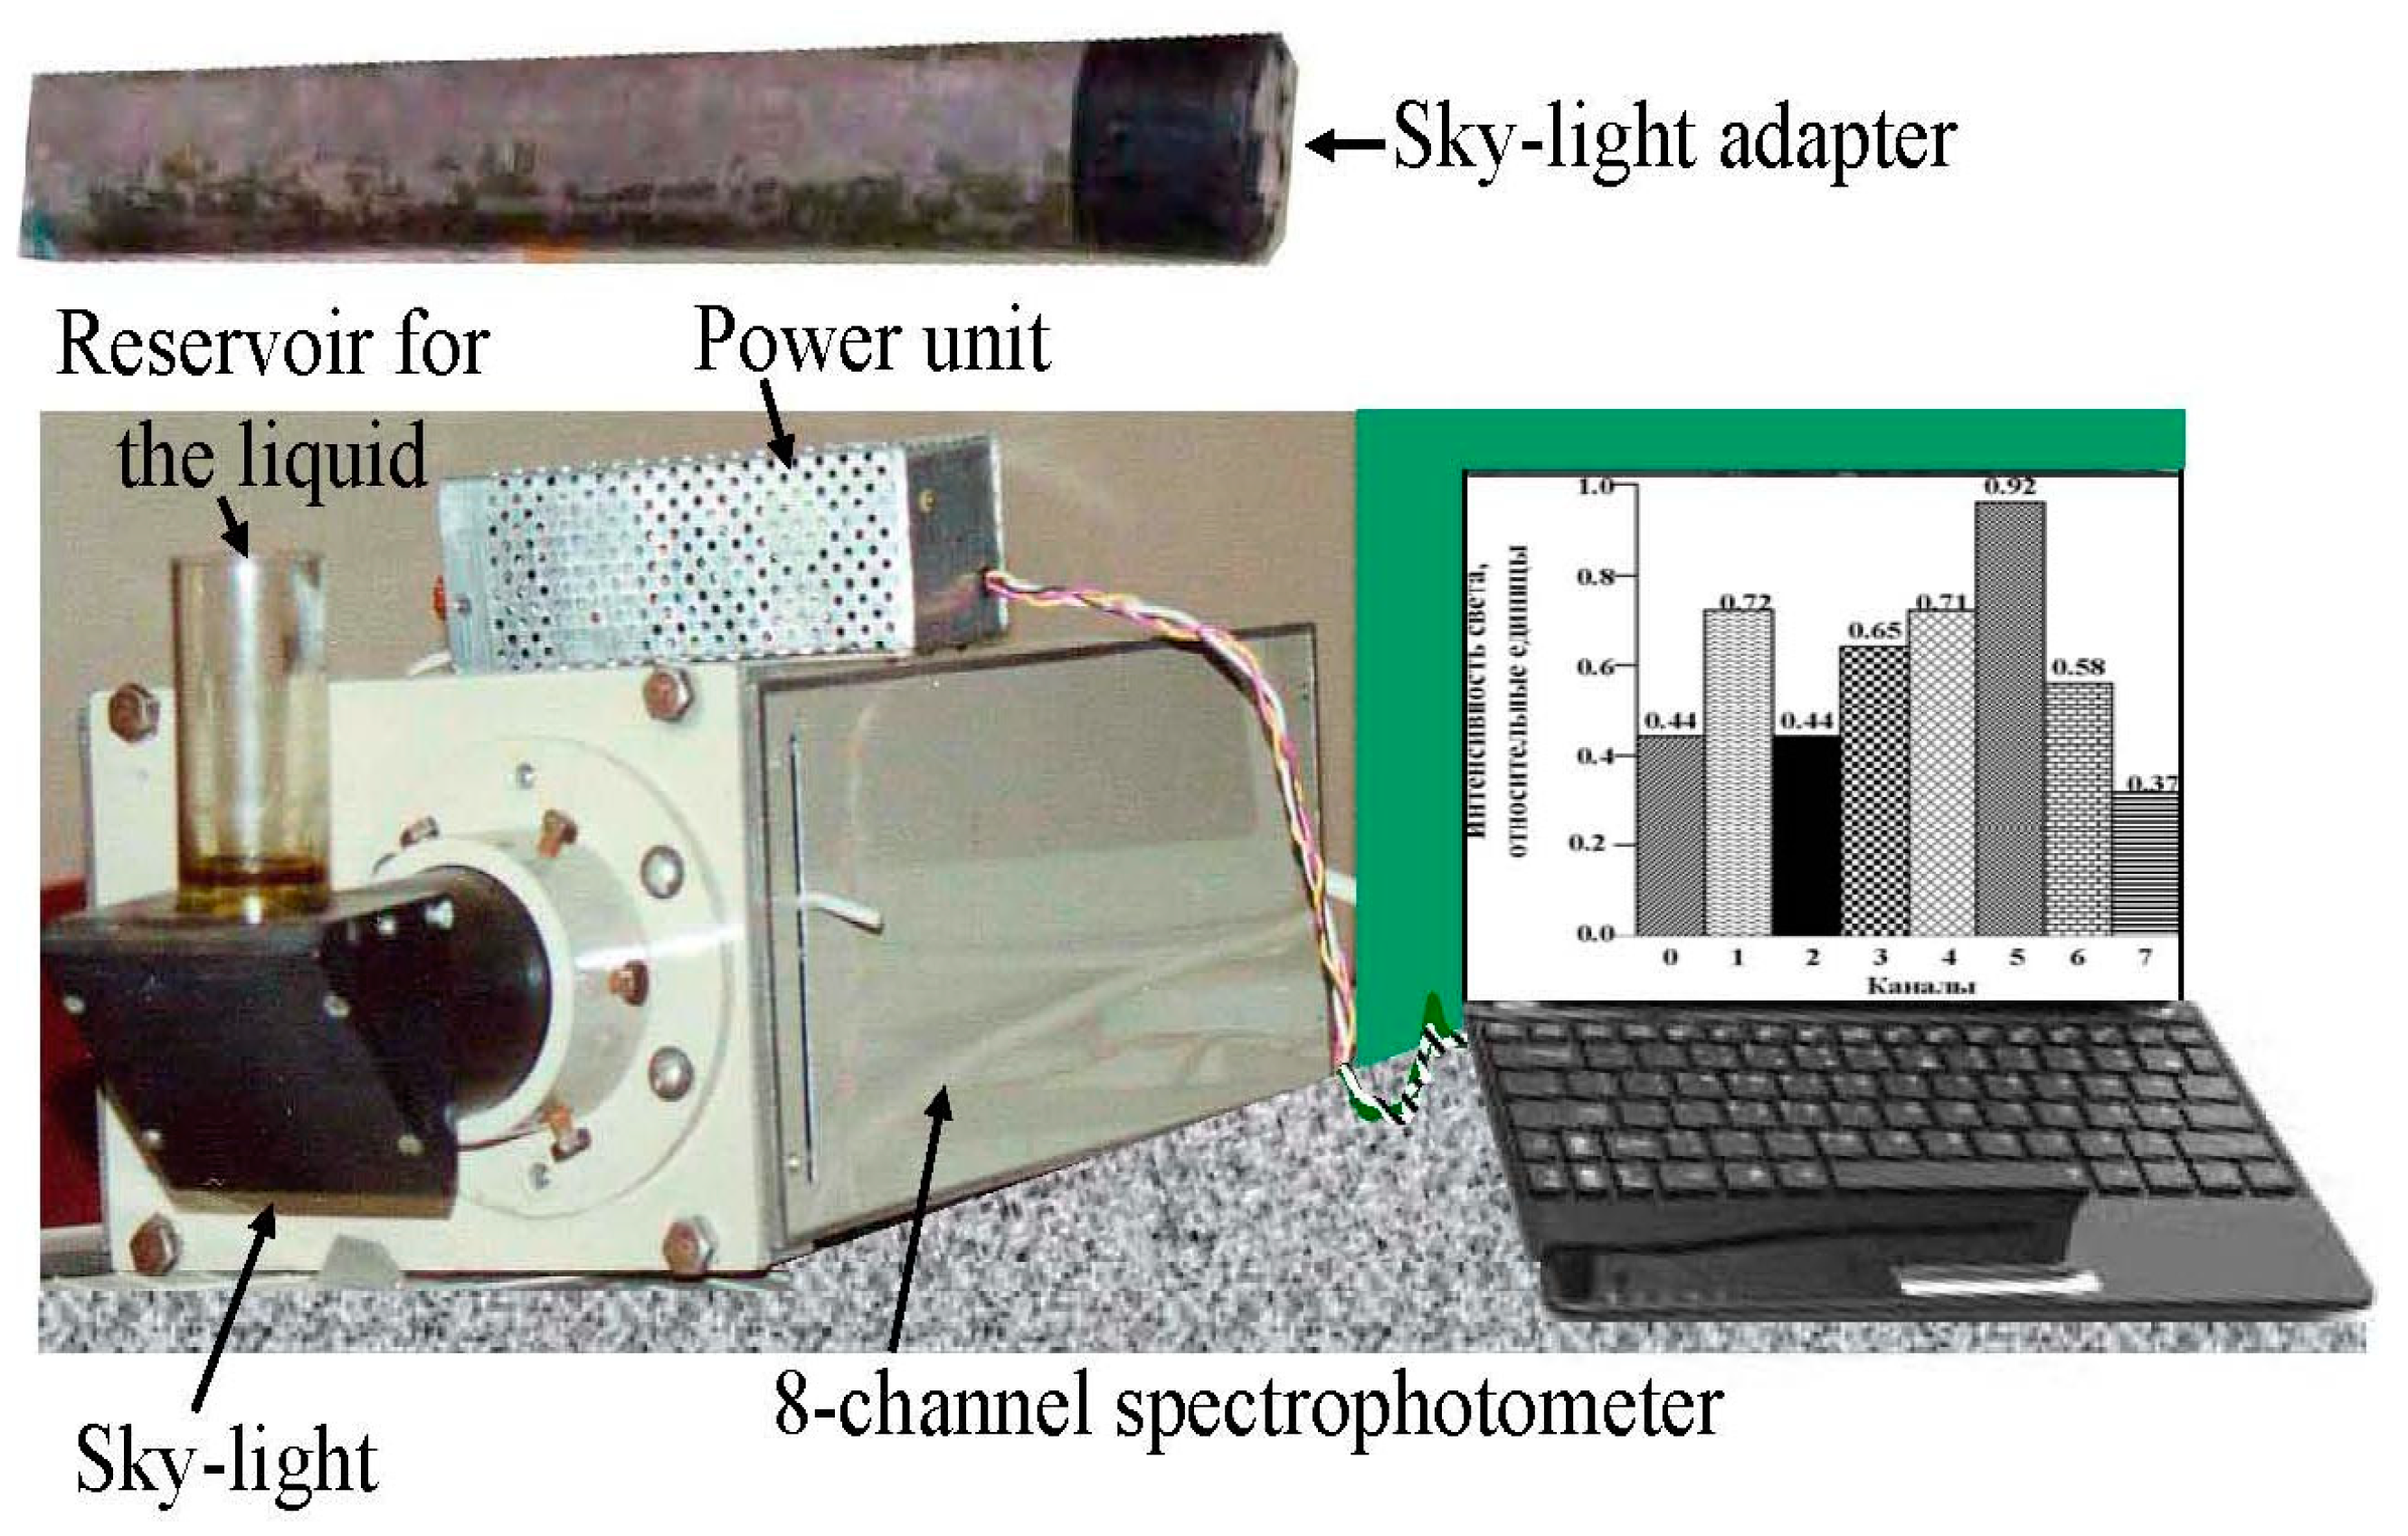
- direct measurement of the water relaxation coefficient by immersing part of the sky-adapter into the water environment;
- formation of a spectral image of the water sample located in the special reservoir; and
- formation of a spectral image of the water surface when the sky-adapter is directed towards it.
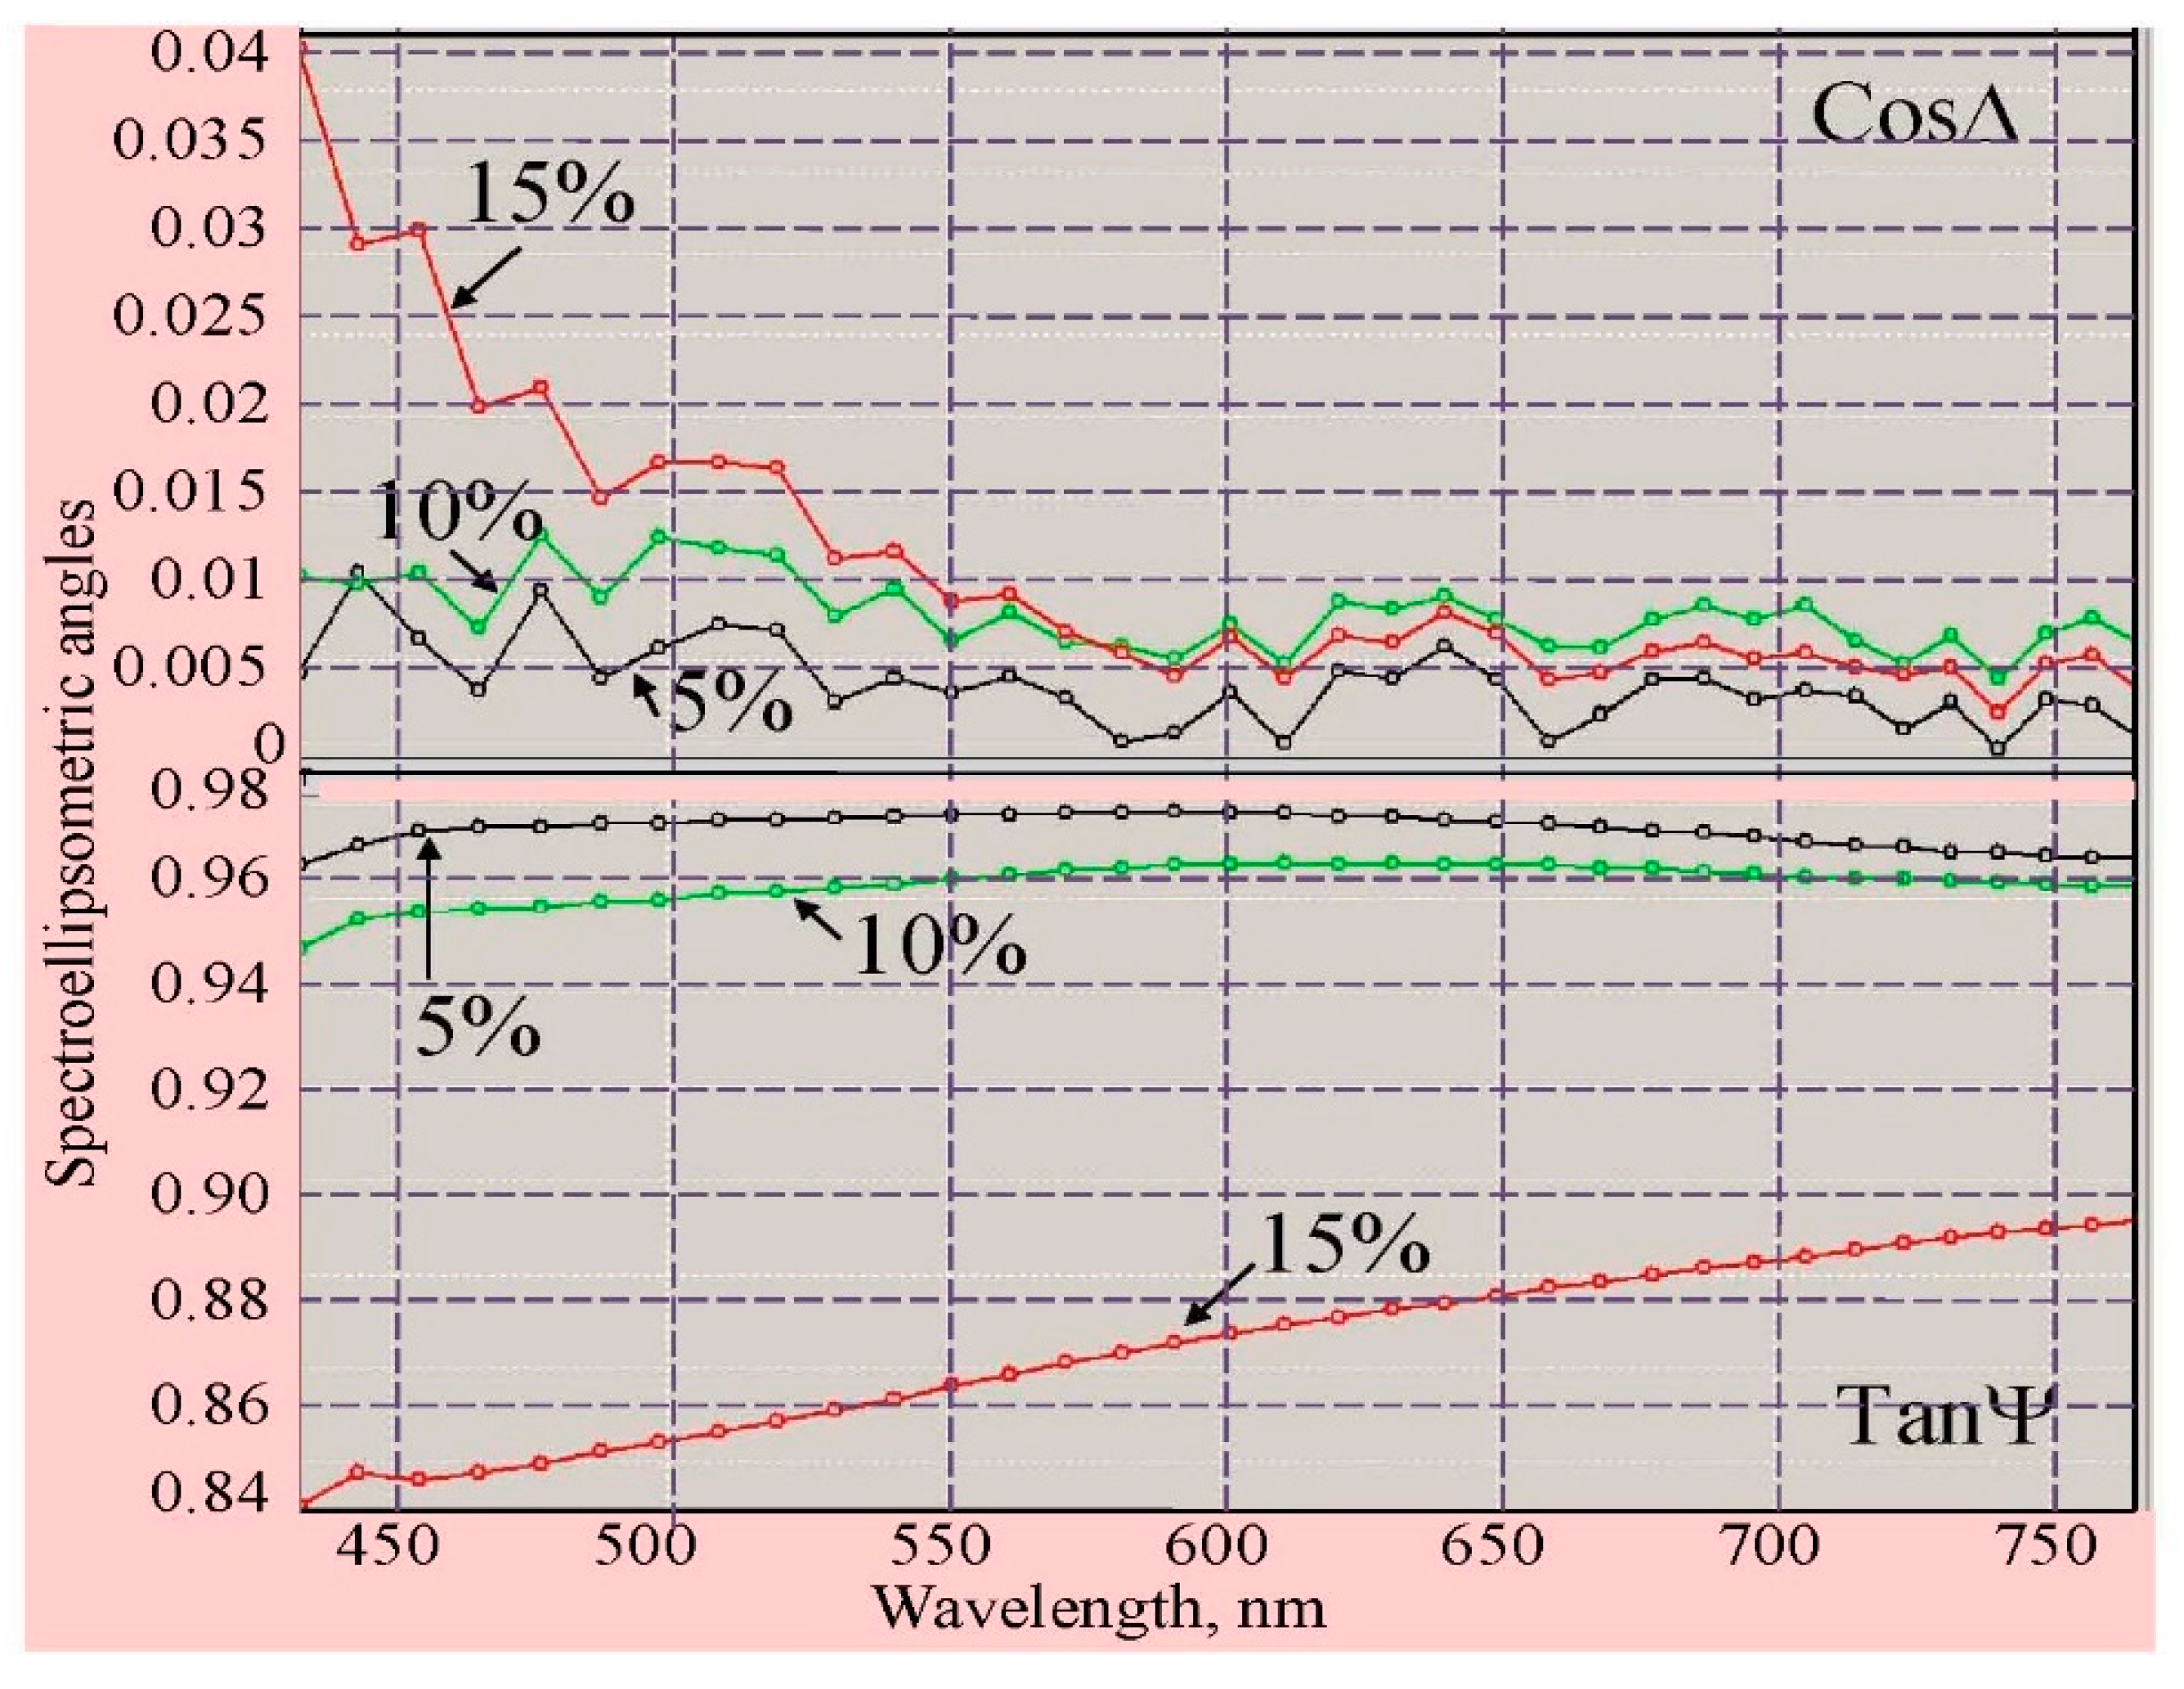
- SΨ(λ,η)—spectral distribution of the tangent of the spectroellipsometric angle Ψ.
- SΔ(λ,η)—spectral distribution of the cosine of the spectroellipsometric angle Δ.
- C1Ψ (C1Δ) is an area below the spectral curve.
- C2Ψ (C2Δ) and C3Ψ (C3Δ) are the maximum and minimum coordinates of the spectral curves, respectively.
- C4Ψ (C4Δ) is the maximum distance between maximum and minimum coordinates.
- C5Ψ (C5Δ) and C6Ψ (C6Δ) are the maximum values of the first and second derivatives of the spectral curve, respectively.
- C7Ψ (C7Δ) is the number of maximum spectral curves.
- C8Ψ (C8Δ) and C9Ψ (C9Δ) are the values of the spectrum coordinates at selected wavelengths λ* and λ**.
- C10Ψ (C10Δ) is the relationship between the wavelength range evaluated for the maximum and minimum coordinates of the spectral curve.
- monitoring of water quality in Lake Sevan (Armenia) [40].
3. Results and Discussion
4. Conclusions
Author Contributions
Funding
Institutional Review Board Statement
Informed Consent Statement
Data Availability Statement
Conflicts of Interest
References
- Polyak, L. Siberian River Run-off in the Kara Sea: Characterisation, quantification, variability and environmental significance. Eos 2004, 85, 203–204. [Google Scholar] [CrossRef][Green Version]
- Holmes, R.M.; Peterson, B.J.; Zulidov, V.V.; Gordeev, V. Nutrient chemistry of the Ob’ and Yenisey Rivers, Siberia: Results from June 2000 Expedition and evaluation of long-term data sets. Mar. Chem. 2001, 75, 219–227. [Google Scholar] [CrossRef]
- Herrault, P.-A.; Gandois, L.; Gascoin, S.; Teisserenc, R. Using high spatio-temporal optical remote sensing to monitor dissolved organic carbon in the arctic River Yenisei. Remote Sens. 2016, 8, 803. [Google Scholar] [CrossRef]
- Obolkin, V.; Khodzher, T.; Sorokovikova, L.; Netsvetaeva, O.; Golobokova, L. Effect of long-range transport of sulphur and nitrogen oxides from large coal power plants on acidification of river waters in the Baikal region, East Siberia. Int. J. Environ. Stud. 2016, 73, 452–461. [Google Scholar] [CrossRef]
- Makkaveev, P.N.; Polukhin, A.A.; Nalbandov, Y.R.; Khlebopashev, P.V. Dynamics of nutrients in the Yenisei gulf during the open water period. J. Arct. Ecol. Econ. 2019, 4, 69–82. (In Russian) [Google Scholar] [CrossRef]
- Varotsos, C.A.; Krapivin, V.F. Microwave Remote Sensing Tools in Environmental Science; Springer: Cham, Switzerland, 2020; p. 457. [Google Scholar]
- Cracknell, A.P.; Varotsos, C.A. Editorial and cover: Fifty years after the first artificial satellite: From Sputnik 1 to Envisat. Int. J. Remote Sens. 2007, 28, 2071–2072. [Google Scholar] [CrossRef]
- Cracknell, A.P.; Varotsos, C.A. New aspects of global climate-dynamics research and remote sensing. Int. J. Remote Sens. 2011, 32, 579–600. [Google Scholar] [CrossRef]
- Varotsos, C.A.; Krapivin, V.F. Pollution of Arctic waters has reached a critical point: An innovative approach to this problem. Water Air Soil Pollut. 2018, 229, 343. [Google Scholar] [CrossRef]
- Kondratyev, K.Y.; Krapivin, V.F.; Phillips, G.W. Global Environmental Change; Springer: Berlin/Heidelberg, Germany, 2002; p. 316. [Google Scholar]
- Dementiev, D.D.; Bolsunovsky, A.Y.; Borisov, R.V.; Trofimova, E. Concentrations of heavy metals in bottom sediments of the Yenisei River near Krasnoyarsk. Bull. Tomsk Politech. Univ. 2015, 326, 91–98. [Google Scholar]
- Karnaukhova, G.A. Water quality and protection: Environmental aspects hydrochemistry of the Angara and reservoirs of the Angara Cascade. Water Resour. 2008, 35, 71–79. [Google Scholar] [CrossRef]
- Alieva, V.I.; Pastukhov, M.V. Hydrochemical characteristic of the Angara river in the influence area of the Usolie industrial center. Geogr. Nat. Resour. 2012, 1, 68–73. [Google Scholar]
- Khodzher, T.V.; Domysheva, V.M.; Sorokovikova, L.M.; Tomberg, I.V.; Sakirko, M.V. Hydrochemical studies in Lake Baikal: History and nowadays. Limnol. Freshw. Biol. 2018, 1, 2–9. [Google Scholar] [CrossRef]
- Bychkov, I.V.; Gagarinova, O.V.; Orlova, I.I.; Bogdanov, V.N. Water protection zoning as an instrument of preservation for Lake Baikal. Water 2018, 10, 1474. [Google Scholar] [CrossRef]
- Savichev, O.G.; Matveenko, I.A. Evaluation of chemical composition changes of surface water in Boguchan Reservoir (Siberia, Russia). Hydrol. Sci. J. 2013, 58, 706–715. [Google Scholar] [CrossRef]
- Sorokovikova, L.M. Transformation of main ions and water mineralization of the Yenisey River under flow regulation. Water Resour. 1993, 20, 277–282. [Google Scholar]
- Kuzmin, M.I.; Tarasova, E.; Mamontova, E.A.; Mamontov, A. Seasonal and interannual variations of water chemistry in the headwater streams of the Angara River (Baikal) from 1950 to 2010. Geochem. Int. 2014, 52, 523–532. [Google Scholar] [CrossRef]
- Tarasova, E.; Mamontova, E.E. Features of seasonal and inter-annual variability of chemical composition of Angara River origin. Geokhimia 2014, 7, 579–589. (In Russian) [Google Scholar]
- Krapivin, V.F.; Phillips, G.W. Application of a global model to the study of Arctic basin pollution: Radionuclides, heavy metals and oil carbohydrates. Environ. Model. Softw. 2001, 16, 1–17. [Google Scholar] [CrossRef]
- Krapivin, V.F.; Cherepenin, V.A.; Phillips, G.W.; August, R.A.; Pautkin, A.Y.; Harper, M.J.; Tsang, F.Y. An application of modeling technology to the study of radionuclear pollutants and heavy metals dynamics in the Angara-Yenisey river system. Ecol. Model. 1998, 111, 121–134. [Google Scholar] [CrossRef]
- Krapivin, V.F.; Varotsos, C.A.; Soldatov, V.Y. New Ecoinformatics Tools in Environmental Science: Applications and Decision-Making; Springer: London, UK, 2015; p. 903. [Google Scholar]
- Andreeva, E.N. The Russian Arctic coastal zone management problems: Past lessons and new realities. Ocean Coast. Manag. 1998, 41, 237–256. [Google Scholar] [CrossRef]
- Flint, M.V. (Ed.) Ecosystem of Kara Sea: New data of expedition investigations. In Proceedings of the Scientific Conference, Oceanology Institute, Moscow, Russia, 27–29 May 2015; p. 320. [Google Scholar]
- Savenko, A.; Pokrovsky, O.; Strelerskaya, I. Distribution of Dissolved Chemical Elements in the Yenisei River Estuary and Adjacent Water Area of the Kara Sea; Russian State Hydrometeorological University: Saint-Petersburg, Russia, 2016; p. 210. [Google Scholar]
- Kondratyev, K.Y.; Krapivin, V.F.; Phillips, G.W. High Latitude Environmental Pollution Problems; Nansen International Environmental and Remote Sensing Center: Saint-Petersburg, Russia, 2002; p. 279. [Google Scholar]
- Vyruchalkina, T.Y. Lake Baikal and the Angara River before and after the construction of reservoirs. Water Resour. 2004, 31, 483–489. [Google Scholar] [CrossRef]
- Suslova, M.Y.; Grebenshchikova, V.I. Water quality monitoring of the Angara River source. Limnol. Freshw. Biol. 2020, 4, 1040–1041. [Google Scholar] [CrossRef]
- Dementiev, D.D.; Bolsunovsky, A.Y.; Borisov, R.V.; Alexandrova, Y.V. Concentrations of metals in water of the Yenisei River between Krasnoyarsk and the Angara River outfall in 2010–Bulletin of the Tomsk Polytechnic University. Geo Assets Eng. 2017, 328, 54–63. [Google Scholar]
- Karnaukhova, G.A. Sedimentation system of the Angara River after regulation of its flow. Doclady Earth Sci. 2007, 413, 351–353. [Google Scholar] [CrossRef]
- Pastukhov, M.V.; Poletaeva, V.I.; Tirskikh, E.N. Long-term dynamics of mercury pollution of the Bratsk reservoir bottom sediments, Baikal region, Russia. IOP Conf. Ser. Earth Environ. Sci. 2019, 321, 1–6. [Google Scholar] [CrossRef]
- Karnaukhova, G.A. Lithological—Geochemical differentiation of bottom deposits in the Angara Cascade reservoirs. Geochem. Int. 2007, 45, 390–398. [Google Scholar] [CrossRef]
- Yushkov, N.N.; Erofeeva, M.R.; Sinegibskaya, A.D. Influence of the economic entities operating on the territory of Bratsk on the state of environmental components. Syst. Methods Technol. 2015, 27, 128–138. (In Russian) [Google Scholar]
- Timoshkin, O.A.; Moore, M.V.; Kulikova, N.N.; Tomberg, I.V.; Malnik, V.V.; Shimaraev, M.N.; Troitskaya, E.S.; Shirokaya, A.A.; Sinyukovich, V.N.; Zaitseva, E.P.; et al. Groundwater contamination by sewage causes benthic algal outbreaks in the littoral zone of Lake Baikal (East Siberia). J. Great Lakes Res. 2018, 44, 230–244. [Google Scholar] [CrossRef]
- Nemirovskaya, I.A. Variability of concentration and composition of hydrocarbons in frontal zones of the Kara Sea. Oceanology 2015, 55, 497–507. [Google Scholar] [CrossRef]
- Kohler, H.; Meon, B.; Gordeev, V.V.; Spitzy, A.; Amon, R.M.W. Dissolved Organic Matter (DOM) in the estuaries of Ob and Yenisei and the adjacent Kara Sea, Russia. In Siberian River Run-off in the Kara Sea: Characterisation, Quantification; Stein, R., Fahl, K., Futterer, D.K., Galimov, E.M., Stepanets, O.V., Eds.; Elsevier Science: Amsterdam, The Netherlands, 2003; pp. 281–308. [Google Scholar]
- Karnaukhova, G.A. Belt zoning of sedimentation the Angara Cascade reservoirs. Geochem. Int. 2011, 49, 605–617. [Google Scholar] [CrossRef]
- Jagus, A.; Khak, V.; Rzetala, M.A.; Rzetala, M. Accumulation of heavy metals in the bottom sediments of the Irkutsk Reservoir. Int. J. Environ. Health 2013, 6, 350–362. [Google Scholar] [CrossRef]
- Mazaeva, O.; Khak, V.A.; Kozhyreva, E.A. Monitoring of local coastal geosystems of the Bratsk Reservoir. Geomorphology 2014, 1, 75–80. (In Russian) [Google Scholar] [CrossRef]
- Varotsos, C.A.; Krapivin, V.F.; Mkrtchyan, F.A.; Gevorkyan, S.A.; Tengfei, C. A novel approach to monitoring the quality of lakes water by optical and modeling tools: Lake Sevan as a case study. Water Air Soil Pollut. 2020, 231, 1–7. [Google Scholar] [CrossRef]
- Krapivin, V.F.; Mkrtchyan, F.A.; Potapov, I.I.; Soldatov, V.Y. Information-modeling technology for the Nuoc Ngot Lagoon diagnostics on the Vietnam coast. J. Sci. Technol. Binh Duong Univ. 2016, 9, 38–48. [Google Scholar]
- Krapivin, V.F.; Varotsos, C.A.; Nghia, B.Q. A modeling system for monitoring water quality in lagoons. Water Air Soil Pollut. 2017, 228, 1–12. [Google Scholar] [CrossRef]
- Vakulovsky, S.M.; Tertyshnik, E.G.; Kabanov, A.I. Radionuclide transport in the Yenisei River. At. Energy 2008, 105, 285–291. [Google Scholar] [CrossRef]
- Phillips, G.W.; August, R.A.; Cherepenin, V.A.; Harper, M.J.; King, S.E.; Krapivin, V.F.; Pautkin, A.Y.; Tsang, F.Y. Radionuclear pollutants in the Angara and Yenisey rivers of Siberia. Radioprot. Colloq. 1997, 32, 299–304. [Google Scholar]
- Varotsos, C.A.; Krapivin, V.F.; Mkrtchyan, F.A. New optical tools for water quality diagnostics. Water Air Soil Pollut. 2019, 230, 1–12. [Google Scholar] [CrossRef]
- Bolsunovskii, A.Y.; Degermendzhi, A.G.; Zhizhaev, A.M.; Rubailo, A.L.; Saprykin, A.I. First data on the uranium content in water of the Yenisei River Basin in the area affected by the operation of Rosatom plants. Doclady Earth Sci. 2011, 439, 1010–1015. [Google Scholar] [CrossRef]
- FLR. The Federal Law of Russia No. 94-FZ Dated 01.05.1999 “Concerning the Protection of Lake Baikal” (with Amendments as of 28 June 2014). Available online: http://pravo.gov.ru/proxy/ips/?docbody=&nd=102059482 (accessed on 8 August 2018).
- Boulion, V.V. Phosphorus budget of Lake Baikal and the Angara Cascade water reservoirs: Modeling, reconstruction, and prognosis. Doklady Biol. Sci. 2018, 480, 90–92. [Google Scholar] [CrossRef]
- Krapivin, V.F.; Varotsos, C.A. Biogeochemical Cycles in Globalization and Sustainable Development; Springer/Praxis: Chichester, UK, 2008; p. 562. [Google Scholar]
- Babicheva, V.A.; Rzetala, M.A. The main types of banks of Angara water reservoirs: Overview of the problem. In Proceedings of the 13th International Multidisciplinary Scientific Geoconference, Bulgaria, SGEM 2013, Albena, Bulgaria, 16–22 June 2013; Volume I, pp. 195–202. [Google Scholar]
- Bychkov, I.; Gachenko, A.; Rugnikov, G.; Hmelnov, A. 3-D modeling of Angara Riverbed. In Proceedings of the MIT-16: Mathematical and Information Technologies, Vrnjacka Banja, Serbia, 28–31 August 2016; pp. 26–32. [Google Scholar]
- Krapivin, V.F.; Nitu, C.; Varotsos, C.A. Microwave Remote Sensing Tools and Ecoinformatics; Matrix Rom: Bucharest, Romania, 2019; p. 332. [Google Scholar]
- Efstathiou, M.N.; Varotsos, C.A. On the altitude dependence of the temperature scaling behaviour at the global troposphere. International J. Remote Sens. 2010, 31, 343–349. [Google Scholar] [CrossRef]
- Varotsos, C.A.; Efstathiou, M.N.; Cracknell, A.P. On the scaling effect in global surface air temperature anomalies. Atmos. Chem. Phys. 2013, 13, 5243–5253. [Google Scholar] [CrossRef]
- Efstathiou, M.N.; Varotsos, C.A. Intrinsic properties of Sahel precipitation anomalies and rainfall. Theor. Appl. Climatol. 2012, 109, 627–633. [Google Scholar] [CrossRef]


| System | Characteristics |
|---|---|
| Universal 8-channel spectrophotometer (US-8) | The wavelength range is 380–700 nm. The weight of the measuring device is 6.2 kg. Spectrum recording time is 0.8 s. The US-8 can carry out in situ measurements (with and without sampling). |
| 35-channel spectrophotometer (SP-35) | The wavelength range is 300–800 nm. The weight of the device is 3.9 kg. Spectral image recording time is 0.5 s. Spectral measurements are performed when water samples are delivered. |
| 128-channel spectroellipsometric system (SS-128). | The spectral range is 380–780 nm. The weight of the measuring device is 5.4 kg. The recording time of two spectral images is 0.6 s. Water sampling is required. |
| Block | Description of the Block |
|---|---|
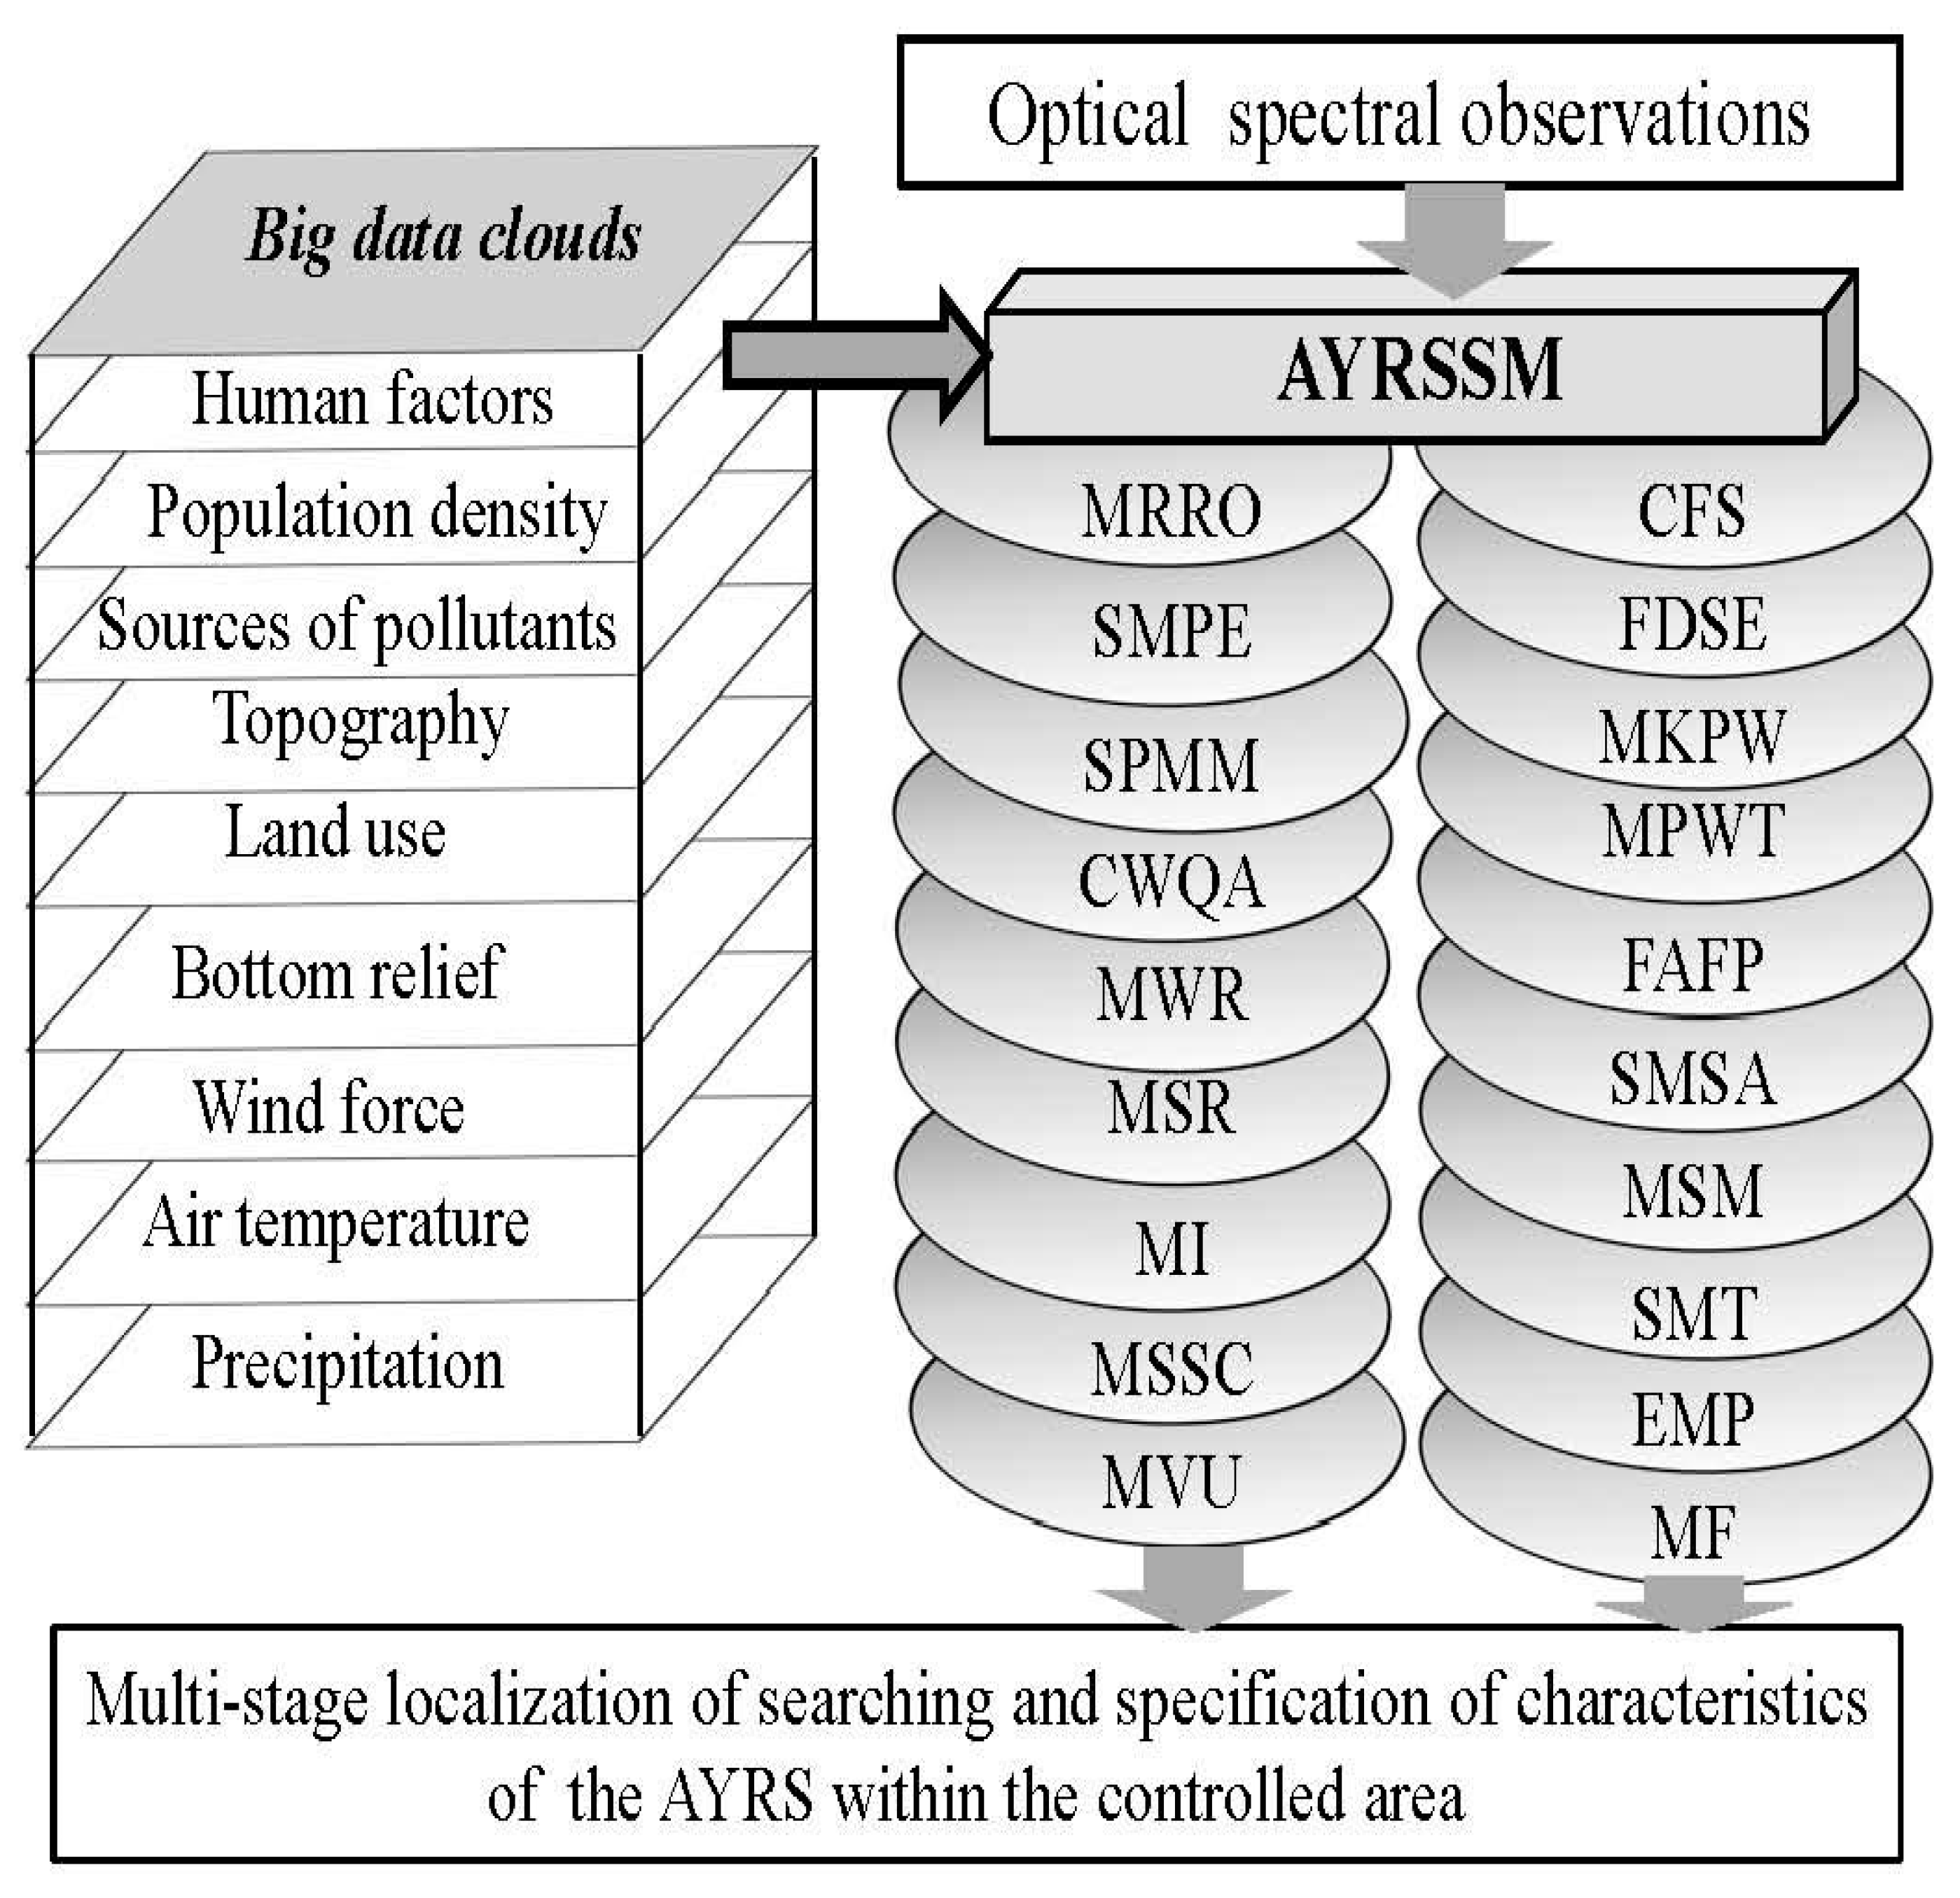
| MRRO | Model of the river run-off. |
| SPMM | Simulation procedures for modeling the water masses’ motion. |
| SMPE | Set of models to parameterize the evaporation process. |
| CWQA | Criteria for water quality assessment. |
| MWR | Model of water regime in a water body. |
| MSR | Model of spreading the river run-off across the river-bed. |
| MI | Model of infiltration. |
| MSSC | Model of the sink, taking into account the effect of vegetation and soil cover. |
| MVU | Model of vertical uplifting of ground water during evaporation, feeding, and exfiltration. |
| MF | Model of filtration. |
| EMP | An empirical model of precipitation. |
| SMT | A specified model of transpiration. |
| MSM | Model of snow melting and evaporation from the snow surface. |
| SMSA | A simulation model of sedimentation and biological assimilation of pollutants. |
| FAFP | The formation of anthropogenic fluxes of pollutants. |
| MPWT | Model of the process of the water temperature formation. |
| MKPW | Model of kinetics of chemical pollution of water. |
| FDSE | Formation of database of spectral etalons. |
| CFS | Choice and formation of scenario for the simulation experiment. |
| In-Situ Water Sampling | As | Cd | Cr | Cu | Ni | Pb | Zn |
|---|---|---|---|---|---|---|---|
| 20 km of Angara from Baikal | 3.15 | 0.21 | 0.09 | 1.21 | 10.2 | 0.36 | 10.5 |
| 30 km upstream from Irkutsk | 3.42 | 0.22 | 0.11 | 1.24 | 10.4 | 0.41 | 10.6 |
| Angarsk (Angara) | 8.3 | 0.36 | 0.23 | 1.43 | 13.3 | 1.07 | 11.2 |
| Bratsk (Angara) | 11.2 | 1.15 | 0.32 | 2.48 | 15.4 | 1.09 | 13.6 |
| Bratsk, 0.5 km above the dam (15 July 2019) | 11.2 | 1.17 | 0.32 | 2.52 | 15.6 | 1.12 | 13.6 |
| Bratsk, 0.5 km below the dam (15 July 2019) | 10.7 | 1.13 | 0.27 | 2.39 | 11.2 | 0.98 | 13.2 |
| Bratsk, 0.5 km above the dam (August 15, 2019) | 8.21 | 0.97 | 0.34 | 1.87 | 14.8 | 0.84 | 12.7 |
| Bratsk, 0.5 km below the dam (August 15, 2019) | 9.16 | 1.14 | 0.41 | 2.25 | 15.3 | 1.13 | 14.2 |
| Kazachinskoe (Yenisey) | 10.4 | 1.17 | 0.19 | 1.54 | 15.3 | 1.13 | 13.7 |
| Strelka (Angara flows into Yenisei) | 7.6 | 1.32 | 0.24 | 1.67 | 16.9 | 1.19 | 12.2 |
| Site | Distance from Lake Baikal, km | Selected Trace and Toxic Heavy Metals, μg/L | , mg/L | mg/L | mg/L | mg/L | mg/L | ||||
|---|---|---|---|---|---|---|---|---|---|---|---|
| Cd | Fe | Ni | Pb | As | |||||||
| 1 | 27 | 0.22 | 76.3 | 10.4 | 0.34 | 3.52 | 0.009 | 0.017 | 0.002 | 58.9 | 4.75 |
| 2 | 68 | 0.22 | 84.4 | 10.6 | 0.34 | 5.91 | 0.011 | 0.019 | 0.013 | 64.2 | 5.44 |
| 3 | 109 | 0.33 | 84.8 | 10.9 | 0.67 | 4.34 | 0.012 | 0.021 | 0.011 | 62.7 | 4.51 |
| 4 | 123 | 0.44 | 84.5 | 11.1 | 0.73 | 6.28 | 0.034 | 0.017 | 0.018 | 65.8 | 5.89 |
| 5 | 142 | 0.69 | 87.6 | 11.8 | 0.66 | 3.46 | 0.026 | 0.039 | 0.019 | 65.9 | 5.11 |
| 6 | 157 | 0.78 | 93.2 | 11.4 | 0.46 | 2.75 | 0.021 | 0.081 | 0.016 | 64.1 | 4.72 |
| 7 | 178 | 1.01 | 98.2 | 13.1 | 0.29 | 5.92 | 0.023 | 0.074 | 0.021 | 68.2 | 5.44 |
| 8 | 547 | 1.14 | 95.3 | 12.4 | 0.73 | 7.12 | 0.059 | 0.067 | 0.033 | 63.6 | 5.98 |
| 9 | 561 | 1.17 | 100.5 | 12.4 | 0.69 | 6.33 | 0.128 | 0.052 | 0.029 | 65.3 | 6.32 |
| 10 | 643 | 0.95 | 114.4 | 13.3 | 0.59 | 7.34 | 0.112 | 0.067 | 0.035 | 68.4 | 6.13 |
| 11 | 670 | 0.97 | 124.1 | 14.2 | 0.82 | 8.13 | 0.193 | 0.055 | 0.032 | 67.3 | 5.56 |
| 12 | 1665 | 1.21 | 120.3 | 16.1 | 0.67 | 7.92 | 0.178 | 0.076 | 0.019 | 71.7 | 6.18 |
| 13 | 1779 | 1.16 | 115.4 | 16.1 | 0.79 | 7.58 | 0.153 | 0.082 | 0.008 | 72.8 | 4.78 |
| 14 | 1888 | 1.18 | 116.7 | 16.3 | 0.92 | 7.66 | 0.195 | 0.089 | 0.003 | 73.4 | 5.31 |
| Site | 1995 | 2019 | ||
|---|---|---|---|---|
| Heavy Metals, μg/L | Oil Hydrocarbons, mg/L | Heavy Metals, μg/L | Oil Hydrocarbons, mg/L | |
| (1) Angara source | 7.5 | 0.016 | 7.3 | 0.023 |
| (2) Irkutsk, reservoir origin | 8.9 | 0.019 | 7.7 | 0.034 |
| (3) Irkutsk, below dam | 8.7 | 0.021 | 7.6 | 0.045 |
| (4) Above the Angarsk | 10.3 | 0.041 | 9.6 | 0.062 |
| (5) Angarsk City zone | 11.5 | 0.054 | 9.9 | 0.067 |
| (6) Below the Angarsk | 11.8 | 0.057 | 10.3 | 0.072 |
| (7) Usolye Sibirskoe | 13.7 | 0.077 | 11.4 | 0.083 |
| (8) Bratsk Sea | 12.6 | 0.084 | 11.6 | 0.088 |
| (9) Bratsk City zone | 12.8 | 0.089 | 11.8 | 0.094 |
| (10) Osinovka | 11.5 | 0.114 | 10.9 | 0.092 |
| (11) Below energetic | 10.9 | 0.091 | 10.7 | 0.099 |
| (12) Angara, Strelka | 12.4 | 0.182 | 11.6 | 0.176 |
| (13) Yenisei, Strelka | 13.6 | 0.099 | 12.7 | 0.112 |
| (14) Angara/Yenisey, below Strelka junction | 13.7 | 0.095 | 12.5 | 0.064 |
| Distance from the Angara Junction (Strelka) to Kara Sea, km | Heavy Metals, μg/L | , mg/L | mg/L | Oil Hydrocarbons, mg/L | mg/L | Mineralization, mg/L | mg/L |
|---|---|---|---|---|---|---|---|
| Strelka, 0 | 12.7 | 0.153 | 0.082 | 0.112 | 72.8 | 87.5 | 4.78 |
| Lesosibirsk, 45 | 12.1 | 0.188 | 0.089 | 0.083 | 72.9 | 89.3 | 5.22 |
| Novoselovo, 543 | 9.2 | 0.176 | 0.067 | 0.098 | 68.7 | 75.4 | 6.21 |
| Igarka, 1161 | 7.7 | 0.088 | 0.034 | 0.066 | 64.5 | 62.1 | 6.33 |
| Dudinka, 1405 | 6.9 | 0.063 | 0.012 | 0.045 | 57.3 | 54.8 | 5.25 |
| Karaul, 1837 | 5.7 | 0.013 | 0.0052 | 0.043 | 45.1 | 41.6 | 4.92 |
| Dickson, 2338 | 4.4 | 0.0015 | 0.0019 | 0.039 | 35.4 | 39.7 | 4.44 |
Publisher’s Note: MDPI stays neutral with regard to jurisdictional claims in published maps and institutional affiliations. |
© 2021 by the authors. Licensee MDPI, Basel, Switzerland. This article is an open access article distributed under the terms and conditions of the Creative Commons Attribution (CC BY) license (http://creativecommons.org/licenses/by/4.0/).
Share and Cite
Varotsos, C.A.; Krapivin, V.F.; Mkrtchyan, F.A.; Xue, Y. Optical Spectral Tools for Diagnosing Water Media Quality: A Case Study on the Angara/Yenisey River System in the Siberian Region. Land 2021, 10, 342. https://doi.org/10.3390/land10040342
Varotsos CA, Krapivin VF, Mkrtchyan FA, Xue Y. Optical Spectral Tools for Diagnosing Water Media Quality: A Case Study on the Angara/Yenisey River System in the Siberian Region. Land. 2021; 10(4):342. https://doi.org/10.3390/land10040342
Chicago/Turabian StyleVarotsos, Costas A., Vladimir F. Krapivin, Ferdenant A. Mkrtchyan, and Yong Xue. 2021. "Optical Spectral Tools for Diagnosing Water Media Quality: A Case Study on the Angara/Yenisey River System in the Siberian Region" Land 10, no. 4: 342. https://doi.org/10.3390/land10040342
APA StyleVarotsos, C. A., Krapivin, V. F., Mkrtchyan, F. A., & Xue, Y. (2021). Optical Spectral Tools for Diagnosing Water Media Quality: A Case Study on the Angara/Yenisey River System in the Siberian Region. Land, 10(4), 342. https://doi.org/10.3390/land10040342