Article

Change in the Level of Agricultural Development in the Context of Public Institutions’ Activities—A Case Study of the NASC Activities in Poland

Institute of Spatial Management and Geography, Department of Land Management and GIS, University of Warmia and Mazury in Olsztyn, 15 Prawochenskiego Street, 10-720 Olsztyn, Poland
*
Author to whom correspondence should be addressed.
Land 2021, 10(2), 187; https://doi.org/10.3390/land10020187
Submission received: 22 December 2020 / Revised: 31 January 2021 / Accepted: 10 February 2021 / Published: 13 February 2021

Abstract

:
Agricultural development is determined by various factors, such as environmental, economic, demographic, or social circumstances. In order to present the level of this development as com-prehensively as possible, a multidimensional analysis should be carried out with an appropriate methodology. In this article, a taxonomic approach known as the Hellwig’s method was used to determine the level of agricultural development. The area of research was the territory of Poland, divided into voivodships, which are the main units of the administrative division of the country. The development of agriculture thus determined was correlated with activities pursued by the National Agricultural Support Centre (NASC), an institution responsible for the management of agricultural real estate owned by the State Treasury in Poland. The results showed that the NASC’s activities are related to the level of agricultural development in every voivodship. The investigated model of rural space management was shown to be a rational one, performing well in today’s market conditions. The proposed methodology could adapt to similar situations and can be used in similar research on rural areas.

1. Introduction

According to estimates, food provided by agriculture should feed 5.8 billion people, hence agricultural development is an important issue [1]. The Food and Agriculture Organization has declared to eliminate malnutrition and famine in the world by 2030 [2]. Foresight analyzed 40 projects and programs in 20 countries, between the years 1990 and 2000; 10.39 million farmers and their families benefited from this program. Attention was paid to the participation of government agencies and organizations supporting socio-economic and sustainability development (sustainability) [3].
Innovativeness is an important factor in agricultural development as it helps to achieve sustainable development. However, according to the to-date research, imple-mentation of innovative solutions depends on external and internal factors of agricul-tural development in a given country [4].
Another important element of agricultural policy is the impact of programs, agri-cultural reforms as well as policies on land markets and, more specifically, control over strategic land for food production [5]. Usually, agricultural policies do not consider the fact that farmers’ ability to earn extra income is a determinant for maintaining sus-tainable land management. The possibility of securing land ownership and long-term renting, according to the research, has an impact on the economic growth [6]. It is therefore necessary to increase the efficiency of land use by preventing the allocation of agricultural and forestry land to non-productive purposes, which necessitates the es-tablishment of public administration bodies with implemented agricultural develop-ment modeling systems [7]. Both agricultural development indicators and respect for the right of priority in the acquisition of land by local communities (especially the right to forests) are important elements in the protection of land and its rational use [8]. Re-search in each country should include systematic interpretation of these factors because changes in land use affect the agricultural system, food supply, and product prices; therefore, such changes should be monitored [9]. On the other hand, the crop subsidy policy should be supervised because the liquidation of subsidies may lead to the abandonment of some crops [10].
Sustainable land use requires monitoring of agricultural development characteris-tics with the use of indicators [11,12,13]. Census databases are considered to be the most reliable sources of information, hence the data collection and exchange systems in countries around the world must be unified when comparing the level of agricultural development [14]. Cartographic presentation of strategic data and selection of features are also problematic [15]. Analytical data to determine the level of agricultural devel-opment are important [16,17], although identification of the features that influence ag-ricultural development has been made more difficult due to substantial changed in-duced by subsidies from the European Common Agricultural Policy (e.g., subsidies to areas with unfavorable uses that have directly affected the development of agriculture in these territories) [17]. Agriculture is the production of food and goods through farming and forestry; for centuries, it was a key factor in the growth of human civiliza-tion [18]. The Agricultural Production Index [19] or Agricultural Production Space Quality Indicator [20,21] are agricultural statistical indices determined on the basis of agricultural census data or indicators of productivity and production [22]. However, the indices are not independent of each other; in fact, they influence each other both posi-tively and negatively, and therefore any statistical method applied to determine the level of agricultural development should include this aspect [23]. Such dependencies are taken into account in the Hellwig’s method, and this approach enables one to use many data and achieve clear statistical interpretation [24,25]. It is important to realize that agricultural development is a system of links, and agricultural professionals are de-veloping models of agricultural systems because there is a need for a new generation of tools and methods of agricultural systems [26]. These models take into account many variables while being universal and comparable with different mechanisms of influence on agriculture, with particular emphasis on public sector activities in agricultural de-velopment [27].
Unlike in Western European countries, where most of the land is in the hands of private farmers, forms of socialist land ownership were used in post-communist coun-tries. After transition to market economy in these countries, public institutions were established to take over state agricultural land and to manage these resources. Examples of such institutions are the National Agricultural Support Centre (NASC) in Poland, National Land Service in Lithuania, and Land Service Latvia or State Property Agency in Romania. In Albania, Bulgaria, the Czech Republic, Slovakia, Slovenia, and Hungary, there are state institutions such as committees or land funds (banks). Moreover, agri-cultural support institutions are established in most EU countries to deal with any changes in the privatization of agriculture, new ways of financing, agricultural advisory services, or the integration of advisory institutions with research institutions. In Bel-gium, Greece, Luxembourg and Slovenia, Spain, Southern Germany, Portugal, Sweden, Italy, and Switzerland, central government organizations are responsible for advisory services, while in the Czech Republic, Estonia, Ireland, Norway, Poland, Slovakia, and Hungary, advisory services are provided by state organizations charging for certain services [28].
The NASC was established on 1 September 2017, as the successor of the Agri-cultural Property Agency (APA) and the Agricultural Market Agency. Among the many tasks that the NASC has been authorized to perform in the field of land management [29], the most important ones are listed in Figure 1.
The National Agricultural Support Centre implements the state policy in the following areas: creation and improvement of the area structure of family farms and development of strategic companies of the Treasury, implementation of innovations in agriculture and agri-food industry, stabilization of agricultural markets, and promotion of Polish agri-food products. Apart from statutory tasks, it also performs other delegated tasks. The main objective of the National Agricultural Support Centre is to implement tasks resulting from the state policy, in particular in the scope of the implementation and application of agricultural support instruments, active agricultural policy and rural development. The thematic scope of activities of the National Agricultural Support Centre is presented in Figure 2.
The main objective of the study was to determine the level of agricultural development in Poland. In Poland, activities associated with the management of the Agricultural Property Stock of the State Treasury are carried out by the public institution called the National Agricultural Support Centre (NASC). Therefore, the authors additionally studied the relationship between changes in the level of agricultural development between 2006 and 2018 and activities of the NASC. Based on the review of the literature [7,30,31,32,33,34,35,36,37,38], it can be concluded that advancement in agriculture entails elements concerning land use, socio-demographic factors, economic factors describing agriculture, and factors determining the level of agricultural production. Following the perusal of the literature, the authors determined which features would be reliable and usable in the study. These are integral environmental, social, and economic impacts on agriculture. However, there is no single set of characteristics to be derived from the literature that would be able to describe the development of agriculture; instead, there are merely indicators based on environmental, social, and economic impacts on agriculture, which must be reliable.

2. Materials and Methods

The level of agricultural development was determined using the Hellwig’s taxonomic method, and the NASC activities were determined based on the NASC statutory tasks and on quantified based on data from annual reports published by the NASC. The area of the research consisted of the voivodships of Poland, which are the main units of the country’s administrative division. To determine the level of agricultural development, the authors used all available data from the agricultural censuses, which are a reliable source of information because they are prepared by Statistics Poland (GUS). The GUS is the central office of government administration dealing with the collection and dissemination of statistical information on most areas of public life and some areas of private life. The data are required to be provided by the relevant legal regulations (the Act on Public Statistics and the Statistical Research Program announced annually). The choice of diagnostic variables that would allow us to provide the most complete presentation of the level of agricultural development was guided by two factors. Firstly, a literature analysis was carried out and variables that met the requirement of being usable in in taxonomic methods were selected [39,40]. Secondly, the decision was also influenced by data availability. Information that can be obtained from Statistics Poland is aggregated for different administrative levels. Most data can be found for the whole country; less information is available pertaining to single voivodships (which is the level analyzed in this study). Not all data were available for the year 2006, which was chosen as the first year of analysis. However, it was possible to collect data for 43 diagnostic variables, which refer as widely as possible to different aspects of agricultural development and simultaneously meet the condition of a variable that can be used in taxonomic methods. The list of diagnostic variables accepted for the analysis is presented in Table 1.
Our review of the literature indicated that linear ordering methods are most often used in studies similar to ours. As a result, the Hellwig’s method, an approach proposed in 1968 by the Polish scientist Zdzisław Hellwig, was chosen for this study. This method is common in such type of research [25,30,41,42,43,44,45,46,47,48,49,50]. The Hellwig’s method is based on the calculation of a synthetic development index which allows the user to present a situation of diversity in the level of the phenomenon studied, covering many categories, e.g., economic, social, ecological, and spatial ones [51,52]. The adopted research methodology is characterized by great transparency, as the results can be presented with a single numerical value. This is a great advantage of this method and a premise for its selection [53]. The construction of a synthetic developmental index requires several stages, starting from the selection of a set of objects and diagnostic variables, through normalization of features, determination of stimulants and destimulants, to the calculation of the index value as a distance from the constructed developmental index.
The numerical description of the set of objects can be presented in the form of an observation matrix
X =   x 11 x 1 m x n 1 x n m   ,
where xij means the value of the j-th variable for the i-th object (i = 1, 2,…, n; j = 1, 2,…, m).
For the collected diagnostic variables, it should be examined whether these variables are characterized by sufficiently high variability by eliminating quasi-constant variables. For this purpose, the coefficient of variation V can be calculated for each j-th variable. Its value is a relative measure of dispersion, and it is calculated by using Equation (2) below.
V j = S j x ¯ j   ,   j = 1 , , m ,
where: x ¯ j —the arithmetic mean of the j-th variable (3), Sj—standard deviation for the j-th variable (3)
x ¯ j = n 1 i = 1 n x i j ,   i = 1 , , n ;   S j   =   n 1 i = 1 n x i j x ¯ j 2 ,
From the set of variables, unequal variables can be eliminated.
V j V *
where V* is the critical value of the variation coefficient. The value of V* was arbitrarily set at 0.10.
Afterwards, the strength of the relationship between the other variables should be tested. For this purpose, the correlation between variables must be determined with the value of the Pearson coefficient. Highly correlated variables are removed from the data set (Pearson’s coefficient > 0.9) [54].
The Hellwig’s method requires the linearity of diagnostic variables. Therefore, covariance should be calculated, which is a measure of the joint variability of two random variables. The covariance of variables shows how variables are linearly related to each other. Positive covariance indicates a positive linear relationship between variables, while negative covariance indicates the opposite. If the variables are not linearly related, the covariance value is close to zero. The covariances must be calculated for the analyzed variables.
In the next step, the variables must be unified. To unify variables, the characteristics should be normalized by standardizing it, according to Equations (2) and (4).
Z i j = x i j x ¯ j S j   ,   j = 1 , , m ,
where: x ¯ j is the arithmetic mean of j-th variable (3) and Sj is the standard deviation for the j-th variable (3). This way, a matrix of standard values of the Z characteristics is obtained in Equation (6) below.
Z =   z 11 z 1 m z n 1 z n m ,
where zij is a standardized value of xij.
The matrix (6) formed is the basis for determining the reference object P0. It is an abstract object (e.g., a city) with standardized values z01, z02,…, z0j, where:
z 0 j =   max i   z i j ,   when   X j   is   a   stimulant z 0 j =   min i   z i j ,   when   X j   is   a   destimulant
The P0 object obtained in this way is treated as a development pattern.
In the next step, the Euclidean distances of the tested objects from the determined pattern should be calculated. This can be completed based on Equation (8).
D i 0 = j = 1 m z i j   z 0 j 2 ,  
For the D10, D20,…, Dn0 distance values obtained in this way, the average value should be calculated (9).
D ¯ 0 = n 1 i = 1 n D i 0
As well as standard deviation (Equation (10)):
S 0 = n 1 i = 1 n D i 0 D ¯ 0 2
The level of sustainable development is obtained from Equation (11) below.
d i = 1 D i 0 D 0   ,
where:
D 0 = D ¯ 0 + 2 S 0 ,
A string of d1, d2,…, dn values is obtained in this way, using the range (0,1).
The higher the measure of the di value of the tested object (i.e., its values are close to the pattern), the higher its level of agricultural development is. The lower the di value is (i.e., the values of the tested object are further away from the pattern), the lower its level of agricultural development.
Two parameters of the taxonomic measure can be used to classify the examined objects, according to the level of agricultural development: a geometric mean (di) and standard deviation (Sdi). Six agricultural development classes of voivodships can be distinguished in this way, depending on the value of di:
  • 6th class (the lowest level of agricultural development): di < di − 2Sdi
  • 5th class (low level of agricultural development): di − 2Sdidi < diSdi
  • 4th class (medium level of agricultural development): diSdidi < di
  • 3rd class (medium-high level of agricultural development): didi < di + Sdi
  • 2nd class (high level of agricultural development): di + Sdidi < di + 2Sdi
  • 1st class (the highest level of agricultural development): didi + 2Sdi
The measure of the relationship between variables in statistics is correlation. It is determined by the correlation coefficient. Strength of correlations or strength of the relationship between two variables interpreted according to J.Guilford Classification [54]:
  • level 0—|r| = 0—no correlation
  • level I—0.0<|r|≤0.1—weak correlation (practically no relation)
  • level II—0.1<|r|≤0.3—low correlation (clear relation)
  • level III—0.3<|r|≤0.5—moderate correlation (significant dependence)
  • level IV - 00,5<|r|≤0,7—high correlation (significant relationship)
  • level V—00.7<|r|≤0.9—correlation very high (very high dependence)
  • level VI 0.9<|r|<1.0—correlation almost complete
  • level VII—|r| = 1—full dependence
This article will examine the strength of correlations between the NASC’s activities and data on the socio-economic level of voivodships.
To determine the impact of the activities pursued by the NASC on the development of agriculture, the authors used the NASC source data published for public scrutiny in the NASC annual reports.
Table 2 contains data on the activities of the NASC in the field of land management of the land owned by the State Treasury until 2006 and Table 2 contains activities until 2018.
The data from Table 2 and Table 3 on land sold, transferred free of charge, contributed to the companies, and divested in other forms will be used to determine the correlation with the changes in the level of social and economic development in the voivodships of Poland, created with the Hellwig’s method. The case of Poland is interesting because agricultural development in the post-communist countries was the responsibility of the State Agricultural Enterprises (SAE). After the political transformation in Poland, state agencies were established to take care of the land owned by the State Treasury. The agency preceding the NASC not only supervised the sale of agricultural land, but was also involved in the social activation of former state farm communities. Currently, the NASC plays an important role in agricultural land management. Due to legal constraints imposed on land sales (item in Table 1 and Table 2), which protect farmers from uncontrolled land buyout and ensure the safety of food production for society, it mainly leases land (the activity is described as “divested in other forms” in Table 1 and Table 2). However, it still has an important social impact as it has the possibility to transfer land free of charge for social purposes (item in Table 2 and Table 3) or to transfer it as a contribution to companies (also item in Table 2 and Table 3), which is one of its statutory tasks. This role of the NASC in agriculture should be correlated with social and economic development; these activities should have an impact on rural development.

3. Results and Discussion

Following the methodology presented in the previous chapter, to achieve the research objectives set in the article, the first step was to determine the level of agricultural development and its changes in the years 2006–2018 in each of the 16 voivodships in Poland.
The process of verifying the indicators for usefulness and usability in the Hellwig’s method, described in Section 2, involves the rejection of indicators based on the requirements of the method and consists of three stages:
  • Rejection of indicators with a low variation coefficient; for the year 2006—1 rejected indicator (X5); for the year 2018—1 rejected indicator (X5)
  • Rejection of indicators with a high level of correlation—the Pearson’s linear correlation analysis for the year 2006—8 rejected indicators (X15–X20, X22, X23); for the year 2018—9 rejected indicators (X14–X20, X22, X23)
  • Verification of linearity of diagnostic variables—covariance analysis; for the year 2006—1 rejected indicator (X2); for the year 2018—1 rejected indicator (X2)
The results obtained from the calculations are presented in Figure 4 and Table 4.
It is surprising that the Hellwig’s classes in both 2006 and 2018 are the same. Two voivodships, Wielkopolskie and Mazowieckie, are in the first, best class distinguished according to the Hellwig’s classification. There is no voivodship in the second class, while Kujawsko-Pomorskie, Lubelskie, and Łódzkie are in the third class. Lubuskie is in the fifth class, and the other voivodships fall in the fourth class. The authors established a ranking based on the parameters described above in order to compare changes in the level of agriculture. There are some evident shifts, for example Pomorskie Voivodship dropped by five classes or Podkarpackie Voivodship rose by five classes. No such spectacular changes occurred regarding the position of the other voivodships. The classification of Lubuskie, Podlaskie, and Zachodniopomorskie remained unchanged.
The second step was to determine the NASC’s activities that may be related to the level of agriculture. Data from Table 2 and Table 4 were used to create Figure 3, displaying land management activities in the years 2006-2018.
The largest sale of land occurred in Warmińsko-Mazurskie and Zachodniopomorskie Voivodships, with over 170 thousand hectares sold. A moderate level of sales was achieved by Wielkopolskie, Pomorskie, and Dolnośląskie Voivodships, where between 90 and 105 thousand hectares were sold; the remaining voivodships did not sell more than 55 thousand hectares each. With land transferred free of charge to municipalities, mainly for social purposes, most of the land was given away in Dolnośląskie Voivodship, whereas the remaining voivodships most often donated above 1 thousand hectares, not exceeding 6 thousand ha, except Świętokrzyskie Voivodship, where only 725 hectares were transferred. Land “contributed to companies” is the group of activities where the least land was transferred, except Dolnośląskie Voivodship (7819 hectares) and Wielkopolskie Voivodship (528 hectares). The level of support to companies did not exceed 65 hectares donated to a company, and no land was transferred under this category in Łódzkie Voivodship. With respect to land permanently disposed of in other forms, more than 100,000 hectares of land were transferred in Warmińsko-Mazurskie Voivodship, which can be considered an exceptional case.
Pomorskie and Zachodniopomorskie Voivodships each donated 24 thousand hectares and Podlaskie, Lubuskie, Wielkopolskie, and Kujawsko-Pomorskie Voivodship each donated between 8 and 9 thousand hectares; in the remaining voivodships, less than 1.5 thousand hectares were donated, with the exception of Lubelskie Voivodship, where 3 thousand hectares were donated. Between 2006 and 2018, most land was sold in Zachodniopomorskie and Warmińsko-Mazurskie Voivodships, while most land free of charge was transferred in Dolnośląskie Voivodship. As for the category “contributed to companies,” most land was transferred in Dolnośląskie Voivodship, and most “divested of in other forms” (usually lease) land was recorded in Warmińsko-Mazurskie Voivodship.
If we sum up all the activities from 2006 to 2018, the NASC Field Branch in Olsztyn generated the largest amount of trade in agricultural land, involving more than 290 thousand hectares. Field branches in Szczecin and Koszalin, which manage the land in Zachodniopomorskie Voivodship, traded 213 thousand hectares. The field branches in Pruszcz Gdański, Gorzów Wielkopolski, Poznań, and Wrocław achieved a transfer of just over 100 thousand hectares. The remaining field branches were below this figure.
Comparing the statistical data of agricultural land transfer from individual voivodships (Table 2 and Table 3) regulated by the NASC with the data on agricultural development in these areas obtained by the Hellwig’s method (Table 4), the following results were obtained (also illustrated in Figure 4).
Since the agricultural level classes did not change between 2006 and 2018, the ranking of the voivodships in 2006, 2018, between 2006 and 2018, as well as changes in the ranking were based on raw "di" data. “Contribution to companies” always negatively correlated and the other NASC activities always positively correlated, except for the change in the ranking. “Contribution to companies” is the least active way of land management and, therefore, its impact on the level of agricultural development is not demonstrable. However, the impact of the sale, lease or free transfer of land is visible. When the rankings are compared, it emerges that as the NASC activity increases, so does the level of agriculture in a given voivodship.
However, while comparing changes in the rankings, the correlation proves to be inversely proportional, which means that the NASC activities were conducted mainly in areas where the level of agriculture was the lowest. This proves that the measures were addressed mainly to the weakest voivodships and have been implemented consistently; therefore, the position in the rankings of voivodships where there is a large range of land transfer is improving. According to J. Guilford’s scale, the 2006 ranking was at level III, i.e., moderate correlation (significant dependence), except for paid transfers in other forms, where the correlations with the 2006 ranking reached level II, i.e., low correlation (clear relation). In the 2018 ranking with free contributions to companies, it is at level II, i.e., low correlation (clear relation). Land sold and transferred in other non-free forms reached level III, i.e., moderate correlation (significant relation). If we compare the data on agricultural development with the data from the 2006–2018 ranking, we observe level III of correlation, i.e., moderate correlation (significant dependence), except for contribution to companies, which is at level II of correlation (clear relation). If we compare it with a change in the ranking, all the features will be at correlation level II, except for transfer free of charge, which was at correlation level III, i.e., a significant correlation. However, if we use the scale described by Cohen [55], the correlation for transfer free of charge will even reach level four, i.e., 0.43, which is a high correlation (significant relationship).

4. Conclusions

The methodology used in the research is applied to determine the level of agricultural growth [56,57,58,59] (used the findings from these studies to build the matrix of diagnostic features used—tab 1), although it is also useful to study the level of social and economic development [30], and the level of sustainable development [30,56]. The National Agricultural Support Centre may have an impact on the level of agriculture achieved [60,61,62,63,64,65,66,67]. The conducted research justifies the following final conclusions, where the results obtained are summarized:
  • The proposed methodology can be used in similar research on rural areas. The conducted research confirmed the suitability of the Hellwig’s method for determination of the level of agricultural development in a given voivodship. This method can also be used to assess the level of development of any administrative unit (e.g., in Poland, these are municipalities, districts, and voivodships). It can be also used to determine and compare the level of development of different countries. By changing the range of diagnostic variables, it is also possible to assess the level of social, economic, or sustainable development using the Hellwig’s method. It is only necessary to select an appropriate range of variables in each case. The level of development obtained in this way can be correlated with the activities of various institutions or organizations (a given country, the EU, or local authorities) in order to determine the relationship between such activities and a particular level of development.
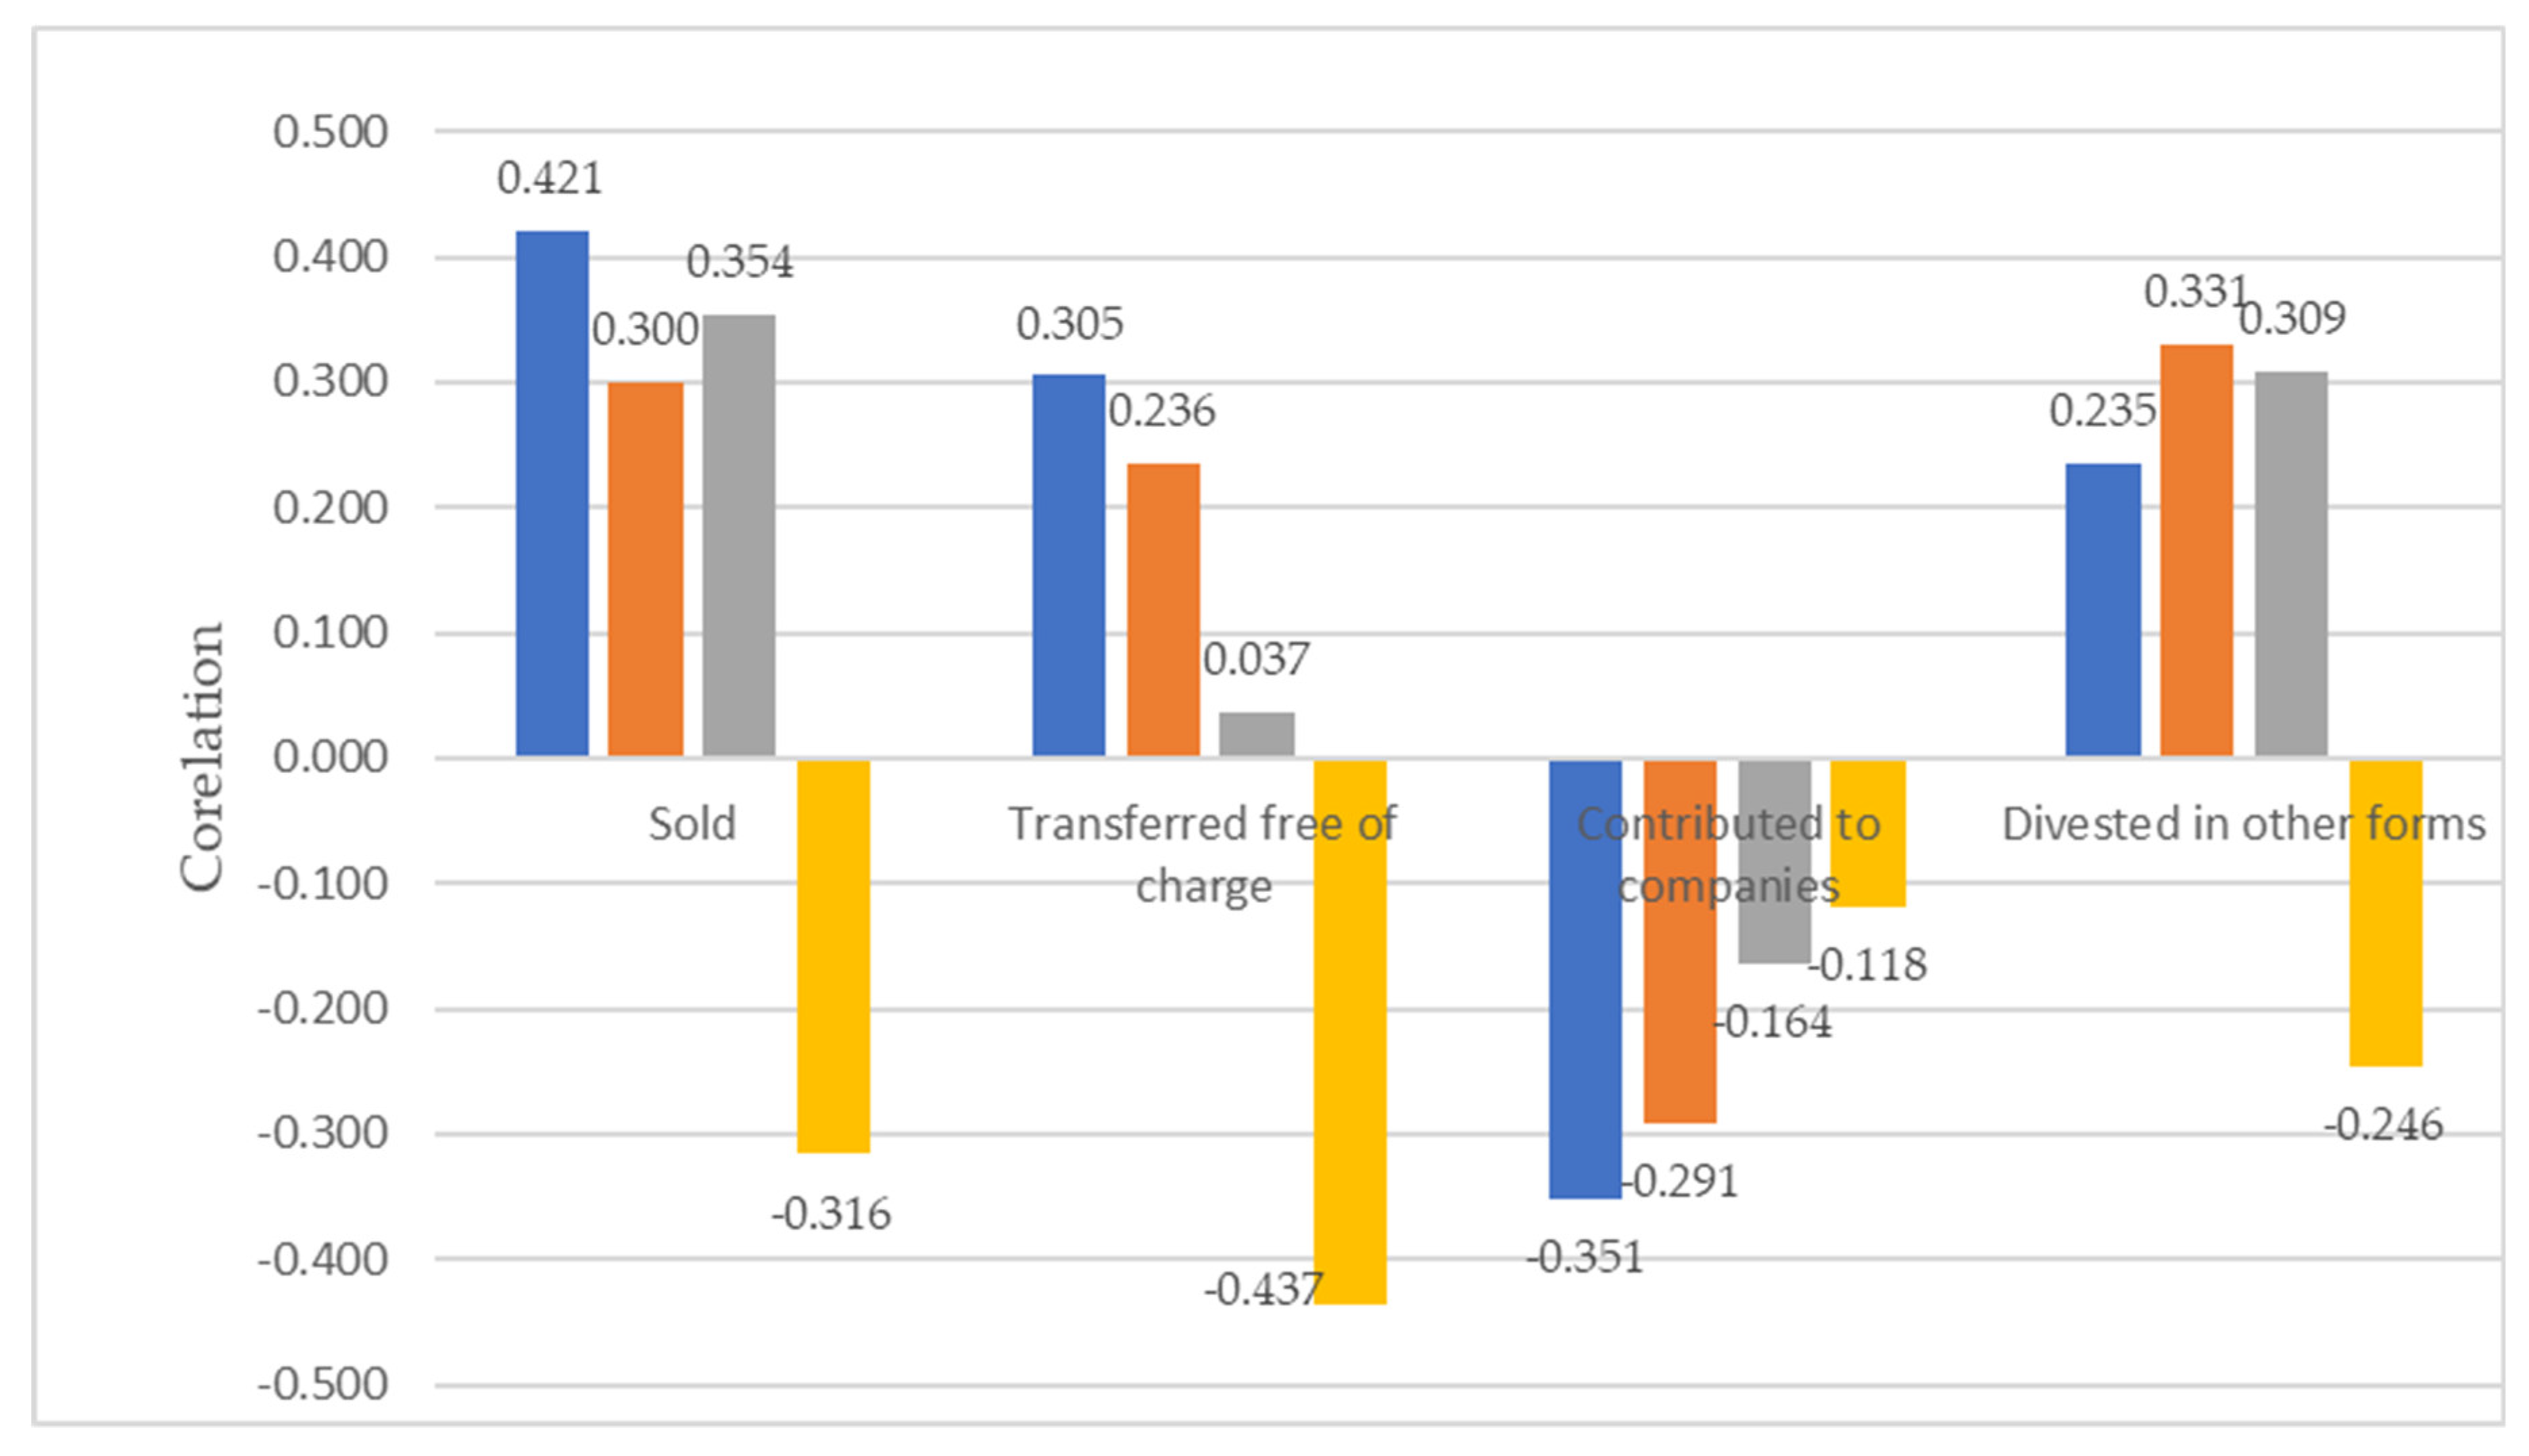
  • The results obtained in this study showed that the NASC’s activities are related to the level of agriculture development in individual voivodships. It was shown that such a model of land management is reasonable and performs well in today’s market conditions.
  • Agricultural development level indicators should be correlated with institutional public actions. This justifies and confirms the validity of the activities conducted by such public institutions. The results obtained in the research can be used by public institutions, e.g., when reporting their activities and applying for funds for the next years of their activity.
  • The NASC activities have an impact on the level of agriculture development in Poland. The results obtained indicate that the voivodships with higher NASC activity are better evaluated in terms of agricultural development.
  • The impact of programs, reforms, and agricultural policies on the land markets is visible because legal changes in Poland have given preference to land lease over land sale.
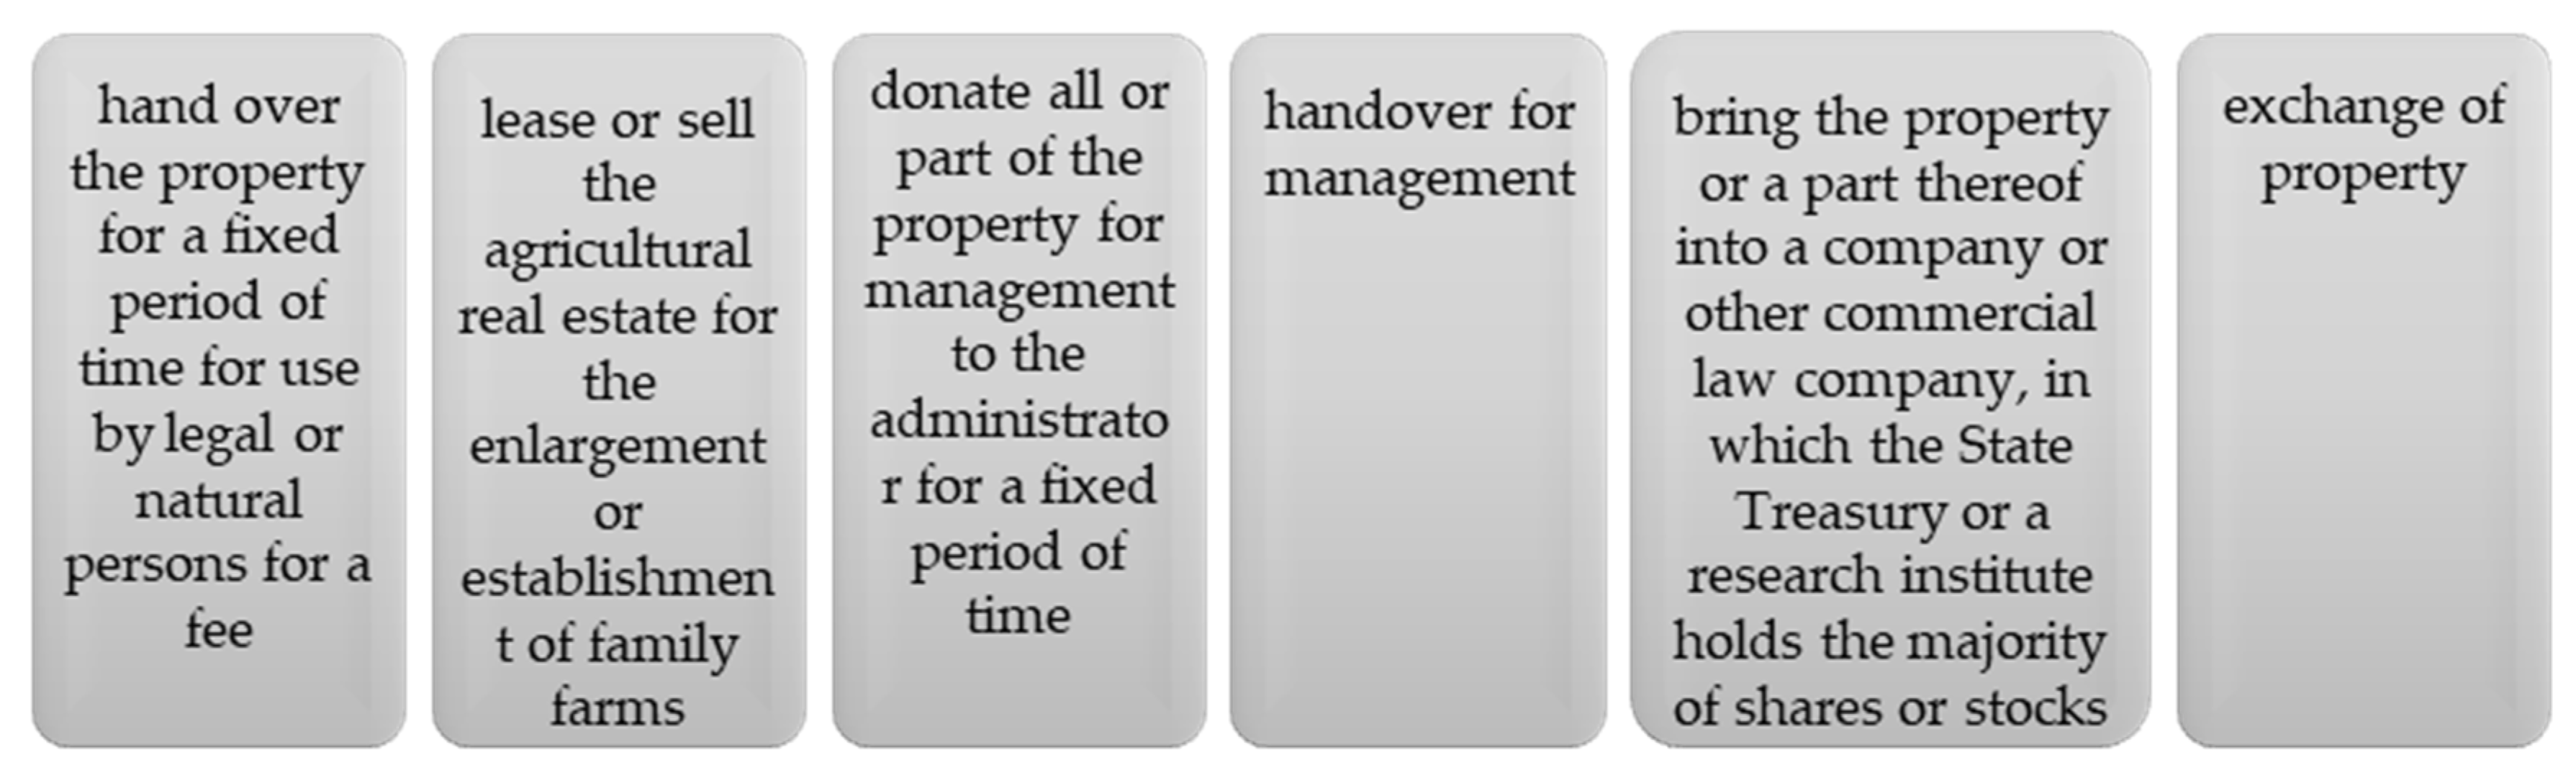
  • The right of priority and the right of pre-emption enables the NASC to acquire strategic land, owing to which the NASC is in control of strategic land for food production, maintenance of sustainable land management, securing land ownership and the possibility of its long-term use in a specific way, combating climate change, ensuring food safety, or preventing environmental degradation, which can all be seen as thoughtful measures undertaken to reduce the risk of abandonment of business activity. The concept of multifunctional land use supports the NASC’s modeling system through economic and social monitoring.
Determination of the level of agricultural development and identification of factors influencing the dynamics of change are important for the proper functioning of any country. Agricultural land management systems are supported by the activities of various state institutions. The proposed research methodology can be used to study relationships between the activities of state institutions and the level of agricultural development. The proposed methodology could adapt to similar situations and can be used in similar research on rural areas, so the authors plan further experiments to confirm this hypothesis in future work.

Author Contributions

Conceptualization, M.O. and K.R.; Formal analysis, M.O. and K.R.; Funding acquisition, R.Ź.; Investigation, M.O.; Methodology, K.R.; Project administration, M.O.; Resources, M.O.; Software, K.R.; Supervision, M.O.; Visualization, R.Ź.; Writing–original draft, M.O.; Writing–review & editing, M.O. All authors have read and agreed to the published version of the manuscript.

Funding

This research was funded by The National Support Centre for Agriculture Regional Office Olsztyn, grant "The role of the National Agricultural Support Centre in managing the Treasury Agricultural Property Stock" number 05/WFKIW/2020.

Conflicts of Interest

The authors declare no conflict of interest.

References

  1. Garrett, K. Sustainable agriculture. In Environmental Management in Practice: Compartments, Stressors and Sectors; Psychology Press: East Sussex, UK, 2013; ISBN 9780203023204. [Google Scholar]
  2. Food and Agriculture Organization. Food Security and Nutrition in the World; Food and Agriculture Organization: Rome, Italy, 2019; ISBN 978-92-5-109888-2. [Google Scholar]
  3. Pretty, J.; Toulmin, C.; Williams, S. Sustainable intensification in African agriculture. Int. J. Agric. Sustain. 2011. [Google Scholar] [CrossRef]
  4. Meijer, S.S.; Catacutan, D.; Ajayi, O.C.; Sileshi, G.W.; Nieuwenhuis, M. The role of knowledge, attitudes and perceptions in the uptake of agricultural and agroforestry innovations among smallholder farmers in sub-Saharan Africa. Int. J. Agric. Sustain. 2015. [Google Scholar] [CrossRef]
  5. Sustainable Agricultural Development; Springer: Dordrecht, The Netherlands, 2011.
  6. Kassie, G.W.; Kim, S.; Fellizar, F.P. Determinant factors of livelihood diversification: Evidence from Ethiopia. Cogent Soc. Sci. 2017. [Google Scholar] [CrossRef]
  7. Lambin, E.F.; Meyfroidt, P. Global land use change, economic globalization, and the looming land scarcity. Proc. Natl. Acad. Sci. USA 2011, 108, 3465–3472. [Google Scholar] [CrossRef] [Green Version]
  8. Graziano Ceddia, M.; Gunter, U.; Corriveau-Bourque, A. Land tenure and agricultural expansion in Latin America: The role of Indigenous Peoples’ and local communities’ forest rights. Glob. Environ. Chang. 2015. [Google Scholar] [CrossRef]
  9. Popp, A.; Calvin, K.; Fujimori, S.; Havlik, P.; Humpenöder, F.; Stehfest, E.; Bodirsky, B.L.; Dietrich, J.P.; Doelmann, J.C.; Gusti, M.; et al. Land-use futures in the shared socio-economic pathways. Glob. Environ. Chang. 2017. [Google Scholar] [CrossRef] [Green Version]
  10. Renwick, A.; Jansson, T.; Verburg, P.H.; Revoredo-Giha, C.; Britz, W.; Gocht, A.; McCracken, D. Policy reform and agricultural land abandonment in the EU. Land Use policy 2013. [Google Scholar] [CrossRef]
  11. Awange, J. Land management. In Environmental Science and Engineering (Subseries: Environmental Science); Springer: Berlin/Heidelberg, Germany, 2018. [Google Scholar]
  12. López-Ridaura, S.; Masera, O.; Astier, M. Evaluating the sustainability of complex socio-environmental systems. The MESMIS framework. Ecol. Indic. 2002, 2, 135–148. [Google Scholar] [CrossRef]
  13. Haberl, H.; Fischer-Kowalski, M.; Krausmann, F.; Martinez-Alier, J.; Winiwarter, V. A socio-metabolic transition towards sustainability? Challenges for another Great Transformation. Sustain. Dev. 2011. [Google Scholar] [CrossRef]
  14. Lowder, S.K.; Skoet, J.; Raney, T. The Number, Size, and Distribution of Farms, Smallholder Farms, and Family Farms Worldwide. World Dev. 2016. [Google Scholar] [CrossRef] [Green Version]
  15. Ogryzek, M.; Ciski, M. Cartographic Methods of Presentation the Average Transaction Prices of the Undeveloped Land. Civ. Environ. Eng. Rep. 2018, 28, 85–100. [Google Scholar] [CrossRef] [Green Version]
  16. Minten, B.; Barrett, C.B. Agricultural Technology, Productivity, and Poverty in Madagascar. World Dev. 2008. [Google Scholar] [CrossRef]
  17. Van Zanten, B.T.; Verburg, P.H.; Espinosa, M.; Gomez-Y-Paloma, S.; Galimberti, G.; Kantelhardt, J.; Kapfer, M.; Lefebvre, M.; Manrique, R.; Piorr, A.; et al. European agricultural landscapes, common agricultural policy and ecosystem services: A review. Agron. Sustain. Dev. 2014, 34, 309–325. [Google Scholar] [CrossRef] [Green Version]
  18. Wager, F.C. Agricultural Production; Nova Science Publishers: Hauppauge, NY, USA, 2011; ISBN 9781616686956. [Google Scholar]
  19. Suhara, M. Agriculture. In Russian Economic Development over Three Centuries: New Data and Inferences; Springer: Singapore, 2019; ISBN 9789811384295. [Google Scholar]
  20. Harkot, W.; Lipińska, H.; Wyłupek, T. Kierunki zmian użytkowania ziemi na tle naturalnych warunków rolniczej przestrzeni produkcyjnej Lubelszczyzny. Acta Sci. Pol. Adm. Locorum 2011, 10, 5–16. [Google Scholar]
  21. Tokarski, J. Valorization of agricultural production area in spatial planning of rural communities (Szczecin Province as and example). Nowe Rolnictwo 1978, 27, 14–16. [Google Scholar]
  22. Dethier, J.J.; Effenberger, A. Agriculture and development: A brief review of the literature. Econ. Syst. 2012. [Google Scholar] [CrossRef] [Green Version]
  23. Kanter, D.R.; Musumba, M.; Wood, S.L.R.; Palm, C.; Antle, J.; Balvanera, P.; Dale, V.H.; Havlik, P.; Kline, K.L.; Scholes, R.J.; et al. Evaluating agricultural trade-offs in the age of sustainable development. Agric. Syst. 2018, 163, 73–88. [Google Scholar] [CrossRef]
  24. Hellwig, Z. Zastosowanie metody taksonomicznej do typologicznego podziału krajów ze względu na poziom rozwoju i strukturę kwalifikowanych kadr. Przegląd Stat. 1968, 4, 307–326. [Google Scholar]
  25. Stec, M. Analiza porównawcza rozwoju społeczno-gospodarczego powiatów województwa podkarpackiego. Nierówności Społeczne A Wzrost Gospod. 2012, 25, 180–190. [Google Scholar]
  26. Jones, J.W.; Antle, J.M.; Basso, B.; Boote, K.J.; Conant, R.T.; Foster, I.; Godfray, H.C.J.; Herrero, M.; Howitt, R.E.; Janssen, S.; et al. Brief history of agricultural systems modeling. Agric. Syst. 2017. [Google Scholar] [CrossRef] [PubMed]
  27. Hallett, G.; Hayami, Y.; Rutton, V.W. Agricultural Development: An International Perspective. Econ. J. 1972. [Google Scholar] [CrossRef]
  28. Zadura, A.; Sikorska, A. Zarzadzanie Gruntami Rolnymimw Krajach Europy Srodkowo-Wschodniej Gruntami Rolnymi W Krajach Europy; Instytut Ekonomiki Rolnictwa i Gospodarki Żywnościowej—Państwowy Instytut Badawczy: Warszawa, Poland, 2005; ISBN 838966612X. [Google Scholar]
  29. Act of 19 October 1991 on the Management of Agricultural Real Estate of the State Treasury. Poland, 1991. Available online: http://isap.sejm.gov.pl/isap.nsf/download.xsp/WDU19911070464/U/D19910464Lj.pdf (accessed on 12 February 2021).
  30. Rzasa, K.; Ogryzek, M.; Źróbek, R. The land transfer from the state treasury to local government units as a factor of social development of rural areas in Poland. Land 2019. [Google Scholar] [CrossRef] [Green Version]
  31. Pingali, P.L. Green revolution: Impacts, limits, andthe path ahead. Proc. Natl. Acad. Sci. USA 2012, 109, 12302–12308. [Google Scholar] [CrossRef] [Green Version]
  32. Johnson, N.L.; Kovarik, C.; Meinzen-Dick, R.; Njuki, J.; Quisumbing, A. Gender, Assets, and Agricultural Development: Lessons from Eight Projects. World Dev. 2016. [Google Scholar] [CrossRef] [Green Version]
  33. Gallup, J.L.; Sachs, J.D.; Mellinger, A.D. Geography and economic development. Int. Reg. Sci. Rev. 1999, 22, 179–232. [Google Scholar] [CrossRef]
  34. Schneider, U.A.; Havlík, P.; Schmid, E.; Valin, H.; Mosnier, A.; Obersteiner, M.; Böttcher, H.; Skalský, R.; Balkovič, J.; Sauer, T.; et al. Impacts of population growth, economic development, and technical change on global food production and consumption. Agric. Syst. 2011. [Google Scholar] [CrossRef]
  35. Muzari, W.; Gatsi, W.; Muvhunzi, S. The Impacts of Technology Adoption on Smallholder Agricultural Productivity in Sub-Saharan Africa: A Review. J. Sustain. Dev. 2012. [Google Scholar] [CrossRef] [Green Version]
  36. Hamidov, A.; Helming, K.; Balla, D. Impact of agricultural land use in Central Asia: A review. Agron. Sustain. Dev. 2016, 36, 6. [Google Scholar] [CrossRef] [Green Version]
  37. Pereira, P.A.A.; Martha, G.B.; Santana, C.A.M.; Alves, E. The development of Brazilian agriculture: Future technological challenges and opportunities. Agric. Food Secur. 2012, 1, 1–12. [Google Scholar] [CrossRef] [Green Version]
  38. Saysel, A.K.; Barlas, Y.; Yenigün, O. Environmental sustainability in an agricultural development project: A system dynamics approach. J. Environ. Manag. 2002. [Google Scholar] [CrossRef] [PubMed] [Green Version]
  39. Tarka, D. Własności cech diagnostycznych w badaniach typu taksonomicznego. Ekonia Zarządzania 2010, 2, 194–203. [Google Scholar]
  40. Grabiński, T.; Wydymus, S.; Zeliaś, A. Metody Taksonomii Numerycznej W Modelowaniu Zjawisk Społeczno-Gospodarczych; PWN: Warsaw, Poland, 1989; ISBN 83-01-08596-7. [Google Scholar]
  41. Salamon, J. Badania wielofunkcyjnego rozwoju obszarów wiejskich województwa świętokrzyskiego. Infrastrukt. I Ekol. Teren. Wiej. 2005, 4, 145–155. [Google Scholar]
  42. Ziemiańczyk, U. Ocena poziomu rozwoju społeczno-gospodarczego gmin wiejskich i miejsko-wiejskich w województwie małopolskim. Infrastrukt. I Ekol. Teren. Wiej. 2010, 14, 31–40. [Google Scholar]
  43. Jaworska, M.; Luty, L. Ocena Rozwoju Spoàeczno-Gospodarczego Powiatów Województwa Maàopolskiego. Acta Sci. Pol. Oecon. 2009, 8, 37–44. [Google Scholar]
  44. Malina, A. Analiza przestrzennego zróżnicowania poziomu rozwoju społeczno-gospodarczego województw Polski w latach 2005–2017. Nierówności Społeczne A Wzrost Gospod. 2020, 61, 138–155. [Google Scholar] [CrossRef]
  45. Podstawka, M.; Suchodolski, B. Assessment of the level of economic and social development of regions using the Hellwig taxonomic development measure. In Proceedings of the VII International Scientific Conference Determinants of Regional Development, PIła, Poland, 12–13 April 2018; pp. 187–201. [Google Scholar] [CrossRef]
  46. Dorożyński, T.; Dobrowolska, B.; Kuna-Marszałek, A. Institutional quality as a determinant of FDI inflow: The case of Central and Eastern European countries. J. Manag. Financ. Sci. 2019, 36, 103–122. [Google Scholar]
  47. Pomianek, I. Poziom rozwoju społeczno-gospodarczego obszarów wiejskich województwa warmińsko-mazurskiego. Acta Sci. Pol. Oecon. 2010, 9, 227–239. [Google Scholar]
  48. Katarzyna Łogwiniuk The use of taxonomic methods in the comparative analysis of the access to the ICT infrastructure by schoolchildren in Poland. Econ. Manag. 2011, 1, 7–23.
  49. Sołek, K.; Sowa, B. Diversification of the Social Development of Podkarpackie Province Communes. Econ. Reg. Stud./Stud. Ekon. I Reg. 2019, 12, 45–55. [Google Scholar] [CrossRef] [Green Version]
  50. Niemczyk, A. Poziom rozwoju społecznego w nowym układzie administracyjnym Polski. Przegląd Stat. 2001, 48, 289–300. [Google Scholar]
  51. Nowak, E. Metody Taksonomiczne w Klasyfikacji Obiektów Społeczno-Gospodarczych; Państwowe Wydaw: Ekonomiczne, Poland, 1990; ISBN 8320806895, 9788320806892. [Google Scholar]
  52. Ilnicki, D. Próba Określenia Zmienności Czasowej Zjawisk Przestrzennych Metodami Wzorcowymi—Przykład Metody Hellwiga. In Możliwości I Ograniczenia Zastosowań Metod Badawczych W Geografii Społeczno-Ekonomicznej I Gospodarce Przestrzennej; H. Rogacki, Ed.; Bogucki Wydawnictwo Naukowe: Poznań, Poland, 2002. [Google Scholar]
  53. Schober, P.; Schwarte, L.A. Correlation coefficients: Appropriate use and interpretation. Anesth. Analg. 2018, 126, 1763–1768. [Google Scholar] [CrossRef]
  54. Guliford, J.P. Podstawowe Metody Statystyczne W Psychologii I Pedagogice; PWN: Warsaw, Poland, 1960. [Google Scholar]
  55. Cohen, J. Statistical Power Analysis for the Behavioral Sciences, Revised ed.; New York University: New York, NY, USA, 2013. [Google Scholar]
  56. Nowak, A.; Janulewicz, P.; Krukowski, A.; Bujanowicz-Haraś, B. Diversification of the level of agricultural development in the member states of the European Union. Cah. Agric. 2016. [Google Scholar] [CrossRef]
  57. Reiff, M.; Surmanová, K.; Balcerzak, A.P.; Pietrzak, M.B. Multiple criteria analysis of European union agriculture. J. Int. Stud. 2016. [Google Scholar] [CrossRef]
  58. Ślusarz, G.; Cierpial-Wolan, M. Development of entrepreneurship in valuable natural rural areas. Econ. Agro-Aliment. 2019. [Google Scholar] [CrossRef]
  59. Krukowski, A.; Nowak, A.; Różańska-Boczula, M. Evaluation of Agriculture Development in the Member States of the European Union in the years 2007–2015. In Proceedings of the 31st International Business Information Management Association Conference, IBIMA 2018, Seville, Spain, 15–16 November 2018. [Google Scholar]
  60. Walenia, A. Zmiany w administracji rolnej i ich wpływ na wdrażanie instrumentów wsparcia rolnictwa w Polsce. Pr. Nauk. Uniw. Ekon. We Wrocławiu 2019, 63, 185–198. [Google Scholar] [CrossRef]
  61. Niewiadomski, A. Status prawny Krajowego Ośrodka Wsparcia Rolnictwa. Stud. Iurid. 2018, 72, 279–293. [Google Scholar] [CrossRef]
  62. Bisaga, A.; Sokołowska, S. Barriers to the development of family farms in the opinion of their owners from the Opolskie Voivodeship. Studia 2018. [Google Scholar] [CrossRef]
  63. Bąk, M. Rola Nieruchomości Rolnych Skarbu Państwa W Kształtowaniu Struktury Agrarnej W Województwie Warmińsko-Mazurskim. Acta Sci. Pol. Adm. Locorum 2019, 18, 141–152. [Google Scholar]
  64. Mickiewicz, B.; Mickiewicz, A. Role of Agricultural Property Agency in Process of Land Policy Implementation. Ann. Pol. Assoc. Agric. Agribus. Econ. 2017, XIX, 110–115. [Google Scholar] [CrossRef]
  65. Czechowski, P. Agencja Nieruchomości Rolnych-restrukturyzacja czy likwidacja? Przegląd Prawa Rolnego 2008, 2, 76–97. [Google Scholar]
  66. Podgórski, B.; Witochowski, L. Gospodarowanie nieruchomościami Zasobu Własności Rolnej Skarbu Państwa. Wieś I Rol. 2014, 20, 173–188. [Google Scholar]
  67. Foryś, I.; Putek-Szeląg, E. Przesłanki inwestowania w nieruchomości rolne na przykładzie zasobów AWRSP i ANR w zachodniopomorskim. Stud. Mater. Tow. Nauk. Nieruchom. 2008, 16, 37–47. [Google Scholar]
Figure 1. The state has authorized the National Agricultural Support Centre (NASC) to perform the tasks; source: [29].
Land 10 00187 g001
Figure 2. Thematic scope of activities of the National Agricultural Support Centre.
Land 10 00187 g002
Figure 3. Management of agricultural land by the NASC in Poland, divided into voivodships, between 2006 and 2018.
Land 10 00187 g003
Figure 4. Correlation of the level of agricultural development determined by the Hellwig’s method with the NASC activities. Source: the authors.
Land 10 00187 g004
Table 1. Diagnostic variables used in the research.
SymbolDiagnostic Variables (Expressed as Indicators)
X1Share of agricultural land in the voivodship (%).
X2Land requiring reclamation per 100 ha of agricultural land (ha)
X3Non-use area per 100 ha of agricultural land (ha]
X4Population density in rural areas per 1 km2
X5Rural population of working age in % of total population
X6Registered unemployed persons living in rural areas per 1000 people
X7Balance of migration in rural areas
X8Working in agriculture per 100 ha of farmland
X9Investment outlays in agriculture per 1 ha of farmland (PLN)
X10Gross value of fixed assets in agriculture (PLN million)
X11Agricultural producers entered in the producers’ register
X12Number of tractors in agriculture
X13Agricultural land area per 1 tractor (ha)
X14Farm buildings put into use
X15Consumption of mineral or chemical fertilizers (NPK) per pure component (tons)
X16Structure of global agricultural production (Poland - 100%) (%)
X17Structure of agricultural commodity production (Poland - 100%) (%)
X18Structure of agricultural output - crop production (Poland 100%) (%)
X19Structure of agricultural output - animal production (Poland 100%) (%)
X20Structure of agricultural commodity production - plant production (Poland 100%) (%)
X21Structure of agricultural commodity production - animal production (Poland 100%) (%)
X22Area sown (thousand ha)
X23Area of grain sown (thousand ha)
X24Area of rape and colza seeding (thousand ha)
X25Potato cultivation area (thousand ha)
X26Sugar beet cultivation area (thousand ha)
X27Harvest of cereals (thousand tons)
X28Rape and colza harvest (thousand tons)
X29Potato harvest (thousand tons)
X30Sugar beet harvest (thousand tons)
X31Area of ground vegetable crops (thousand ha)
X32Harvest of ground vegetables (thousand tons)
X33Fruit tree cultivation area (thousand ha)
X34Fruit harvests from trees (thousand tons)
X35Slaughterhouse livestock production per 1 ha of farmland (kg)
X36Cow’s milk production per 1 ha of farmland (liters)
X37Production of hens’ eggs per 1 ha of farmland (units)
X38Purchase value of agricultural products - plant products [million PLN]
X39Purchase value of agricultural products - animal products [million PLN]
X40Total purchase value of agricultural products per 1 ha of agricultural land [PLN]
X41Purchase of agricultural products converted into grain units per 1 ha of agricultural land [dt]
X42Revenue of local government budgets from agricultural tax [PLN million]
X43Amount of realized payments within the framework of direct payments to agricultural land [thousand PLN]
Table 2. Activities of the National Agricultural Support Centre in the field of land management of the land owned by State Treasury until 2006.
VoivodshipAdmitted to the State TreasurySoldTransferred Free of ChargeContributed to CompaniesDivested in other FormsRest of the Land Owned by the State Treasury
Dolnośląskie495 378157 31627 3482 7452 844305 125
Kujawsko-pomorskie274 84679 18328 7381 13517 120148 670
Lubelskie189 97990 49412 7801791 13185 395
Lubuskie354 085115 42025 9802931 286211 106
Łódzkie79 60739 8132 3955053136 863
Małopolskie39 22814 3243 5235645220 765
Mazowieckie117 72053 3646 2296151 29256 220
Opolskie179 92752 5445 425520133121 305
Podkarparckie152 52575 28719 69225451656 776
Podlaskie127 98341 98613 1191064 12568 647
Pomorskie432 053188 59724 3831 0345 555212 484
Śląskie86 29223 7274 8151913357 526
Świętokrzyskie50 16422 3501 9064915825 701
Warmińsko-mazurskie818 065334 11642 7121 7194 535434 983
Wielkopolskie499 543147 59438 5194 9421 390307 098
Zachodniopomorskie820 545257 86947 67593423 294490 773
Total4 717 9401 693 984305 23915 78563 4952 639 437
Table 3. Activities of the National Agricultural Support Centre in the field of land management of the land owned by the State Treasury until 2018.
VoivodshipAdmitted to the State TreasurySoldTransferred Free of ChargeContributed to CompaniesDivested in other FormsRest of the Land Owned by the State Treasury
Dolnośląskie508 872262 45037 53910 5644 514193 805
Kujawsko-pomorskie276 025132 99433 0781 19825 78282 973
Lubelskie189 656132 84215 3492134 28836 964
Lubuskie354 920215 40129 69735210 63298 838
Łódzkie79 72755 7293 7775051 10318 613
Małopolskie39 28618 8345 24456966113 978
Mazowieckie118 79178 6167 9996352 68728 854
Opolskie181 662103 52110 14860761866 768
Podkarparckie153 824104 42921 7302581 08026 327
Podlaskie128 43065 63514 72611316 08931 867
Pomorskie431 559278 90930 1631 04129 61191 835
Śląskie87 11741 3389 28720752635 759
Świętokrzyskie50 56337 1412 6315662410 111
Warmińsko-mazurskie822 192508 39547 7091 748115 249149 091
Wielkopolskie499 971235 18743 6875 47010 501205 126
Zachodniopomorskie821 433440 87953 69194347 896278 024
Total4 744 0282 712 300366 45524 479271 8611 368 933
Table 4. Results of the research.
Voivodshipdi for 2006Class for 2006Ranking for 2006di for 2018Class for 2018Ranking for 2018Change in the Ranking
1Dolnośląskie0.246602470.2652246−1
2Kujawsko-pomorskie0.365493340.341738351
3Lubelskie0.345213350.36458233−2
4Lubuskie0.0803615160.083525160
5Łódzkie0.366992330.349937341
6Małopolskie0.257784460.248545482
7Mazowieckie0.525859120.59858411−1
8Opolskie0.1879664100.22345249−1
9Podkarpackie0.196794490.1670444145
10Podlaskie0.1794184110.2060574110
11Pomorskie0.1777694120.26041647−5
12Śląskie0.1720954130.190522412−1
13Świętokrzyskie0.200894480.2151684102
14Warmińsko-mazurskie0.1464454140.186128413−1
15Wielkopolskie0.531171110.579058121
16Zachodniopomorskie0.1456614150.1488264150
Publisher’s Note: MDPI stays neutral with regard to jurisdictional claims in published maps and institutional affiliations.

