
GIS-Based Landslide Susceptibility Mapping for Land Use Planning and Risk Assessment


Abstract
1. Introduction
2. Materials and Methods
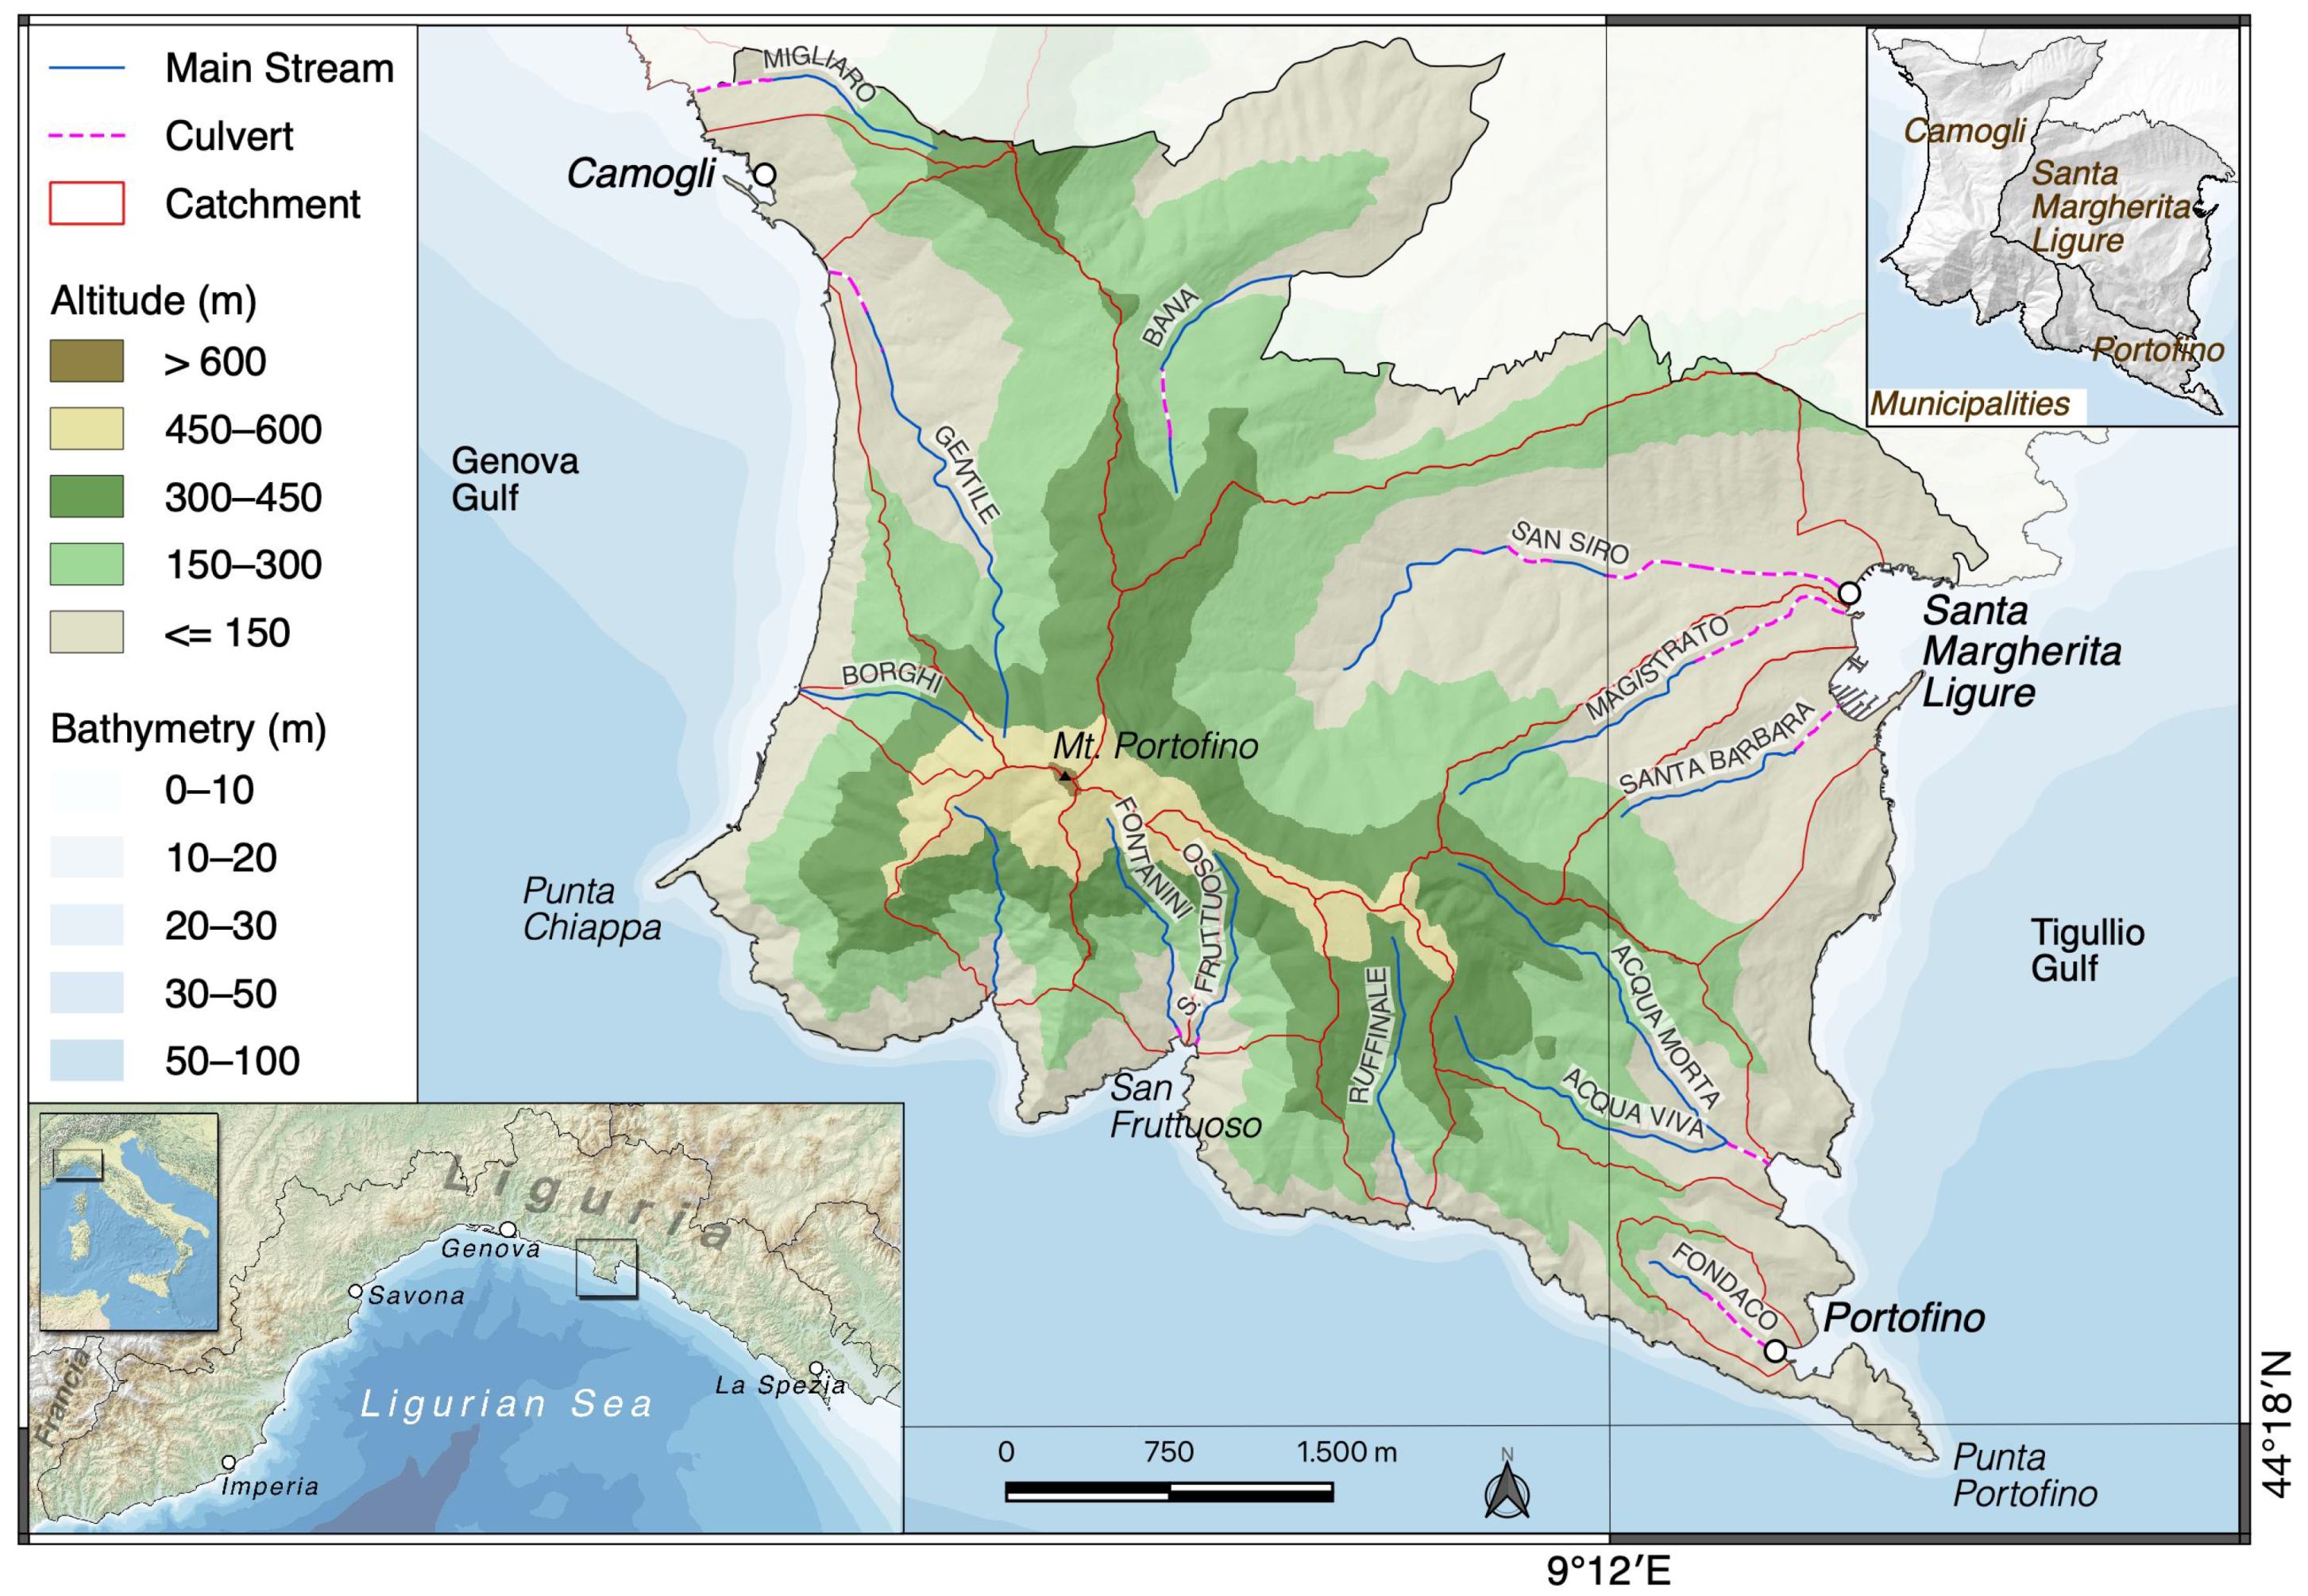
2.1. Study Area
2.2. Data and Research Methodology
2.3. Landslide Conditioning Factors
2.3.1. Lithology
2.3.2. Slope Aspect
2.3.3. Slope Acclivity
2.3.4. Land Use
2.3.5. Terraced Landscape
2.3.6. Hydrographic Elements Distance
2.3.7. Man-Made Cuts and Structures Distance
2.3.8. Existing Gravitational Processes
2.4. Analytic Hierarchy Process (AHP)
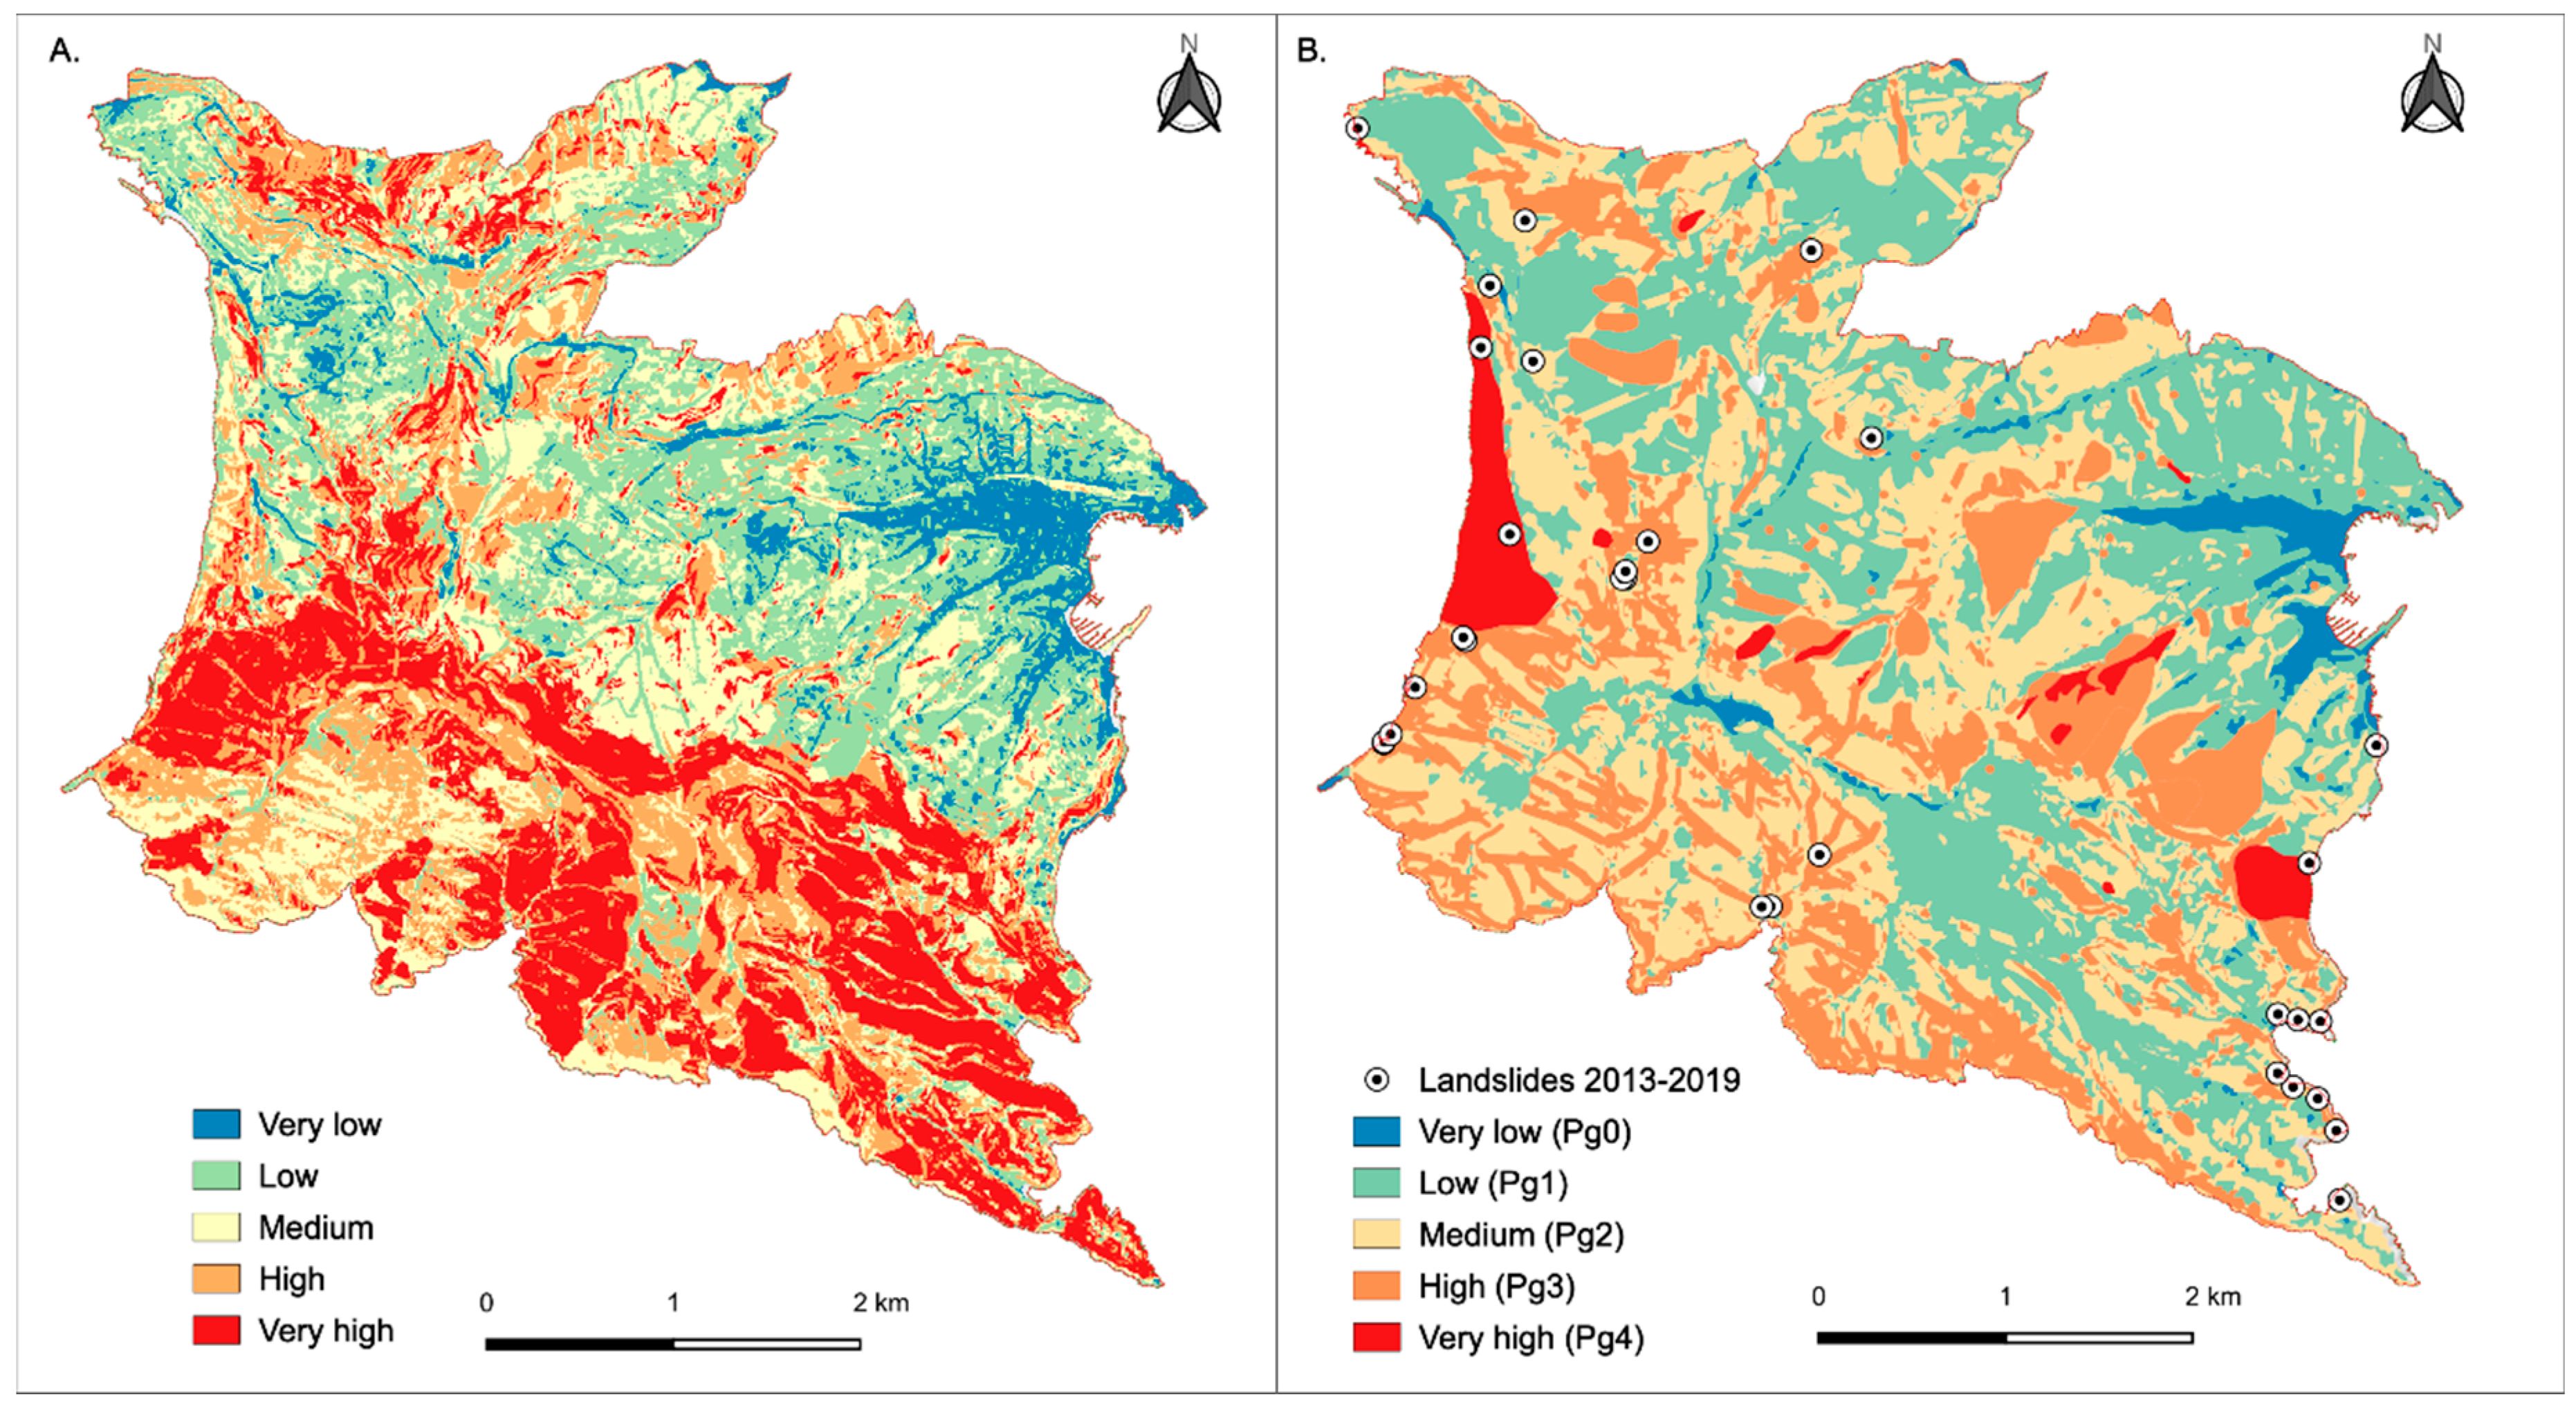
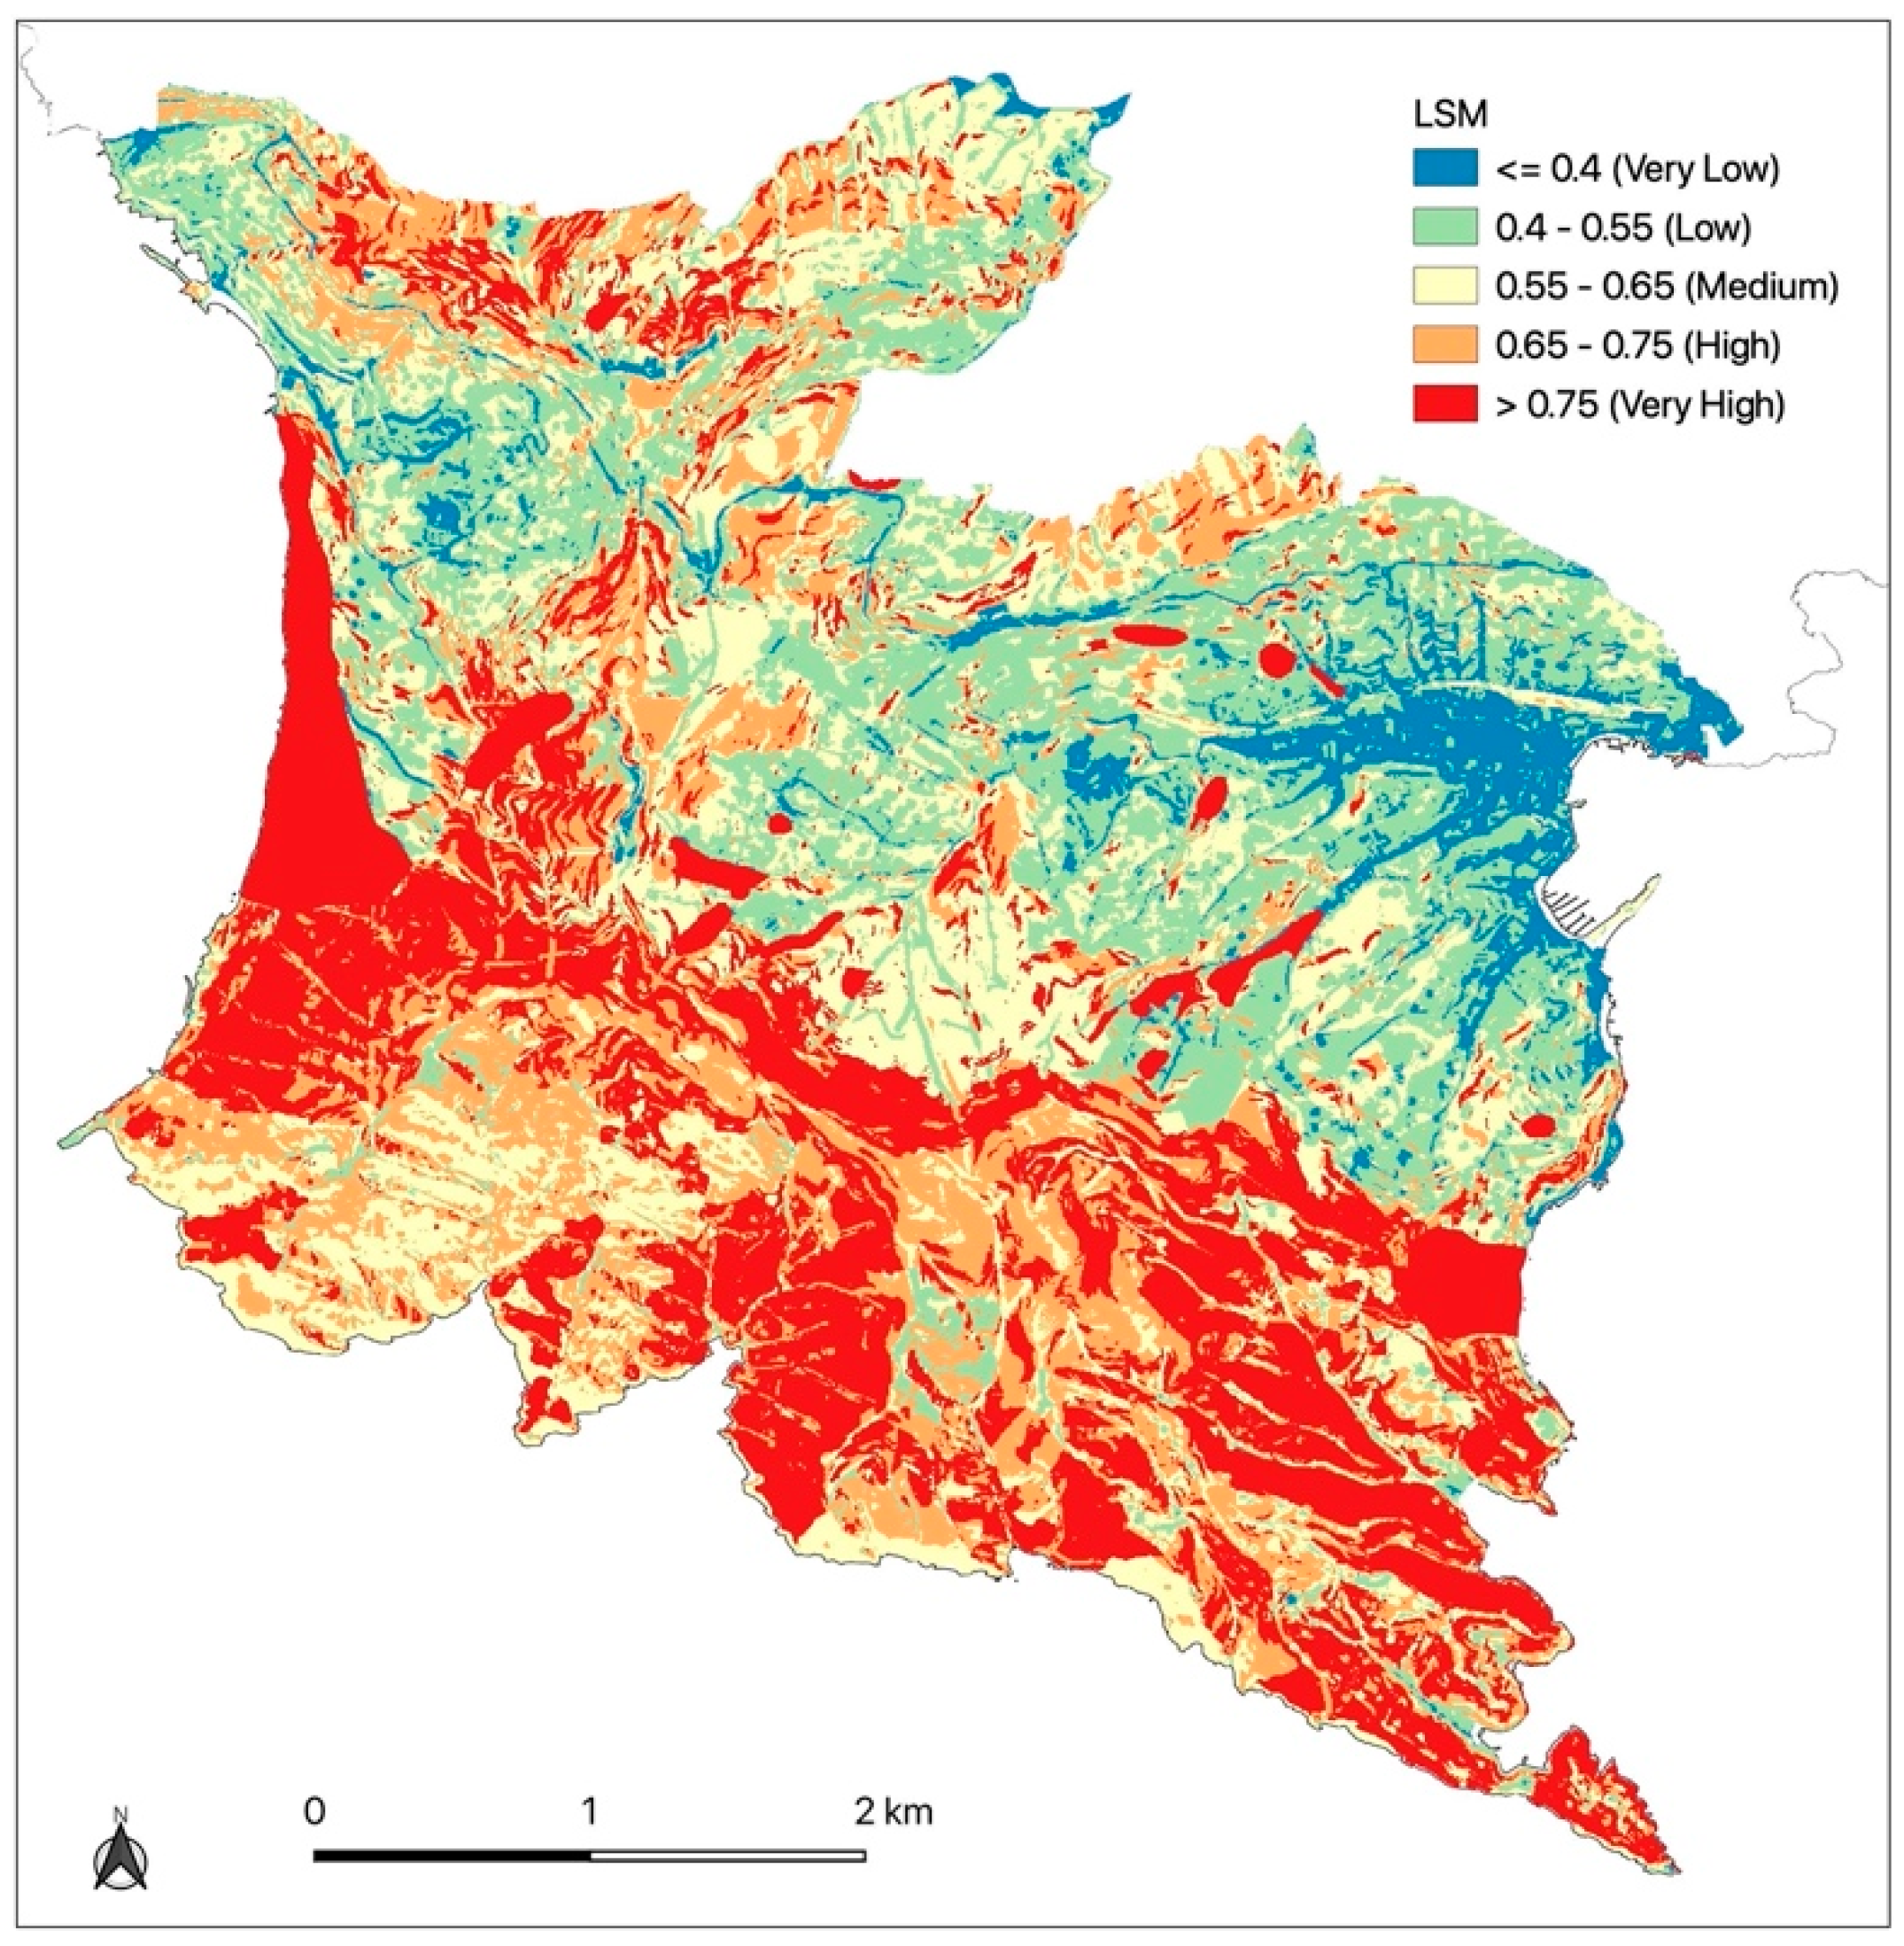
2.5. Landslide Susceptibility Map
3. Results
4. Discussion
5. Conclusions
Author Contributions
Funding
Institutional Review Board Statement
Informed Consent Statement
Acknowledgments
Conflicts of Interest
Appendix A
| Factor | 1 | 2 | 3 | 4 | 5 | 6 | 7 | 8 | 9 | Normalized Principal Eigenvector | Error |
| Lithology | 1 | 3 3/4 | 2/7 | 1/3 | 2 2/5 | 2 8/9 | 5 3/4 | 3 4/5 | 3 2/3 | 0.155 | 0.076 |
| Aspect | 1/4 | 1 | 1/4 | 3/8 | 2 | 2 1/4 | 2 3/8 | 2 1/7 | 3 | 0.090 | 0.040 |
| Acclivity | 3 4/7 | 3 3/4 | 1 | 2 5/9 | 4 1/3 | 7 | 7 | 6 1/8 | 4 1/8 | 0.311 | 0.107 |
| Land use | 2 3/4 | 2 3/5 | 2/5 | 1 | 2 3/5 | 3 | 4 1/2 | 4 1/2 | 4 1/2 | 0.197 | 0.093 |
| Terraced area | 2/5 | 1/2 | 1/4 | 3/8 | 1 | 4 2/7 | 3 1/4 | 4/9 | 5/9 | 0.064 | 0.033 |
| Distance hydrographic elements | 1/3 | 4/9 | 1/7 | 1/3 | 1/4 | 1 | 7/9 | 5/9 | 3/8 | 0.034 | 0.015 |
| Distance man-made cuts | 1/6 | 3/7 | 1/7 | 2/9 | 1/3 | 1 2/7 | 1 | 5/8 | 3/8 | 0.031 | 0.015 |
| Distance man-made structures | 1/4 | 1/2 | 1/6 | 2/9 | 2 2/9 | 1 4/5 | 1 3/5 | 1 | 3/4 | 0.055 | 0.003 |
| Existing landslides | 2/7 | 1/3 | 1/4 | 2/9 | 1 7/9 | 2 3/5 | 2 3/5 | 1 1/3 | 1 | 0.063 | 0.024 |
Appendix B
| Factor Classes | 1 | 2 | 3 | 4 | 5 | 6 | 7 | 8 | 9 | 10 | Normalized Principal Eigenvector | Error |
| Lithology | ||||||||||||
| Alluvial deposits | 1 | 1/5 | 2/7 | 1/8 | 1/8 | 0.031 | 0.016 | |||||
| Slope covers | 5 | 1 | 2 1/6 | 1/7 | 1/6 | 0.093 | 0.040 | |||||
| Fills | 3 3/8 | 1/2 | 1 | 1/7 | 1/6 | 0.061 | 0.022 | |||||
| Flysch | 8 1/3 | 7 1/6 | 7 1/9 | 1 | 2 6/7 | 0.507 | 0.218 | |||||
| Conglomerate | 7 3/4 | 6 1/5 | 6 | 1/3 | 1 | 0.308 | 0.140 | |||||
| Aspect | ||||||||||||
| N | 1 | 1/3 | 1/5 | 1 1/7 | 2/7 | 2/9 | 1/6 | 1/8 | 2 5/9 | 0.318 | 0.012 | |
| NE | 3 | 1 | 1/4 | 2 3/8 | 1 | 2/5 | 2/7 | 1/6 | 4 1/2 | 0.617 | 0.020 | |
| E | 5 | 4 1/3 | 1 | 6 1/2 | 5 | 3 2/7 | 2 3/4 | 3/4 | 7 | 0.247 | 0.081 | |
| SE | 7/8 | 3/7 | 1/7 | 1 | 1/3 | 2/7 | 2/7 | 1/4 | 1 8/9 | 0.355 | 0.014 | |
| S | 3 3/8 | 1 | 1/5 | 2 3/4 | 1 | 3/8 | 1/3 | 1/5 | 3 2/7 | 0.628 | 0.021 | |
| SW | 4 4/7 | 2 1/2 | 1/3 | 3 1/3 | 2 5/7 | 1 | 5/9 | 2/7 | 5 1/3 | 0.111 | 0.033 | |
| W | 5 4/7 | 3 3/5 | 1/3 | 3 1/3 | 3 | 1 7/9 | 1 | 1/3 | 6 1/7 | 0.144 | 0.046 | |
| NW | 7 3/4 | 6 1/7 | 1 1/3 | 4 | 4 5/6 | 3 2/3 | 3 1/9 | 1 | 8 1/6 | 0.285 | 0.098 | |
| Zenith | 2/5 | 2/9 | 1/7 | 1/2 | 1/3 | 1/5 | 1/6 | 1/8 | 1 | 0.021 | 0.008 | |
| Acclivity | ||||||||||||
| 0–10% | 1 | 1 | 1/4 | 1/4 | 1/7 | 1/5 | 1/5 | 0.033 | 0.010 | |||
| 11–20% | 1 | 1 | 1/4 | 1/4 | 1/6 | 1/5 | 1/6 | 0.033 | 0.011 | |||
| 21–35% | 4 1/3 | 4 1/8 | 1 | 1 | 1/4 | 2/7 | 2/7 | 0.090 | 0.032 | |||
| 36–50% | 4 1/8 | 4 | 1 | 1 | 1/4 | 2/7 | 1/3 | 0.090 | 0.027 | |||
| 51–75% | 6 4/7 | 6 | 4 | 4 | 1 | 2 | 2 1/3 | 0.331 | 0.102 | |||
| 76–100% | 5 2/5 | 5 1/2 | 3 2/3 | 3 4/9 | 1/2 | 1 | 1 1/7 | 0.221 | 0.064 | |||
| >100% | 5 2/9 | 5 2/3 | 3 4/9 | 3 | 3/7 | 7/8 | 1 | 0.202 | 0.057 | |||
Appendix C
| Factor Classes | 1 | 2 | 3 | 4 | 5 | 6 | 7 | 8 | 9 | 10 | Normalized Principal Eigenvector | Error |
| Land Use | ||||||||||||
| Urban fabric | 1 | 5 | 3 5/8 | 5 | 2/5 | 4 8/9 | 4 1/2 | 1/5 | 3 1/4 | 4 4/7 | 0.149 | 0.042 |
| Industrial/commercial/transport units | 1/5 | 1 | 1 1/7 | 1 1/3 | 2/9 | 2/3 | 1 | 1/7 | 4/9 | 1 1/7 | 0.038 | 0.009 |
| Artificial non-agricultural areas | 2/7 | 7/8 | 1 | 1 1/7 | 1/5 | 1 1/2 | 1 1/7 | 1/7 | 1/2 | 1 1/7 | 0.041 | 0.006 |
| Arable land | 1/5 | 3/4 | 7/8 | 1 | 1/6 | 1 1/3 | 3/4 | 1/7 | 3/5 | 3/5 | 0.034 | 0.008 |
| Permanent crops | 2 1/2 | 4 5/9 | 5 | 5 1/2 | 1 | 5 1/8 | 4 3/4 | 1/3 | 4 2/9 | 5 5/9 | 0.204 | 0.067 |
| Pastures | 1/5 | 1 3/7 | 2/3 | 3/4 | 1/5 | 1 | 7/8 | 1/7 | 2/5 | 2/3 | 0.034 | 0.011 |
| Heterogeneous agricultural areas | 2/9 | 1 | 7/8 | 1 1/3 | 1/5 | 1 1/7 | 1 | 1/7 | 1/2 | 1 | 0.038 | 0.006 |
| Forests | 4 3/4 | 7 1/9 | 6 5/7 | 6 5/7 | 3 | 6 5/7 | 7 1/4 | 1 | 7 | 7 1/3 | 0.358 | 0.164 |
| Shrubs ecc. | 1/3 | 2 2/9 | 1 8/9 | 1 2/3 | 1/4 | 2 5/9 | 2 1/6 | 1/7 | 1 | 1 3/4 | 0.064 | 0.015 |
| Open space with little/no vegetation | 2/9 | 7/8 | 7/8 | 1 2/3 | 1/6 | 1 1/2 | 1 | 1/7 | 4/7 | 1 | 0.040 | 0.008 |
| Terraced areas | ||||||||||||
| Area with terraces | 1 | 1/3 | 0.261 | - | ||||||||
| Area without terraces | 2 5/6 | 1 | 0.739 | - | ||||||||
| Hydrographic elements distance | ||||||||||||
| Watercourses, d > 10m | 1 | 6 1/3 | 2/3 | 6 6/7 | 0.394 | 0.077 | ||||||
| Watercourses, d < 10m | 1/6 | 1 | 1/6 | 2 | 0.081 | 0.002 | ||||||
| Springs, d > 10 m | 1 3/7 | 6 1/3 | 1 | 6 6/7 | 0.471 | 0.081 | ||||||
| Springs, d < 10 m | 1/7 | 1/2 | 1/7 | 1 | 0.054 | 0.012 | ||||||
| Man-made cuts distance | ||||||||||||
| Man-made cuts, d > 5 m | 1 | 6 1/2 | 5 4/7 | 6 3/4 | 0.672 | 0.119 | ||||||
| Trails, d < 5 m | 1/7 | 1 | 1 1/7 | 1 7/9 | 0.127 | 0.018 | ||||||
| Main roads, d < 5 m | 1/6 | 7/8 | 1 | 1 7/9 | 0.122 | 0.013 | ||||||
| Minor roads, d < 5 m | 1/7 | 5/9 | 5/9 | 1 | 0.79 | 0.014 | ||||||
| Man-made structures distances | ||||||||||||
| Man-made structures, d > 10 m | 1 | 3 8/9 | 5 2/9 | 2 5/6 | 0.540 | 0.104 | ||||||
| Buildings, d < 10 m | 1/4 | 1 | 2 5/6 | 3/5 | 0.160 | 0.038 | ||||||
| Other manufacts, d < 10 m | 1/5 | 1/3 | 1 | 1/3 | 0.077 | 0.019 | ||||||
| Retaining walls, d < 10 m | 1/3 | 1 2/3 | 3 | 1 | 0.222 | 0.029 | ||||||
| Existing landslides (IFFI Project) | ||||||||||||
| Inactive/stabilized | 1 | 1/2 | 2/9 | 1 1/2 | 1/7 | 1/6 | 0.044 | 0.015 | ||||
| Dormant | 2 1/6 | 1 | 1/3 | 1 1/3 | 1/6 | 1/5 | 0.060 | 0.017 | ||||
| Active/reactivated/suspended | 4 4/7 | 3 1/9 | 1 | 4 3/8 | 1/5 | 1/4 | 0.133 | 0.053 | ||||
| Area affected by widespread shallow landslides | 2/3 | 3/4 | 2/9 | 1 | 1/7 | 1/6 | 0.040 | 0.012 | ||||
| Assumed stable area, d > 50 m | 6 2/3 | 6 1/7 | 5 1/3 | 6 2/3 | 1 | 2 | 0.423 | 0.171 | ||||
| Assumed stable area, d < 50 m | 5 7/9 | 5 1/7 | 4 2/7 | 6 4/9 | 1/2 | 1 | 0.300 | 0.123 | ||||
References
- Heersink, P. World Atlas of natural hazards. Cartographica 2005, 40, 133–134. [Google Scholar] [CrossRef]
- Petley, D. Global patterns of loss of life from landslides. Geology 2012, 40, 927–930. [Google Scholar] [CrossRef]
- Froude, M.J.; Petley, D.N. Global fatal landslide occurrence from 2004 to 2016. Nat. Hazards Earth Syst. Sci. 2018, 18, 2161–2181. [Google Scholar] [CrossRef]
- Haque, U.; da Silva, P.F.; Devoli, G.; Pilz, J.; Zhao, B.; Khaloua, A.; Wilopo, W.; Andersen, P.; Lu, P.; Lee, J.; et al. The human cost of global warming: Deadly landslides and their triggers (1994–2014). Sci. Total. 2019, 682, 673–684. [Google Scholar] [CrossRef] [PubMed]
- Hungr, O.; Leroueil, S.; Picarelli, L. The Varnes classification of landslide types, an update. Landslides 2014, 1, 167–194. [Google Scholar] [CrossRef]
- Varnes, D.J. Landslide Hazard. Zonation—A Review of Principles and Practice; UNESCO: Paris, France, 1984; p. 63. [Google Scholar]
- Guzzetti, F.; Carrara, A.; Cardinali, M.; Reichenbach, P. Landslide hazard evaluation: A review of current techniques and their application in a multi-scale study, Central Italy. Geomorphology 1999, 31, 181–216. [Google Scholar] [CrossRef]
- Brabb, E.E. Innovative approaches to landslide hazard mapping. In Proceedings of the 4th International Landslides Symposium, Toronto, Canada, 16–21 September 1984; Volume 1, pp. 307–324. [Google Scholar]
- Pellicani, R.; Argentiero, I.; Spilotro, G. GIS-based predictive models for regional-scale landslide susceptibility assessment and risk mapping along road corridors. Geomat. Nat. Haz. Risk 2017, 8, 1012–1033. [Google Scholar] [CrossRef]
- Van Westen, C.J.; Van Asch, T.W.J.; Soeters, R. Landslide hazard and risk zonation: Why is it still so difficult? Bull. Eng. Geol. Env. 2006, 65, 167–184. [Google Scholar] [CrossRef]
- Dai, F.C.; Lee, C.F.; Ngai, Y.Y. Landslide risk assessment and management: An overview. Eng Geol. 2002, 64, 65–87. [Google Scholar] [CrossRef]
- Cascini, L.; Bonnard, C.; Corominas, J.; Jibson, R.; Montero-Olarte, J. Landslide hazard and risk zoning for urban planning and development. In Landslide Risk Management; Taylor and Francis: London, UK, 2005; pp. 199–235. [Google Scholar] [CrossRef]
- Corominas, J.; Van Westen, C.; Frattini, P. Recommendations for the quantitative analysis of landslide risk. Bull. Eng. Geol. Environ. 2014, 73, 209–263. [Google Scholar] [CrossRef]
- Brenning, A. Spatial prediction models for landslide hazards: Review, comparison and evaluation. Nat. Hazards Earth Syst. Sci. 2005, 5, 853–862. [Google Scholar] [CrossRef]
- Reichenbach, P.; Rossi, M.; Malamud, B.M.; Mihir, M.; Guzzetti, F. A review of statistically-based landslide susceptibility models. Earth Sci. Rev. 2018, 180, 60–91. [Google Scholar] [CrossRef]
- Yalcin, A.; Reis, S.; Aydinoglu, A.C.; Yomralioglu, T. A GIS-based comparative study of frequency ratio, analytical hierarchy process, bivariate statistics and logistics regression methods for landslide susceptibility mapping in Trabzon, NE Turkey. Catena 2011, 85, 274–287. [Google Scholar] [CrossRef]
- Turconi, L.; Luino, F.; Gussoni, M.; Faccini, F.; Giardino, M.; Casazza, M. Intrinsic Environmental Vulnerability as Shallow Landslide Susceptibility in Environmental Impact Assessment. Sustainability 2019, 11, 6285. [Google Scholar] [CrossRef]
- Dou, J.; Yunus, A.P.; Tien Bui, D.; Sahana, M.; Chen, C.W.; Zhu, Z.; Weidong, W.; Thai Pham, B. Evaluating GIS-based multiple statistical models and data mining for earthquake and rainfall-induced landslide susceptibility using the LiDAR DEM. Remote Sens. 2019, 11, 638. [Google Scholar] [CrossRef]
- Lai, J.-S.; Tsai, F. Improving GIS-based Landslide Susceptibility Assessments with Multi-temporal Remote Sensing and Machine Learning. Sensors 2019, 19, 3717. [Google Scholar] [CrossRef] [PubMed]
- Aleotti, P.; Chowdhury, R. Landslide hazard assessment: Summary review and new perspectives. Bull. Eng. Geol. Environ. 1999, 58, 21–44. [Google Scholar] [CrossRef]
- Fell, R.; Corominas, J.; Bonnard, C.; Cascini, L.; Leroi, E.; Savage, W.Z. Guidelines for landslide susceptibility, hazard and risk zoning for land use planning. Eng. Geol. 2008, 102, 85–98. [Google Scholar] [CrossRef]
- Van Westen, C.J.; Rengers, N.; Soeters, R. Use of Geomorphological Information in Indirect Landslide Susceptibility Assessment. Nat. Hazards 2003, 30, 399–419. [Google Scholar] [CrossRef]
- Van Den Eeckhaut, M.; Reichenbach, P.; Guzzetti, F.; Rossi, M.; Poesen, J. Combined landslide inventory and susceptibility assessment based on different mapping units: An example from the Flemish Ardennes, Belgium. Nat. Hazards Earth Syst. Sci. 2009, 9, 507–521. [Google Scholar] [CrossRef]
- Marsala, V.; Galli, A.; Paglia, G.; Miccadei, E. Landslide Susceptibility Assessment of Mauritius Island (Indian Ocean). Geosciences 2019, 9, 493. [Google Scholar] [CrossRef]
- Komac, M. A landslide susceptibility model using the analytical hierarchy process method and multivariate statistics in perialpine Slovenia. Geomorphology 2006, 74, 17–28. [Google Scholar] [CrossRef]
- Fan, W.; Wei, X.S.; Cao, Y.B.; Zheng, B. Landslide susceptibility assessment using the certainty factor and analytic hierarchy process. J. Mt. Sci. 2017, 14, 906–925. [Google Scholar] [CrossRef]
- Roccati, A.; Faccini, F.; Luino, F.; Ciampalini, A.; Turconi, L. Heavy Rainfall Triggering Shallow Landslides: A Susceptibility Assessment by a GIS-Approach in a Ligurian Apennine Catchment (Italy). Water 2019, 11, 605. [Google Scholar] [CrossRef]
- Montgomery, D.R.; Dietrich, W.E. A physically based model for the topographic control of shallow landsliding. Water Resour. Res. 1994, 30, 1153–1171. [Google Scholar]
- Lu, N.; Godt, J.W. Infinite-slope stability under steady un- saturated seepage conditions. Water Resour. Res. 2008, 44, W11404. [Google Scholar] [CrossRef]
- Thiery, Y.; Vandromme., R.; Maquaire, O.; Bernardie, S. Landslide Susceptibility Assessment by EPBM (Expert Physically Based Model): Strategy of Calibration in Complex Environment. In Advancing Culture of Living with Landslides; Workshop on World Landslide Forum 2017; Mikos, M., Tiwari, B., Yin, Y., Sassa, K., Eds.; Springer: Cham, Switzerland, 2017; pp. 917–926. [Google Scholar] [CrossRef]
- Lee, S.; Ryu, J.-H.; Won, J.-S.; Park, H.-J. Determination and application of the weights for landslide susceptibility mapping using an artificial neural network. Eng. Geol. 2004, 71, 289–302. [Google Scholar] [CrossRef]
- Conforti, M.; Pascale, S.; Robustelli, G.; Sdao, F. Evaluation of prediction capability of the artificial neural networks for mapping landslide susceptibility in the Turbolo River catchment (northern Calabria, Italy). Catena 2014, 113, 236–250. [Google Scholar] [CrossRef]
- Tsangaratos, P.; Loupasakis, C.; Nikolakopoulos, K.; Angelitsa, V.; Ilia, I. Developing a landslide susceptibility map based on remote sensing, fuzzy logic and expert knowledge of the Island of Lefkada, Greece. Environ. Earth Sci. 2018, 77, 363. [Google Scholar] [CrossRef]
- Yalcin, A. GIS-based landslide susceptibility mapping using analytical hierarchy process and bivariate statistics in Ardesen (Turkey): Comparisons of results and confirmations. Catena 2008, 72, 1–12. [Google Scholar] [CrossRef]
- Pourghasemi, H.R.; Pradhan, B.; Gokceoglu, C. Application of fuzzy logic and analytical hierarchy process (AHP) to landslide susceptibility mapping at Haraz watershed, Iran. Nat. Hazards 2012, 63, 965–996. [Google Scholar] [CrossRef]
- Cignetti, M.; Godone, D.; Giordan, D. Shallow landslide susceptibility, Rupinaro catchment, Liguria (northwestern Italy). J. Maps 2019, 15, 333–345. [Google Scholar] [CrossRef]
- Panchal, S.; Shrivastava, A.K. Application of analytic hierarchy process in landslide susceptibility mapping at regional scale in GIS environment. J. Stat. Manag. Syst. 2020, 23, 199–206. [Google Scholar]
- Gamper, C.D.; Thöni, M.; Weck-Hannemann, H. A conceptual approach to the use of Cost Benefit and Multi Criteria Analysis in natural hazard management. Nat. Hazards Earth Syst. Sci. 2006, 6, 293–302. [Google Scholar] [CrossRef]
- Paliaga, G.; Faccini, F.; Luino, F.; Turconi, L. A spatial multicriteria prioritizing approach for geohydrological risk mitigation planning in small and densely urbanized Mediterranean basins. Nat. Hazards Earth Syst. Sci. 2019, 19, 53–69. [Google Scholar] [CrossRef]
- Regione Liguria. Carta Geologica Regionale (CGR), scala 1:25,000, Tav. 231.1, 231.4—Chiavari Recco. 2005. Available online: https://geoportal.regione.liguria.it/catalogo/mappe.html (accessed on 17 November 2020).
- Faccini, F.; Piccazzo, M.; Robbiano, A.; Roccati, A. Applied geomorphological map of the Portofino municipal territory. J. Map 2012, 4, 451–462. [Google Scholar] [CrossRef]
- Bonaria, V.; Faccini, F.; Galiano, I.C.; Sacchini, A. Hydrogeology of conglomerate fractured-rock aquifers: An example from the Portofino’s Promontory (Italy). Rend. Online Soc. Geol. Ital. 2016, 41, 22–25. [Google Scholar] [CrossRef]
- Corsi, B.; Elter, F.M.; Giammarino, S. Structural fabric of the Antola Unit (Riviera di Levante, Italy) and implications for its alpine versus apennine origin. Ofioliti 2001, 26, 1–8. [Google Scholar]
- Levi, N.; Ellero, A.; Ottria, G.; Pandolfi, L. Polyrogenic deformation history recognized at very shallow structural levels: The case of the Antola Unit (Northern Apennine, Italy). J. Struct. Geol. 2006, 28, 1694–1709. [Google Scholar] [CrossRef]
- Fanucci, F.; Nosengo, S. Rapporti tra neotettonica e fenomeni morfogenetici del versante marittimo dell’Appennino ligure e del margine continentale. Boll. Soc. Geol. Ital. 1979, 96, 41–51. (In Italian) [Google Scholar]
- Faccini, F.; Piccazzo, M.; Robbiano, A. Natural hazards in San Fruttuoso of Camogli (Portofino Park, Italy): A case study of a debris flow in a coastal environment. Ital. J. Geosci. 2009, 128, 641–654. [Google Scholar] [CrossRef]
- Brandolini, P.; Faccini, F.; Piccazzo, M. Geomorphological hazard and tourist vulnerability along Portofino Park trails (Italy). Nat. Hazard Earth Syst. Sci. 2009, 6, 563–571. [Google Scholar] [CrossRef]
- Faccini, F.; Robbiano, A.; Sacchini, A. Geomorphic hazard and intense rainfall: The case study of the Recco Stream Catchment (Eastern Liguria, Italy). Nat. Hazard. Earth Syst. Sci. 2012, 12, 893–903. [Google Scholar] [CrossRef]
- Brandolini, P.; Faccini, F.; Pelfini, M.; Firpo, M. A complex landslide along the Eastern Liguria rocky coast (Italy). Rend. Online Soc. Geol. Ital. 2013, 28, 28–31. [Google Scholar]
- Brandolini, P.; Faccini, F.; Robbiano, A.; Terranova, R. Geomorphological hazards and monitoring activity along the western rocky coast of the Portofino Promontory (Italy). Quater. Int. 2006, 171–172, 131–142. [Google Scholar] [CrossRef]
- Paliaga, G.; Luino, F.; Turconi, L.; De Graff, J.V.; Faccini, F. Terraced Landscapes on Portofino Promontory (Italy): Identification, Geo-Hydrological Hazard and Management. Water 2020, 12, 435. [Google Scholar] [CrossRef]
- Food and Agricultural Organization of the United Nations—FAO. World Reference Base for Soil Resources, 2nd ed.; FAO: Rome, Italy, 2006; Available online: http://www.fao.org/3/a-a0510e.pdf (accessed on 17 November 2020).
- Rellini, I.; Olivari, S.; Scopesi, C.; Firpo, M. The soils of the Portofino Promontory/(Italy): Distribution, genesis and paleoenvironmental implications. Geogr. Fis. E Din. Quat. 2017, 40, 211–232. [Google Scholar]
- Faccini, F.; Brandolini, P.; Robbiano, A.; Perasso, L.; Sola, A. Instability, precipitation phenomena and land planning: The flood of 2002 in lower Lavagna valley (Eastern Liguria, Italy). Geogr. Fis. E Din. Quat. 2005, Suppl. VII, 145–153. [Google Scholar]
- Anagnostopoulou, C.; Tolika, K.; Flocas, H.; Maheras, P. Cyclones in the Mediterranean region: Present and future climate scenarios derived from a general circulation model (HadAM3P). Adv. Geosci. 2006, 7, 9–14. [Google Scholar] [CrossRef]
- Sacchini, A.; Ferraris, F.; Faccini, F.; Firpo, M. Environmental climatic maps of Liguria. J. Maps 2012, 8, 199–207. [Google Scholar] [CrossRef]
- Paliaga, G.; Donadio, C.; Bernardi, M.; Faccini, F. High-resolution lightning detection and possible relationship with rainfall events over the Central Mediterranean Area. Remote Sens. 2019, 11, 1601. [Google Scholar] [CrossRef]
- Acquaotta, F.; Faccini, F.; Fratianni, S.; Paliaga, G.; Sacchini, A.; Vilímek, V. Increased flash flooding in Genoa Metropolitan Area: A combination of climate changes and soil consumption? Meteorol. Atmos. Phys. 2019, 131, 1099–1110. [Google Scholar] [CrossRef]
- Roccati, A.; Paliaga, G.; Luino, F.; Faccini, F.; Turconi, L. Rainfall threshold for shallow landslides initiation and analysis of long-term rainfall trends in a Mediterranean area. Atmosphere 2020, 11, 1367. [Google Scholar] [CrossRef]
- Guzzetti, F.; Cardinali, M.; Reichenbach, P. The AVI Project: A bibliographical and archive inventory of landslides and floods in Italy. Environ. Manag. 1994, 18, 623–633. [Google Scholar] [CrossRef]
- Hungr, O.; Evans, S.G.; Bovis, M.J.; Hutchinson, J.N. A review of the classification of landslides of the flow type. Environ. Eng. Geosci. 2001, 7, 221–238. [Google Scholar] [CrossRef]
- European Environmental Agency—EEA. CORINE Land Cover Technical Guide. Part 2: Nomenclature; Office for Official Publications of the European Communities: Luxembourg, 1995. [Google Scholar]
- Regione Liguria. Inventario dei Fenomeni Franosi Scale 1:10,000—Progetto IFFI (Last Update 2014). Available online: https://geoportal.regione.liguria.it/catalogo/mappe.html (accessed on 17 November 2020).
- Faccini, F.; Gabellieri, N.; Paliaga, G.; Piana, P.; Angelini, S.; Coratza, P. Geoheritage map of the Portofino Natural Park (Italy). J. Maps 2018, 14, 87–96. [Google Scholar] [CrossRef]
- Polemio, M.; Petrucci, O. Occurrence of landslide events and the role of climate in the twentieth century in Calabria, southern Italy. Q. J. Eng. Geol. Hydrog. 2010, 43, 403–415. [Google Scholar] [CrossRef]
- Alexander, D. On the causes of landslides: Human activities, perception, and natural processes. Environ. Geol. Water Sci. 1992, 20, 165–179. [Google Scholar] [CrossRef]
- Glade, T. Landslide occurrence as a response to land use change: A review of evidence from New Zealand. Catena 2003, 51, 297–314. [Google Scholar] [CrossRef]
- Bruschi, V.M.; Bonachea, J.; Remondo, J.; Gomez-Arozamena, J.; Rivas, V.; Barbieri, M.; Capocchi, S.; Soldati, M.; Cendrero, A. Land management versus natural factors in land instability: Some examples in Northern Spain. Environ. Manag. 2013, 52, 398–416. [Google Scholar] [CrossRef]
- Persichillo, M.G.; Bordoni, M.; Cavalli, M.; Crema, S.; Meisina, C. The role of human activities on sediment connectivity of shallow landslides. Catena 2018, 160, 261–274. [Google Scholar] [CrossRef]
- D’Amato Avanzi, G.; Giannecchini, R.; Puccinelli, A. The influence of the geological and geomorphological settings on shallow landslides. An example in a temperate climate environment: The June 19, 1996 event in northwestern Tuscany (Italy). Eng. Geol. 2004, 73, 215–228. [Google Scholar] [CrossRef]
- Henriques, C.; Zezere, J.S.; Marques, F. The role of the lithological setting on the landslide pattern and distribution. Eng. Geol. 2015, 189, 17–31. [Google Scholar] [CrossRef]
- Eger, A.; Hewitt, A. Soils and their relationship to aspect and vegetation history in the eastern Southern Alps, Canterbury High Country, South Island, New Zealand. Catena 2008, 75, 297–307. [Google Scholar] [CrossRef]
- Dai, F.C.; Lee, C.F.; Li, J.; Xu, Z.W. Assessment of landslide susceptibility on the natural terrain of Lantau Island, Hong Kong. Environ. Geol. 2001, 40, 381–391. [Google Scholar]
- He, Q.; Xu, Z.; Li, S.; Li, R.; Zhang, S.; Wang, N.; Pham, B.T.; Chen, W. Novel entropy and rotation forest-based credal decision tree classifier for landslide susceptibility modeling. Entropy 2019, 21, 106. [Google Scholar] [CrossRef] [PubMed]
- Lee, S.; Min, K. Statistical analysis of landslide susceptibility at Yongin, Korea. Environ. Geol. 2001, 40, 1095–1113. [Google Scholar] [CrossRef]
- Di Crescenzo, G.; Santo, A. Debris slides—Rapid earth flows in the carbonate massifs of the Campania region (Southern Italy): Morphological and morphometric data for evaluating triggering susceptibility. Geomorphology 2005, 66, 255–276. [Google Scholar] [CrossRef]
- Galve, J.P.; Cevasco, A.; Brandolini, P.; Soldati, M. Assessment of shallow landslide risk mitigation measures based on land use planning through probabilistic modelling. Landslides 2015, 12, 101–114. [Google Scholar] [CrossRef]
- Lasanta, T.; Arnáez, J.; Oserín, M.; Ortigosa, L. Marginal Lands and Erosion in Terraced Fields in the Mediterranean Mountains. Mt. Res. Develop. 2001, 21, 69–76. [Google Scholar] [CrossRef]
- Stanchi, S.; Freppaz, M.; Agnelli, A.; Reinsch, T.; Zanini, E. Properties, best management practices and conservation of terraced soils in southern Europe (from Mediterranean areas to the Alps): A review. Quater. Int. 2012, 265, 90–100. [Google Scholar] [CrossRef]
- Tarolli, P.; Preti, F.; Romano, N. Terraced landscapes: From an old best practice to a potential hazard for soil degradation due to land abandonment. Anthropocene 2014, 6, 10–25. [Google Scholar] [CrossRef]
- Brandolini, P.; Cevasco, A.; Capolongo, D.; Pepe, G.; Lovergine, F.; Del Monte, M. Response of terraced slopes to a very intense rainfall event and relationships with land abandonment: A case study from Cinque Terre (Italy). Land Degrad. Dev. 2018, 29, 630–642. [Google Scholar] [CrossRef]
- Cevasco, A.; Pepe, G.; Brandolini, P. The influences of geological and land use settings on shallow landslides triggered by an intense rainfall event in a coastal terraced environment. Bull. Eng. Geol. Environ. 2014, 73, 859–875. [Google Scholar] [CrossRef]
- Agnoletti, M.; Errico, A.; Santoro, A.; Dani, A.; Preti, F. Terraced landscapes and hydrogeological risk. Effects of land abandonment in Cinque Terre (Italy) during severe rainfall events. Sustainability 2019, 11, 235. [Google Scholar] [CrossRef]
- Gökceoglu, C.; Aksoy, H. Landslide susceptibility mapping of the slopes in the residual soils of the Mengen region (Turkey) by deterministic stability analyses and image processing techniques. Eng. Geol. 1996, 44, 147–161. [Google Scholar] [CrossRef]
- Lucà, F.; Conforti, M.; Robustelli, G. Comparison of GIS-based gullying susceptibility mapping using bivariate and multivariate statistics: Northern Calabria, South Italy. Geomorphology 2011, 134, 297–308. [Google Scholar] [CrossRef]
- Guadagno, F.; Martino, S.; Mugnozza, G.S. Influence of man-made cuts on the stability of pyroclastic covers (Campania, southern Italy): A numerical modelling approach. Environ. Geol. 2003, 43, 371–384. [Google Scholar] [CrossRef]
- Tarolli, P.; Calligaro, S.; Cazorzi, F.; Dalla Fontana, G. Recognition of surface flow processes influenced by roads and trails in mountain areas using high-resolution topography. Eur. J. Remote Sens. 2013, 46, 176–197. [Google Scholar] [CrossRef]
- Jaboyedoff, M.; Michoud, M.; Derron, M.-H.; Voumard, J.; Leibundgut, G.; Sudmeier-Rieux, K.; Nadim, F.; Leroi, E. Human-induced landslides: Towards the analysis of anthropogenic changes of the slope environment. In Landslides and Engineering Slopes—Experiences, Theory and Practices; Avresa, S., Cascini, L., Picarelli, L., Scavia, C., Eds.; CRC Press: London, UK, 2016; pp. 217–232. [Google Scholar] [CrossRef]
- Faccini, F.; Piana, P.; Sacchini, A.; Lazzeri, R.; Paliaga, G.; Luino, F. Assessment of heavy rainfall triggered flash floods and landslides in the Sturla stream basin (Ligurian Apennines, northwestern Italy). Jokull 2017, 67, 44–73. [Google Scholar]
- Giordan, D.; Cignetti, M.; Baldo, M.; Godone, D. Relationship between man-made environment and slope stability: The case of 2014 rainfall events in the terraced landscape of the Liguria region (northwestern Italy). Geomat. Nat. Haz. Risk 2017, 8, 1833–1852. [Google Scholar] [CrossRef]
- Saaty, T.L. A scaling method for priorities in hierarchical structures. J. Math. Psychol. 1977, 15, 234–281. [Google Scholar] [CrossRef]
- Saaty, T.L. The Analytic Hierarchy Process; M. Graw-Hill: New York, NY, USA, 1980. [Google Scholar]
- Saaty, T.L.; Vargas, L.G. Models, Methods, Concepts and Applications of the Analytic Hierarchy Process; Springer Science+Business Media: New York, NY, USA, 2012; p. 175. [Google Scholar] [CrossRef]
- Chung, C.J.F.; Fabbri, A.G. Validation of spatial prediction models for landslide hazard mapping. Nat. Hazards 2003, 30, 451–472. [Google Scholar] [CrossRef]
- Carrara, A.; Crosta, G.; Frattini, P. Comparing models of debris-flow susceptibility in the alpine environmental. Geomorphology 2008, 94, 353–378. [Google Scholar] [CrossRef]
- Goepel, K.D. Implementing the Analytic Hierarchy Process as a Standard Method for Multi-Criteria Decision Making. In Corporate Enterprises—A New AHP Excel Template with Multiple Inputs, Proceedings of the International Symposium on the Analytic Hierarchy Process, Kuala Lampur, Malaysia, 23–26 June 2013; Creative Decisions Foundation: Kuala Lampur, Malaysia, 2013; Volume 2, no. 10; pp. 1–10. [Google Scholar]
- Alonso, J.A.; Lamata, M.T. Consistency in the analytic hierarchy process: A new approach. Int. J. Uncertain. Fuzz. 2006, 14, 445–459. [Google Scholar] [CrossRef]
- Saaty, T.L. Decision Making for Leaders: The Analytical Hierarchy Process. for Decisions in a Complex World; RWS Publications: Pittsburgh, PA, USA, 2000. [Google Scholar]
- Jost, L. Partitioning diversity into independent alpha and beta components. Ecology 2007, 88, 2427–2439. [Google Scholar] [CrossRef] [PubMed]
- Shannon, C. A mathematical theory of communication. Bell. Syst. Tech. J. 1948, 27, 379–423, 623–656. [Google Scholar] [CrossRef]
- Ayalew, L.; Yamagishi, H.; Ugawa, N. Landslide susceptibility mapping using GIS-based weighted linear combination, the case in Tsugawa area of Agano River, Niigata Prefecture, Japan. Landslides 2004, 1, 73–81. [Google Scholar] [CrossRef]
- Pradhan, B.; Youssef, A.M.; Varathrajoo, R. Approaches for delineating landslide hazard areas using different training sites in an advanced artificial neural network model. Geo-Spat. Inform. Sci. 2010, 13, 93–102. [Google Scholar]
- Swets, J.A. Measuring the accuracy of diagnostic systems. Science 1988, 240, 1285–1293. [Google Scholar] [CrossRef]
- Autorità di Bacino Regionale. Piano di Bacino Stralcio per L’assetto Idrogeologico, Ambito 15 [Basin Master Plan for the Geo-Hydrological Arrangement]. Available online: http://www.pianidibacino.ambienteinliguria.it/GE/ambito15/ambito15.html (accessed on 15 December 2020).
- van Vliet, J.; Bregt, A.K.; Hagen-Zanker, A. Revisiting Kappa to account for change in the accuracy assessment of land-use change models. Ecol. Model. 2011, 222, 1367–1375. [Google Scholar] [CrossRef]
- Baeza, C.; Lantada, N.; Amorim, S. Statistical and spatial analysis of landslide susceptibility maps with different classification systems. Environ. Earth Sci. 2016, 75, 1318. [Google Scholar] [CrossRef]
- Visser, H.; de Nijs, T. The Map Comparison Kit. Environ. Model. Softw. 2006, 21, 346–358. [Google Scholar] [CrossRef]
- Lateltin, O.; Haemmig, C.; Raetzo, H.; Bonnard, C. Landslide risk management in Switzerland. Landslides 2005, 2, 313–320. [Google Scholar] [CrossRef]
- Li, G.; Lei, Y.; Yao, H.; Wu, S.; Ge, J. The influence of land urbanization on landslides: An empirical estimation based on Chinese provincial panel data. Sci. Total Environ. 2017, 595, 681–690. [Google Scholar] [CrossRef] [PubMed]
- Turconi, L.; Faccini, F.; Marchese, A.; Paliaga, G.; Casazza, M.; Vojinovic, Z.; Luino, F. Implementation of nature-based solutions for hydro-meteorological risk reduction in small Mediterranean catchments: The case of Portofino Natural Regional Park. Sustainability 2019, 12, 1240. [Google Scholar] [CrossRef]


| Name | Source | Scala/Pixel | Date | Type |
|---|---|---|---|---|
| Administrative Unit | Liguria Region | 1:5000 | 2018 | V |
| Aspect | Liguria Region | 1:10,000 | 2007 | V |
| Buildings, Manufacts and Walls (CTR, 2nd Ed. 3D) | Liguria Region | 1:5000 | 2007 | V |
| CORINE Land Use (II Level) | Liguria Region | 1:10,000 | 2018–2019 | V |
| CTR | Liguria Region | 1:5000 | 1990–2006 | R |
| DEM | Liguria Region | 5 m | 2016 | R |
| Hydrographic Network and Catchments | Liguria Region | 1:10,000 | 2019 | V |
| Landslide, Project IFFI | Liguria Region | 1:10,000 | 2014 | V |
| Lithology | Liguria Region | 1:10,000 | 2017 | V |
| Nature Reserve Borders | Liguria Region | 1:10,000 | 2019 | V |
| Orthophotography | Liguria Region | 0.15 m | 2004 | R |
| Orthophotography | Google Earth | 2.5 m | 2019 | R |
| Pedological Map | Rellini et al. [53] | 1:10,000 | 2017 | R |
| Road network, CTR 2nd Ed. 3D | Liguria Region | 1:5000 | 2007 | V |
| Slope | Liguria Region | 1:10,000 | 2016 | V |
| Springs | Faccini et al. [64] | 1:10,000 | 2018 | V |
| Terraced areas | Paliaga et al. [51] | 1:5000 | 2020 | V |
| Trail Network | Liguria Region | 1:25,000 | 2020 | V |
| Conditioning Factor | Number of Classes | Classes |
|---|---|---|
| Lithology | 5 | Heterogeneous clayey and sandy materials (Alluvial deposits) |
| Incoherent soils (Thick slope covers) | ||
| Heterogeneous materials of anthropic origin (Fills and artificial deposits) | ||
| Marly limestone and marls (Flysch of Monte Antola) | ||
| Conglomerate (Conglomerate of Portofino) | ||
| Aspect | 9 | North |
| North-east | ||
| East | ||
| South-east | ||
| South | ||
| South-west | ||
| West | ||
| North-west | ||
| Zenith | ||
| Acclivity | 7 | 0–10% |
| 11–20% | ||
| 21–35% | ||
| 36–50% | ||
| 51–75% | ||
| 76–100% | ||
| >100% | ||
| Land use | 10 | Urban fabric |
| Industrial, commercial and transport areas | ||
| Artificial, non-agricultural areas | ||
| Arable land | ||
| Permanent crops | ||
| Pastures | ||
| Heterogeneous agricultural areas | ||
| Forests | ||
| Shrubs and/or herbaceous vegetation association | ||
| Open spaces with little or no vegetation | ||
| Terraced area | 2 | Presence of terraces |
| Hydrographic elements | 4 | Spring, distance < 10 m |
| Watercourses, distance < 10 m | ||
| Spring, distance > 10 m | ||
| Watercourses, distance > 10 m | ||
| Man-made cuts | 4 | Trial, distance < 5 m |
| Main road, distance < 5 m | ||
| Minor road, distance < 5 m | ||
| Man-made cuts, distance > 5 m | ||
| Man-made structures | 4 | Buildings, distance < 10 m |
| Other manufacts, distance < 10 m | ||
| Retaining walls, distance < 10 m | ||
| Man-made structures, distance > 10 m | ||
| Existing Landslide (IFFI) | 6 | Active/reactivated/suspended |
| Dormant | ||
| Inactive/stabilized | ||
| Area affected by widespread shallow landslides | ||
| Assumed stable area, distance < 50 m | ||
| Assumed stable area, distance > 50 m |
| Scale | Degree of Preference | Description |
|---|---|---|
| 1 | Equally | Two factors contribute equally to the objective |
| 3 | Moderately | Experience and judgment slightly to moderately favor one factor over another |
| 5 | Strongly | Experience and judgment strongly or essentially favor one factor over another |
| 7 | Very strongly | A factor is strongly favored over another and its dominance is showed in practice |
| 9 | Extremely | The evidence of favoring one factor over another is of the highest degree possible of an affirmation |
| 2,4,6,8 | Intermediate | Used to represent compromises between the preferences in weights 1, 3, 5, 7 and 9 |
| Reciprocals | Opposite | Used for inverse comparison |
| Factor | Number of Criteria | Normalized Principal Eigenvector | Error |
|---|---|---|---|
| Lithology | 5 | 0.155 | 0.076 |
| Aspect | 9 | 0.090 | 0.040 |
| Acclivity | 7 | 0.311 | 0.107 |
| Land use | 10 | 0.197 | 0.093 |
| Terraced area | 2 | 0.064 | 0.033 |
| Distance hydrographic elements | 4 | 0.034 | 0.015 |
| Distance man-made cuts | 4 | 0.031 | 0.015 |
| Distance man-made structures | 4 | 0.055 | 0.003 |
| Existing landslides | 6 | 0.063 | 0.024 |
| Factors | Number of Criteria | Eigenvalue λ | CR (%) | S* (%) |
|---|---|---|---|---|
| Lithology | 5 | 5.413 | 9.2 | 99.0 |
| Aspect | 9 | 9.480 | 4.1 | 97.9 |
| Acclivity | 7 | 7.296 | 3.7 | 95.6 |
| Land use | 10 | 10.330 | 2.5 | 94.9 |
| Terraced areas | 2 | 2.000 | 0.0 | 96.7 |
| Distance hydrographic elements | 4 | 4.068 | 2.5 | 96.9 |
| Distance man-made cuts | 4 | 4.035 | 1.3 | 94.6 |
| Distance man-made structures | 4 | 4.064 | 2.3 | 96.5 |
| Existing landslides | 6 | 6.329 | 5.2 | 98.9 |
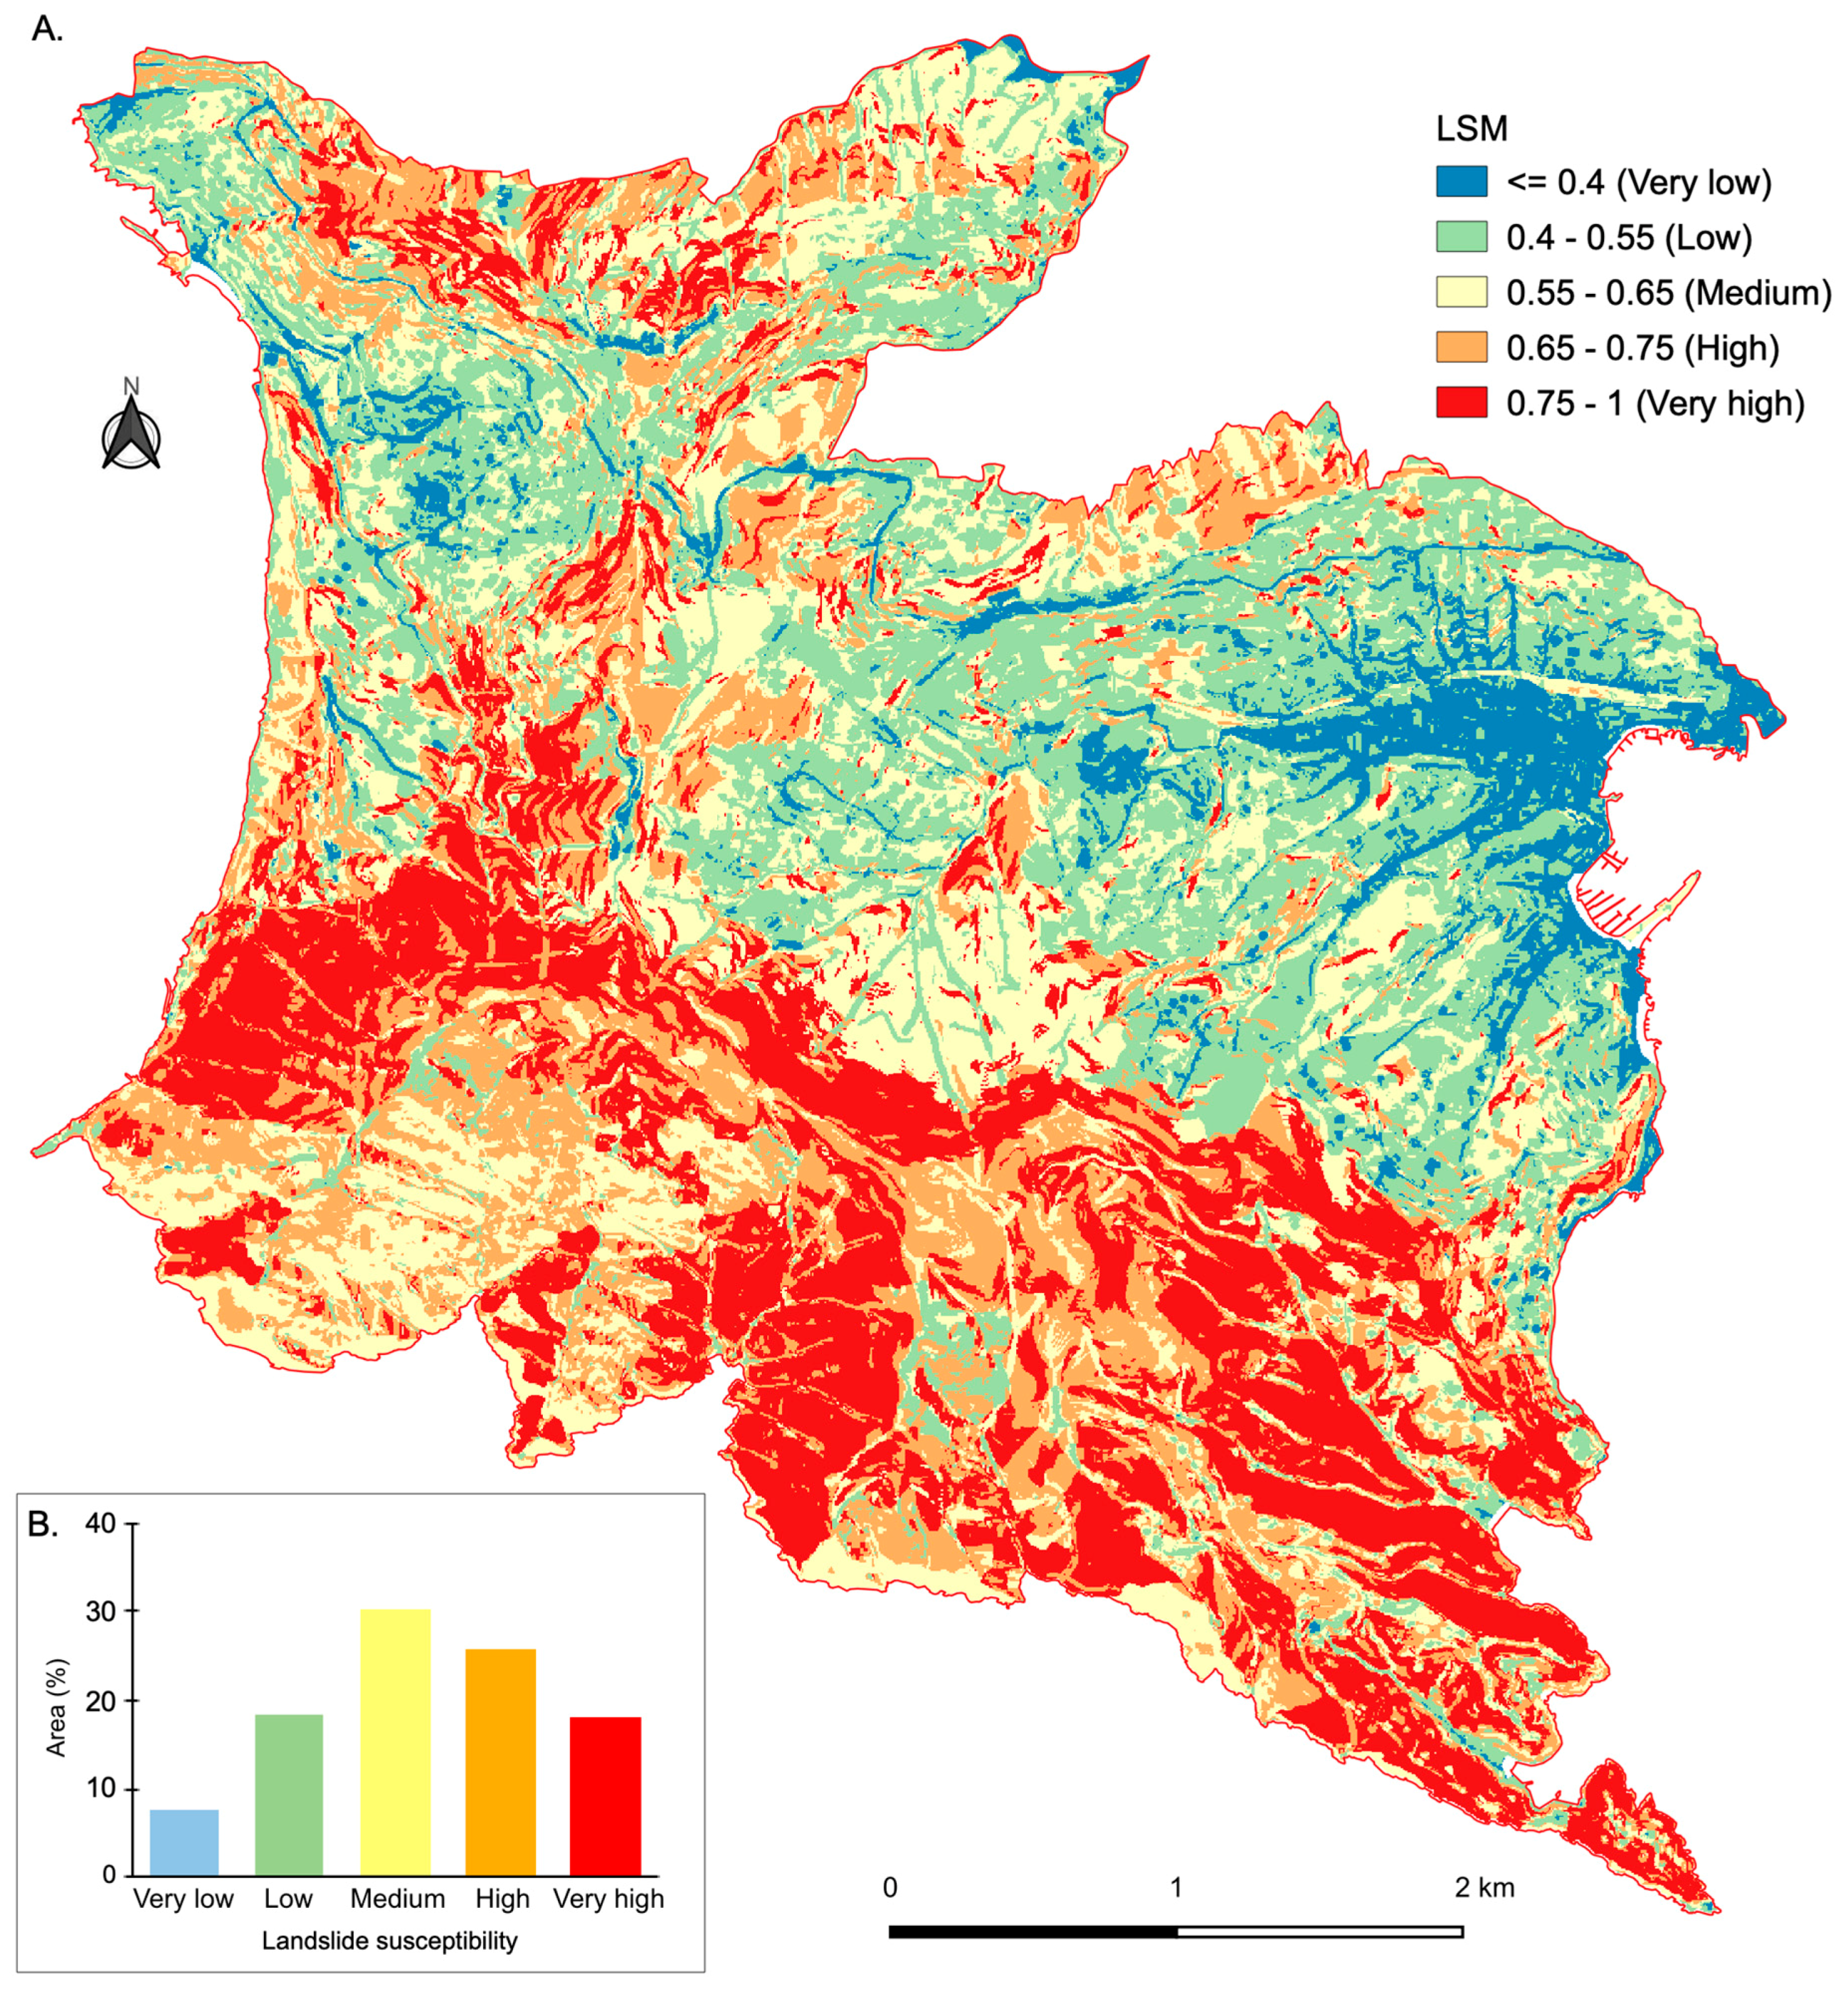
| Class | LSM Range |
|---|---|
| Very low | 0.00–0.40 |
| Low | 0.41–0.55 |
| Medium | 0.56–0.65 |
| High | 0.66–0.75 |
| Very high | 0.76–1.00 |
| Class | Very Low | Low | Medium | High | Very High |
|---|---|---|---|---|---|
| Kappa | 0.322 | 0.185 | 0.044 | −0.014 | 0.173 |
Publisher’s Note: MDPI stays neutral with regard to jurisdictional claims in published maps and institutional affiliations. |
© 2021 by the authors. Licensee MDPI, Basel, Switzerland. This article is an open access article distributed under the terms and conditions of the Creative Commons Attribution (CC BY) license (http://creativecommons.org/licenses/by/4.0/).
Share and Cite
Roccati, A.; Paliaga, G.; Luino, F.; Faccini, F.; Turconi, L. GIS-Based Landslide Susceptibility Mapping for Land Use Planning and Risk Assessment. Land 2021, 10, 162. https://doi.org/10.3390/land10020162
Roccati A, Paliaga G, Luino F, Faccini F, Turconi L. GIS-Based Landslide Susceptibility Mapping for Land Use Planning and Risk Assessment. Land. 2021; 10(2):162. https://doi.org/10.3390/land10020162
Chicago/Turabian StyleRoccati, Anna, Guido Paliaga, Fabio Luino, Francesco Faccini, and Laura Turconi. 2021. "GIS-Based Landslide Susceptibility Mapping for Land Use Planning and Risk Assessment" Land 10, no. 2: 162. https://doi.org/10.3390/land10020162
APA StyleRoccati, A., Paliaga, G., Luino, F., Faccini, F., & Turconi, L. (2021). GIS-Based Landslide Susceptibility Mapping for Land Use Planning and Risk Assessment. Land, 10(2), 162. https://doi.org/10.3390/land10020162