Article

Conserving Working Rangelands: A Social–Ecological Case Study from Northeastern Colorado

by
Jasmine E. Bruno
1,
Stephen J. Leisz
2,
Jake S. Bobula
3 and
María E. Fernández-Giménez
1,*
1
Department of Forest & Rangeland Stewardship, Colorado State University, Fort Collins, CO 80523-1472, USA
2
Department of Anthropology & Geography, Colorado State University, Fort Collins, CO 80523-1472, USA
3
Imagery Team, Mapbox, Washington, DC 20005-1047, USA
*
Author to whom correspondence should be addressed.
Land 2021, 10(12), 1399; https://doi.org/10.3390/land10121399
Submission received: 6 October 2021 / Revised: 10 December 2021 / Accepted: 14 December 2021 / Published: 17 December 2021

Abstract

:
Land changes in rangeland systems cascade through interconnected social and ecological spheres, affecting both humans and the environment. This study applied a multi-method approach to examine the causes and consequences of change in two rangeland communities in northeastern (NE) Colorado. First, this study used a Random Forest supervised classifier to analyze 36 years of land-cover data and create a land-cover/use change classification model. Second, the research team analyzed transcripts of interviews with 32 ranchers, examining how ranchers’ adaptive strategies influence land-cover change trends. Lastly, the analysis integrated the quantitative and qualitative data, constructing a social–ecological rangeland change conceptual model. This study found that the cultivated area decreased in both study sites from 1984–2019, with 16.0% and 18.7% of each site transitioning out of the cultivated area. Moreover, 10.3% and 18.4% of each site, respectively, transitioned to herbaceous/grassland cover from 1984–2019. The qualitative analysis identified the role of conservation policies, such as open space programs, on land change. Also, despite the relatively small area that transitioned to developed cover—1.83% and 0.183% of each site—participants emphasized that the associated demographic and cultural shifts drive land-use change. This study highlights that while rangelands are undergoing social–ecological change, land-use decisions and land conservation programs can help mitigate the global trend of declining rangeland and grassland cover.

1. Introduction

Global rangelands are undergoing rapid social and ecological change [1,2]. People have historically viewed these seemingly “residual” lands as available for “productive” use (i.e., cultivation, urban and exurban development) [2,3]. Sayre ([3], p. 2) writes that “what unites rangelands is less what they are than what they are not,” with rangelands being an aggregation of all land types that do not fit into other land-cover classes [4]. Yet, rangelands are social–ecological systems (SESs) where humans are both embedded within and affect ecosystems and vice versa [5,6,7]. Rangeland SESs encompass vibrant cultures, often politically marginalized societies, and globally essential and imperiled biodiversity hotspots [4]. Thus, land-use decisions flow between the social and ecological spheres, affecting both humans and the environment.
Turner, Lambin, and Reenberg [8] define land change as transitions in terrestrial ecosystems driven by human and environmental interactions. Land change is a spatially and temporally complex process, with historical and contemporary, and endogenous (i.e., local knowledge) and exogenous (i.e., global markets) factors driving change [9]. Thus, to avoid oversimplification and craft appropriate land-use policies, land change analyses must acknowledge the complexity of processes and drivers of land change, including consideration of global factors, the social and ecological, and place-based dynamics through time [2,10,11].
Land-use and land-cover change analyses have become essential tools in studying global environmental change [12]. While remote sensing approaches are valued tools in these approaches [13,14,15], issues of data availability and processing demands have limited applications, often constraining analyses to a few timesteps [16,17]. More recently, researchers have taken advantage of the National Aeronautics and Space Administration (NASA)/United States Geological Survey’s (USGS) open-access archive of Landsat imagery and open-source algorithms that automate image preprocessing to analyze continuous change [18,19,20,21]. Moreover, with these advancements, the availability of remotely sensed data no longer dictates a study’s temporal and spatial bounds, advancing the needed “integration of quantitative and qualitative data” ([22], p. 224). Such data and methodological advancements offer new opportunities for both how and what researchers examine on transitioning landscapes.
This study applies open-source algorithms and develops a land-cover/use classification model to analyze 36 years of land-cover/use change trends. The analysis also examines land-cover/use change drivers in qualitative interviews with 32 ranchers (Appendix A). This study integrates these qualitative and quantitative data to conceptually model rangeland change, with land change used to reference ongoing, social-ecological land-cover/use changes. This research contributes conceptual and methodological advancements to land change science and SESs research.

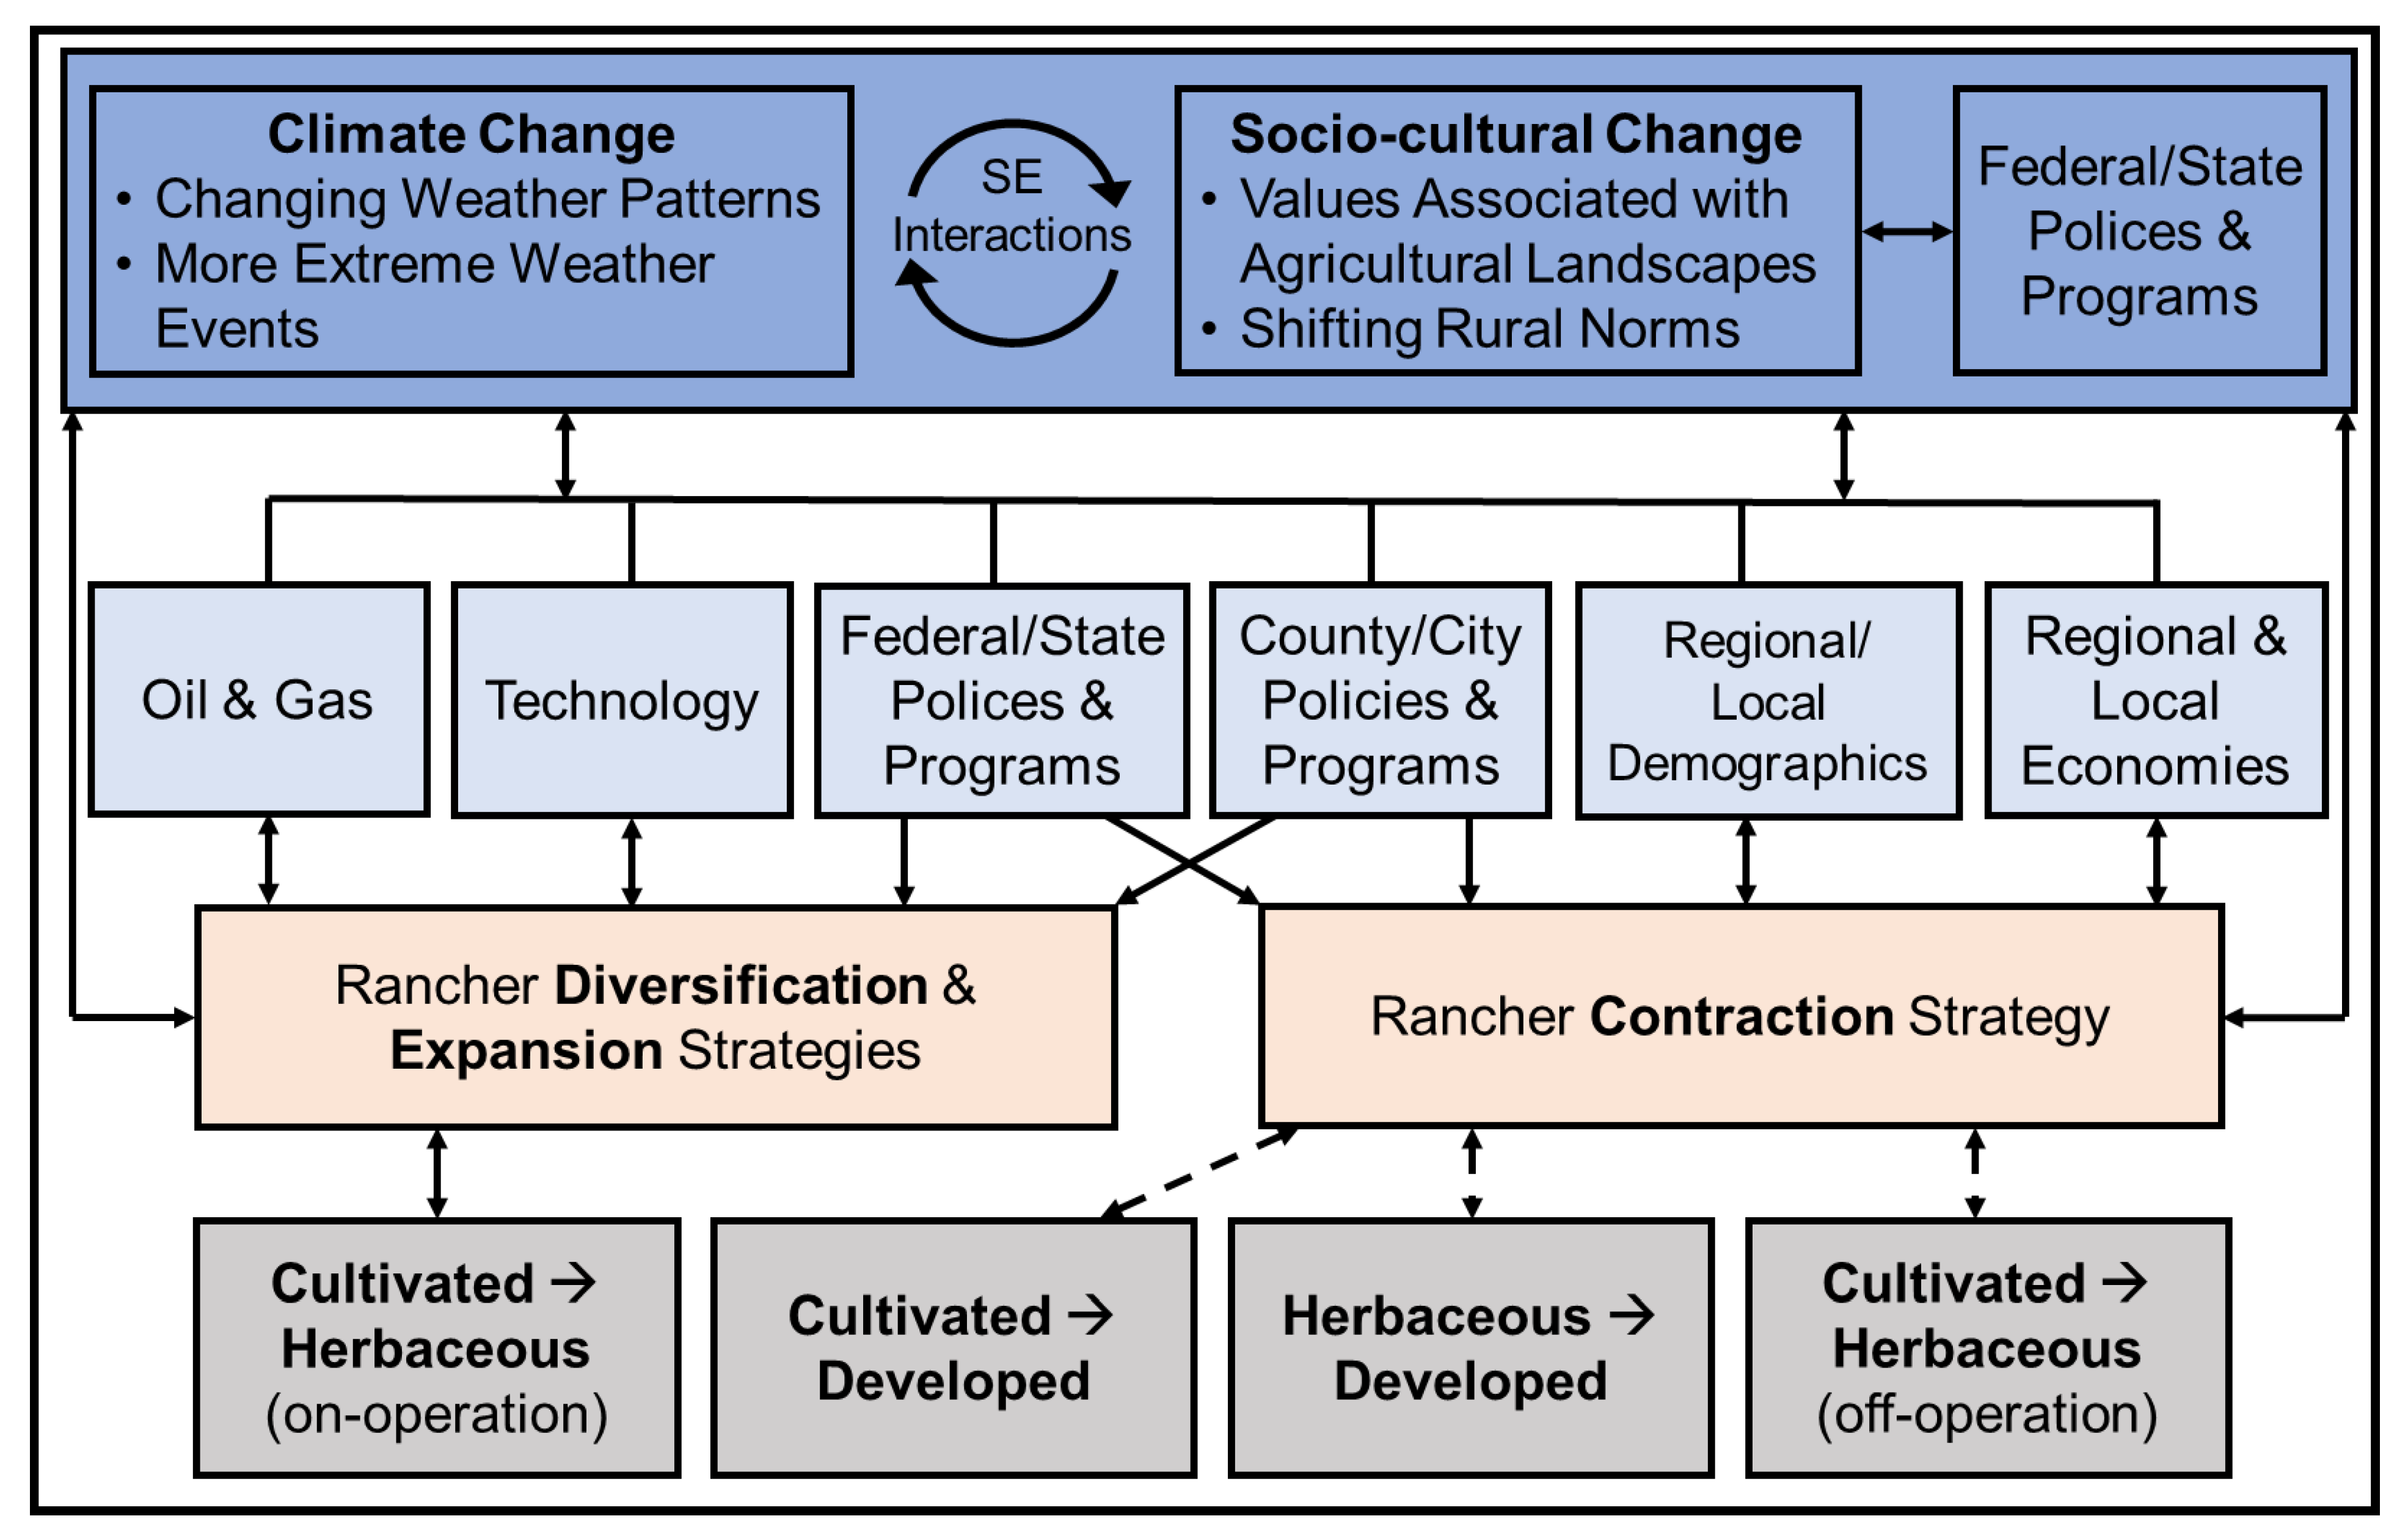
1.1. Theoretical and Conceptual Framing
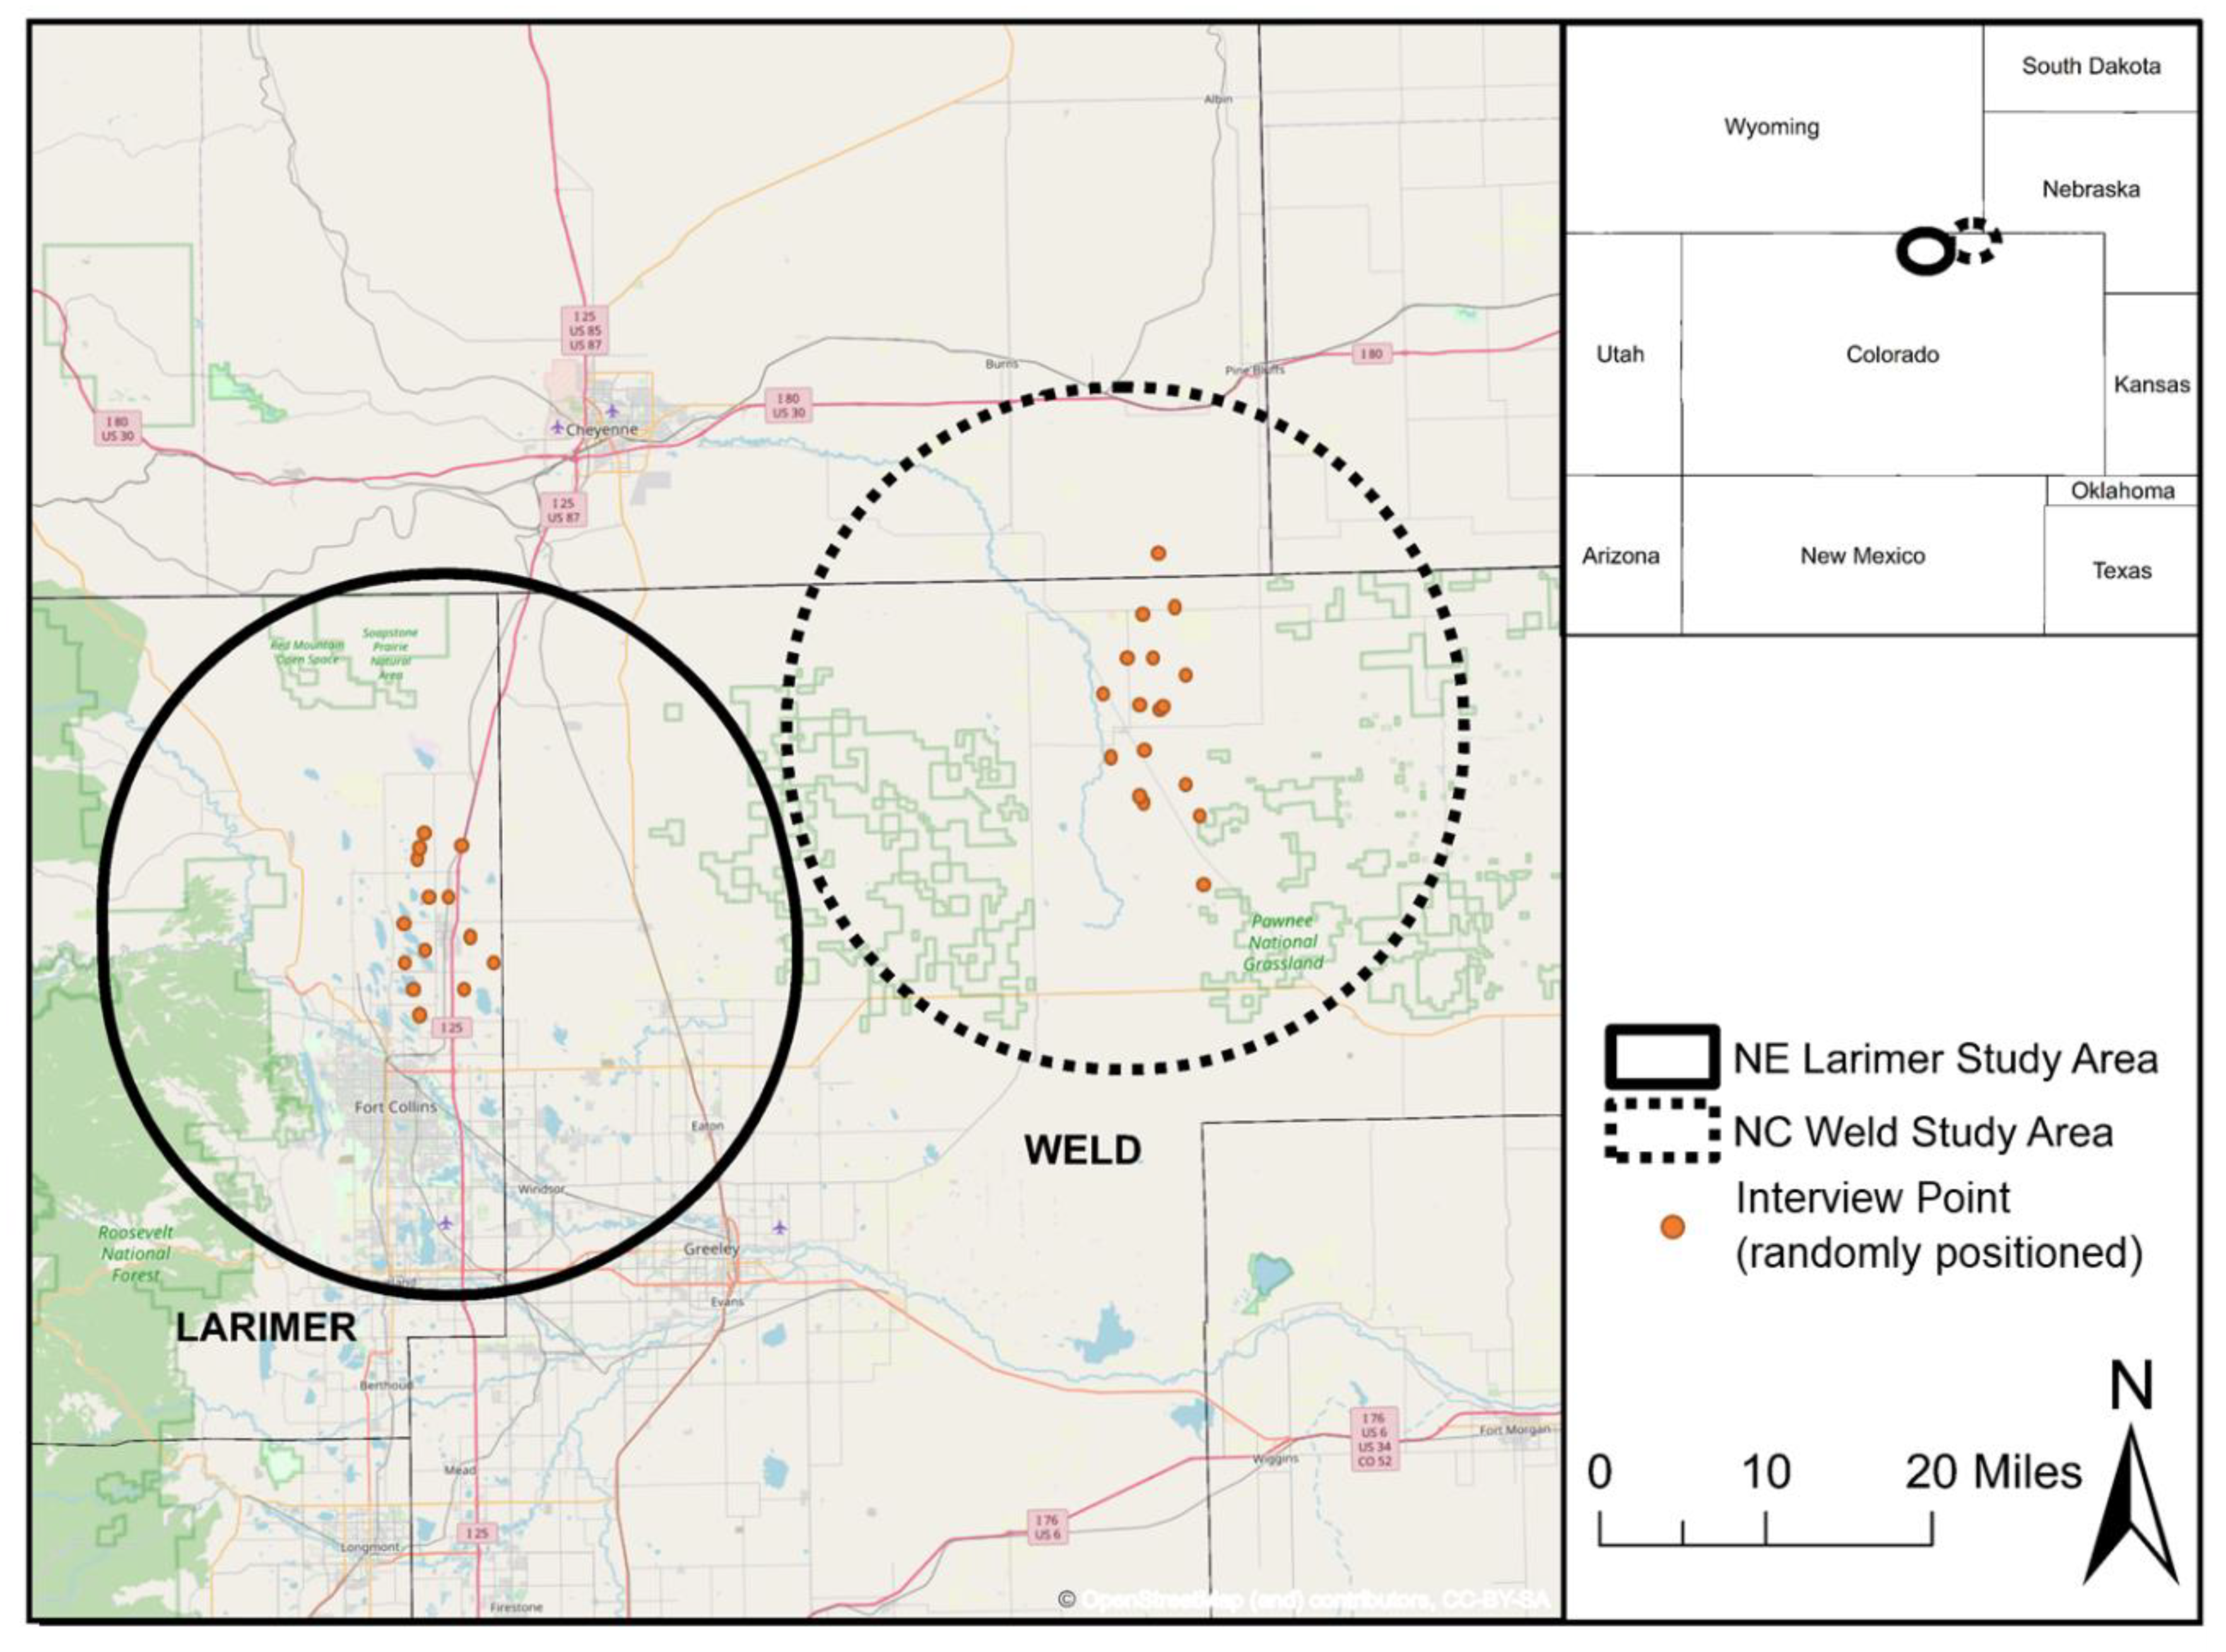
Over a decade ago, Lambin, Geist, and Rindfuss ([23], p. 7) stated that “[t]he time is getting ripe for one or more overarching theories of land change to emerge, theories that incorporate insights from multiple social and natural sciences, and theories that explain change in the behavior of people as well as land-cover/use change”. This research joins the growing body of land change (e.g., [24], 2008) and rangeland (e.g., [5]) scholarship that conceptualizes rangelands as complex adaptive SESs [25]. Complex adaptive SESs are interconnected and reciprocal across the social and ecological spheres, such that the ecosystem effects flow through to the social system and vice versa [26]. This interconnection drives adaptation of the system, making it more resilient to increasing change [27].
Examining complex adaptive SESs requires diverse conceptual and methodological approaches that acknowledge dynamic network interactions [25,28,29]. Thus, within the theoretical framing of complex adaptive SESs, this study draws upon and contributes to Hersperger et al.’s [30] conceptual land change model (Figure 1). First, in the conceptual model, forces of change and actors’ (i.e., ranchers) adaptive strategies interact and influence land-cover/use change. Second, this study further adapts Hersperger et al.’s [30] model by replacing unidirectional arrows with double-headed arrows, indicating the feedback among the complex adaptive system components. For instance, in the adapted model, land-cover/use change outcomes feedback to the interaction between actors and change drivers. Finally, this study draws on the land change literature to parse Hersperger et al.’s [30] forces of change into Direct Causes (i.e., factors that directly influence actors’ land-use decisions) and Underlying Driving Forces (i.e., fundamental processes that drive direct forces). The analysis disaggregates actors’ decisions (i.e., Ranchers’ Adaptive Strategies) from direct forces of change to acknowledge humans as active agents and their decisions as complex processes [31].
Hersperger et al. [30] state that to examine how interacting driving forces and actors’ decisions influence land change trends, “it is necessary first to analyze the question about how driving forces influence actors in their decisions and how these decisions feedback on driving forces.” Thus, this study builds upon Bruno et al. [32], in which several of the authors of this work examine NE Colorado ranchers’ adaptive strategies in the context of social-ecological change. Bruno et al. [32] developed a framework that captured how social and ecological changes (i.e., Underlying Driving Forces) affect ranchers’ livelihood factors (e.g., access to land and water) and well-being, which drive ranchers’ decisions on how to adapt (i.e., Ranchers’ Adaptive Strategies). In turn, the outcomes of ranchers’ decisions feedback, influencing the system (i.e., Driving Forces and Direct Causes). Specifically, Bruno et al. [32] found that ranchers employed three prominent adaptive strategies: contraction, diversification, and expansion. This study builds upon this previous research and Hersperger et al.’s [30] conceptual thinking to conduct a detailed examination of how forces of change and actors’ adaptive strategies interact to shape land-cover/use (and vice versa) in two rangeland communities in NE Colorado, USA. This study concludes with an integrated synthesis of the quantitative land change analysis and qualitative interviews into a detailed rangeland change model.

1.2. Study Sites

This study focuses on two communities, one centered in northeastern (NE) Larimer County and the other centered in northcentral (NC) Weld County. The research occurred within 20-mile buffers of each community to capture the extent of participants’ agricultural landholdings (Figure 2). Thus, the study sites are 922,505 acres (1441 square miles) and 847,548 acres (1324 square miles) in the NE Larimer and NC Weld sites.
The two sites sit adjacent and within the North American central grasslands’ semiarid region. The NE Larimer site is dominated by the shortgrass steppe in the east, transitioning westward to the foothills of the southern Rocky Mountains into shrublands and, ultimately, forest. The NC Weld site consists of shortgrass steppe punctuated by the iconic Pawnee Buttes. The warm season grasses blue grama (Bouteloua gracilis [Willd. ex. H.B.K.] Lag. ex. Steud.) and buffalo grass (Bouteloua dactyloides [Nutt.] Engelm.) dominate the shortgrass steppe, accompanied by the cool season grasses western wheatgrass (Pascopyrum smithii [Rydb.] A. Love) and needle and thread (Hesperostipa comata [Trin. & Rupr.]) and a variety of perennial and annual forbs and subshrubs [34]. Today, the shortgrass steppe’s primary land-use is livestock grazing on native vegetation, with cultivated area serving as the secondary land-use [34]. Below, the article outlines the history of the two sites for the study period from 1984–2019.
The 1980s’ farm financial crisis greatly affected NE Colorado’s agricultural communities and US agriculture more broadly. A cascading series of policies from the New Deal (i.e., programming from 1933–1939 designed to achieve economic growth through reform) into the 1970s’ Farm Boom had increased operation size and production [35,36]. Yet, entering the 1980s, this high production paired with an export decline forced down prices for agricultural goods. Moreover, policies to reduce high interest rates caused agricultural lands to lose value [36]. While many families—often from communities historically underrepresented in US agriculture—were forced to exit the sector in the decades leading up to the financial crisis, the 1980s was a period of painful restructuring that deeply affected many farmers and ranchers [35,37].
In 1985, the US Department of Agriculture (USDA) launched the Conservation Reserve Program (CRP), the largest federally-run private-land retirement program in the US [38]. Administered by the USDA’s Farm Service Agency (FSA), the CRP pays farmers to halt agricultural production on environmentally sensitive land to lower the commodity supply and support environmental objectives. The CRP determines payment amounts by the average local rental rates for cropland/pastureland and soil productivity [38]. In Weld County, farmers and ranchers enrolled 6347 acres in 1986; 171,988 acres in 1996; 224,174 acres in 2006; and 219,046 acres in 2016. In Larimer County, farmers and ranchers enrolled comparatively fewer acres, with 2321 acres in 1996, 637 acres in 2006, and 527 acres in 2016 (no Larimer County acres enrolled in 1986) [39].
Emergence from the agricultural recession in the 1990s brought a wave of globalization to agriculture, leading to increased US agricultural imports and exports [40]. At a regional scale, in the 1990s, the Rocky Mountain West became the fastest-growing US region in terms of the human population [41]. In Colorado, this increased in-migration and exurban growth significantly influenced the social and ecological landscape [42]. Paired with population increases, the Colorado Senate Bill 35 (1972), which exempts lots larger than 35 acres from subdivision approval processes, promoted rapid exurban growth. For instance, in Colorado’s East River Valley (southwest of the study sites), Theobald, Gosnell, and Riebsame [43] stated that single households on 35 to 45-acre parcels, commonly referred to as ranchettes, held 20% of private land [43]. For the first time in a century, ranch sizes were decreasing in Colorado in the 1990s.
The turn of the century brought a 395-week drought to NE Colorado from 30 October 2001 to 19 May 2009 [44]. Moreover, rising growth and associated municipal resource demand increased water and land prices. In parallel, conservation efforts, often initiated in the 1980s and 1990s, gained momentum [45]. For instance, the Mountains to Plains Project launched in 2004 [46,47]. To date, this collaborative conservation effort between Larimer County, the City of Fort Collins, The Nature Conservancy, and other partners has enrolled 60,000 acres as designated public open space (i.e., undeveloped land open to the public) and conservation easements on private ranches (i.e., mutual agreements between landowners and land trusts or governments that conserve land by limiting development in perpetuity) [45]. Many of these programs support the concept of working landscapes—balancing social, ecological, and economic objectives—that support livestock grazing but often at lower than historical stocking rates [47,48].
Today, the two study sites, despite their proximity, demonstrate divergent trajectories. In the NE Larimer site, the population grew 135.4% from 2000 to 2010 [49]. In comparison, the NC Weld site experienced a −10.5% decrease in human population from 2000 to 2010, and some neighboring communities were abandoned [49]. Moreover, while agriculture remains central to both areas, many Larimer County communities, especially those close to Fort Collins, have become increasingly suburban, including some parts of the study area. Many Weld County communities increasingly rely economically on the oil and natural gas industry, including the study site [50,51]. This study examines 36 years of linked social-ecological change in these two NE CO communities.

2. Materials and Methods

2.1. Methodology

This research applies a multi-method design, combining quantitative and qualitative traditions to explore land change in NE Colorado [52]. Specifically, this study integrates the analyses of remotely sensed land-cover data and interview data (Figure 3). The quantitative work examines temporal and spatial changes in land cover from 1984–2019, while the qualitative work explores the associated casual factors of change. This integration of methodological traditions offers multiple vantage points from which to examine the interactions of land change outlined in the above land change conceptual model (Figure 1).

2.2. Quanitative

2.2.1. Imagery Preprocessing

The authors collected data from the USGS/NASA archive in the study sites from 1984 to 2019, preprocessing these data using open-source algorithms and packages. First, the authors applied a subset of the LandTrendr algorithm in Google Earth Engine to access NASA/USGS Landsat Surface Reflectance Tier 1 datasets (i.e., TM, ETM+, and OLI) from June to October of 1984 to 2019 [19,53]. These Landsat data are available in individual scenes, and LandTrendr spatially and spectrally linked these data. The resulting output is a time series of image band stacks with 14 bands each year (Table 1).
The authors completed the remaining preprocessing steps and developed the land classification using Python 3.7 [54]. The research team downloaded a Shuttle Radar Topography Mission void filled at one arc second (60 m by 60 m) Digital Elevation Model (DEM) from Earth Explorer (http://earthexplorer.usgs.gov [accessed on 6 November 2020]) and projected the processed time-series images and the DEM to Albers Conical Equal Area to match the MultiResolution Land Characteristics (MRLC) consortium National Land Cover Database (NLCD) [55]. Next, the authors clipped the images and DEM to the bounds of the combined 100-mile buffers around each study community for data preparation and resampled the image and the DEM to the NLCD pixel structure and derived slope (in degrees) and aspect from the DEM. The research team clipped the resulting outputs to the bounds of the combined 50-mile buffers around each study community to reduce edge effects. Upon completing these preprocessing steps, all processed time-series images, slope, aspect, and elevation data had the same geographic extent, cell size, and coordinate reference system. These data served as inputs for the land classification model developed below.

2.2.2. Land Classification Model

Next, the authors trained a Random Forest supervised classifier using the available NLCD data to classify land-cover in northeastern Colorado [56]. The analysis used a Random Forest supervised classifier because it effectively handles high-dimensional and unbalanced data [57]. Random Forest classifiers are also relatively robust to outliers and non-linear data [56]. Furthermore, researchers have successfully used Random Forest classifiers for land classification [58,59].
The analysis simplified the 16 split [60,61]. NLCD land-cover classes in the study area were reclassified into eight classes (i.e., water, developed, barren, forest, shrubland, herbaceous/grassland, cultivated, and wetlands) to improve the quality of the model predictions in the study area [62]. The authors constructed an array of the 14 bands (Table 1), elevation, aspect, and slope. The team created a mask of the array’s valid data (with invalid data predominately assumed to be due to clouds) and applied this mask to the NLCD data to extract pixels where the array has valid data. To parse this valid array and NLCD data into either training data (used to build the classification model) or test data (subsequently used to test the model), the team conducted a train-test split [60,61]. Next, to remove outliers, the analysis applied a neighborhood cleaning rule with eight neighbors and a threshold of 0.20 to the training data (i.e., keeping data points that share a classification with more than 20% of their neighbors) [63,64]. Then the analysis used random under-sampling to limit the training data to at most 1.7 million pixels in each class for each year. The team repeated the above process for all NLCD years and combined the results. On the combined results, the analysis included a neighborhood cleaning rule with five neighbors and a threshold of 0.35 [63,64] and conducted random under-sampling to limit the training data to at most three million pixels in each class.
Upon completion of data preparation, the analysis fit the Random Forest classifier and applied it to the processed time-series images, slope, aspect, and elevation data from 1984 to 2019 to create land classification rasters. The team calculated a 20-mile buffer from each study community, combining the communities and buffers to establish the study sites (Figure 2). The analysis included the removal of pixels from the dataset if there was no data for any of the years, analyzing 922,505 acres (1441 square miles) and 847,548 acres (1324 square miles) in Larimer and Weld, respectively.

2.2.3. Classifier Performance and Analysis

The analysis included the calculation of the class-wise F1-score (1) to assess classifier performance for each cover class. The F1-score seeks a balance between precision (i.e., true positives over total predicted positives) and recall (i.e., true positives over the number of true positives plus the number of false negatives) [65]. The F1-score performs well despite imbalanced class distribution (e.g., the herbaceous cover area is more than one order of magnitude larger than the developed cover area). The assessment of the output also included Cohen’s kappa (2) to show the extent to which the outputs agree with the NLCD classes or our ‘true’ data [66]. Cohen’s kappa statistic also effectively handles multiple and imbalanced classes. The F1-score and kappa are optimum at 1. A kappa score of 1 indicates a perfect prediction agreement of the classifier, and an F1-score of 1 indicates perfect precision and recall. The Supplementary Materials also include a confusion matrix and accuracies [67].
F 1 score = 2   Precision   Recall Precision + Recall
kappa = observed accuracy chance agreement 1 chance agreement
Using the raster package in R [68,69], the team converted pixels to acres and aggregated areas for each class for each study site for each year. Next, the analysis calculated rolling 3-year medians for each land class by study site to reduce short-term fluctuations in the data. Throughout, this article reports the 3-year median using the middle year with subscript M. For example, 1985M represents the 3-year median for 1984 to 1986. The Results examine year-to-year change among cover classes and the overall change trajectories of each cover class. Finally, this study explores each site’s net change area and change magnitude over the study period. Below, the analysis focuses on the four cultivated, developed, herbaceous, shrubland classes that ranchers discussed in the interviews and covered the largest land area across the two sites. Aligned with the NLCD, cultivated areas are >20% annual crop or pasture/hay vegetation, developed areas are >20% human-constructed materials, herbaceous/grassland areas are >80% non-intensively managed graminoid or herbaceous vegetation, and shrubland areas are >20% shrub cover [62].

2.3. Qualitative

2.3.1. Data Collection

The authors collected data through participant observation and 26 semi-structured interviews with 32 livestock ranchers in the summer and fall of 2018 and 2019 (Appendix A). Members of the authors’ social networks facilitated introductions with community guides, and the research team collected all data under Colorado State University human subjects Institutional Review Board protocol 040-19H. The authors interviewed 20 participants alone, with the remaining 12 participants interviewed as couples (i.e., six couples). Fifteen people resided in NE Larimer and 17 in NC Weld. All 32 interview participants were engaged in animal agriculture, specifically the extensive management of cattle, sheep, and/or goats on rangelands. Moreover, several participants were active in other livelihood activities, such as crop cultivation and off-operation employment. Interviewees ranged in age from 37 to 90, including first- and multi-generation ranchers. Thirteen participants identified as women and 19 as men.
Interviews averaged 100 min and often involved a tour of the operation. At the start of the research, the sample frame used snowball sampling (i.e., recruiting future subjects via participants’ suggestions and social networks) [70]. For instance, the initial interviews were exploratory with prompts such as, “How did you become a rancher?” and “Can you walk me through your typical day?” The interviews also asked about livelihoods and well-being, but social and ecological change arose in all the interviews. Therefore, as the interviews progressed, the research team modified the interview protocol to further explore the causes and consequences of change.

2.3.2. Data Analysis

The analysis included an initial phase of open coding in RQDA [68,71], identifying significant and frequent concepts. Next, the authors collapsed the codes into categories and recoded all data, conducting a thematic analysis [72]. This study applies Lincoln and Guba’s [73] criteria to ensure the trustworthiness of the analysis. The iterative, mixed-method design facilitated prolonged engagement with participants. Additionally, the analysis included reflective commentary through memoing and peer debriefing, and the authors presented the research findings to the participants (member checking), making revisions when appropriate.

2.4. Integration of Quantitative and Qualitative Findings

Finally, the analysis integrates the qualitative and quantitative findings to examine how forces of change and ranchers interact and affect land-cover/use patterns. This study uses the qualitative findings to identify forces of change and conceptually relate these to the land-cover/use findings, constructing a rangeland change conceptual model for NE Colorado.

3. Results

The land-cover/use classification performed well as per the F1-scores (a weighted average of the classifier’s recall and precision) (Table 2) and the Cohen’s kappa scores (a measure of the agreement of the output with the NLCD data or ‘true’ data) (Table 3), especially given the number of classes and a spatial extent that included both the shortgrass steppe and the Rocky Mountains. Aligned with [74] characterization, Cohen’s kappa scores (2) demonstrate substantial agreement of the study’s classifier. Below, the analysis integrates the qualitative and quantitative data to present land-cover/use trends for cultivated, herbaceous, shrubland, and developed land classes from 1984–2019 in both study sites (i.e., land-cover/use change). Next, this study examines the forces of change—direct causes and underlying driving forces—and their relationship with land-cover/use changes among land classes. This work builds upon previous research on NE Colorado ranchers’ adaptive livelihood strategies [32].

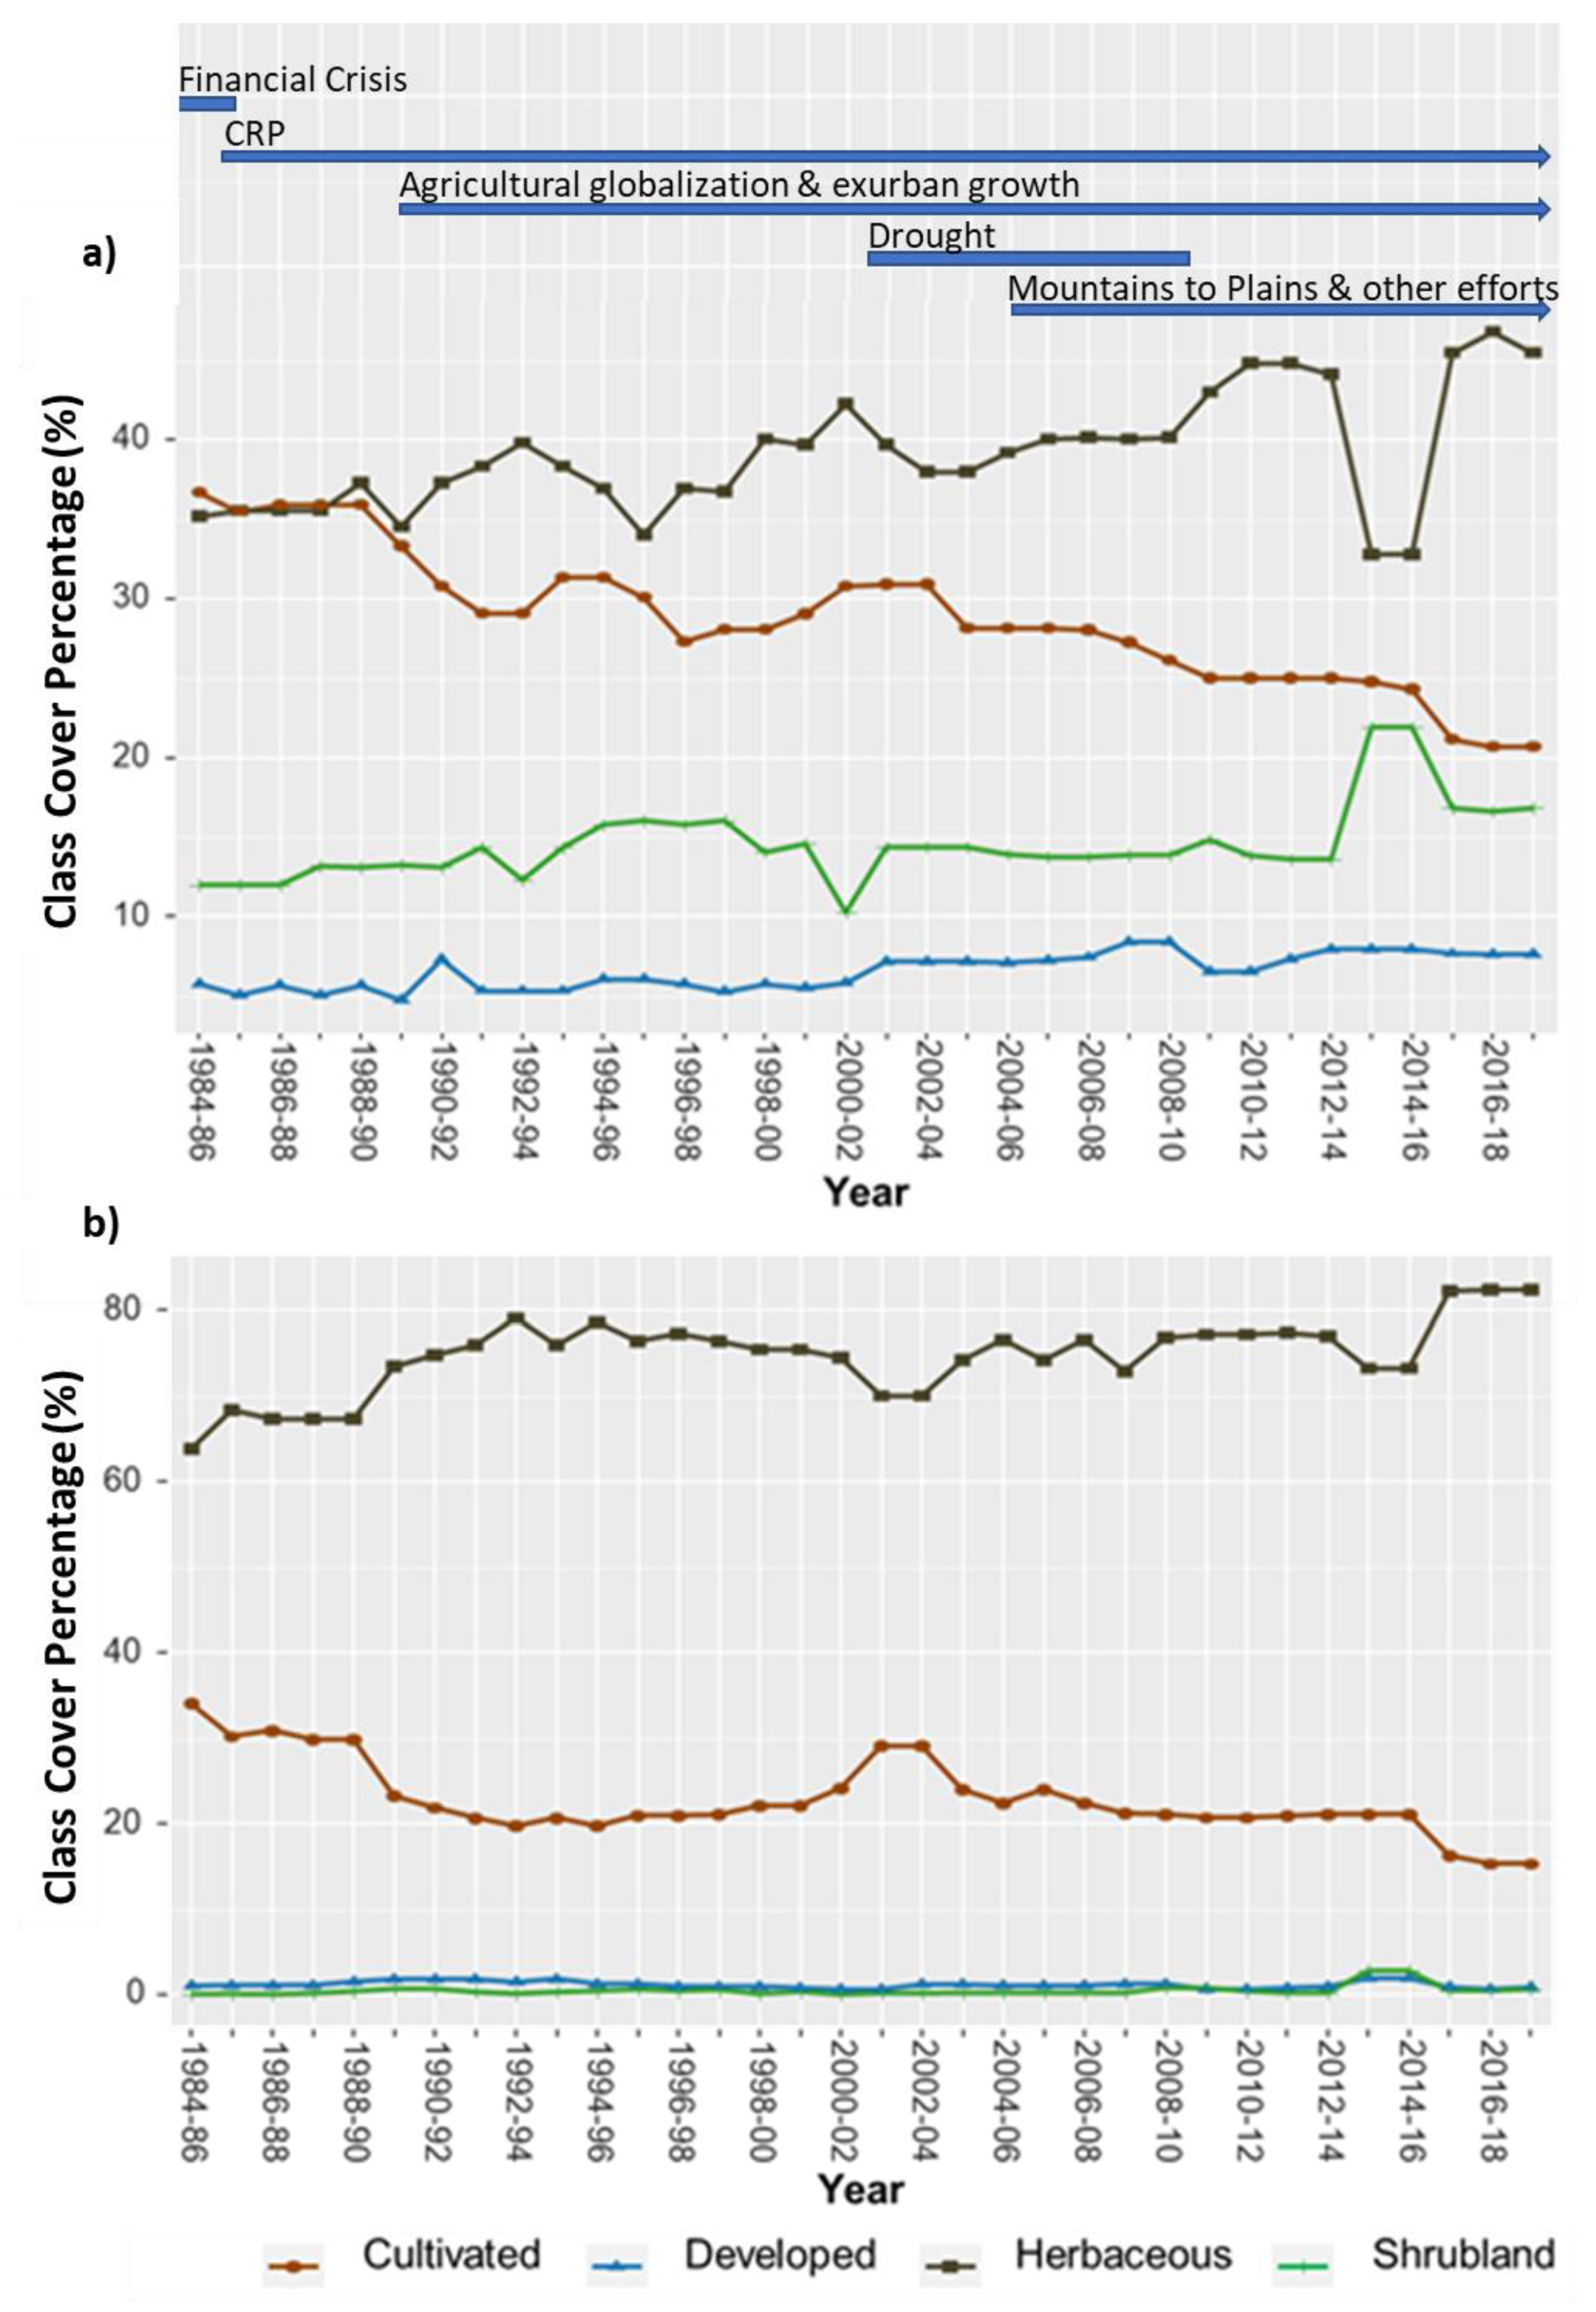
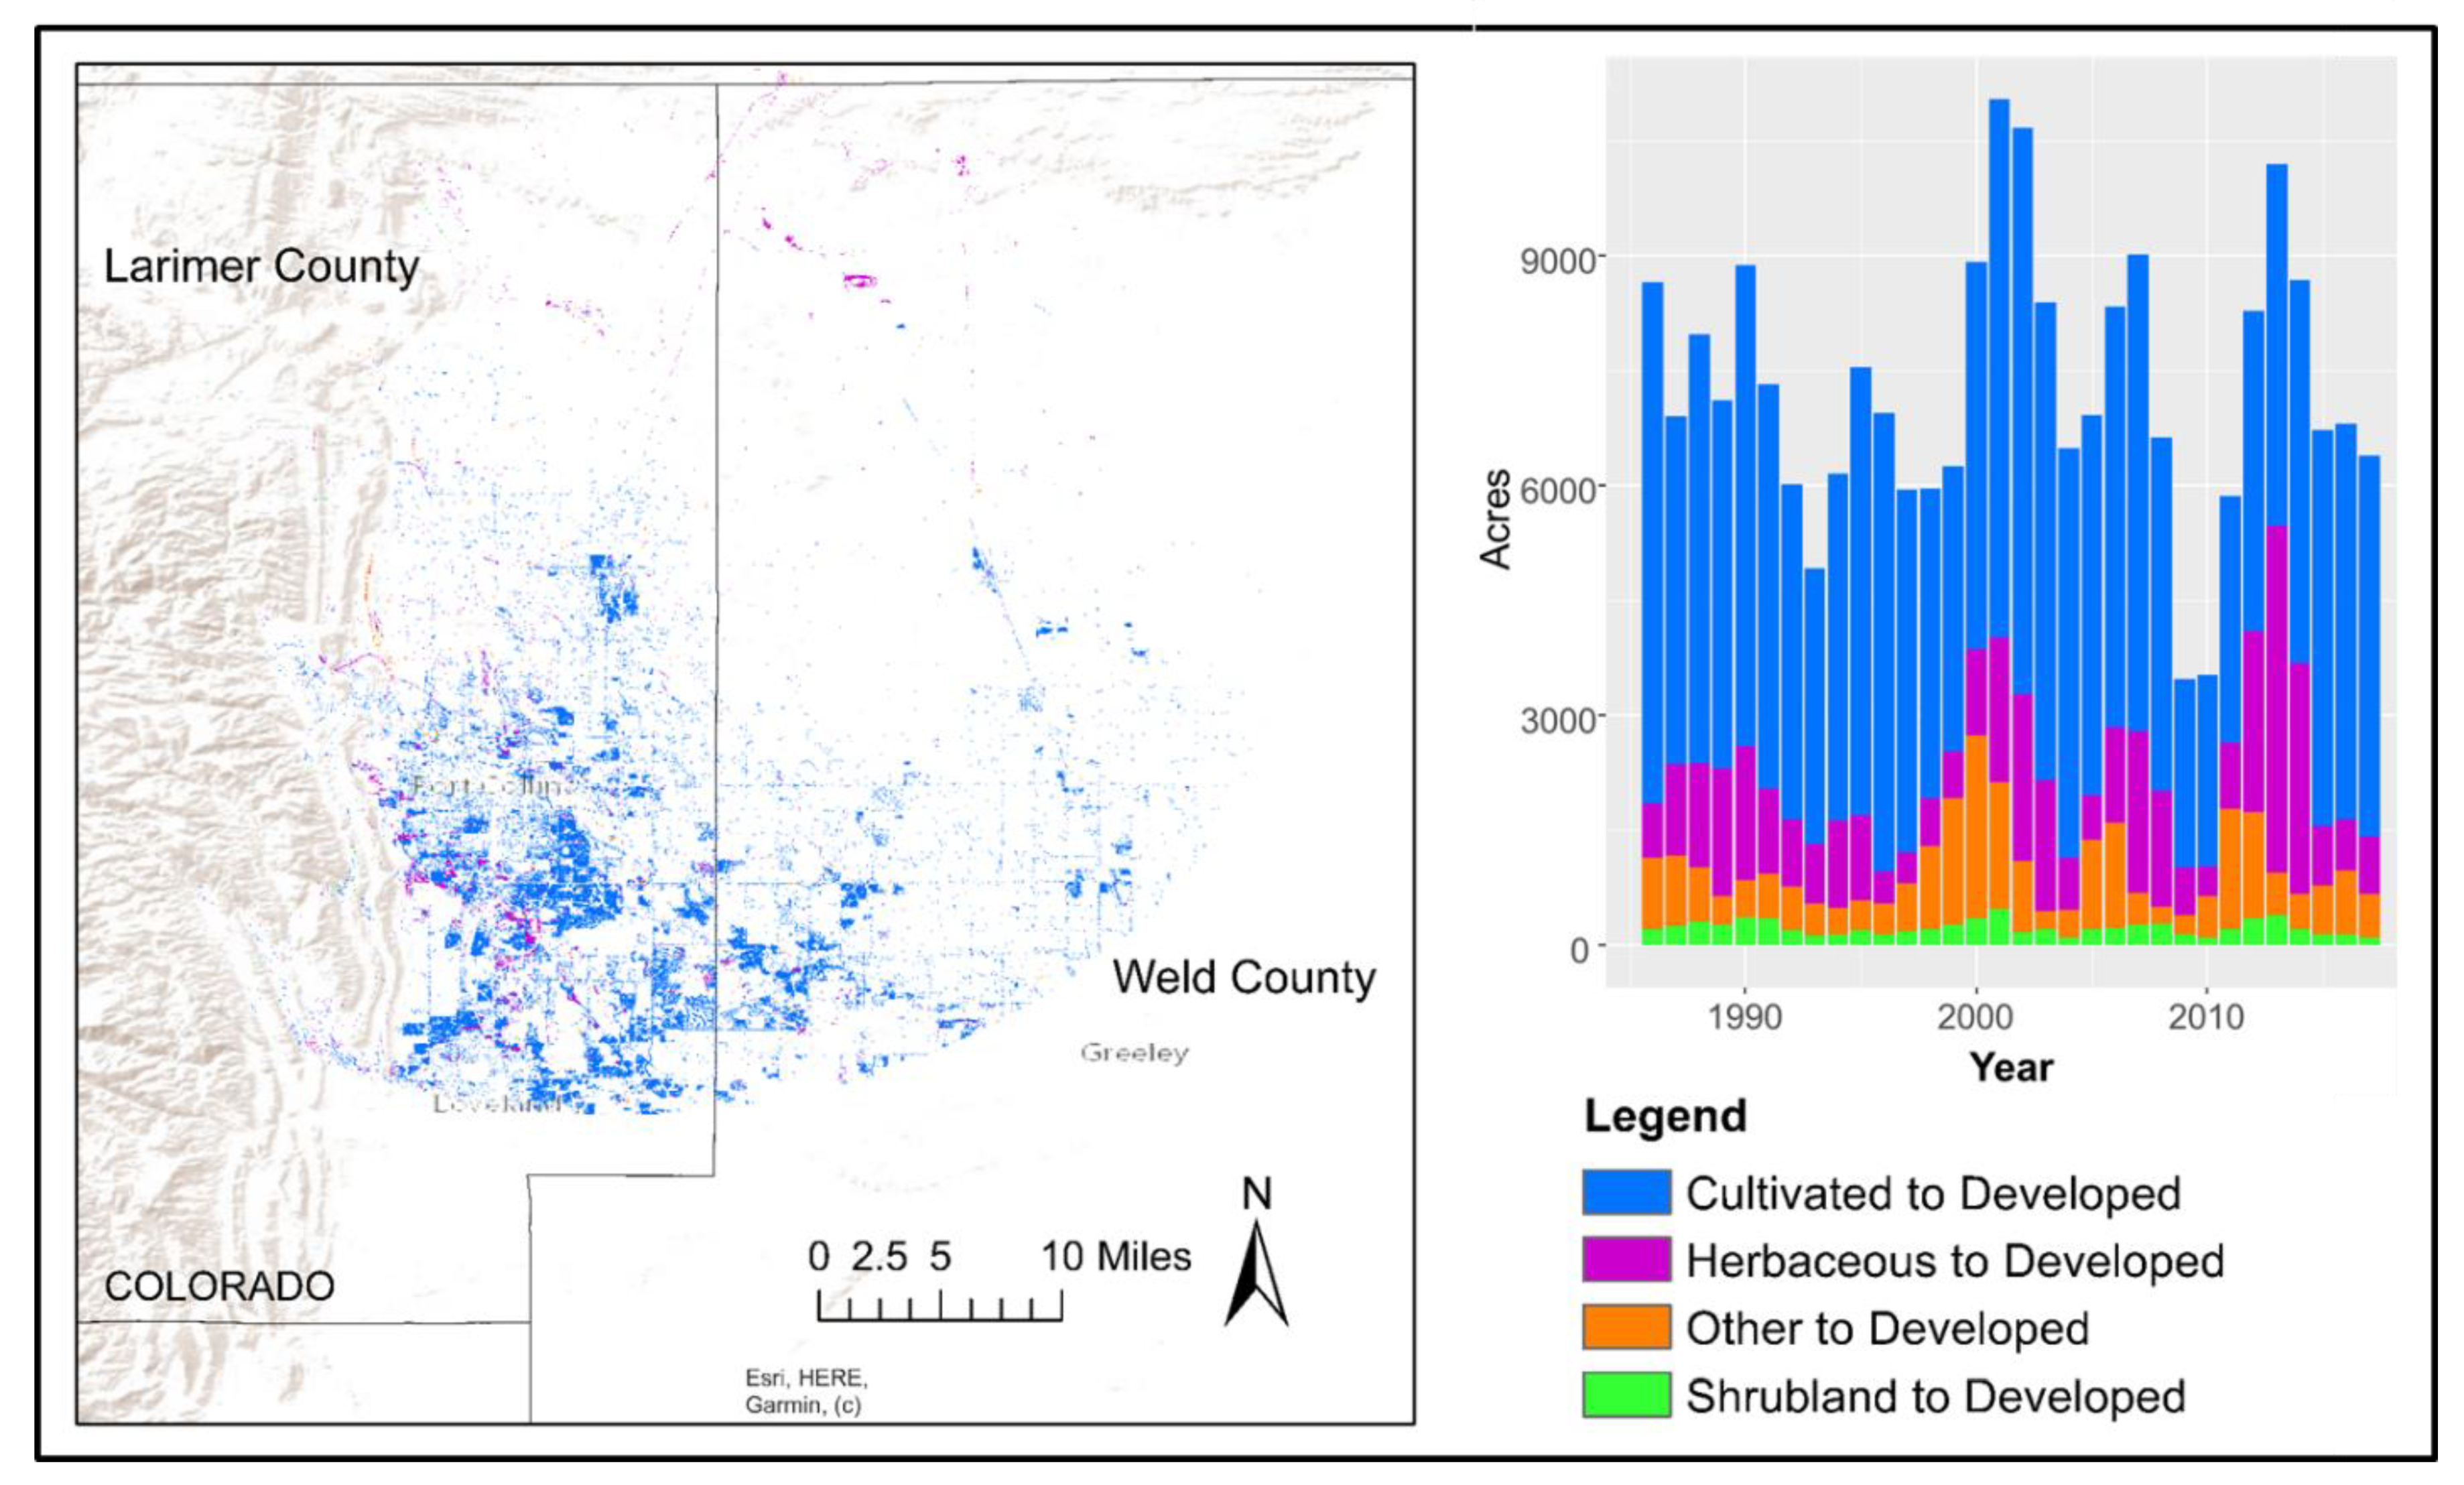
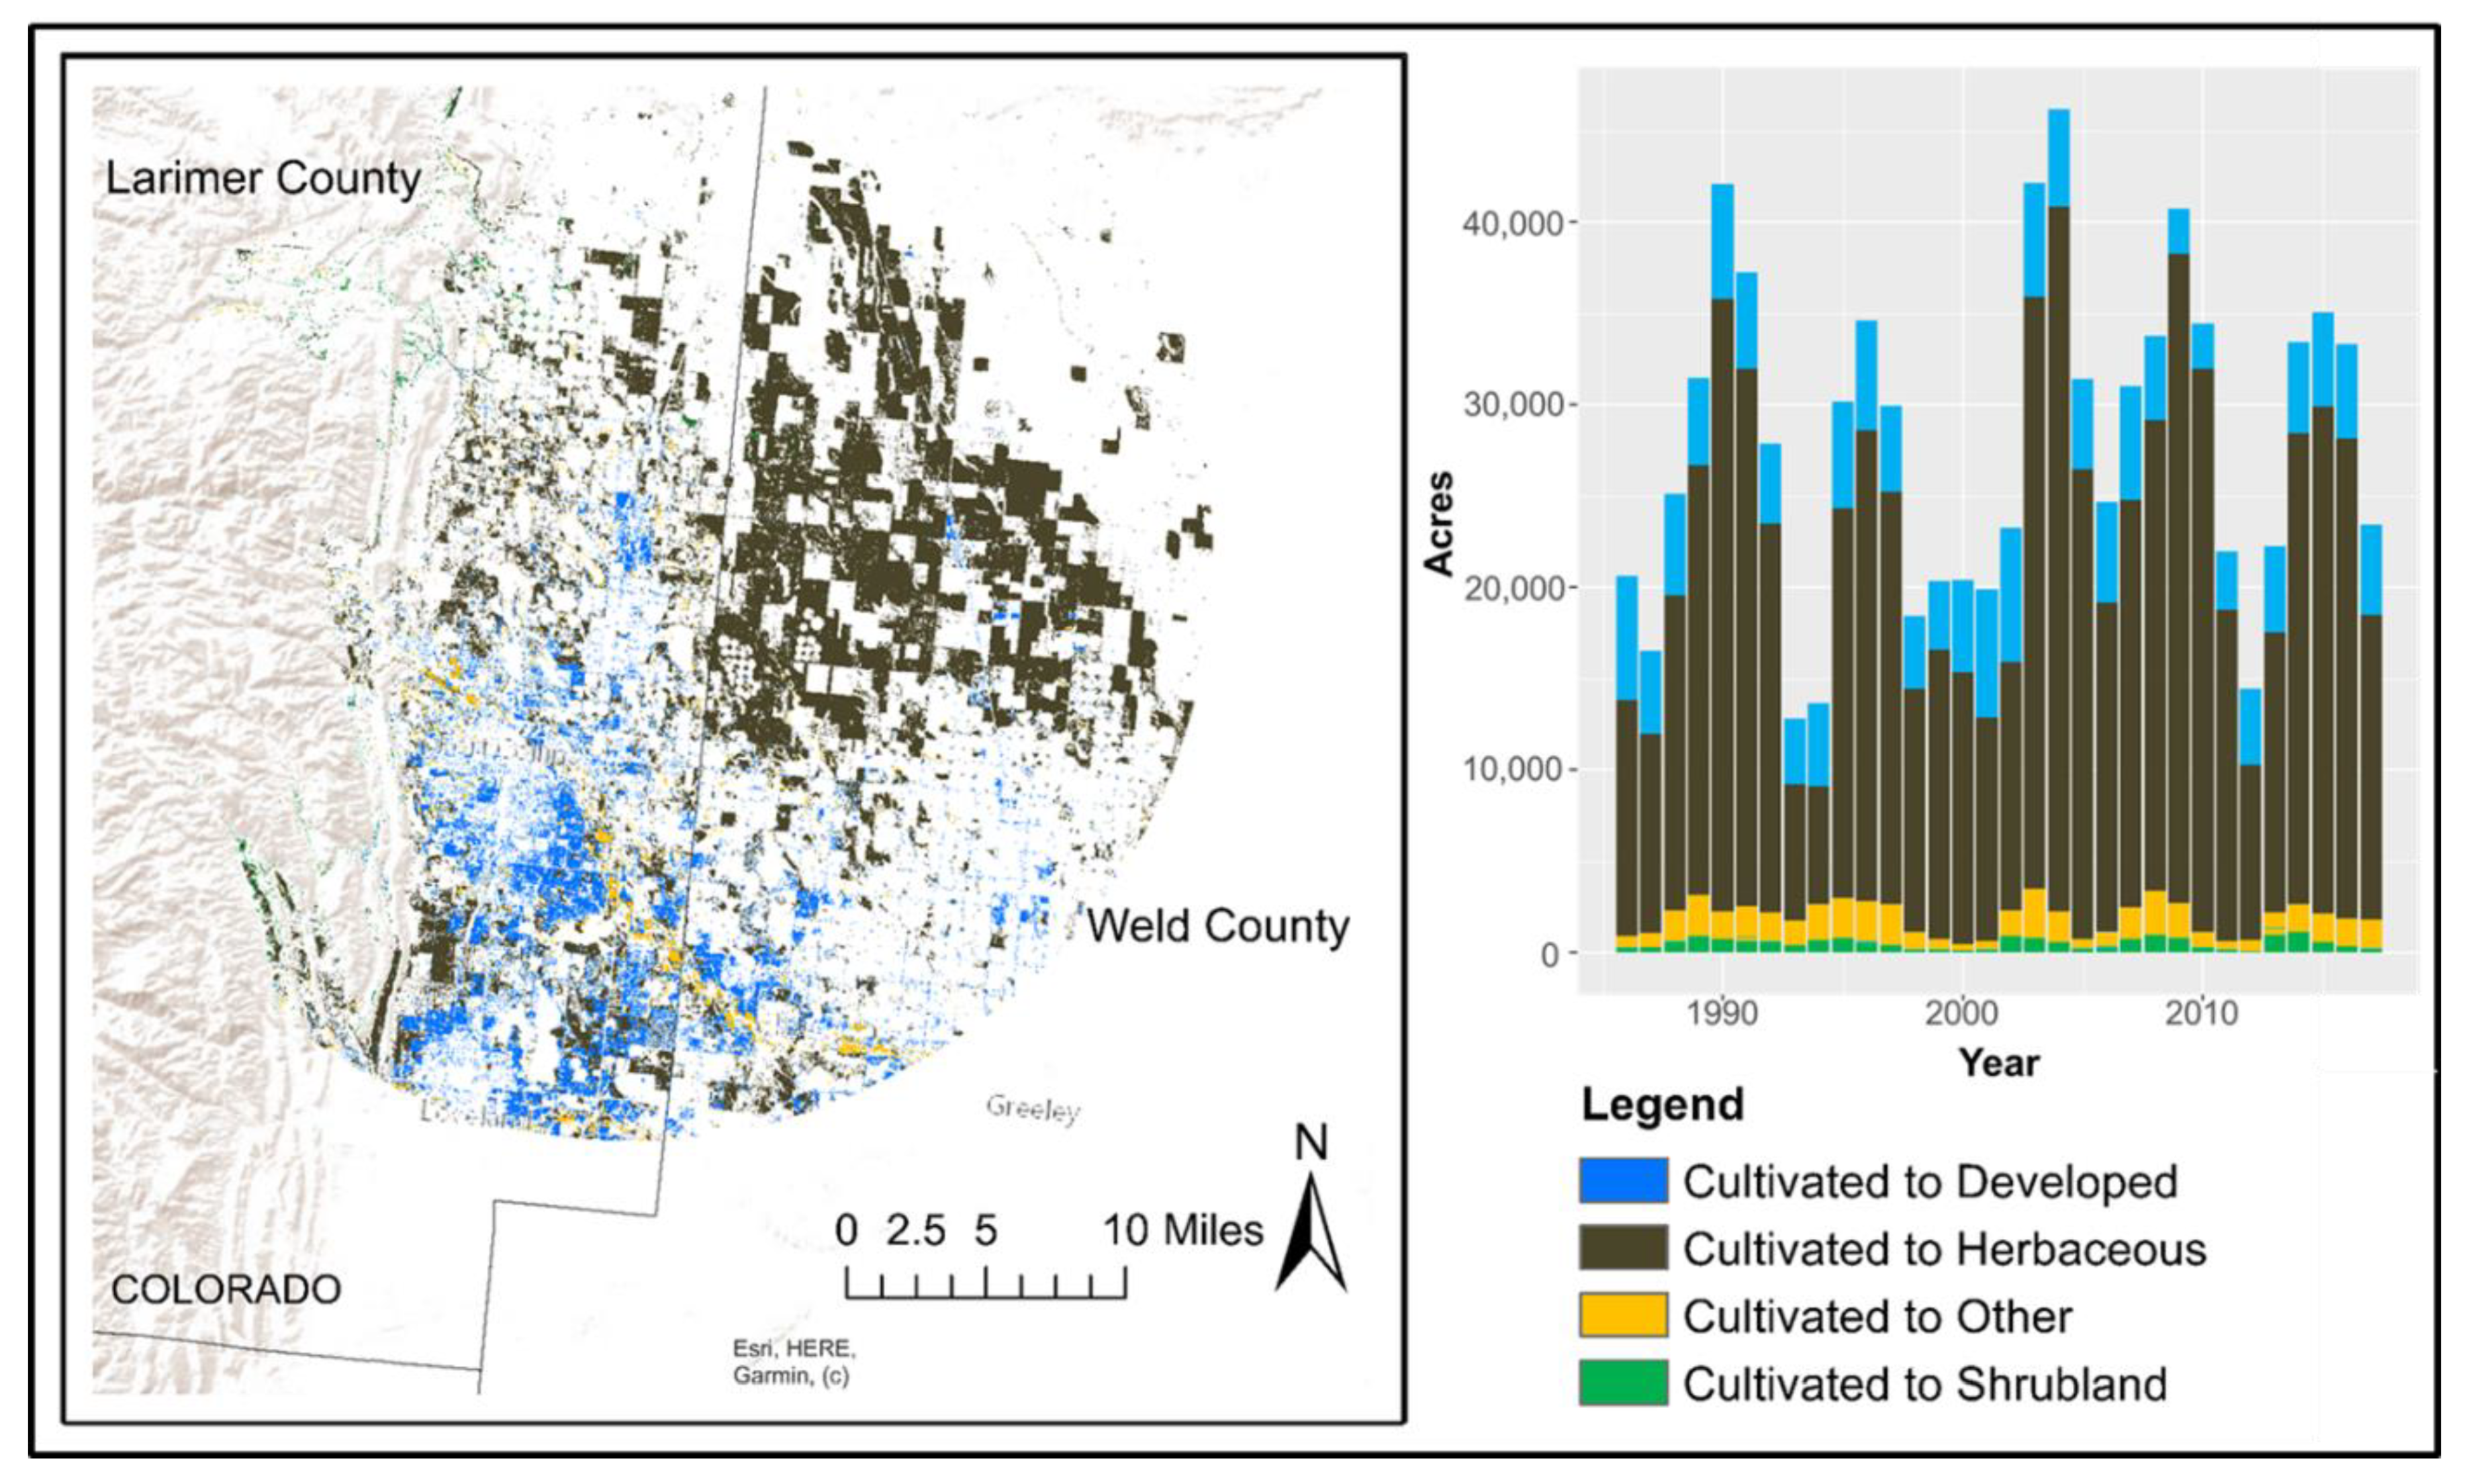
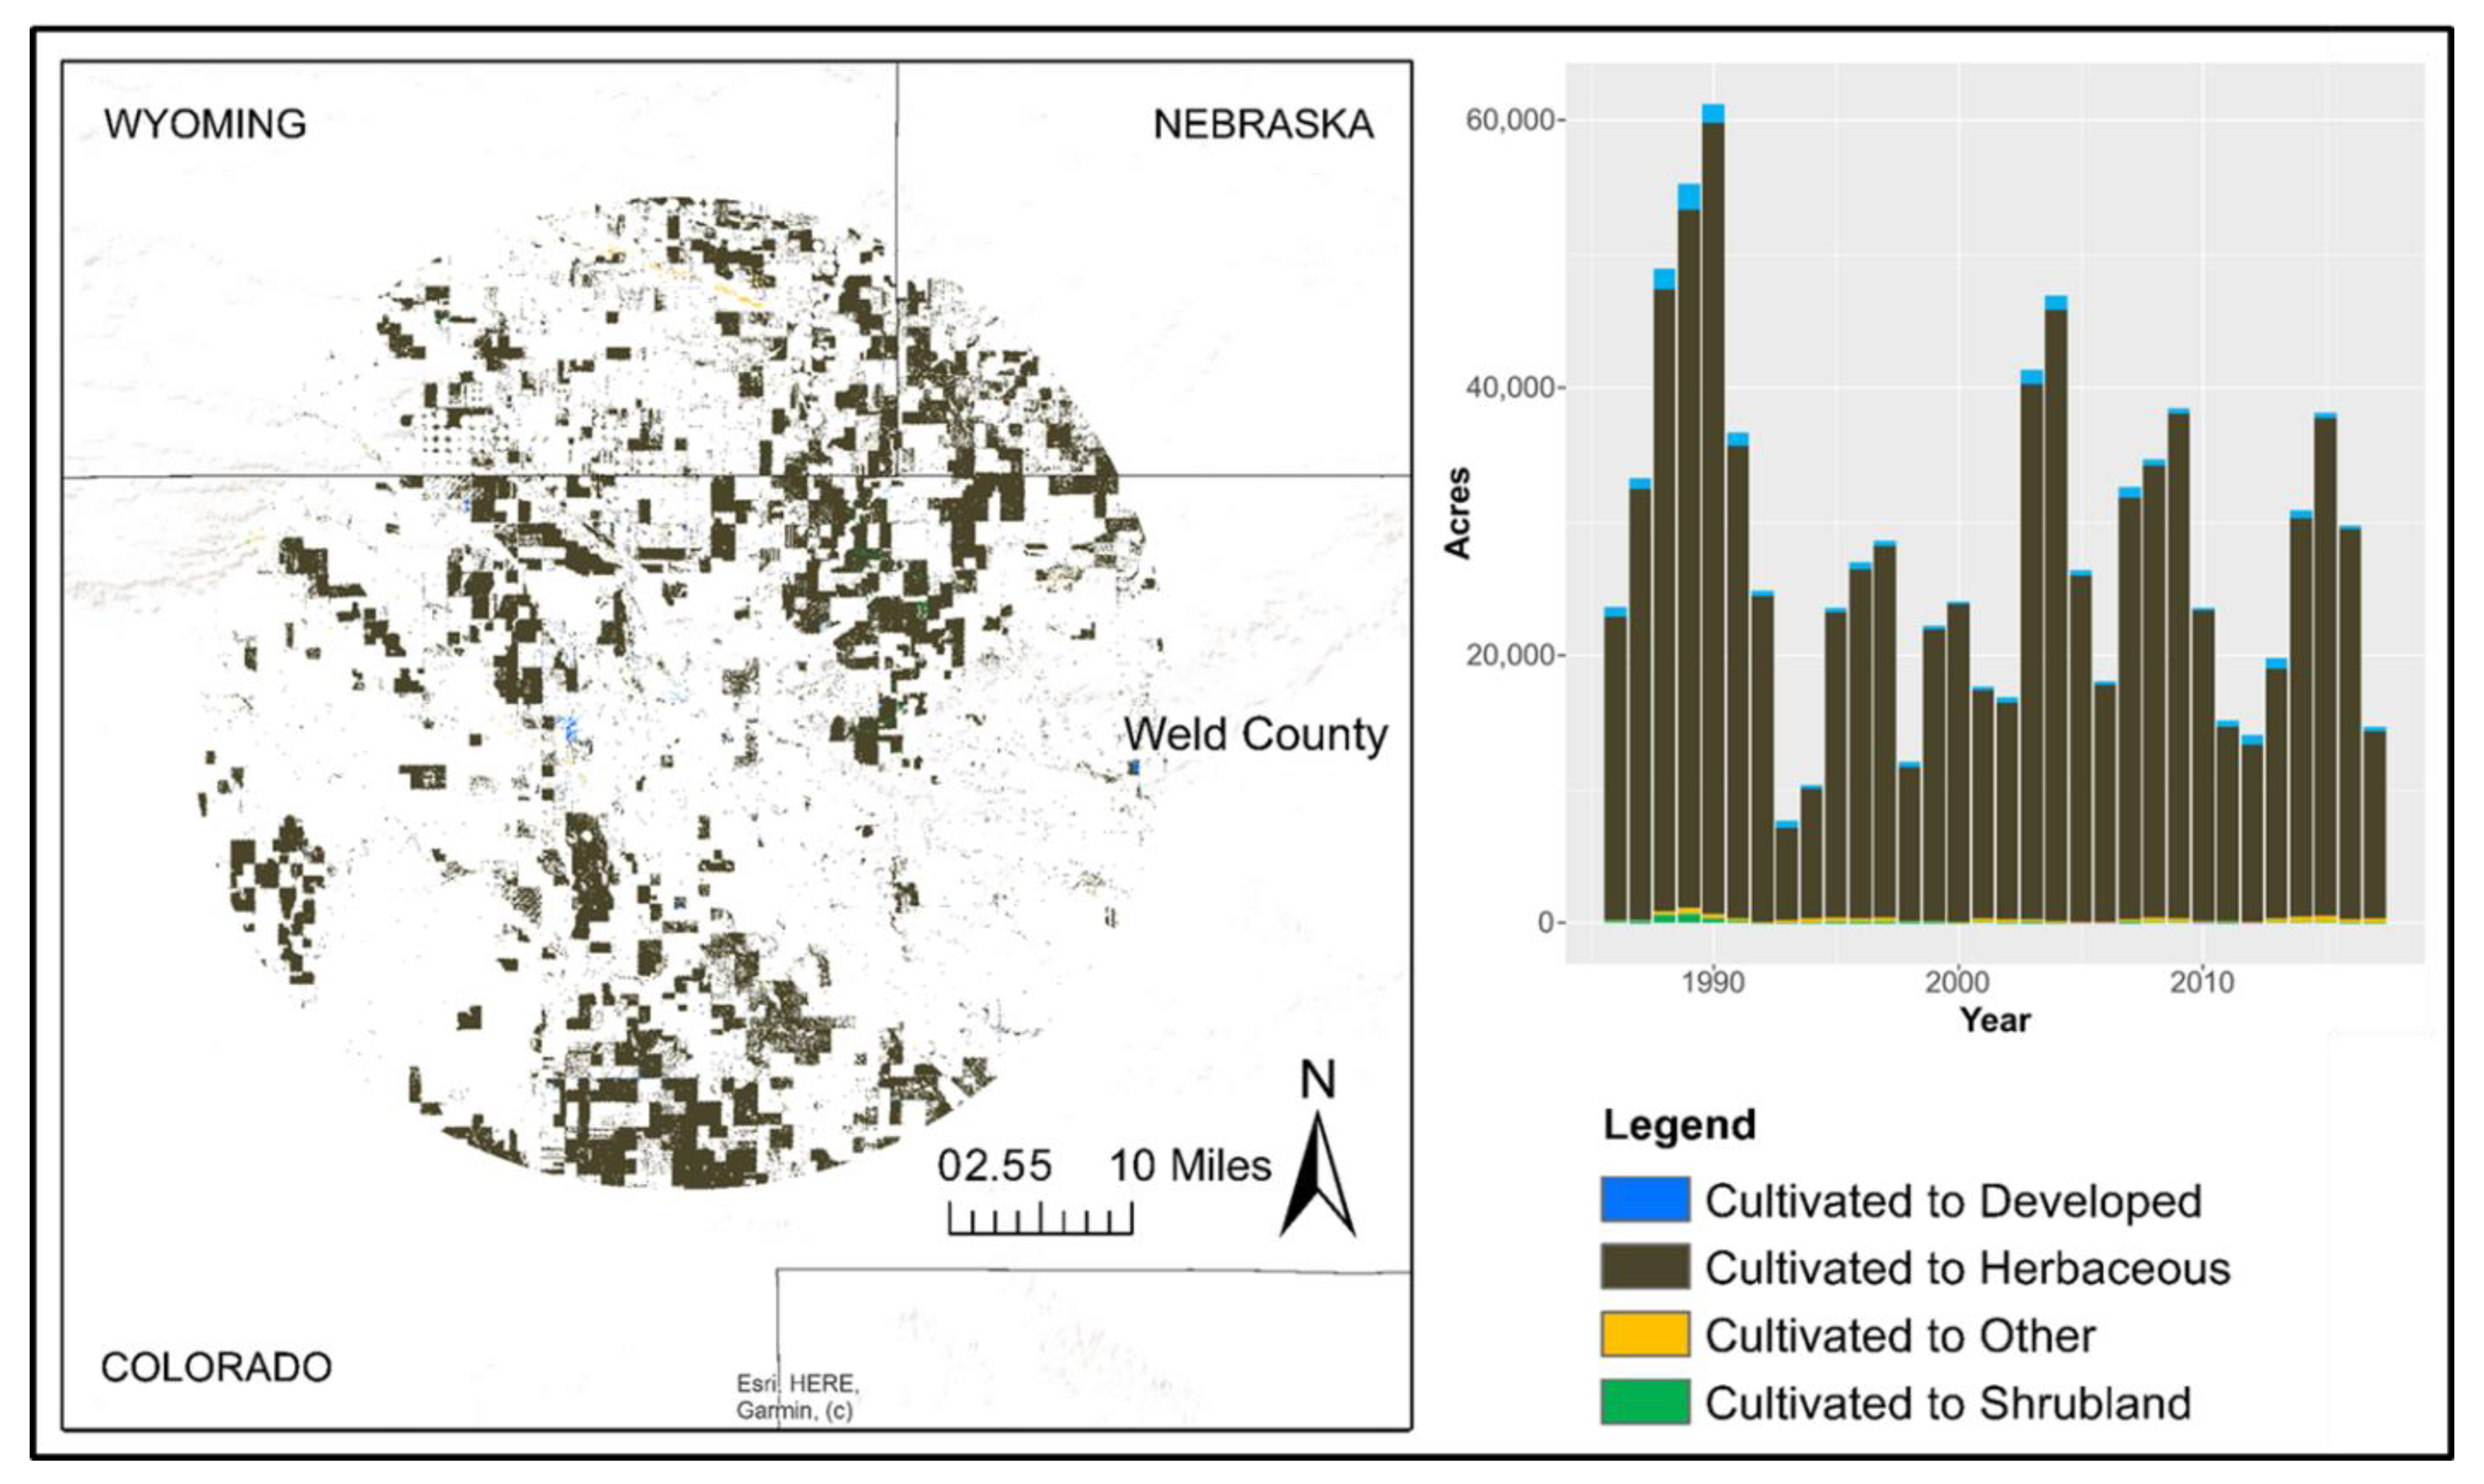
3.1. Quanitiative Land Classification Results: Land-Cover and Use Patterns

In both the NE Larimer and NC Weld sites, cultivated area decreased and herbaceous cover increased from 1984–2019 (Figure 4a,b). In 1985M, NE Larimer had 338,491 acres of cultivated area (36.7% of the total study area), which declined to 190,941 cultivated acres (20.7% of the total study area) by 2018M. This change represents a transition of 16.0% of the total NE Larimer site out of cultivated area (−147,550 acres or a 43.6% decrease of cultivated area) from 1985M to 2018M. The NC Weld site had 288,225 cultivated acres (34.0% of the total area) in 1985M, which declined to 129,609 acres (15.3% of the total study area) by 2018M. This change represents a transition of 18.7% of the total NC Weld study area out of the cultivated area (−158,616 acres or a 55.0% decrease of cultivated area) from 1985M to 2018M. From 1985M to 2018M, 10.3% of the total Larimer study area and 18.4% of the Weld study area transitioned to herbaceous cover (+94,926 acres and +156,474 acres of herbaceous cover in the Larimer and Weld study sites, respectively). Moreover, in NE Larimer, between 1985M and 2018M, 4.80% of the total area transitioned to shrubland (+44,614 acres of shrubland cover), and 1.83% of the total area transitioned to developed cover (+16,896 acres of developed cover). In NC Weld, between 1985M and 2018M, 0.572% of the total area transitioned to shrubland (+4850 acres of shrubland cover), and 0.183% of the total area transitioned out of developed land (−1583 acres of developed cover).
The identified trend of decreased cultivated area conflicts with findings in the literature at a countrywide scale. Hu et al. [75] found that cropland in the US increased slightly between 2000 to 2010, and other researchers (e.g., [2]) predict continued conversion of rangelands to croplands. Yet, many of these studies examine a larger land area over a shorter time [2,75,76,77]. Participants below questioned the sustainability of sole crop- or livestock-based agricultural operations in NE Larimer, with some suggesting the need for a more multifunctional approach to farming:
The question is, should you even try [agriculture] in Larimer County, and some of us are trying. An example of how to make [agriculture] sustainable is dude ranching or farm experiences and charging for that. Say [the operation] has two components, an agricultural component and an entertainment component. The two fit together in a holistic way, in fact. If you’re going to farm in Larimer County, maybe you have to have an enterprise of that sort to go with [the farming]. That’s not necessarily bad. You may say, well, is it agriculture?
(R8)
It is done. [Agriculture] will never be back, and of course, there are people that say that is just the way it needs to be, and we just need to move agriculture 25 miles east and figure out how to get water to them. Well, that is getting harder and harder to do.
(R3)
Yet, as one Weld County farmer shared, farmers and ranchers 50+ miles east of the Larimer study site also struggle to maintain their operations:
The farms are shabby, the buildings are falling down, the fences are down, the weeds are everywhere. That is just purely because they haven’t taken care of the past, and the droughts hit them, and they didn’t have enough water. Something happened, and the economics weren’t there, and the first thing to go was pride. Once that goes, the whole farm starts deteriorating.
(R1)
The above livestock ranchers identified direct and underlying forces driving land-use changes and potentially land-cover change in the NE Larimer and NC Weld sites.

3.2. Qualitative Interview Results: Respondents’ Understanding of Direct Causes of Change

While Geist and Lambin ([78], p. 143) define proximate or direct causes as “human activities or immediate actions at the local level, such as agricultural expansion, that originate from intended land-use and directly impact [land] cover,” the analysis disaggregates actor decisions from direct causes. Thus, this study defines direct causes as factors that directly influence actors’ land-use decisions. The research identifies multiple direct factors that interrelate to drive change, aligned with findings in other systems [78,79,80].

3.2.1. Direct Causes in the Northeastern Larimer Site

The NE Larimer site lies within the rapidly urbanizing Front Range corridor that extends from southern Wyoming to Pueblo, Colorado. Participants emphasized the significant influence of urbanization on their communities and decisions about their operations. While only 1.83% of the total area (16,896 acres) transitioned to developed land in the past 36 years, predominately converting cultivated and herbaceous areas, this reflects a 31.7% increase in developed land in the Larimer site (Figure 5). One rancher shared how increased developed land-cover feeds back to influence drivers of change, such as rising land values and associated taxes:
So, when we built this house, it was $250,000 or $275,000, something like that. And now they want to tax us for $750,000. So, my wife and I talked about it. It’s a nice problem in that our property has gone up in value, but now we want to stay in agriculture. As the people drive by and they see our little calves out here, and they come up and tell us our cow is dying. No, she’s lying on her side because she’s having a calf. I mean, it’s nice to have urban here. But it’s encroachment. So, can we stay in agriculture with what’s going on here? Because now our taxes go from $1500 a year to $4500 a year. So, you say, “Well, yeah, but your land…” We didn’t build this to sell it … I’m trying to make a living in agriculture, and my taxes have gone from $1500 a year to $4500 a year. I mean, in the whole scheme of things, it doesn’t break me. But now we’re talking taxes, we’re talking [a] different kind of fencing, it changes it … and Larimer County says it wants to be agriculture friendly. Does it?
(R16)
Aligned with previous research findings [32], the above rancher expressed how urban pressure does not always drive a rapid exit from agriculture. Instead, demographic changes directly affect an increase in developed land-use, which feeds back to regional and local level policies (e.g., taxes and regulations) and economies (e.g., cost of agricultural inputs). For instance, as regional economies and demographics restructure, demand for water and land from municipal buyers rises, increasing resource values [81]. These rising water and land costs decrease their uses as agricultural inputs, creating barriers to entry, expansion, and, in some cases, the maintenance of an existing agricultural operation. Such challenges can drive ranchers to diversify or contract their operations.
Figure 6 illustrates a general trend that the majority of land transitioned out of cultivated land and shifted to herbaceous cover from 1984–2019 in the Larimer study site. In addition, the Larimer rancher below shared how regional and local policies and programs have directly shifted land-use:
You have to be careful with [open spaces] because [the creation of Soapstone Prairie Natural Area] has taken some of [the land] out of agriculture. In other words, we used to run 1200 cows, and now we run 600 cows. So, it’s cut the productivity of that in half. On the other hand, Larimer County’s working with [farmers and ranchers] in Larimer County, so I mean we’ve got a great relationship with them. Is it exactly how we would run it? Nope. On the other hand, I never let a biker pass, or a hiker pass, or a guy riding horses pass without talking to them. Hey, here’s an opportunity to tell them about cattle, or agriculture in Larimer County, or the history of this place. Because we owned it for 30 years, and I mean, it’s very seldom that it turns into anything but a positive discussion.
(R16)
Another Larimer County rancher shared how Colorado Senate Bill 35, allowing sub-division to 35-acre parcels, affects the local culture and land-use patterns:
We do a lot of grazing on national forests, and we have these cattle drives and so on. The ability to do that has changed markedly over the last 20 years, 30 years. It’s just that there [are] twice as many people, twice as many 35-acre parcels. You know the 35-acre conundrum in Colorado … The people are getting less knowledgeable and flexible about grazing and so on.
(R8)
Since the regions’ transformation to Euro-American agrarian society, the dominant use of rangelands has been livestock grazing, with cultivation the secondary use [34]. The first rancher explained how conservation programs (e.g., Mountains to Plains Project) have maintained livestock grazing on some rangelands, but not at historical intensities (i.e., lower stocking rates), while also supporting multi-use landscapes (e.g., recreation, education, and conservation). Such transitions from private ranchland to open space align with Gosnell and Travis’ [82] findings on local land tenure trends, including increased ranchland ownership by conservation organizations as a rapidly growing form of ranching in the Rocky Mountain West. The second rancher’s quote aligns with Theobald et al.’s [43] finding that ranches’ division into ranchettes (i.e., 35-acre parcels) is a dominant shift in Colorado’s land-use. Recognizing the linked but disparate nature of land-cover and land-use, such low-intensity development and exurban migration can have a limited influence on land-cover/use trends while drastically affecting how the wider landscape can be used [42,43,82]. For instance, researchers have linked ranchettes in Larimer County to increased landscape fragmentation and weedy, invasive species [83,84,85].
Figure 5. The map illustrates the transition of cultivated, herbaceous, other (wetlands, water, barren, forest), and shrubland to the developed land-use class from 1985M (3-year median of 1984–1986) and 2018M in the northeastern Larimer County, Colorado study site. The stacked bar graph depicts the acres transitioned from 1985M–2018M.
Land 10 01399 g005
Figure 6. The map illustrates the transition from the cultivated land-use class to developed, herbaceous, other (wetlands, water, barren, forest), and shrubland classes between 1985M (3-year median of 1984–1986) and 2018M in the northeastern Larimer County, Colorado study site. The stacked bar graph depicts the acres that transitioned from 1985M–2018M.
Land 10 01399 g006

3.2.2. Direct Causes in the Northcentral Weld Site

The dominant land-cover/use trends in the NC Weld site are decreased cultivated area and increased herbaceous cover. Cultivated area predominantly transitioned to herbaceous cover in the NC Weld site (Figure 7). Drawing parallels to the conservation programs in Larimer (i.e., Mountains to Plains Project), Weld participants discussed the federal CRP’s influence on land-cover and use trends, directly driving a transition from cultivated to herbaceous. One Weld County farmer shared:
[The CRP] put millions of acres to the wayside. And the reason they did it was because our crops have always been a political tool within the whole world. And we just got way over-produced and [there were] so many crops that weren’t going to [be harvested]. So, they said they’d take all of [the lands that became the CRP] out of production, and then it balanced out a little bit. So maybe there was a good thought there. They were supposed to be 10-year programs, and they’d be over with. But during that time, we had the, for lack of a better word, we had the do-gooders out there [that extended the program to] 40-years. The CRP is really good for wildlife, and it’s good for the birds … And it had nothing to do with commodities. And it didn’t work for the commodity deal because I thought when this many acres went into it, the price of wheat would soar higher, and [it] didn’t. [They] actually went down. So, it didn’t work for that. Then we kept it going. It’s still going today. And we kept it going because of the preservation of wildlife. I just don’t know if the taxpayers are paying that much money to keep a sharp-tailed grouse alive. Is that important?
(R19)
The above farmer enrolled in the CRP, which effectively transitioned cultivated to herbaceous cover, but above, he questions the underlying and seemingly transitioning motivations for the federal policy.
Technology (e.g., mechanization) and oil and gas production are two factors that participants identified as driving land-use change in Weld County [32]. For instance, investment in new technologies and diversification are often mutual strategies, with diversification spreading equipment capital (e.g., tractors and cameras in the calving barns). Oil and gas also enabled multiple participants to maintain their ranches and, in many cases, expand [50]. While participants emphasized the role of oil and natural gas in maintaining and expanding their ranching operations, they also shared their struggles with an industry that brings pollution (e.g., dust) and traffic while making few contributions to the local culture. One ranching couple captured the complex role of the oil industry in rural communities in the West:
Husband: Oh yeah. As a ranch, we benefited from the damages. We have a way better surface amount of damage every month than most people. We’re just using that as one more way for this ranch to generate income. We’ll just take that money and put it somewhere where it will generate income down the road.
Wife: Like it helped buy the ranch in Texas.
Husband: So, if our kids need to sell something—which they will—the place down the river can sell, and it’ll be worth a lot of money.
Wife: And the oil and gas, we’re not negative toward it. We have to live with it, so you might as well.
Husband: We’ve benefited … We had a ranch that was basically a state park. We had very few roads through it, we could hardly ever drive a pickup in the pasture, four-wheelers, or side by side, and we don’t have trails. It’s one big, continuous chunk, and we locked the gates.
Wife: Used to.
(R27)
Husband: Used to, and now we might have 300 vehicles on our ranch in a day.
(R28)
The couple above allude to a “split estate,” where ownership of subsurface resources like minerals (e.g., oil and gas) is separated from ownership of the land’s surface [50]. As a result of payments for damages or surface disturbances due to oil and gas extraction, the above ranchers can maintain and expand their rangeland-based cattle operation, keeping acreage in herbaceous cover. Yet, while the operation remains in herbaceous cover, the land-use has diversified in a way that significantly alters the social–ecological landscape.
Figure 7. The map illustrates the transition from the cultivated land-use class to developed, herbaceous, other (wetlands, water, barren, forest), and shrubland classes between 1985M (3-year median of 1984–1986) and 2018M in the northcentral Weld County, Colorado study site. The stacked bar graph depicts the acres transitioned from 1985M–2018M.
Land 10 01399 g007

3.3. Qualitative Interview Results: Respondents’ Identification of Underlying Causes of Change

This study uses Geist and Lambin’s [78] terminology of underlying driving forces. Yet, this work also conceptualizes the study system as a complex adaptive SES. Thus, this study expands upon the definition of underlying driving forces to include social–ecological interactions as underlying driving forces of change and frames these factors as underpinning direct drivers while also directly influencing actors.
Participants presented socio-cultural and climate change as underlying drivers of system changes. This study defines culture as the unique customs, beliefs, and knowledge that have shared meaning for a group of people [86,87]. Moreover, ranchers discussed federal policies as both underlying and direct change drivers, sometimes directly influencing their land-use decisions as presented above while also underpinning direct factors. For instance, while participants positioned the CRP as a direct driver influencing their adaptive strategies, they also discussed how the federal program underpinned direct change factors, such as local demographics. For example, one Weld County rancher shared:
Well, the CRP program, which it’s had positive and negative effects on the community on both sides. It just kind of depends where you sit there. [The CRP has] enabled [my parents] to retire, more or less … The check just came to the mailbox. You didn’t have to worry about a crop or anything, but then on the other side of that, they didn’t have to go out and buy any fertilizer or parts or diesel. You see what I mean? … It was a good investment, so a lot of absentee owners bought a lot of CRP land at banks. That draws quite a bit of money out of the community. So, CRP has been good, bad, both, [it] just depends [on] how it affected you. So, I don’t know. I’ve got some CRP land [of] my own. So, it’s neither here nor there. It’s been good and bad both. It just depends how you want to look at it.)
(R21)
The rancher’s statement echoes Smith and Martin’s [88] and other researchers’ findings [89,90,91,92] that the viability of local ranches and the associated rural communities are linked. Smith and Martin [88] emphasized that the link is more than economic, with ranching contributing to regional and community culture and demographics. The rancher’s quote captures how the CRP program underpins local economies and demographics in the NC Weld study site.
In both study sites, interviewees emphasized socio-cultural change’s significance and driving force, especially regarding public perceptions of agriculture. For example, one Larimer County rancher explained how increasing social heterogeneity influences cultural change:
So, I drive down the road, and we’ve got cattle in the trailer, and the people from California that move here don’t understand that we go 45 miles an hour in a 50 mile an hour zone, and they do 70. When they go by here, they wave, not with all their fingers, if you get what I’m saying. So, the real encroachment is, I mean … that I don’t mind people who want to move out in the country, as long as they want to move out in the country, but they want to move out in the country and change it to where they came from. So, the little rural towns change, and then they want to annex the little rural towns.
(R16)
The above rancher identified socio-cultural change as “the real encroachment” (R16). Exurban migration (i.e., shifts in demographics and economies) and socio-cultural change reinforce each other, driving rapid and significant change. Above, the interviewee positions cultural encroachment as exogenous to rangeland-based agriculture. Yet, interviewees also identified socio-cultural changes within agriculture, including shifting political views in rural communities.
Participants shared diverse viewpoints regarding climate change and changing weather patterns (e.g., increased extreme weather events), aligning with broader research on peoples’ perceptions of climate change [93]. Yet, there was consensus on the dynamism, complexity, and persistent influence of extreme weather events, which some linked to climate change. Participants shared lived experiences of the impacts of extreme weather events on direct causes (e.g., local demographics and economies) and land-use decisions. One Weld County couple shared how drought drove people to sell their cows, forcing a transition from a cow-calf to yearling operation:
Husband: [Drought] changes the way everybody does business. Some of the people had to liquidate their [cows], so they would no longer be a cow-calf but a yearling operator. We have had to raise different crops. We used to raise sugar beets. We had shares in Western Sugar. We were part of that co-op and were owners of that company. We had to sell [because] we didn’t have enough water to raise sugar beets. We had to decide if we were going to stay in the cattle business or if we were going to be cash farmers with beets. So, it forced us to liquidate [the beet] portion of the business. It has caused some major changes with the communities. It has caused a lot of people to move out. There are a lot of empty houses now.
(R1)
Wife: Right, we have definitely seen a decline.
(R2)
Below, another rancher shared:
So, we hit another drought in the 1980s [and] things change dramatically. [The] whole system changed, and I even went to a meeting. There were bankers, farmers, everybody. It was a big crowd of people, and they were trying to explain to us that things were going to be different, but they didn’t tell us what we were going to have to do. It was like, “We know what we’re going to do. We’re going to eat you like you’re just raw meat.” And they did. A lot of farmers took a fall quick. I was able to hang on, and I came down to the point I had $60,000 in debt … Now, at that time, I had over 2000 acres of grassland, the best water, good fences, good equipment, [and] the knowledge. They wanted to foreclose. Now, you got to think about that, for $60,000.
(R30)
The rancher above framed drought within a complex adaptive SES, capturing how the extreme weather event underpinned direct change drivers.

4. Discussion

This study integrates the analyses of 36 years of remotely sensed imagery and 32 rancher interviews for the two NE Colorado study sites to develop a social–ecological rangeland change model (Figure 8). The rangeland change model builds upon existing conceptual work [30] and previous research on ranchers’ adaptive strategies [32] (Figure 8).
Out of the four major land-cover/use classes in the study sites, cultivated, herbaceous, developed, and shrubland, the analysis omitted shrubland in the above rangeland change model because ranchers did not discuss the land class in interviews. This study offers that this is due to participants conceptually linking shrubland with herbaceous cover and observing little change in shrubland cover. The western portion of the NE Larimer site transitions into mixed shrubland, primarily mountain mahogany (Cercocarpus spp. [Kunth]), and herbaceous foothills used for extensive grazing [94]. In the NC Weld site, some of the prominent shrubs, such as Fourwing saltbush (Atriplex canescens [Pursh] Nutt.), are palatable to livestock (and wildlife) [95]. Thus, the research team posits that participants in both sites may have conceptually grouped shrubland with herbaceous cover, with ranchers’ references to rangelands, grazing lands, and pasture representing the aggregation of herbaceous and shrubland cover. Moreover, research in Weld County has identified a positive relationship between shrubs and sandy topsoils over medium-textured subsoils in the shortgrass steppe [96,97]. Thus, given this association between shrublands and soils unsuitable for agriculture (and often for development), this analysis offers that shrublands are less likely to transition to crop or developed cover. Therefore, participants did not observe and thus did not discuss significant transitions to shrubland cover. This study indicates that further research could examine if and how land change patterns specific to shrublands incorporate into the proposed rangeland change model.

4.1. Land Change Patterns: Cultivated to Herbaceous Cover

Herrick et al. [2] identified a national trend of native rangeland conversion to “productive” uses like development or crop farming. As the Dust Bowl showed, cultivation of these often marginal lands, such as parts of the shortgrass steppe, can force systems over ecological thresholds (i.e., transitions among stable states) with varying reversibility potential [98,99]. In contrast to the national trend, in both NE Colorado study sites from 1984–2019, the most considerable net losses were to cultivated area and the largest net gains to herbaceous cover. The findings indicate that the trend of rangeland conversion can be reversed or mitigated, at least on a scale relative to the study area. Interviews discussed the role of programs and policies, such as the CRP, in reverting cultivated areas back to herbaceous cover. Also, efforts such as those led by Larimer County and the City of Fort Collins, mitigated the conversion of rangelands, maintaining herbaceous cover.
Much of the acreage affected by these programs and policies have become working landscapes, often supporting livestock grazing [47]. The CRP is the exception, but recently, the program introduced limited forms of grazing under the 2014 Farm Bill. The 21st century propelled grazing systems into a polarizing global debate focused on generic solutions [100,101,102]. The who, what, why, and when of livestock grazing are context-specific and complex. Yet, on the shortgrass steppe in NE Colorado75 years of grazing treatments have demonstrated that grazing as a land-use—even many years of heavy grazing—is unlikely to push the system over a threshold [103,104,105,106]. Moreover, research has shown that the blue grama-dominated shortgrass steppe experiences limited species composition change under long-term light; moderate; and in some cases, heavy grazing [104]. In the face of broad trends of rangeland conversion and associated biodiversity and agricultural livelihood losses, this research offers a counterexample, showing how national and local policies combined with continued grazing use conserve rangelands and maintain ranching livelihoods in NE Colorado, at least for now.

4.2. Ranchers’ Adaptive Strategies

The land change literature frequently aggregates actors’ land-use decisions with direct drivers of change [78,79]. This study disaggregates actors from forces of change, acknowledging that interactions between actors and other direct drivers of change affect land change patterns [31]. Bruno et al. [32] found that NE Colorado farmers and ranchers employ three main adaptive strategies: diversification (adding enterprises), extensification (purchasing or leasing more land or livestock), and contraction (selling land or livestock). The findings captured above in the rangeland change model indicate that these adaptive strategies are influenced by intersecting direct and underlying forces of change. Livestock ranchers’ diversification and expansion strategies influence on-operation transitions of cultivated to herbaceous cover. Moreover, livestock ranchers’ contraction strategies (e.g., selling land) can drive land-cover/use transitions from cultivated to herbaceous cover in areas with conservation programs/policies (e.g., open space programs) and the transition of cultivated and herbaceous areas to developed cover. While agricultural producers have a high level of control over their initial decision to reduce their operation size through land sales (contraction), this strategy decreases their influence over future land-use decisions (depicted by dashed arrows). The system components—underlying driving forces, direct causes, ranchers’ adaptive strategies, and land change patterns—interrelate and feedback to shape and adapt the SESs.
Ranchers have been called the West’s keystone species [107], and as such, their land-use decisions are critical, especially in regions with significant private landholdings. Yet, this study and previous research have found that the sale of ranchland is a frequently employed adaptive livelihood strategy in Colorado and the Rocky Mountain West more broadly [32,43,82,108]. Moreover, the findings highlight how decreased cultivated acres can negatively affect local economies, often leading to local demographic changes in rural communities (i.e., depopulation). Finally, land tenure dictates who makes decisions about using and managing land and connected resources [1], and this study indicates that current land-use trends are reducing livestock ranchers’ influence on natural resource management. Thus, this study suggests that future research should build upon the proposed rangeland change model by incorporating actors who have increasing influence in this study system, such as prominent conservation organizations and public officials at the county and city levels. Moreover, as discussed in more detail below, these land tenure shifts have socio-cultural implications that require further study.

4.3. Direct Driving Forces of Land Change Patterns

The findings indicate that some forces of change identified as underlying in the literature directly affect land change in the study sites [78,79]. For instance, participants shared that policies, such as the USDA CRP, are significant and often direct drivers of their decisions. By 2019, Colorado enrolled 1838,914 acres in the CRP, with 241,562 acres in Weld County alone [39]. In Larimer County, the City of Fort Collins, the county government and partners placed 60,000 acres into either open spaces or conservation easements. Such programs and policies have directly affected land change patterns, which underlie ecological outcomes, such as increased wildlife habitat [38,47]. Moreover, in NE Colorado on the shortgrass steppe, Burke, Lauenroth, and Coffin [109] compared fields with native vegetation, those abandoned from cultivation 50 years prior, and areas recently cultivated, finding that fields with native vegetation had the highest soil organic matter and silt.
Yet, other direct drivers can mitigate herbaceous conversion while negatively affecting the SES. For instance, there remains a debate on the higher environmental impacts of many ranchettes with less livestock per operation versus large ranches [82,110]. Ranchettes have a relatively small development (house and road) footprint while maintaining a parcel size of at least 35 acres. Yet, Mitchell et al. [85] longitudinally compared large intact ranches and ranchettes in Larimer County from 1957 and 1994, finding that ranchettes had significantly higher landscape-level fragmentation. While both Larimer and Weld Counties have large tracts of protected areas, Knight et al. [84] posit that rural subdivisions abutting protected areas present challenges, including liability and public relations. Also, subdivisions can increase the spread of nonnative, weedy species [84], and road infrastructure [83].
Demographic shifts are another direct driver that can mitigate herbaceous conversion while negatively affecting the SES. As demographics shift, demand for urban and industrial water increases, raising the value of water rights and leases [111]. In addition to land tenure shifts, changing water rights are also central to land change, especially in semi-arid and arid landscapes where water dictates land-use. For instance, landowners can earn more by selling or leasing water rights than using water as an agricultural input [81]. This study also suggests that the “buy and dry” trend may drive the reduction of cultivated area and increase in herbaceous cover. This trend results from municipalities purchasing farmland primarily for water rights and letting the land lie fallow and unirrigated. Unless proactively restored to native vegetation, such weedy species often invade such abandoned farmland, including non-native invasive plants, which still show up on remote sensing as herbaceous cover [112].

4.4. Underlying Driving Forces of Land Change Patterns

Participants identified climate change; socio-cultural change; and national, regional, and local policies/programs as underlying driving forces of land change. They discussed these elements as underpinning direct drivers, and in the case of culture, shaped by system feedbacks. Socio-cultural change in NE Colorado is well documented, with changing regional economies and demographics driving increased social heterogeneity and cultural change [42,43,82,113]. While heterogeneous communities can experience conflict over resource use (e.g., agricultural production versus conservation) [114], this study suggests that such social heterogeneity has and can continue to contribute to natural resource management [115]. For instance, in the study areas, multiple collaborative efforts, such as the Mountains to Plains Project, have worked to balance multiple and sometimes divergent social and ecological goals across complex systems (e.g., [47,116]).
While land-cover/use trends indicate gains towards local and regional ecological objectives, participants shared concerns about cultural resilience. Research conducted by several of the authors found that livestock ranchers identified the significance of local culture on their adaptive livelihood strategies and their ability to verify their identities as farmers and ranchers [117]. For instance, NE Colorado livestock keepers expressed how their family histories in ranching supported their continued commitment to agriculture. However, despite the importance of culture to their adaptive livelihood strategies, participants expressed little sense of agency or influence over underlying forces, including socio-cultural change. This study emphasizes that land change is a social and ecological phenomenon. As such, future research could more deeply examine how agricultural producers conceptualize themselves within an SES, explicitly their perceived influence on climate, socio-cultural change, and policies. Such work may increase livestock ranchers’ sense of agency while also informing outreach efforts, especially climate change messaging. This research also indicates that existing and future conservation efforts may need to expand upon cultural resilience programming, especially programs like CRP, that lack a collaborative component. Finally, this study builds upon existing conceptual work, and future research, significantly further qualitative work, could adapt and expand the generalizability of the proposed model to new sites and systems.

5. Conclusions

This study applied a multi-method approach to examine holistically the causes and consequences of land-use change in rangeland SESs in NE Colorado. Previous research on land-cover change in rangelands has often used a limited number of timesteps and consequently struggled to match qualitative data’s temporal and spatial extent. As a result, landscape-level research on rangeland change has often focused on either land-use decisions or land-cover/use change trends. This study developed a Random Forest land classifier that enabled us to align the land-cover/use analysis’s temporal and spatial extent with participants’ lived experiences. This study integrated these analyses, constructing a rangeland change conceptual model that illustrates the interrelationship among direct and underlying forces of change, livestock ranchers’ adaptive land-use strategies, and land-cover/use change patterns. This research found that both study sites experienced a decline in cultivated land-use from 1984 to 2019, with most cultivated areas transitioning to herbaceous/grassland cover. The qualitative analysis identified the significant role of conservation programs and policies, especially the Conservation Reserve Program and open space programs, in driving the trends of decreased cultivated and increased herbaceous acres. This study also found that despite the relatively small number of acres that transitioned in and out of developed cover, participants emphasized how demographic and socio-cultural changes affect their land-use decisions and, ultimately, land-cover/use patterns. This research suggests that prominent global rangeland and grassland conversion trends can be reversed or mitigated, promoting the conservation of these vibrant, essential, and imperiled SESs.

Supplementary Materials

The following are available online at https://www.mdpi.com/article/10.3390/land10121399/s1, Figure S1. Confusion matrix of the model classifier, Figure S2. Faceted class cover proportion (%) for barren, cultivated, developed, forest, herbaceous, shrubland, water, and wetlands in the northeastern Larimer County, Colorado study site, Figure S3. Faceted class cover proportion (%) for barren, cultivated, developed, forest, herbaceous, shrubland, water, and wetlands in northcentral Weld County, Colorado study site, Table S1: Confusion matrix of the model classifier, Equation S1: Classification Accuracy, Table S2. Statistical evaluations of accuracy of classification outputs for the two study site sites compared to the National Land Cover Database (NLCD) classifications.

Author Contributions

Conceptualization, J.E.B. and S.J.L.; Methodology, J.E.B., S.J.L. and J.S.B.; Software, J.E.B. and J.S.B.; Validation, J.E.B. and J.S.B.; Formal Analysis, J.E.B. and J.S.B.; Investigation, J.E.B.; Data Curation, J.E.B. and J.S.B.; Writing—Original Draft Preparation, J.E.B.; Writing—Review & Editing, J.E.B., S.J.L., J.S.B. and M.E.F.-G.; Visualization, J.E.B.; Supervision, J.E.B., S.J.L. and M.E.F.-G.; Project Administration, J.E.B. and M.E.F.-G.; Funding Acquisition, M.E.F.-G. All authors have read and agreed to the published version of the manuscript.

Funding

Funds from the Colorado Agricultural Experiment Station COL00769 supported this research.

Institutional Review Board Statement

The study was conducted according to the guidelines of the Declaration of Helsinki, and approved by the Institutional Review Board of Colorado State University (protocol code 040-19H received on 19 November 2018).

Informed Consent Statement

Informed consent was obtained from all subjects involved in the study.

Data Availability Statement

The openly available data and algorithms used in this study are listed in the References section. The land classification model developed in this study is available at https://github.com/jakebobu/random-plains-class (accessed on 6 April 2021).

Acknowledgments

We extend thanks to the research participants for graciously sharing their experiences of change. We also thank Meena M. Balgopal, Paul J. Meiman, and Robin S. Reid for their insightful feedback.

Conflicts of Interest

The authors declare no conflict of interest.

Appendix A

Semi-structured Interview Questionnaire.

Appendix A.1. Identity

  • First, what is your name and the name of your ranch/farm/operation?
  • Do you yourself identify as a rancher, farmer, business/agribusiness operator, etc.?
  • I am interested in the experiences of a range of producers from farmers to ranchers to agribusiness operators, and more specifically, I am interested to understand the unique roles of each of these operators. I noticed that you identified your operation as a [select title]. What does it mean to be [select title] operation versus a [select title]?
  • What does it mean to be a [selected title], and how is a [select title] different from a [select title]?
  • How many years have you been a [selected title], and were your parents [select title]? Note: If prompted by the participant, a lengthier discussion of family history may develop. If not, this discussion will be continued below with questions regarding succession.

Appendix A.2. Land-Use

  • Can you describe your operation to me? Note: Depending upon what the individual mentions, I may follow-up with some more specific questions regarding scale?
  • (If not mentioned above) What type of operation do you run, and what livestock are involved in the operation? Note: Depending upon the response of the individual, I will follow-up with questions regarding breeds, breed selection, and potentially, scale?
  • In addition to livestock production, are you involved in other enterprises (e.g., hay production, tourism, construction, etc.)?

Appendix A.3. Livelihoods

  • Have you experienced a major event such as drought? If yes, can you walk me through the experience?
If yes and after the initial overview, we will address the below matrix:
Table A1. Livelihoods table for major events.
EventDid You Have a Drought Plan In-Place? If Yes, Was It Useful?Effect of the EventYour ResponseCommunity ResponseWho Was Affected within the Household? How?Who Was Affected within the Community? How?What Were Some Sources of Support? Note: If Only Income-Based Support Is Mentioned, I Will Inquire More Broadly Regarding Support (e.g., Family, Church, Academic Institution)?
Note: If an event(s) is identified, this will prompt a discussion on the role of community and individuals in livelihood coping strategies.
  • How has this experience changed you and your operation?
  • Is there anything important about the drought event that I forgot to ask about?

Appendix A.4. Change

  • What are the main things that have been changing in this community over the past 5 years or so? Has the economic base changed (e.g., from agriculture to oil & gas or to tourism)?
  • Are the kinds of people who live in the community changing, and if so, how? Is the population size changing? If yes, why are people migrating in and out of the community? Why have you remained in the community?
  • (If not discussed in the individual/identity section above) How did you become a [select title]?
  • Do you have a person or institution to continue the operation of your ranch or farm once you retire? If so, who, and how did you establish the relationship with this individual?
  • People have told me that ranching, farming, or more generally, a rural lifestyle can be in our DNA, passed down and maintained? How do you think ranching/farming/rural lifestyles could be maintained in the US? What do you see as the future of ranching/farming/rural lifestyles in the US?

Appendix A.5. Well-Being and Gender

  • In your experience, have you observed or experienced negative changes to ranching/farming in the last 5 years? Last 10 years? Have these changes impacted your life in the last 5 years? Last 10 years?
  • In your experience, have you observed or experienced positive changes to ranching/farming in the last 5 years? Last 10 years? Have these changes impacted your life in the last 5 years? Last 10 years?
  • More specifically, what have been the main challenges for you and your operation over the past 5 years (e.g., labor shortage, marketing, production, etc.)? Last 10 years?
  • Has your access to natural resources changed over the past 10 years (e.g., access to land, water, etc.)?
  • Have you seen changes in the roles of men and women over the past 5 and 10 years, and across the last few generations? If yes, can you describe some of these changes? How have you seen the lives of women improved, and how have women become more disadvantaged? How have the lives of men improved, and how have men become more disadvantaged?
  • Have you observed that certain individuals or groups of people are excluded from the benefits of the ranching/farming lifestyle? If so, which group or groups of people? Have you observed that certain individuals or groups of people have recently been welcomed into the ranching/farming lifestyle? If so, which group or groups of people?
  • Are there organizations or institutions that have held you back from gaining a better living? Are there people in the community who are particularly disadvantaged by the way these organizations or institutions work? If so, which group or groups of people? Inversely, are there organizations or institutions that have helped you to gain a better living? If yes, how have they supported you?
  • What changes would you like to make to your lifestyle or operation? What has held you back from making these changes? What are some opportunities that may help you achieve your desired goals?

Appendix A.6. Wrap-Up

  • Is there any question or questions that you would like to ask me?
  • Is there anything that I missed or should have asked?

References

  1. Reid, R.S.; Fernández-Giménez, M.E.; Galvin, K.A. Dynamics and Resilience of Rangelands and Pastoral Peoples Around the Globe. Annu. Rev. Environ. Resour. 2014, 39, 217–242. [Google Scholar] [CrossRef]
  2. Herrick, J.; Brown, J.; Bestelmeyer, B.; Andrews, S.; Baldi, G.; Davies, J.; Duniway, M.; Havstad, K.; Karl, J.; Karlen, D.; et al. Revolutionary Land Use Change in the 21st Century: Is (Rangeland) Science Relevant? Rangel. Ecol. Manag. 2012, 65, 590–598. [Google Scholar] [CrossRef]
  3. Sayre, N.F. The Politics of Scale: A History of Rangeland Science, 1st ed.; University of Chicago Press: Chicago, IL, USA, 2017. [Google Scholar]
  4. Sayre, N.F.; McAllister, R.R.; Bestelmeyer, B.T.; Moritz, M.; Turner, M.D. Earth Stewardship of rangelands: Coping with ecological, economic, and political marginality. Front. Ecol. Environ. 2013, 11, 348–354. [Google Scholar] [CrossRef]
  5. Hruska, T.; Huntsinger, L.; Brunson, M.; Li, W.; Marshall, N.; Oviedo, J.L.; Whitcomb, H. Rangelands as Social–Ecological Systems. In Rangeland Systems: Processes, Management and Challenges; Briske, D.D., Ed.; Springer: Berlin/Heidelberg, Germany, 2017; pp. 263–302. [Google Scholar] [CrossRef] [Green Version]
  6. Ostrom, E. A diagnostic approach for going beyond panaceas. Proc. Natl. Acad. Sci. USA 2007, 104, 15181–15187. [Google Scholar] [CrossRef] [Green Version]
  7. Holling, C.; Berkes, F.; Folke, C. Linking Social and Ecological Systems; Berkes, F., Folke, C., Eds.; Cambridge University Press: Cambridge, UK, 1998. [Google Scholar]
  8. Turner, B.L., II; Lambin, E.F.; Reenberg, A. The emergence of land change science for global environmental change and sustainability. Proc. Natl. Acad. Sci. USA 2007, 104, 20666–20671. [Google Scholar] [CrossRef] [PubMed] [Green Version]
  9. Lambin, E.F.; Meyfroidt, P. Land use transitions: Socio-ecological feedback versus socio-economic change. Land Use Policy 2010, 27, 108–118. [Google Scholar] [CrossRef]
  10. Lambin, E.F.; Turner, B.L.; Geist, H.J.; Agbola, S.B.; Angelsen, A.; Bruce, J.W.; Coomes, O.T.; Dirzo, R.; Fischer, G.; Folke, C.; et al. The causes of land-use and land-cover change: Moving beyond the myths. Glob. Environ. Chang. 2001, 11, 261–269. [Google Scholar] [CrossRef]
  11. Lambin, E.F.; Geist, H.J. (Eds.) Land-Use and Land-Cover Change: Local Processes and Global Impacts; Springer: New York, NY, USA, 2008. [Google Scholar]
  12. Agarwal, C.; Green, G.M.; Grove, J.M.; Evans, T.P.; Schweik, C.M. A Review and Assessment of Land-Use Change Models: Dynamics of Space, Time, and Human Choice; General Technical Report NE-297; Department of Agriculture, Forest Service, Northeastern Research Station: Newton Square, PA, USA, 2002.
  13. Van Vliet, N.; Mertz, O.; Heinimann, A.; Langanke, T.; Pascual, U.; Schmook, B.; Adams, C.; Schmidt-Vogt, D.; Messerli, P.; Leisz, S.; et al. Trends, drivers and impacts of changes in swidden cultivation in tropical forest-agriculture frontiers: A global assessment. Glob. Environ. Chang. 2012, 22, 418–429. [Google Scholar] [CrossRef]
  14. Weng, Q. Land use change analysis in the Zhujiang Delta of China using satellite remote sensing, GIS and stochastic modelling. J. Environ. Manag. 2002, 64, 273–284. [Google Scholar] [CrossRef] [Green Version]
  15. Ziegler, A.D.; Phelps, J.; Yuen, J.Q.; Webb, E.L.; Lawrence, D.; Fox, J.M.; Bruun, T.B.; Leisz, S.J.; Ryan, C.M.; Dressler, W.; et al. Carbon outcomes of major land-cover transitions in SE Asia: Great uncertainties and REDD + policy implications. Glob. Chang. Biol. 2012, 18, 3087–3099. [Google Scholar] [CrossRef]
  16. Kennedy, R.E.; Andréfouët, S.; Cohen, W.B.; Gómez, C.; Griffiths, P.; Hais, M.; Healey, S.P.; Helmer, E.H.; Hostert, P.; Lyons, M.B.; et al. Bringing an ecological view of change to Landsat-based remote sensing. Front. Ecol. Environ. 2014, 12, 339–346. [Google Scholar] [CrossRef]
  17. Young, N.E.; Anderson, R.S.; Chignell, S.M.; Vorster, A.G.; Lawrence, R.; Evangelista, P.H. A survival guide to Landsat preprocessing. Ecology 2017, 98, 920–932. [Google Scholar] [CrossRef] [PubMed] [Green Version]
  18. Wulder, M.A.; Loveland, T.R.; Roy, D.P.; Crawford, C.J.; Masek, J.G.; Woodcock, C.E.; Allen, R.G.; Anderson, M.C.; Belward, A.S.; Cohen, W.B.; et al. Current status of Landsat program, science, and applications. Remote Sens. Environ. 2019, 225, 127–147. [Google Scholar] [CrossRef]
  19. Kennedy, R.E.; Yang, Z.; Gorelick, N.; Braaten, J.; Cavalcante, L.; Cohen, W.B.; Healey, S. Implementation of the LandTrendr Algorithm on Google Earth Engine. Remote Sens. 2018, 10, 691. [Google Scholar] [CrossRef] [Green Version]
  20. Zhu, Z.; Wulder, M.; Roy, D.P.; Woodcock, C.E.; Hansen, M.C.; Radeloff, V.C.; Healey, S.P.; Schaaf, C.; Hostert, P.; Strobl, P.; et al. Benefits of the free and open Landsat data policy. Remote Sens. Environ. 2019, 224, 382–385. [Google Scholar] [CrossRef]
  21. Woodcock, C.E.; Allen, R.; Anderson, M.; Belward, A.; Bindschadler, R.; Cohen, W.; Gao, F.; Goward, S.N.; Helder, D.; Helmer, E.; et al. Free Access to Landsat Imagery. Science 2008, 320, 1011. [Google Scholar] [CrossRef] [PubMed]
  22. Magliocca, N.R.; Rudel, T.K.; Verburg, P.H.; McConnell, W.J.; Mertz, O.; Gerstner, K.; Heinimann, A.; Ellis, E.C. Synthesis in land change science: Methodological patterns, challenges, and guidelines. Reg. Environ. Chang. 2014, 15, 211–226. [Google Scholar] [CrossRef] [Green Version]
  23. Lambin, E.; Geist, H.; Rindfuss, R. Introduction: Local Processes with Global Impact; Springer Science & Business Media: Berlin, Germany, 2006; pp. 1–8. [Google Scholar]
  24. Rindfuss, R.R.; Entwisle, B.; Walsh, S.J.; An, L.; Badenoch, N.; Brown, D.G.; Deadman, P.; Evans, T.P.; Fox, J.; Geoghegan, J.; et al. Land use change: Complexity and comparisons. J. Land Use Sci. 2008, 3, 1–10. [Google Scholar] [CrossRef] [Green Version]
  25. Preiser, R.; Biggs, R.; De Vos, A.; Folke, C. Social-ecological systems as complex adaptive systems: Organizing principles for advancing research methods and approaches. Ecol. Soc. 2018, 23. [Google Scholar] [CrossRef] [Green Version]
  26. Holling, C.S. Understanding the Complexity of Economic, Ecological, and Social Systems. Ecosystems 2001, 4, 390–405. [Google Scholar] [CrossRef]
  27. Folke, C.; Biggs, R.; Norström, A.V.; Reyers, B.; Rockström, J. Social-ecological resilience and biosphere-based sustainability science. Ecol. Soc. 2016, 21, art41. [Google Scholar] [CrossRef]
  28. Campbell, D.J.; Lusch, D.P.; Smucker, T.A.; Wangui, E.E. Multiple Methods in the Study of Driving Forces of Land Use and Land Cover Change: A Case Study of SE Kajiado District, Kenya. Hum. Ecol. 2005, 33, 763–794. [Google Scholar] [CrossRef]
  29. Nightingale, A.J. A Feminist in the Forest: Situated Knowledges and Mixing Methods in Natural Resource Management. ACME Int. J. Crit. Geogr. 2003, 2, 77–90. [Google Scholar]
  30. Hersperger, A.; Gennaio, M.-P.; Verburg, P.; Bürgi, M. Linking Land Change with Driving Forces and Actors: Four Conceptual Models. Ecol. Soc. 2010, 15. [Google Scholar] [CrossRef] [Green Version]
  31. Rueda, X.; Velez, M.A.; Moros, L.; Rodriguez, L.A. Beyond proximate and distal causes of land-use change: Linking Individual motivations to deforestation in rural contexts. Ecol. Soc. 2019, 24. [Google Scholar] [CrossRef] [Green Version]
  32. Bruno, J.E.; Fernandez-Gimenez, M.E.; Balgopal, M.M. An integrated livelihoods and well-being framework to understand northeastern Colorado ranchers’ adaptive strategies. Ecol. Soc. 2021, 26, 27. [Google Scholar] [CrossRef]
  33. ESRI. ArcGIS Desktop Release 10; Environmental Systems Research Institute: Redlands, CA, USA, 2011. [Google Scholar]
  34. Lauenroth, W.K.; Burke, I.C.; Morgan, J.A. The Shortgrass Steppe: The Region and Research Sites. In Ecology of the Shortgrass Steppe: A Long-Term Perspective; Lauenroth, W.K., Burke, I.C., Eds.; Oxford University Press: New York, NY, USA, 2008; pp. 3–8. [Google Scholar]
  35. Rosenberg, N.A.; Stucki, B.W. The Butz Stops Here: Why the Food Movement Needs to Rethink Agricultural History. J. Food Law Policy 2017, 13, 12–25. [Google Scholar]
  36. Barnett, B.J. The U.S. Farm Financial Crisis of the 1980s. Agric. Hist. 2000, 74, 366–380. [Google Scholar]
  37. Meyer, K.; Lobao, L. Economic hardship, religion and mental health during the midwestern farm crisis. J. Rural Stud. 2003, 19, 139–155. [Google Scholar] [CrossRef]
  38. Stubbs, M. Conservation Reserve Program (CRP): Status and Issues; Library of Congress, Congressional Research Service: Washington, DC, USA, 2014. [Google Scholar]
  39. USDA Farm Service Agency. Conservation Reserve Program Statistics. Available online: https://www.fsa.usda.gov/programs-and-services/conservation-programs/reports-and-statistics/conservation-reserve-program-statistics/index (accessed on 7 January 2021).
  40. Dimitri, C.; Effland, A.; Conklin, N. The 20th Century Transformation of U.S. Agriculture and Farm Policy; USDA Economic Research Service: Washington, DC, USA, 2005; Volume 3.
  41. Vias, A.C.; Carruthers, J.I. Regional Development and Land Use Change in the Rocky Mountain West, 1982–1997. Growth Chang. 2005, 36, 244–272. [Google Scholar] [CrossRef]
  42. Riebsame, W.E.; Gosnell, H.; Theobald, D.M. Land Use and Landscape Change in the Colorado Mountains I: Theory, Scale, and Pattern. Mt. Res. Dev. 1996, 16, 395–405. [Google Scholar] [CrossRef]
  43. Theobald, D.M.; Gosnell, H.; Riebsame, W.E. Land Use and Landscape Change in the Colorado Mountains II: A Case Study of the East River Valley. Mt. Res. Dev. 1996, 16, 407–418. [Google Scholar] [CrossRef]
  44. National Integrated Drought Information System. Drought in Colorado. Available online: https://www.drought.gov/drought/states/colorado (accessed on 1 January 2021).
  45. Larimer County Department of Natural Resources. Open Lands Master Plan: Larimer County; Department of Natural Resources: Larimer County, CO, USA, 2015. [Google Scholar]
  46. York, A.M.; Shrestha, M.; Boone, C.G.; Zhang, S.; Harrington, J.A.; Prebyl, T.J.; Swann, A.; Agar, M.; Antolin, M.F.; Nolen, B.; et al. Land fragmentation under rapid urbanization: A cross-site analysis of Southwestern cities. Urban Ecosyst. 2011, 14, 429–455. [Google Scholar] [CrossRef]
  47. Resnik, J.; Wallace, G.; Brunson, M.; Mitchell, J. Open Spaces, Working Places. Rangelands 2006, 28, 4–9. [Google Scholar] [CrossRef] [Green Version]
  48. Huntsinger, L.; Sayre, N.F. Introduction: The Working Landscapes Special Issue. Rangelands 2007, 29, 3–4. [Google Scholar] [CrossRef]
  49. U.S. Census Bureau. Census of Population and Housing. Available online: https://www.census.gov/prod/www/decennial.html (accessed on 31 December 2020).
  50. Davis, C. The Politics of “Fracking”: Regulating Natural Gas Drilling Practices in Colorado and Texas. Rev. Policy Res. 2012, 29, 177–191. [Google Scholar] [CrossRef]
  51. Weld County Government. Oil & Gas Leases-Bids and Tabulations. Available online: https://www.weldgov.com/departments/purchasing/oil_and_gas_leases-bids_tabulations (accessed on 2 January 2021).
  52. Johnson, R.B.; Onwuegbuzie, A.J.; Turner, L.A. Toward a Definition of Mixed Methods Research. J. Mix. Methods Res. 2007, 1, 112–133. [Google Scholar] [CrossRef]
  53. Gorelick, N.; Hancher, M.; Dixon, M.; Ilyushchenko, S.; Thau, D.; Moore, R. Google Earth Engine: Planetary-scale geospatial analysis for everyone. Remote Sens. Environ. 2017, 202, 18–27. [Google Scholar] [CrossRef]
  54. Van Rossum, G.; Drake, F.L. The Python Language Reference Manual; Python Software Foundation: Scotts Valley, CA, USA, 2011. [Google Scholar]
  55. Homer, C.; Dewitz, J.; Jin, S.; Xian, G.; Costello, C.; Danielson, P.; Gass, L.; Funk, M.; Wickham, J.; Stehman, S.; et al. Conterminous United States land cover change patterns 2001–2016 from the 2016 National Land Cover Database. ISPRS J. Photogramm. Remote Sens. 2020, 162, 184–199. [Google Scholar] [CrossRef]
  56. Breiman, L. Random Forests. Mach. Learn. 2001, 45, 5–32. [Google Scholar] [CrossRef] [Green Version]
  57. Gislason, P.O.; Benediktsson, J.A.; Sveinsson, J.R. Random Forests for land cover classification. Pattern Recognit. Lett. 2006, 27, 294–300. [Google Scholar] [CrossRef]
  58. Rodriguez-Galiano, V.F.; Ghimire, B.; Rogan, J.; Chica-Olmo, M.; Rigol-Sanchez, J.P. An assessment of the effectiveness of a random forest classifier for land-cover classification. ISPRS J. Photogramm. Remote Sens. 2012, 67, 93–104. [Google Scholar] [CrossRef]
  59. Young, N.E.; Evangelista, P.H.; Mengitsu, T.; Leisz, S. Twenty-three years of forest cover change in protected areas under different governance strategies: A case study from Ethiopia’s southern highlands. Land Use Policy 2020, 91, 104426. [Google Scholar] [CrossRef]
  60. Pedregosa, F.; Varoquaux, G.; Gramfort, A.; Michel, V.; Thirion, B.; Grisel, O.; Blondel, M.; Prettenhofer, P.; Weiss, R.; Dubourg, V.; et al. Scikit-Learn: Machine Learning in Python. J. Mach. Learn. Res. 2011, 12, 2825–2830. [Google Scholar]
  61. Bronshtein, A. Train/Test Split and Cross Validation in Python. Available online: https://towardsdatascience.com/train-test-split-and-cross-validation-in-python-80b61beca4b6 (accessed on 14 September 2020).
  62. Anderson, J.R.; Hardy, E.E.; Roach, J.Y.; Witmer, R.E. A Land Use and Land Cover Classification System for Use with Remote Sensor Data; U.S. Geological Survey: Washington, DC, USA, 1976.
  63. Laurikkala, J. Improving Identification of Difficult Small Classes by Balancing Class Distribution. In Conference on Artificial Intelligence in Medicine in Europe; Springer: Berlin/Heidelberg, Germany, 2001; pp. 63–66. [Google Scholar] [CrossRef] [Green Version]
  64. Lemaître, G.; Nogueira, F.; Aridas, C.K. Imbalanced-Learn: A Python Toolbox to Tackle the Curse of Imbalanced Datasets in Machine Learning. J. Mach. Learn. Res. 2017, 18, 559–563. [Google Scholar]
  65. Sasaki, Y. The Truth of the F-Measure. Available online: https://www.cs.odu.edu/~%7B%7Dmukka/ (accessed on 8 February 2021).
  66. Artstein, R.; Poesio, M. Inter-Coder Agreement for Computational Linguistics. Comput. Linguist. 2008, 34, 555–596. [Google Scholar] [CrossRef] [Green Version]
  67. Story, M.; Congalton, R.G. Accuracy Assessment: A User’s Perspective. Photogramm. Eng. Remote Sens. 1986, 52, 397–399. [Google Scholar]
  68. R Core Team. R: A Language and Environment for Statistical Computing; R Foundation for Statistical Computing: Vienna, Austria, 2019. [Google Scholar]
  69. Hijmans, R.J.; van Etten, J. Raster: Geographic Analysis and Modeling with Raster Data. R Package Version 2.0-12. 2012. Available online: http://cran.r-project.org/package=raster (accessed on 5 October 2021).
  70. Johnson, T.P. Snowball Sampling: Introduction. In Wiley StatsRef: Statistics Reference Online; Balakrishnan, N., Colton, T., Everitt, B., Piegorsch, W., Ruggeri, F., Teugels, J.L., Eds.; John Wiley & Sons, Ltd.: Hoboken, NJ, USA, 2014. [Google Scholar] [CrossRef]
  71. Huang, R. RQDA: R-Based Qualitative Data Analysis. R Package Version 0.2-7. 2014. Available online: http://rqda.r-forge.r-project.org/ (accessed on 5 October 2021).
  72. Braun, V.; Clarke, V. Thematic Analysis. In APA Handbook of Research Methods in Psychology, Vol. 2: Research Designs: Quantitative, Qualitative, Neuropsychological and Biological; Cooper, P.H., Camic, M., Long, D.L., Panter, A.T., Rindskopf, D., Sher, K.J., Eds.; American Psychological Association: Washington, DC, USA, 2012; pp. 57–71. [Google Scholar]
  73. Lincoln, Y.S.; Guba, E.G. But is it rigorous? Trustworthiness and authenticity in naturalistic evaluation. New Dir. Program Eval. 1986, 30, 73–84. [Google Scholar] [CrossRef]
  74. Landis, J.R.; Koch, G.G. The Measurement of Observer Agreement for Categorical Data. Biometrics 1977, 33, 159–174. [Google Scholar] [CrossRef] [Green Version]
  75. Hu, Q.; Xiang, M.; Chen, D.; Zhou, J.; Wu, W.; Song, Q. Global cropland intensification surpassed expansion between 2000 and 2010: A spatio-temporal analysis based on GlobeLand30. Sci. Total Environ. 2020, 746, 141035. [Google Scholar] [CrossRef] [PubMed]
  76. Cameron, D.R.; Marty, J.; Holland, R.F. Whither the Rangeland?: Protection and Conversion in California’s Rangeland Ecosystems. PLoS ONE 2014, 9, e103468. [Google Scholar] [CrossRef] [PubMed] [Green Version]
  77. Byrd, K.B.; Flint, L.E.; Alvarez, P.; Casey, C.F.; Sleeter, B.M.; Soulard, C.; Flint, A.L.; Sohl, T. Integrated climate and land use change scenarios for California rangeland ecosystem services: Wildlife habitat, soil carbon, and water supply. Landsc. Ecol. 2015, 30, 729–750. [Google Scholar] [CrossRef] [Green Version]
  78. Geist, H.; Lambin, E. Proximate Causes and Underlying Driving Forces of Tropical Deforestation. Bioscience 2002, 52, 143–150. [Google Scholar] [CrossRef]
  79. Geist, H.J.; Lambin, E.F. Dynamic Causal Patterns of Desertification. BioScience 2004, 54, 817–829. [Google Scholar] [CrossRef] [Green Version]
  80. Lim, C.L.; Prescott, G.W.; De Alban, J.D.T.; Ziegler, A.D.; Webb, E.L. Untangling the proximate causes and underlying drivers of deforestation and forest degradation in Myanmar. Conserv. Biol. 2017, 31, 1362–1372. [Google Scholar] [CrossRef] [Green Version]
  81. Brookshire, D.S.; Colby, B.; Ewers, M.; Ganderton, P.T. Market Prices for Water in the Semiarid West of the United States. Water Resour. Res. 2004, 40, 1–8. [Google Scholar] [CrossRef] [Green Version]
  82. Gosnell, H.; Travis, W. Ranchland Ownership Dynamics in the Rocky Mountain West. Rangel. Ecol. Manag. 2005, 58, 191–198. [Google Scholar] [CrossRef]
  83. Miller, J.R.; Joyce, L.A.; Knight, R.L.; King, R.M. Forest roads and landscape structure in the southern Rocky Mountains. Landsc. Ecol. 1996, 11, 115–127. [Google Scholar] [CrossRef]
  84. Knight, R.L.; Wallace, G.N.; Riebsame, W.E. Ranching the View: Subdivisions versus Agriculture. Conserv. Biol. 1995, 9, 459–461. [Google Scholar] [CrossRef]
  85. Mitchell, J.; Knight, R.; Camp, R. Landscape attributes of subdivided ranches. Rangelands 2002, 24, 3–9. [Google Scholar] [CrossRef]
  86. Wright, S. The Politicization of culture. Anthropol. Today 1998, 14, 7–15. [Google Scholar] [CrossRef]
  87. Mulcahy, K. Cultural Policy: Definitions and Theoretical Approaches. J. Arts Manag. 2006, 35, 319–330. [Google Scholar] [CrossRef]
  88. Smith, A.H.; Martin, W.E. Socioeconomic Behavior of Cattle Ranchers, with Implications for Rural Community Development in the West. Am. J. Agric. Econ. 1972, 54, 217–225. [Google Scholar] [CrossRef]
  89. Johnson, K.M.; Lichter, D.T. Rural Depopulation: Growth and Decline Processes over the Past Century. Rural Sociol. 2019, 84, 3–27. [Google Scholar] [CrossRef] [Green Version]
  90. Johnson, K.; Rathge, R. Agricultural Dependence and Changing Population in the Great Plains. In Population Change and Rural Society; Kandel, W., Brown, D., Eds.; Springer: Dordrecht, The Netherlands, 2006; pp. 197–217. [Google Scholar]
  91. Lu, M.; Paull, D. Assessing the Free Land Programs for Reversing Rural Depopulation. Great Plains Res. 2007, 17, 73–86. [Google Scholar]
  92. Nickels, C.; Day, F. Depopulation of the Rural Great Plains Counties of Texas. Great Plains Res. 1997, 7, 225–250. [Google Scholar]
  93. Saad, L. One in Four in U.S. Are Solidly Skeptical of Global Warming. Available online: https://news.gallup.com/poll/168620/one-four-solidly-skeptical-global-warming.aspx (accessed on 7 January 2021).
  94. Mitchell, J.E. The Rangelands of Colorado. Rangelands 1993, 15, 213–219. [Google Scholar]
  95. Vavra, M.; Laycock, W.; Pieper, R. Ecological Implications of Livestock Herbivory in the West; Society for Range Management: Denver, CO, USA, 1994. [Google Scholar]
  96. Dodd, M.; Lauenroth, W.; Burke, I.; Chapman, P. Associations between vegetation patterns and soil texture in the shortgrass steppe. Plant Ecol. 2002, 158, 127–137. [Google Scholar] [CrossRef]
  97. Sala, O.E.; Lauenroth, W.K.; Golluscio, R.A. Functional Types in Temperate Semi-Arid Regions. In Plant Functional Types; Smith, T.M., Shugart, H.H., Woodward, F.I., Eds.; Cambridge University Press: Cambridge, UK, 1997; pp. 217–233. [Google Scholar]
  98. Briske, D.D.; Fuhlendorf, S.D.; Smeins, F.E. State-and-Transition Models, Thresholds, and Rangeland Health: A Synthesis of Ecological Concepts and Perspectives. Rangel. Ecol. Manag. 2005, 58, 1–10. [Google Scholar] [CrossRef]
  99. Briske, D.; Fuhlendorf, S.; Smeins, F. A Unified Framework for Assessment and Application of Ecological Thresholds. Rangel. Ecol. Manag. 2006, 59, 225–236. [Google Scholar] [CrossRef]
  100. Donahue, D. The Western Range Revisited: Removing Livestock from Public Lands to Conserve Native Biodiversity; The University of Oklahoma Press: Norman, OK, 1999. [Google Scholar]
  101. Steinfeld, H.; Gerber, P.; Wassenaar, T.; Castel, V. Livestock’s Long Shadow: Environmental Issues and Options; Food and Agriculture Organization (FAO): Rome, Italy, 2006. [Google Scholar]
  102. Gerber, P.; Steinfeld, H.; Henderson, B.; Mottet, A.; Opio, C. Tackling Climate Change through Livestock: A Global Assessment of Emissions and Mitigation Opportunities; Food and Agriculture Organization of the United Nations (FAO): Rome, Italy, 2013. [Google Scholar]
  103. Holechek, J.L.; Galt, D.; Khumalo, G. Grazing and Grazing Exclusion Effects on New Mexico Shortgrass Prairie. Rangel. Ecol. Manag. 2006, 59, 655–659. [Google Scholar] [CrossRef]
  104. Milchunas, D.G.; Lauenroth, W.K.; Chapman, P.L.; Kazempour, M.K. Community attributes along a perturbation gradient in a shortgrass steppe. J. Veg. Sci. 1990, 1, 375–384. [Google Scholar] [CrossRef]
  105. Milchunas, D.G.; Lauenroth, W.K.; Burke, I.C.; Detling, J.K. Effects of Grazing on Vegetation. In Ecology of the Shortgrass Steppe: A Long-Term Perspective; Oxford University Press: New York, NY, USA, 2008; pp. 389–446. [Google Scholar]
  106. Porensky, L.M.; Derner, J.D.; Augustine, D.; Milchunas, D.G.; Porensky, L.M.; Derner, J.D.; Augustine, D.; Milchunas, D.G. Plant Community Composition After 75 Yr of Sustained Grazing Intensity Treatments in Shortgrass Steppe. Rangel. Ecol. Manag. 2017, 70, 456–464. [Google Scholar] [CrossRef]
  107. Knight, R.L. Ranchers as a Keystone Species in a West That Works. Rangelands 2007, 29, 4–9. [Google Scholar] [CrossRef] [Green Version]
  108. Leonard, S.H.; Gutmann, M.P. Land Use and Transfer Plans in the U.S. Great Plains. Great Plains Res. 2006, 16, 181–193. [Google Scholar]
  109. Burke, I.C.; Lauenroth, W.K.; Coffin, D.P. Soil Organic Matter Recovery in Semiarid Grasslands: Implications for the Conservation Reserve Program. Ecol. Appl. 1995, 5, 793–801. [Google Scholar] [CrossRef] [Green Version]
  110. Harner, J.; Benz, B. The Growth of Ranchettes. Prof. Geogr. 2013, 65, 329–344. [Google Scholar] [CrossRef]
  111. Brown, T.C. Trends in Water Market Activity and Price in the Western United States. Water Resour. Res. 2006, 42, 1–14. [Google Scholar] [CrossRef] [Green Version]
  112. Devine, B. Moving Waters: The Legacy of Buy-and-Dry and the Challenge of Lease-Fallowing in Colorado’s Arkansas River Basin; University of Colorado at Boulder: Boulder, CO, USA, 2015. [Google Scholar]
  113. Kennedy, C.; Brunson, M.W. Creating a Culture of Innovation in Ranching. Rangelands 2007, 29, 35–40. [Google Scholar] [CrossRef]
  114. Yung, L.; Freimund, W.A.; Belsky, J.M.; Patterson, M.; Gaul, K.; Burchfield, J. The Politics of Place: Understanding Meaning, Common Ground, and Political Difference on the Rocky Mountain Front. For. Sci. 2003, 49, 2003. [Google Scholar]
  115. Chapin, F.S.; Knapp, C. Sense of place: A process for identifying and negotiating potentially contested visions of sustainability. Environ. Sci. Policy 2015, 53, 38–46. [Google Scholar] [CrossRef] [Green Version]
  116. Fernandez-Gimenez, M.; Augustine, D.J.; Porensky, L.M.; Wilmer, H.; Derner, J.; Briske, D.D.; Stewart, M.O. Complexity fosters learning in collaborative adaptive management. Ecol. Soc. 2019, 24, 29. [Google Scholar] [CrossRef]
  117. Bruno, J.E. Linked Livelihoods, Land-Use, and Identities on Transitioning Landscapes in Northeastern Colorado: A Social-Ecological Study; Colorado State University: Fort Collins, CO, USA, 2021. [Google Scholar]
Figure 1. A land change conceptual model in which the interaction between change factors—underlying and direct—and ranchers’ adaptive strategies influence land-cover/use change (and vice versa) (adapted from Hersperger et al.’s [30]).
Land 10 01399 g001
Figure 2. The two adjacent study sites, one centered in northeastern (NE) Larimer County and the other in northcentral (NC) Weld County, Colorado [33]. Randomly positioned points fall within the area of the interviews, and the circles indicate the area analyzed for land-cover, 922,505 acres (1441 square miles) and 847,548 acres (1324 square miles) in the NE Larimer and NC Weld County sites, respectively.
Land 10 01399 g002
Figure 3. The multi-method research process to examine social–ecological land change in northeastern Colorado.
Land 10 01399 g003
Figure 4. (a,b). Three-year medians of the proportions (%) of the total land area of cover classes—cultivated (i.e., planted vegetation), developed (i.e., human-constructed materials), herbaceous (i.e., grasslands), and shrubland (i.e., shrubs)—graphed along with critical events in northeastern Colorado in the (a) northeastern Larimer County, Colorado study site (922,505 acres) and the (b) northcentral Weld County, Colorado study site (847,548 acres) [62] from 1984–2019.
Land 10 01399 g004
Figure 8. Social–ecological rangeland change model. The model captures how forces of change—underlying and direct forces of change in dark and light blue, respectively—and ranchers’ adaptive strategies around land-use (depicted in orange) (outlined in detail in Bruno et al. [32]) interact to affect land-cover/use change (depicted in gray) in northeastern Colorado. The dashed arrows indicate ranchers’ limited influence on the land change outcomes.
Land 10 01399 g008
Table 1. The codes and full names for the six spectral bands and eight derived bands [19].
CodeName
NBRNormalized Burn Ratio
NDVINormalized Difference Vegetation Index
NDSINormalized Different Snow Index
NDMINormalized Difference Moisture Index
TCBTasseled-Cap Brightness
TCGTasseled-Cap Greenness
TCWTasseled-Cap Wetness
TCATasseled-Cap Angle
B1Thematic Mapper-equivalent Band 1
B2Thematic Mapper-equivalent Band 2
B3Thematic Mapper-equivalent Band 3
B4Thematic Mapper-equivalent Band 4
B5Thematic Mapper-equivalent Band 5
B7Thematic Mapper-equivalent Band 7
Table 2. The class-wise F1-scores of the land-cover/use classification on the dataset (i.e., the bounds of the combined 50-mile buffers around each study community).
Land-Cover/Use ClassF1-Score
Water0.83
Developed *0.49
Barren0.57
Forest0.93
Shrubland *0.68
Herbaceous/grassland *0.86
Cultivated *0.76
* indicates classes that the analysis focuses on.
Table 3. Cohen’s kappa scores for the classifier’s agreement with the National Land Cover Database (NLCD) classifications for the two study sites by year (i.e., the two 20-mile buffers around the study communities).
YearWeld SiteLarimer Site
20010.660.65
20040.690.65
20060.640.61
20080.620.66
20110.720.69
20130.670.63
20160.700.64
Publisher’s Note: MDPI stays neutral with regard to jurisdictional claims in published maps and institutional affiliations.

