Article

Identification of Regional Drought Processes in North China Using MCI Analysis

1
Chinese Academy of Meteorological Sciences, Beijing 100081, China
2
National Climate Centre, China Meteorological Administration (CMA), Beijing 100081, China
3
Public Meteorological Service Center, China Meteorological Administration (CMA), Beijing 100081, China
4
China Meteorological Administration Training Centre, Beijing 100081, China
*
Author to whom correspondence should be addressed.
Land 2021, 10(12), 1390; https://doi.org/10.3390/land10121390
Submission received: 13 November 2021 / Revised: 10 December 2021 / Accepted: 13 December 2021 / Published: 15 December 2021

Abstract

:
Comprehensive identification of drought events is of great significance for monitoring and evaluating drought processes. Based on the date of daily precipitation, temperature and drought-affected area of 403 meteorological stations in North China from 1960 to 2019, the Comprehensive Drought Process Intensity Index (CDPII) has been developed by using the Meteorological-drought Composite Index (MCI) and regional drought process identification method, as well as the EIDR theory method. The regional drought processes in the past 60 years in North China, including Beijing, Tianjin, Hebei, Shanxi and Middle Inner Mongolia, were analyzed and identified. The result shows that the distribution characteristic of droughts with different intensities is as follows: The number of days of all annual-average mild droughts, moderate droughts and severe droughts was highest in Tianjin and that of extreme droughts was highest in Shanxi. The number of days of mild droughts was highest in May and lowest in January. The number of days of moderate droughts was highest in June. The number of days with mild and moderate drought showed an overall increasing trend, while the number of days with severe drought and above showed an overall decreasing trend (through a 95% significance test). The number of drought days was the highest in the 1990s. The annual frequency of drought is between 66.7% and 86.7%; the drought frequency in Hebei is the highest at 86.7%, followed by Beijing at 80%. There were 75 regional drought processes in North China from 1960 to 2019, and the correlation coefficient between process intensity and the drought-affected area was 0.55, which passed the 99% significance test. The comprehensive intensity of drought process from 27 April to 1 September 1972 was the strongest. From 18 May to 31 October 1965, the drought lasted 167 days. The overall drought intensity had a slight weakening trend in the past 60 years. A total of 75 regional drought processes occurred in North China, and the process intensity showed a trend of wavy decline with a determination coefficient (R2) of 0.079 (95% significance test). Overall, the regional drought process identification method and strength assessment result tally with the drought disaster, which can better identify the regional drought process. Furthermore, including the last days, the average intensity, average scope comprehensive strength, there are many angles to monitor and evaluate the drought and drought process. These provide a reference for drought control and decision-making.

1. Introduction

‘Drought means the naturally occurring phenomenon that exists when precipitation has been significantly below normal recorded levels, causing serious hydrological imbalances that adversely affect land resource production systems’ [1]. Under the influence of global warming and human activities, the frequent occurrence of drought has become one of the most severe environmental problems globally, which has attracted great attention of the international community and motivated many studies by scholars from various countries [2,3,4,5,6,7,8,9,10,11,12]. The North China Plain is an important grain, cotton and oil production base in China. It mainly focuses on dry farming (Figure 1a). It is one of the areas where drought disasters occur most frequently. Accurate monitoring and evaluation of drought intensity in North China can provide decision support for preventing and mitigating drought disasters.
In recent years, attention has been paid to the impact of warming on the occurrence and development of drought and drought trends. It has been revealed that the intensity of drought caused by warming has increased on the global and regional scales. A large number of facts show that with the background of warming, a single analysis of precipitation change is not enough to explain the scope and intensity of drought. Especially with the climatic background of decreasing precipitation and increasing temperature, warming has become one of the important factors aggravating the drought process. Therefore, the objective characterization of drought needs to integrate the joint influence of meteorological factors such as precipitation and temperature changes. As an important indicator and means to quantitatively assess drought, the drought index plays an important role in drought monitoring and forecasting. Scholars worldwide have developed a series of drought indexes by using meteorological and hydrological factors and have carried out a considerable amount of research and experimental work. Meteorological drought indexes widely used and studied in China mainly include the percentage of precipitation anomaly (Pa) [13,14], Palmer Drought Severity Index (PDSI) [15,16], Standardized Precipitation Index (SPI) [17,18], Precipitation Z index [19], Relative Moisture Index (MI) [20,21], Composite Index of meteorological drought (CI) and Standardized Precipitation Evapotranspiration Index (SPEI) [22]. These studies have laid a foundation for theoretical and practical reference.
However, the above methods have their limitations. For example, the PDSI is mainly applicable for arid and semi-arid areas, and there are subjective factors in the definition of drought level, which may lag several months when judging extreme drought [23]. The Z-index and SPI-index are drought indexes completely dependent on precipitation, which are calculated by probability density function and then standardized. However, the index only reflects the impact of precipitation on drought at a certain scale (such as short-scale 1 month, meso-scale 3 months and long-scale 6 months) and does not comprehensively consider the impact of different scales of early drought on later droughts. Tsakiris and Vangelis (2005) [24] put forward the drought monitoring index (RDI). Although the RDI is a stable drought intensity evaluation index and not a drought evaluation method relying solely on potential evapotranspiration (PET), it is necessary to avoid using inappropriate PET estimation method in individual areas [25]. The CI reflects well the frequency distribution of drought in different regions of China and the seasonal characteristics of different grades of drought. However, the CI is too sensitive to the precipitation process in real-time daily drought monitoring. The degree of drought often increases discontinuously, and severe droughts with long-duration tend to be underestimated [26]. In view of the problems of the CI, the National Climate Center of China Meteorological Administration has developed a new meteorological drought composite index (MCI). Compared with the CI, the MCI comprehensively considers factors. For example, a longer time scale and precipitation weights in different periods. The MCI performs better in drought monitoring than the CI [27]. Liao Yaoming et al., (2017) [28] studied the temporal and spatial distribution and disaster development characteristics of drought in China based on the MCI, which improved the operational ability of drought disaster identification. Drought events not only have a certain intensity but also characteristics of duration and scope of influence. Comprehensively identifying or characterizing regional drought events from intensity, time and scope based on the drought index above is of great significance to the monitoring and evaluation of the regional drought process [29]. Ren et al., (2012) [30] developed an objective identification technique for regional extreme events (OITREE), which can better identify regional meteorological drought events [10]. Many studies based on this method have promoted the development of technology of regional meteorological drought event identification and assessment in China [12,31,32]. However, when it is applied to small areas, such as North China and Hebei Province, it is difficult to objectively determine the parameters such as the distance between adjacent monitoring stations, the drought coincidence rate and the component weight of comprehensive intensity.
The North China Plain is located in the temperate monsoon climate area, which is significantly affected by the monsoon. With the background of global climate change, from 1960 to 2019, the annual precipitation in North China generally showed a decreasing trend (Figure 2a), the average temperature showed an obvious upward trend (Figure 2b) and drought disasters occurred frequently. In recent years, studies on drought in North China have attracted much attention [33,34]. Since the late 1970s, other regions have been suffering from continuous drought [8,35], and the frequency of droughts classified as severe or above has reached 21.7% [26,36]. The frequent occurrence of cut-off events of some major rivers not only aggravates the contradiction between supply and demand of water resources in the basin but also has a serious impact on the ecology and environment [37,38]. Although the drought events in North China have received some attention, research from the perspective of the comprehensive intensity of the regional drought process is rarely involved. Objectively identifying the process of regional drought and assessing its intensity is the basis for accurately monitoring and assessing the impact of drought [12], which will also further promote the prediction and research of regional drought events with the background of climate change. Based on the theory of the extreme intensity with both the duration and the region (EIDR) proposed by Lu et al., (2017) [39], the National Climate Center of China Meteorological Administration improved the method to calculate the comprehensive intensity index of the objective identification technology of regional extreme events (OITREE). Fixed and moving regional drought process identification technologies have been constructed [40]. Based on the MCI operationally used in China’s meteorological drought monitoring, the identification technology of the fixed regional drought process and the comprehensive intensity method of the regional drought process based on EIDR theory are used to identify the regional drought process in North China. The drought process was analyzed from the perspectives of the duration and intensity of mild, moderate, severe and extreme droughts. New patterns of temporal and spatial variation in drought events in North China with the background of global warming were obtained, in order to provide more scientific references for government departments to prevent drought.

2. Materials and Methods

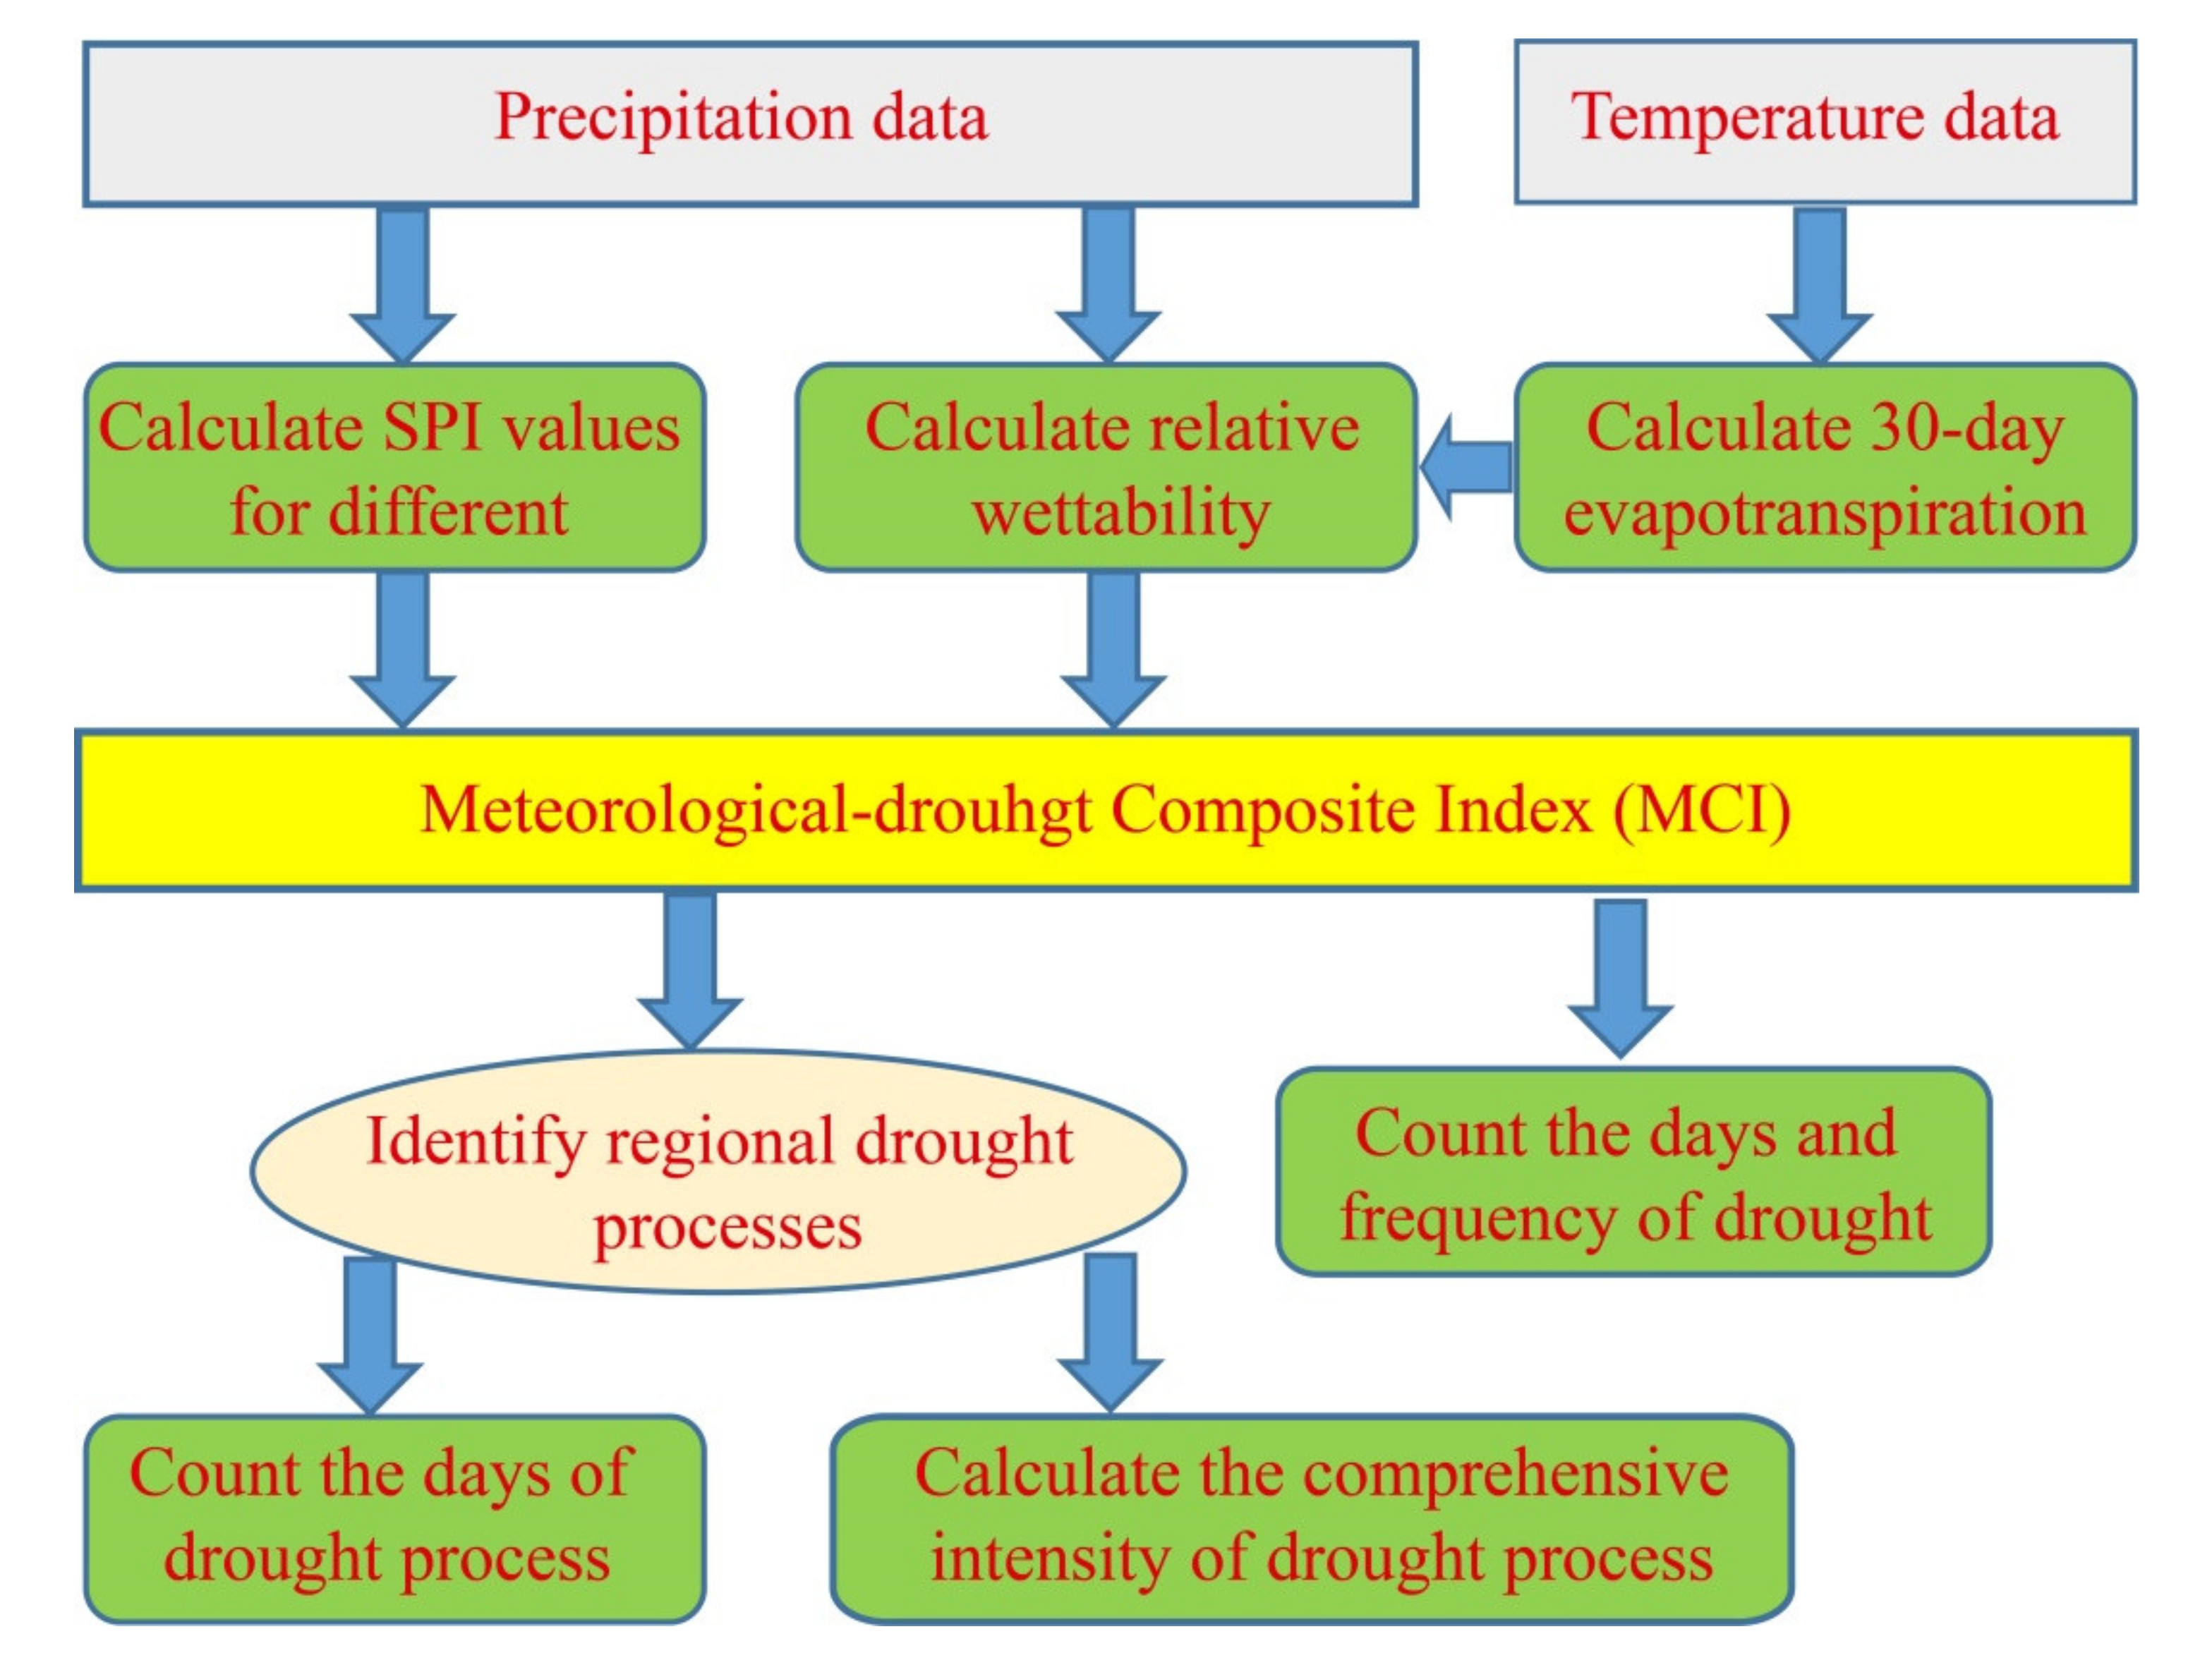
2.1. Method Steps to Follow

Firstly, the SPI of different scales was calculated according to the precipitation data, and the 30-day evapotranspiration was calculated by using the temperature data. At the same time, the relative moisture was calculated by using precipitation data and 30-day evapotranspiration. Then, the MCI was generated by the SPI value and relative moisture. Next, the MCI was used to identify the regional drought process, and the number of days and frequency of drought were counted. Finally, the regional drought process was used to calculate the days of drought process and count the comprehensive intensity of drought process (Figure 3).
The method adopted in this study has been applied in China’s national and provincial drought monitoring business since 2012, and it has achieved good results through years of application tests.
In large-scale regions with complex meteorological conditions and topography all over the world, droughts usually have significant differences in frequency and intensity. Whether the method used in this article to identify and evaluate regional drought process, including how to select drought index and build the comprehensive intensity index, is applicable to other regions or not, it is necessary to continuously optimize the identification and evaluation method of the regional drought process according to specific regions and time scales in practical business applications, so as to make more accurate and objective judgments on regional drought process.

2.2. Application of Identification and Evaluation Techniques of Regional Drought Process in China

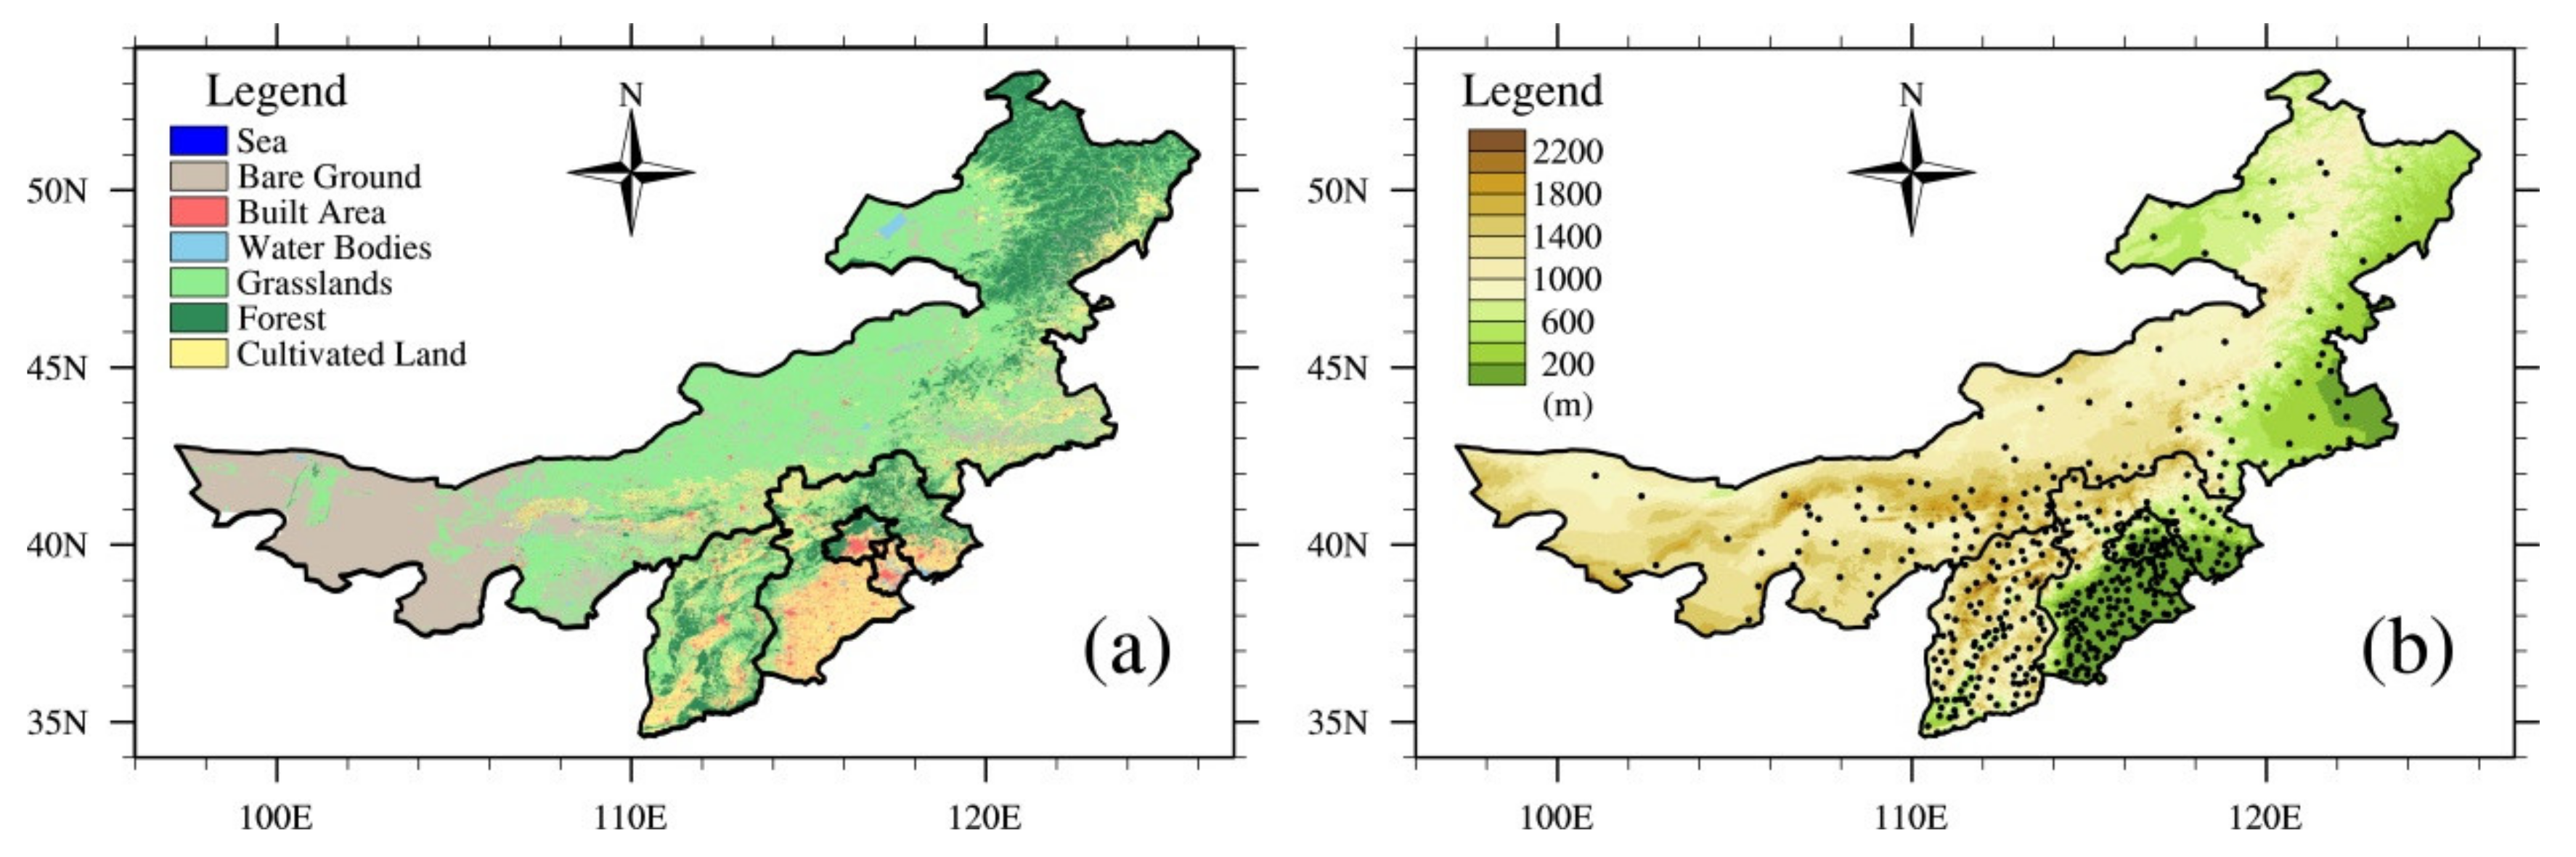
2.2.1. Data Description

Beijing, Tianjin, Hebei, Shanxi and the whole Inner Mongolia Autonomous Region (Inner Mongolia for short) were selected as the research areas of North China (Figure 1)
The daily precipitation, average temperature, maximum temperature, minimum temperature and other data of 403 national ground observation sites in North China from 1960 to 2019 were selected (data from the National Meteorological Information Center of China Meteorological Administration, http://data.cma.cn/ (accessed on 5 December 2021)). The data were quality controlled to meet the research needs. The data on drought-affected areas from 1971 to 2019 are from the National Bureau of Statistics of China (http://www.stats.gov.cn/tjsj/) (accessed on 5 December 2021).

2.2.2. Regional Drought Processes

The identification and evaluation methods of regional drought processes mainly refer to the meteorological industry standard ‘Methods for Monitoring and Assessment of Regional Drought Processes’ [40].
The MCI currently used in China’s real-time meteorological drought monitoring business was adopted as the drought index. The index considers the comprehensive effects of effective precipitation within 60 days, evapotranspiration within 30 days and precipitation within 90 and 150 days. According to the latest national standard meteorological drought grade [41] revised by the National Climate Center of China Meteorological Administration, the daily MCI of each station in North China from 1960 to 2019 was calculated, and the specific calculation formula is as follows:
M C I = K a × a × S P I W 60 + b × M I 30 + c × S P I 90 + d × S P I 150
where S P I W 60 is the standardized weighted precipitation index in the last 60 days; M I 30 is the relative moisture index in the last 30 days; S P I 90 and S P I 150 are the standardized precipitation index in the last 90 days and nearly 150 days, respectively; K a is the seasonal adjustment coefficient, which is determined according to the sensitivity of the growth and development stages of main crops to soil moisture in different seasons and a. b, c and d are the weight coefficients. The values in Northern China are 0.3, 0.5, 0.3 and 0.2, and those in Southern China are 0.5, 0.6, 0.2 and 0.1 [41].
The number of drought days counted in this study includes four categories: mild drought and above (referred to as mild drought), moderate drought and above (referred to as moderate drought), severe drought and above (referred to as severe drought) and extreme drought (Table 1). Seasonal division was as follows: spring (March to May), summer (June to August), autumn (September to November), winter (December to February of the next year).

2.2.3. Regional Daily Drought Intensity

When the average drought intensity of a monitoring station in a fixed area on a certain day is mild drought or above and at least one station has a drought intensity level of moderate drought or above, it is considered that a regional drought has occurred on that day. The regional daily drought intensity I d is calculated according to Equation (2):
I d = 1 L i = 1 j I i  
where L is the number of total stations in the region; j is the number of stations with drought grade of mild drought or above in the region and I i is the drought index M C I i of the station in the i-th region with drought grade of mild drought or above.

2.2.4. Determination of Drought Process

When the regional daily drought intensity I d reached the grade of mild drought or above, lasted for 15 days or more and the maximum daily drought intensity reached the grade of moderate drought or above, a regional drought process was considered to have occurred.
The date when the first mild drought occurred in the regional drought process was the beginning day of drought. After the occurrence of the drought process, when the drought grade was no drought for 5 consecutive days, the regional drought process ended, and the last day before the end of the drought process when the meteorological drought grade reached mild drought or above was the end date.
The total number of days from the beginning date to the end date (including the end date) of a regional drought process is the number of drought process days.

2.2.5. Regional Cumulative Drought Intensity

Regional cumulative drought intensity is the combination of regional daily drought intensity and duration, calculated according to Equation (3)
D n = n α 1 ε = 1 n I d ε
where D n is the regional cumulative drought intensity; n is the number of days in the regional drought process and I d ε is the absolute value of the regional daily drought intensity on the ε-th day in the drought process, calculated according to Equation (2). α is the weight coefficient, between 0.5 and 1.0 though usually 0.5 is more appropriate.

2.2.6. Intensity of Regional Drought Process

The regional cumulative drought intensity was calculated by the continuous drought days in the sliding regional drought process, and the strongest cumulative drought intensity in the regional drought process was taken as the regional drought process intensity (z). Equation (4) was used for calculation:
Z = m a x k = 1 , m ; n = 1 , k D n  
where m a x k = 1 , m ; n = 1 , k ( ) determines the drought day k 1 k m in a certain period through continuous sliding comparison. n 1 n k , m is the total number of days in the regional drought process; n is the duration of drought in the regional drought process, 1 n m and D n is the regional cumulative drought intensity, which is calculated according to Equation (3).

2.3. Frequency of Drought

In the last 60 years, statistics are available for the years when at least one drought process of mild drought or above occurred in North China, and the frequency of drought is calculated by Equation (5):
P = y Y × 100 %    
where y is the actual number of years in which drought process occurs and Y is the number of data chronological series. The data series used to calculate MCI and drought process in this study are from 1960 to 2019, so Y is 60.

3. Result

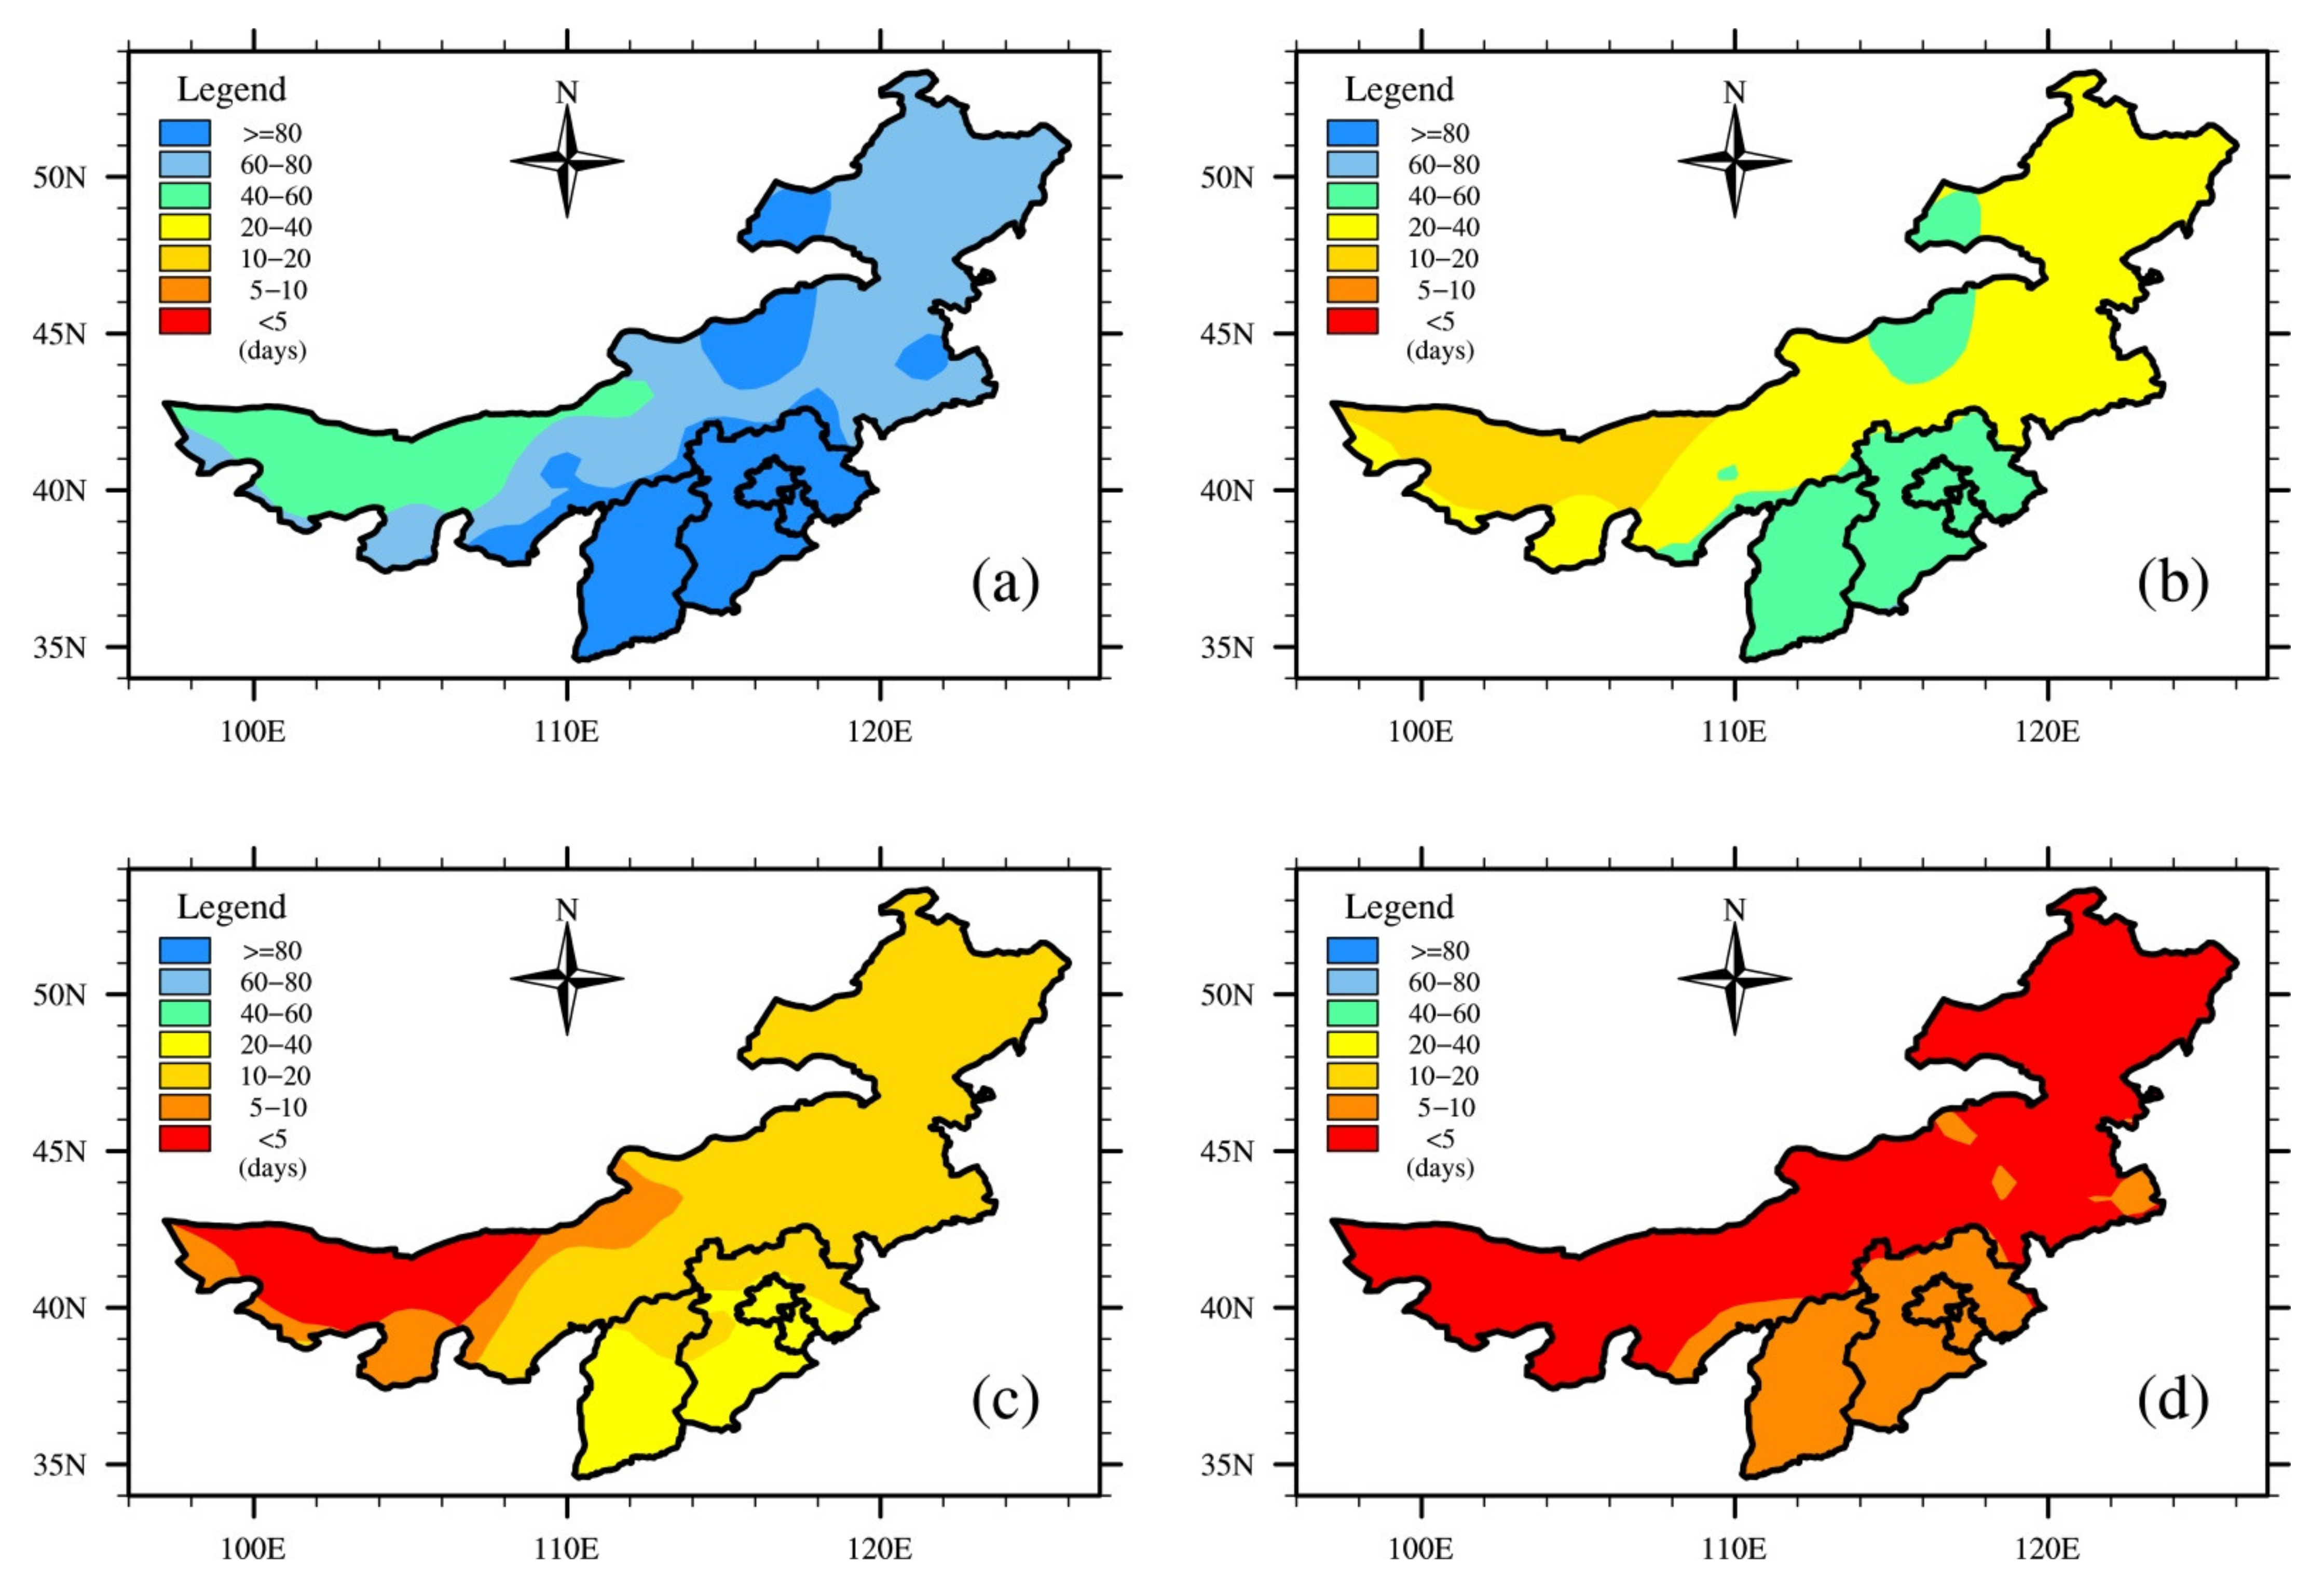
3.1. Spatial and Temporal Characteristics of Drought Days with Different Intensity

Figure 3 shows the spatial distribution of mild drought, moderate drought, severe drought and extreme drought days in North China from 1960 to 2019. Among the four types of drought, for mild drought, Tianjin, Southern Beijing and Southeastern Hebei have more drought days, generally more than 60 days, while Inner Mongolia has relatively fewer drought days, generally between 20 and 40 days (Figure 4a). For moderate drought, Beijing, Tianjin, Shanxi, most of Hebei and the east and northwest of Inner Mongolia have relatively more moderate drought days, generally between 20–40 days, while the west and northeast of Inner Mongolia have relatively few moderate drought days. The average number of days is 10–20 days (Figure 4b). For severe drought, the high value areas of drought days in North China are mainly distributed in Beijing, Tianjin, Shanxi, Central and Southern Hebei and the middle east and northwest of Inner Mongolia, generally more than 10–20 days, while the drought days in Northeast Hebei and central, western, northeast and southern parts of Inner Mongolia are 5–10 days and fewer than 5 days in western Inner Mongolia (Figure 4c). For extreme drought, Beijing, Tianjin, most parts of Hebei and most parts of Shanxi have more extreme drought days, generally 5–10 days, while the drought days in Inner Mongolia are relatively few, generally fewer than 5 days (Figure 4d).

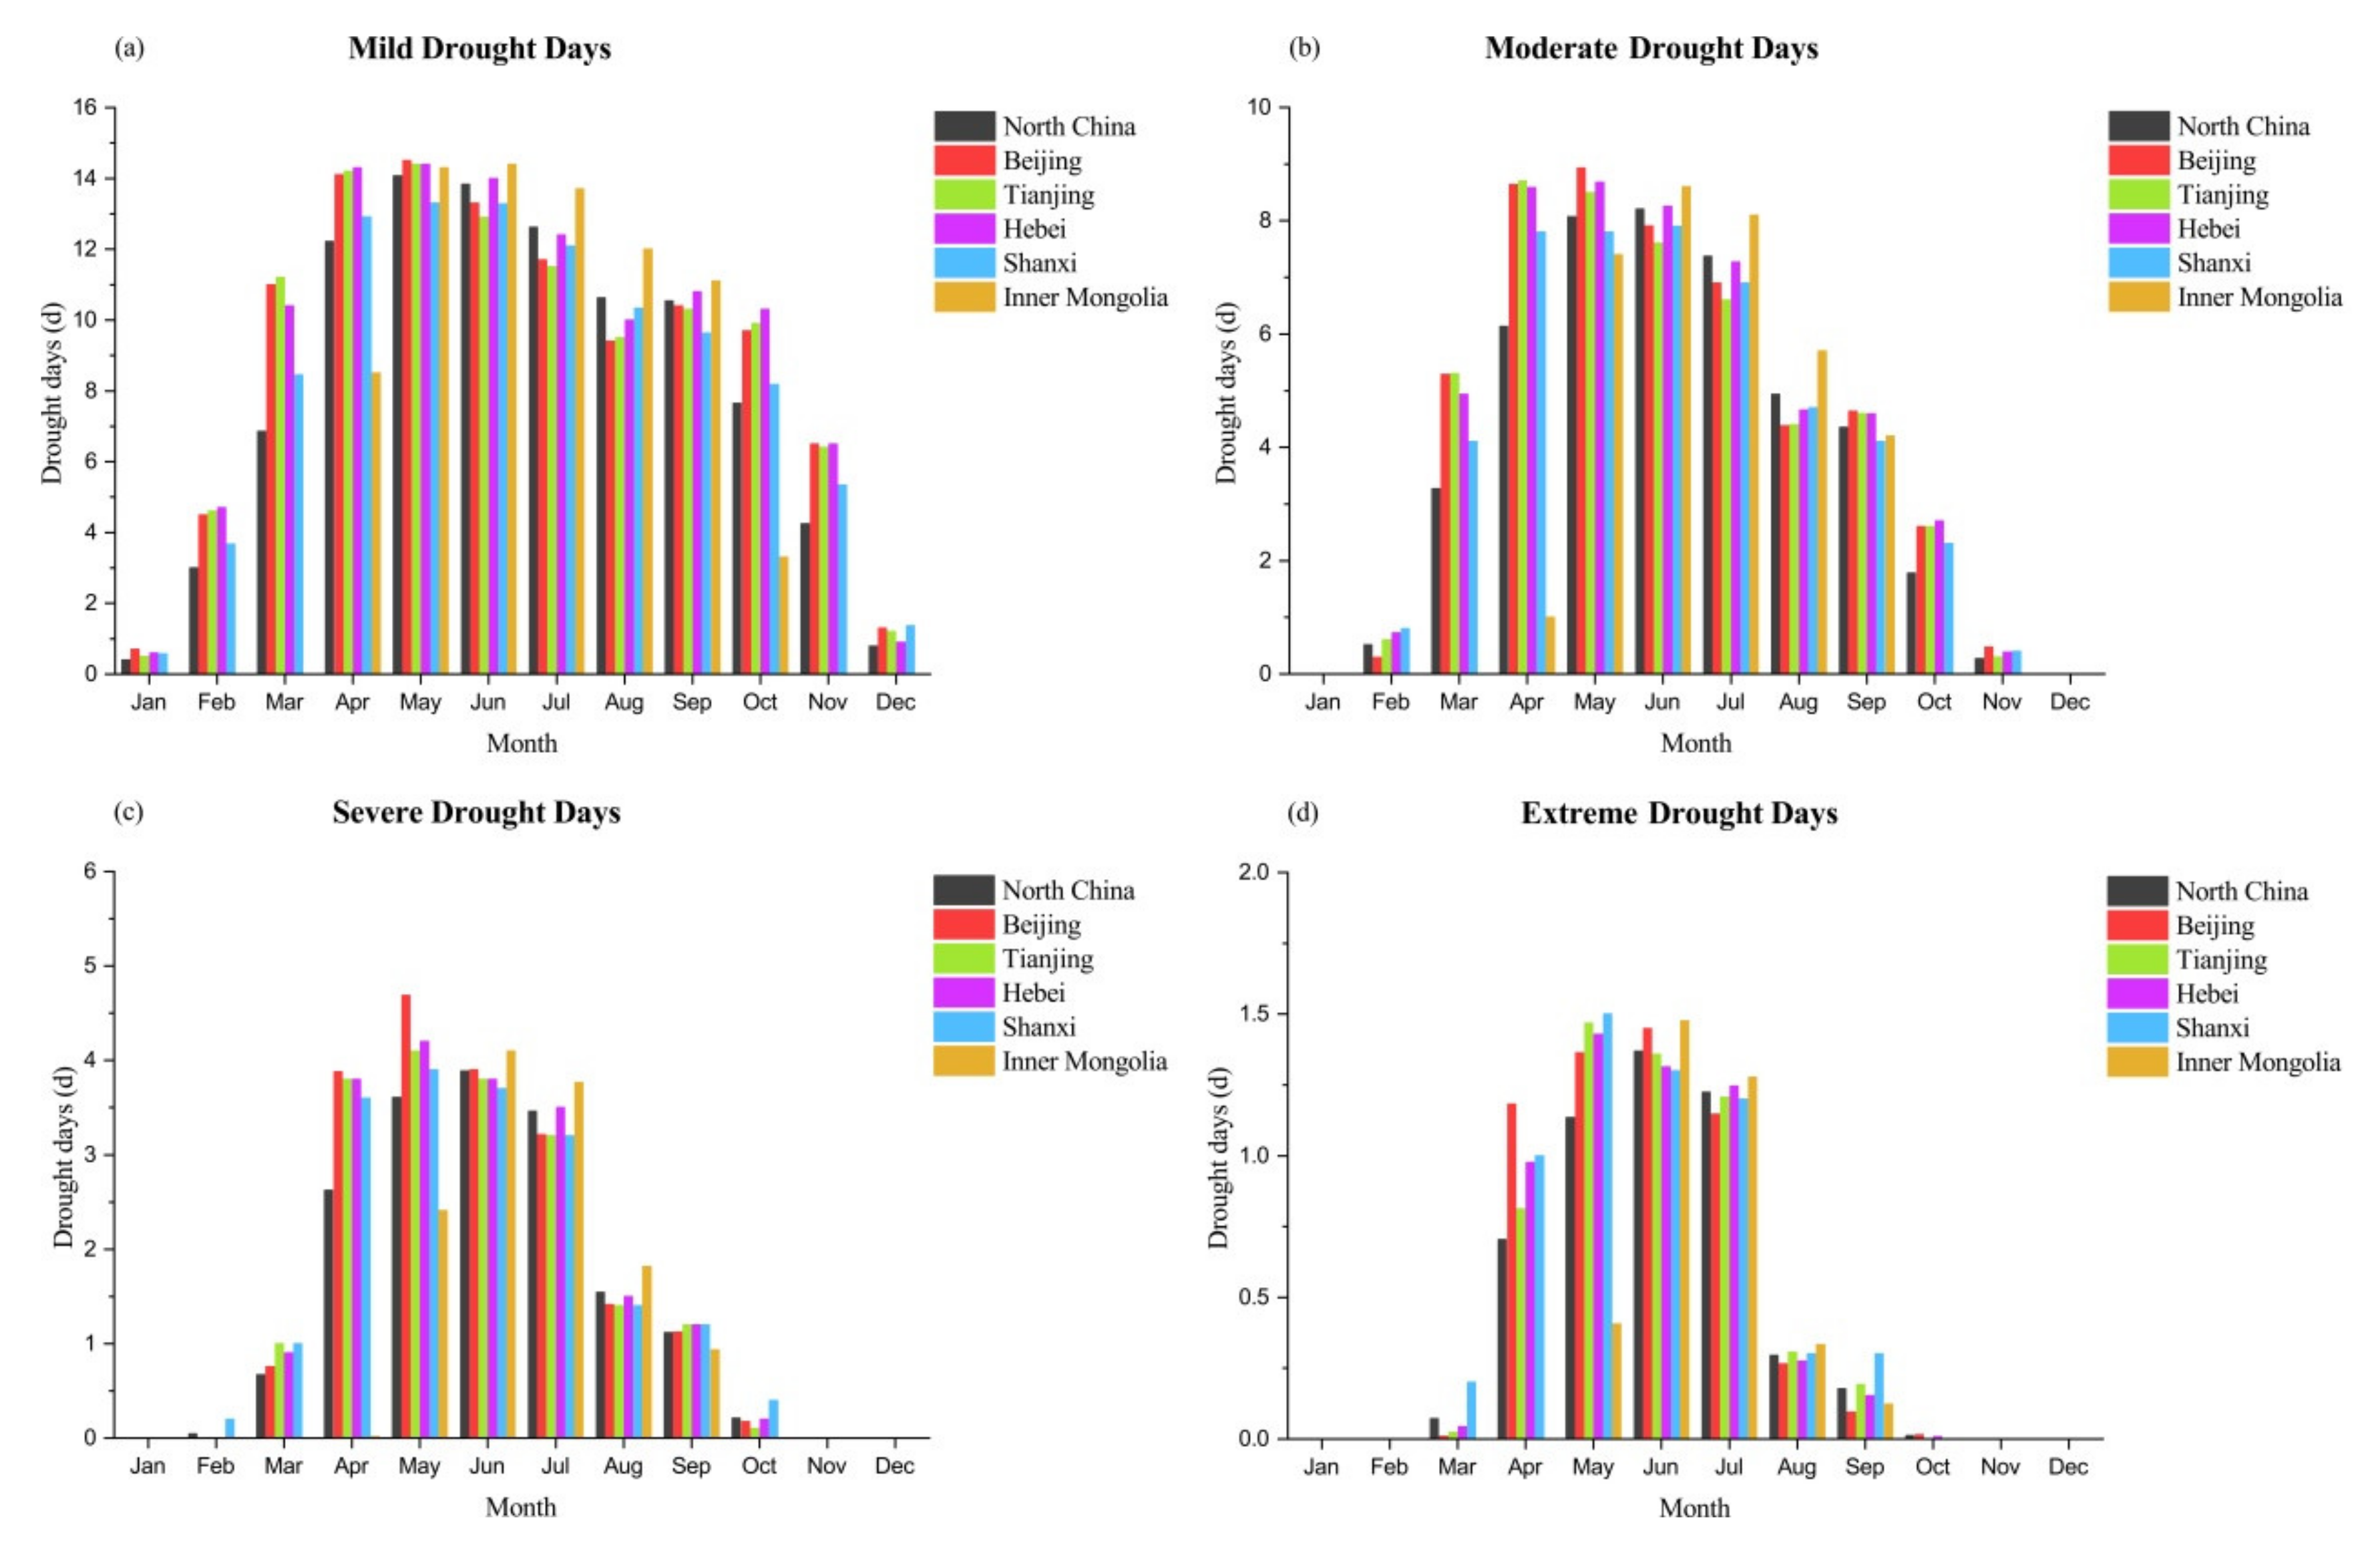
3.2. Monthly Distribution Characteristics

Figure 5a–d shows the monthly distribution of the frequency of meteorological drought events in North China. Except for Inner Mongolia, the monthly distribution characteristics of the whole of North China and its mild drought days in Beijing, Hebei, Tianjin and Shanxi are not very different. The monthly average maximum mild drought days are concentrated in May, ranging from 13 to 15 days, Beijing has a relatively higher number of mild drought days. The reason for this distribution may be that the temperature in North China increased in May, resulting in a large amount of water evaporation on the surface. At this time, the rain belt had not yet reached North China and there was no water supply. The river is also in the dry season. Except for Inner Mongolia, mild drought occurred every month. There was no mild drought in Inner Mongolia from November to March of the following year. This may be related to the local surface vegetation, climate and environmental factors, etc. The changing trend of monthly mild drought days in North China and its provinces are similar, all of which are single peak types. North China and Inner Mongolia as a whole showed a slight increase trend, while others showed a slight decrease trend, which passed the 95% significance test. In North China, the monthly maximum drought days for moderate drought, severe drought and extreme drought all occurred in June (8.2, 3.9 and 1.4 days); the number of mid drought, severe drought and extreme drought days from April to July was relatively large. These findings are basically consistent with the research results of An et al., (2014) [33].

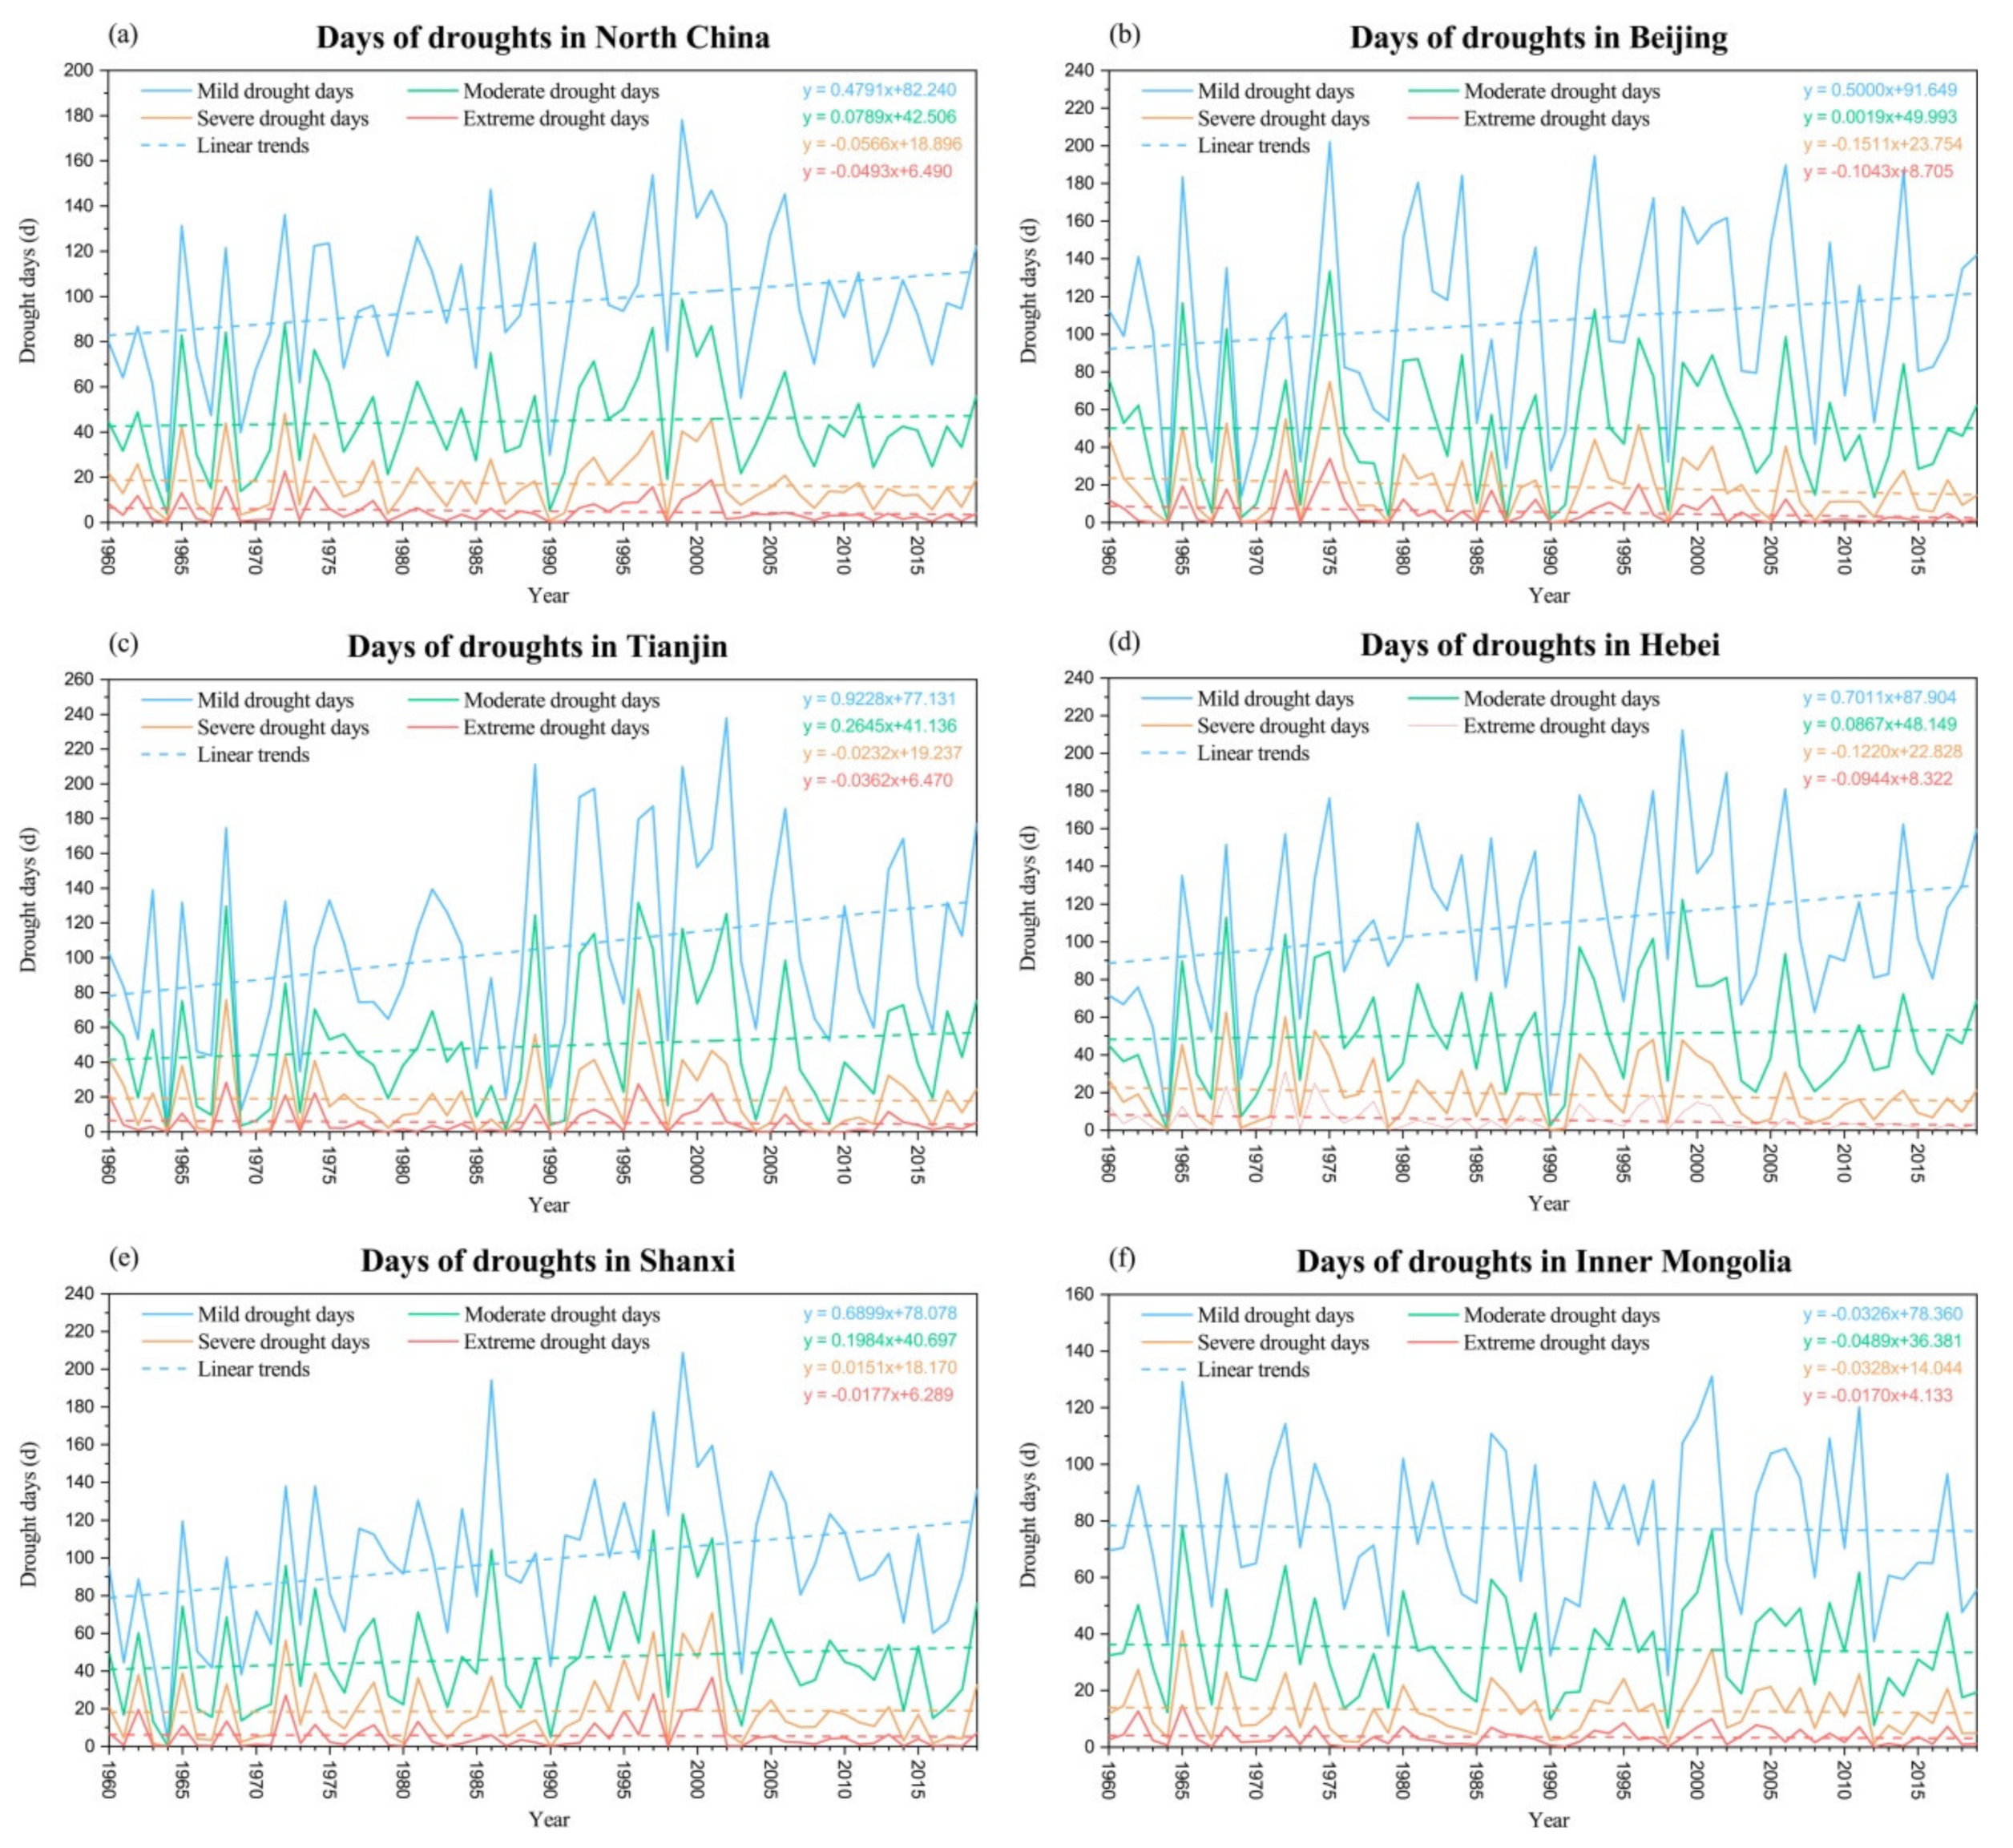
3.3. Drought Days and Linear Change Trend

In the last 60 years, due to the influence of climate change, the average annual days of mild drought and moderate drought in North China generally showed a slight upward trend (Figure 6a), and the linear change trends were 0.4791 and 0.0789 d × a−1, respectively. The linear change trend of mild drought was slightly larger than that of moderate drought (through a 95% significance test). This is close to the trend of temperature change in North China [42]. The days of severe drought and extreme drought generally showed a slight downward trend, and the linear change trends were −0.0566 and −0.0493 d × a−1, respectively, with little difference (through a 95% confident test), which was mainly influenced by the increase in precipitation in North China in recent years. The highest number of drought days of mild drought and moderate drought occurred in 1999 (178.0 and 98.7 days) and the lowest in 1964 (13.7 and 3.9 days, respectively). The maximum number of days of severe drought and extreme drought occurred in 1972 (48.2 and 22.5 days, respectively), and the minimum number of days of extreme drought occurred in 1990 and 1964 (0.7 and 0.1 days, respectively).
From 1960 to 2019, the average annual drought days of mild drought, moderate drought, severe drought and extreme drought in various regions of North China were more than 77.4, 34.9, 13.0 and 3.6 days, respectively (Figure 6). Heibei had the highest number of mild and extreme drought days (109.3 and 5.8 days, respectively). Beijing had the highest number of moderate and severe drought days (50.8 and 19.1 days, respectively). Inner Mongolia had the fewest mild, moderate, severe and extreme drought days (77.4, 34.9, 13.04 and 3.6 days, respectively). The year with the highest number of mild drought, moderate drought, severe drought and extreme drought days in Beijing was 1975 (202.1, 133.4, 74.65 and 34.0 days, respectively). The year with the highest number of mild drought days in Tianjin was 2002 (237.9 days), the year with the highest number of moderate and severe drought days was 1996 (131.6 and 82.1 days), and the year with the highest number of extreme drought days was 1968 (28.4 days). The year with the highest number of mild and moderate drought days in Hebei was 1999 (212.2 and 122.3 days), the year with the highest number of severe drought days was 1968 (62.6 days) and the year with the highest number of extreme drought days was 1972 (31.2 days). The year with the highest number of mild and moderate drought days in Shanxi was also 1999 (208.6 and 123.1 days), the year with the highest number of severe drought days was 2001 (70.8 days) and the year with the highest number of extreme drought days was 2001 (36.5 days). In Inner Mongolia, the year with the highest number of mild drought days was 2001 (131.1 days), and the year with the highest number of moderate drought, severe drought and extreme drought days was 1965 (78.0, 41.1 and 14.7 days).
The days of mild and moderate droughts in Beijing, Tianjin and Hebei showed a slight upward trend, with linear trends of 0.5 and 0.0019 (Beijing), 0.09228 and 0.2645 (Tianjin) and 0.7011 and 0.0867 d × a−1 (Hebei) (passing the 95% confident test). The days of severe drought and extreme drought showed a slight downward trend and the linear trends were −0.1511 and −0.1043 (Beijing), −0.0232 and −0.0362 (Tianjin) and −0.122 and −0.944 d × a−1 (Hebei). Except for the extreme drought days in Shanxi, which showed a slight downward trend (the linear change trend was −0.0177 d × a−1), the days of mild drought, moderate drought and severe drought all showed a slight increase trend (0.6899, 0.1984 and 0.0151 d × a−1, respectively, through a 95% confident test). The number of drought days with different intensities in Inner Mongolia showed a slight downward trend, and the linear change trend from weak to strong was −0.0326, −0.0489, −0.0328 and −0.017 d × a−1 (passing the 95% confident test) (Figure 6a–e). Based on Equation (5), the drought frequency of Beijing, Tianjin, Hebei, Shanxi and Inner Mongolia in North China and its jurisdiction was between 66.7% and 86.7%, of which Hebei had the highest drought frequency, 86.7%, followed by Beijing, 80%.

3.4. Interdecadal Change and Linear Trend

The interdecadal linear variation characteristics of drought days in North China are obvious (Table 2, Table 3, Table 4 and Table 5), and the days of mild drought and moderate drought generally show an increasing trend; the linear variation trends are 4.6 and 0.72 d × (10a)−1, respectively (through a 95% confident test). The days of severe drought and extreme drought generally showed a decreasing trend, and the linear change trends were −0.56 and −0.47 d × (10a)−1 (passing the 95% confident test). While the days of moderate drought in Inner Mongolia showed a decreasing trend (−0.38 d × (10a)−1), the days of light drought and moderate drought in Beijing, Tianjin, Hebei and Shanxi all showed an increasing trend. The linear trends are 5.4 and 0.26 d × (10a)−1 (Beijing), 9.4 and 2.58 d × (10a)−1 (Tianjin), 6.6 and 0.66 d × (10a)−1 (Hebei) and 6.6 and 1.85 d × (10a)−1 (Shanxi). Compared with light drought, the linear change trend of medium drought decreased significantly (passing the 95% confident test). Although the number of severe drought days in Shanxi showed an increasing trend (0.15 d × (10a)−1), the number of severe drought and extreme drought days in Beijing, Tianjin, Hebei and Inner Mongolia showed a decreasing trend, and the linear trends were −1.4 and −1.06 d × (10a)−1 (Beijing), −029 and −0.34 d × (10a)−1 (Tianjin), −1.28 and −0.94 d × (10a)−1 (Hebei), −0.26 and −0.13 d × (10a)−1 (Inner Mongolia) (passing the 95% confident test).
There is a large difference in the number of drought days between decades in North China, of which the 1960s had the fewest drought days, with the average annual number of mild drought days being about 72.0 days. It began to increase after the 1970s and reached the highest from 2000 to 2009 (110.6 days) and decreased from 2010 to 2019. The average annual number of mild drought days was 93.8 days (Table 2). The highest number of drought days for moderate drought and severe drought occurred in the 1990s (52.2 and 21.1 days) (Table 4), which is basically consistent with the research results of Liao et al., (2017) [28]. The maximum days of extreme drought occurred in the 1970s (6.5 days). The minimum number of drought days occurred in the 1960s (37.7 days). The minimum drought days of severe drought and extreme drought occurred from 2010 to 2019, 10.1 and 2.3 days, respectively. The maximum drought days of mild drought and moderate drought in Beijing occurred from 2000 to 2009, 126.3 and 55.4 days, respectively, and the maximum drought days of severe drought and extreme drought occurred in the 1970s, 22.4 and 9.4 days, respectively. The maximum drought days of moderate drought and severe drought in Tianjin, Hebei and Shanxi occurred in the 1990s. The number of moderate drought days was 66.9, 60.5 and 62.4 days and the number of severe drought days was 27.5, 24.0 and 27.2 days, respectively. In Inner Mongolia, the highest annual average number of light drought days occurred in the 1990s (174.1 days), and the highest number of moderate drought, severe drought and extreme drought days occurred in 2000–2009 (43.3, 17.4 and 5.1 days, respectively). In the past 60 years, the highest number of annual averaged mild drought, moderate drought and severe drought days occurred in Tianjin, and the highest number of extreme drought days occurred in Shanxi. The main reason for this distribution may be that the summer precipitation in North China has decreased significantly since the 1970s. In the 1990s, the reduction in precipitation was more obvious due to the occurrence of ENSO and La Niña events. From September 1998 to March 1999, the accumulated precipitation in most of North China was only 40–80 mm, a decrease of 40–90% compared with the same period in previous years [35]. The average temperature is the highest in the same period since 1949 and the 13th warmest winter since 1986 [43]. The decreased precipitation directly led to the drought in North China. At the same time, the temperature increased significantly, which also played an obvious role in promoting drought [33]. This understanding plays a guiding role in reducing the losses caused by drought disasters in North China.

3.5. Identification and Change Analysis of Drought Process in North China

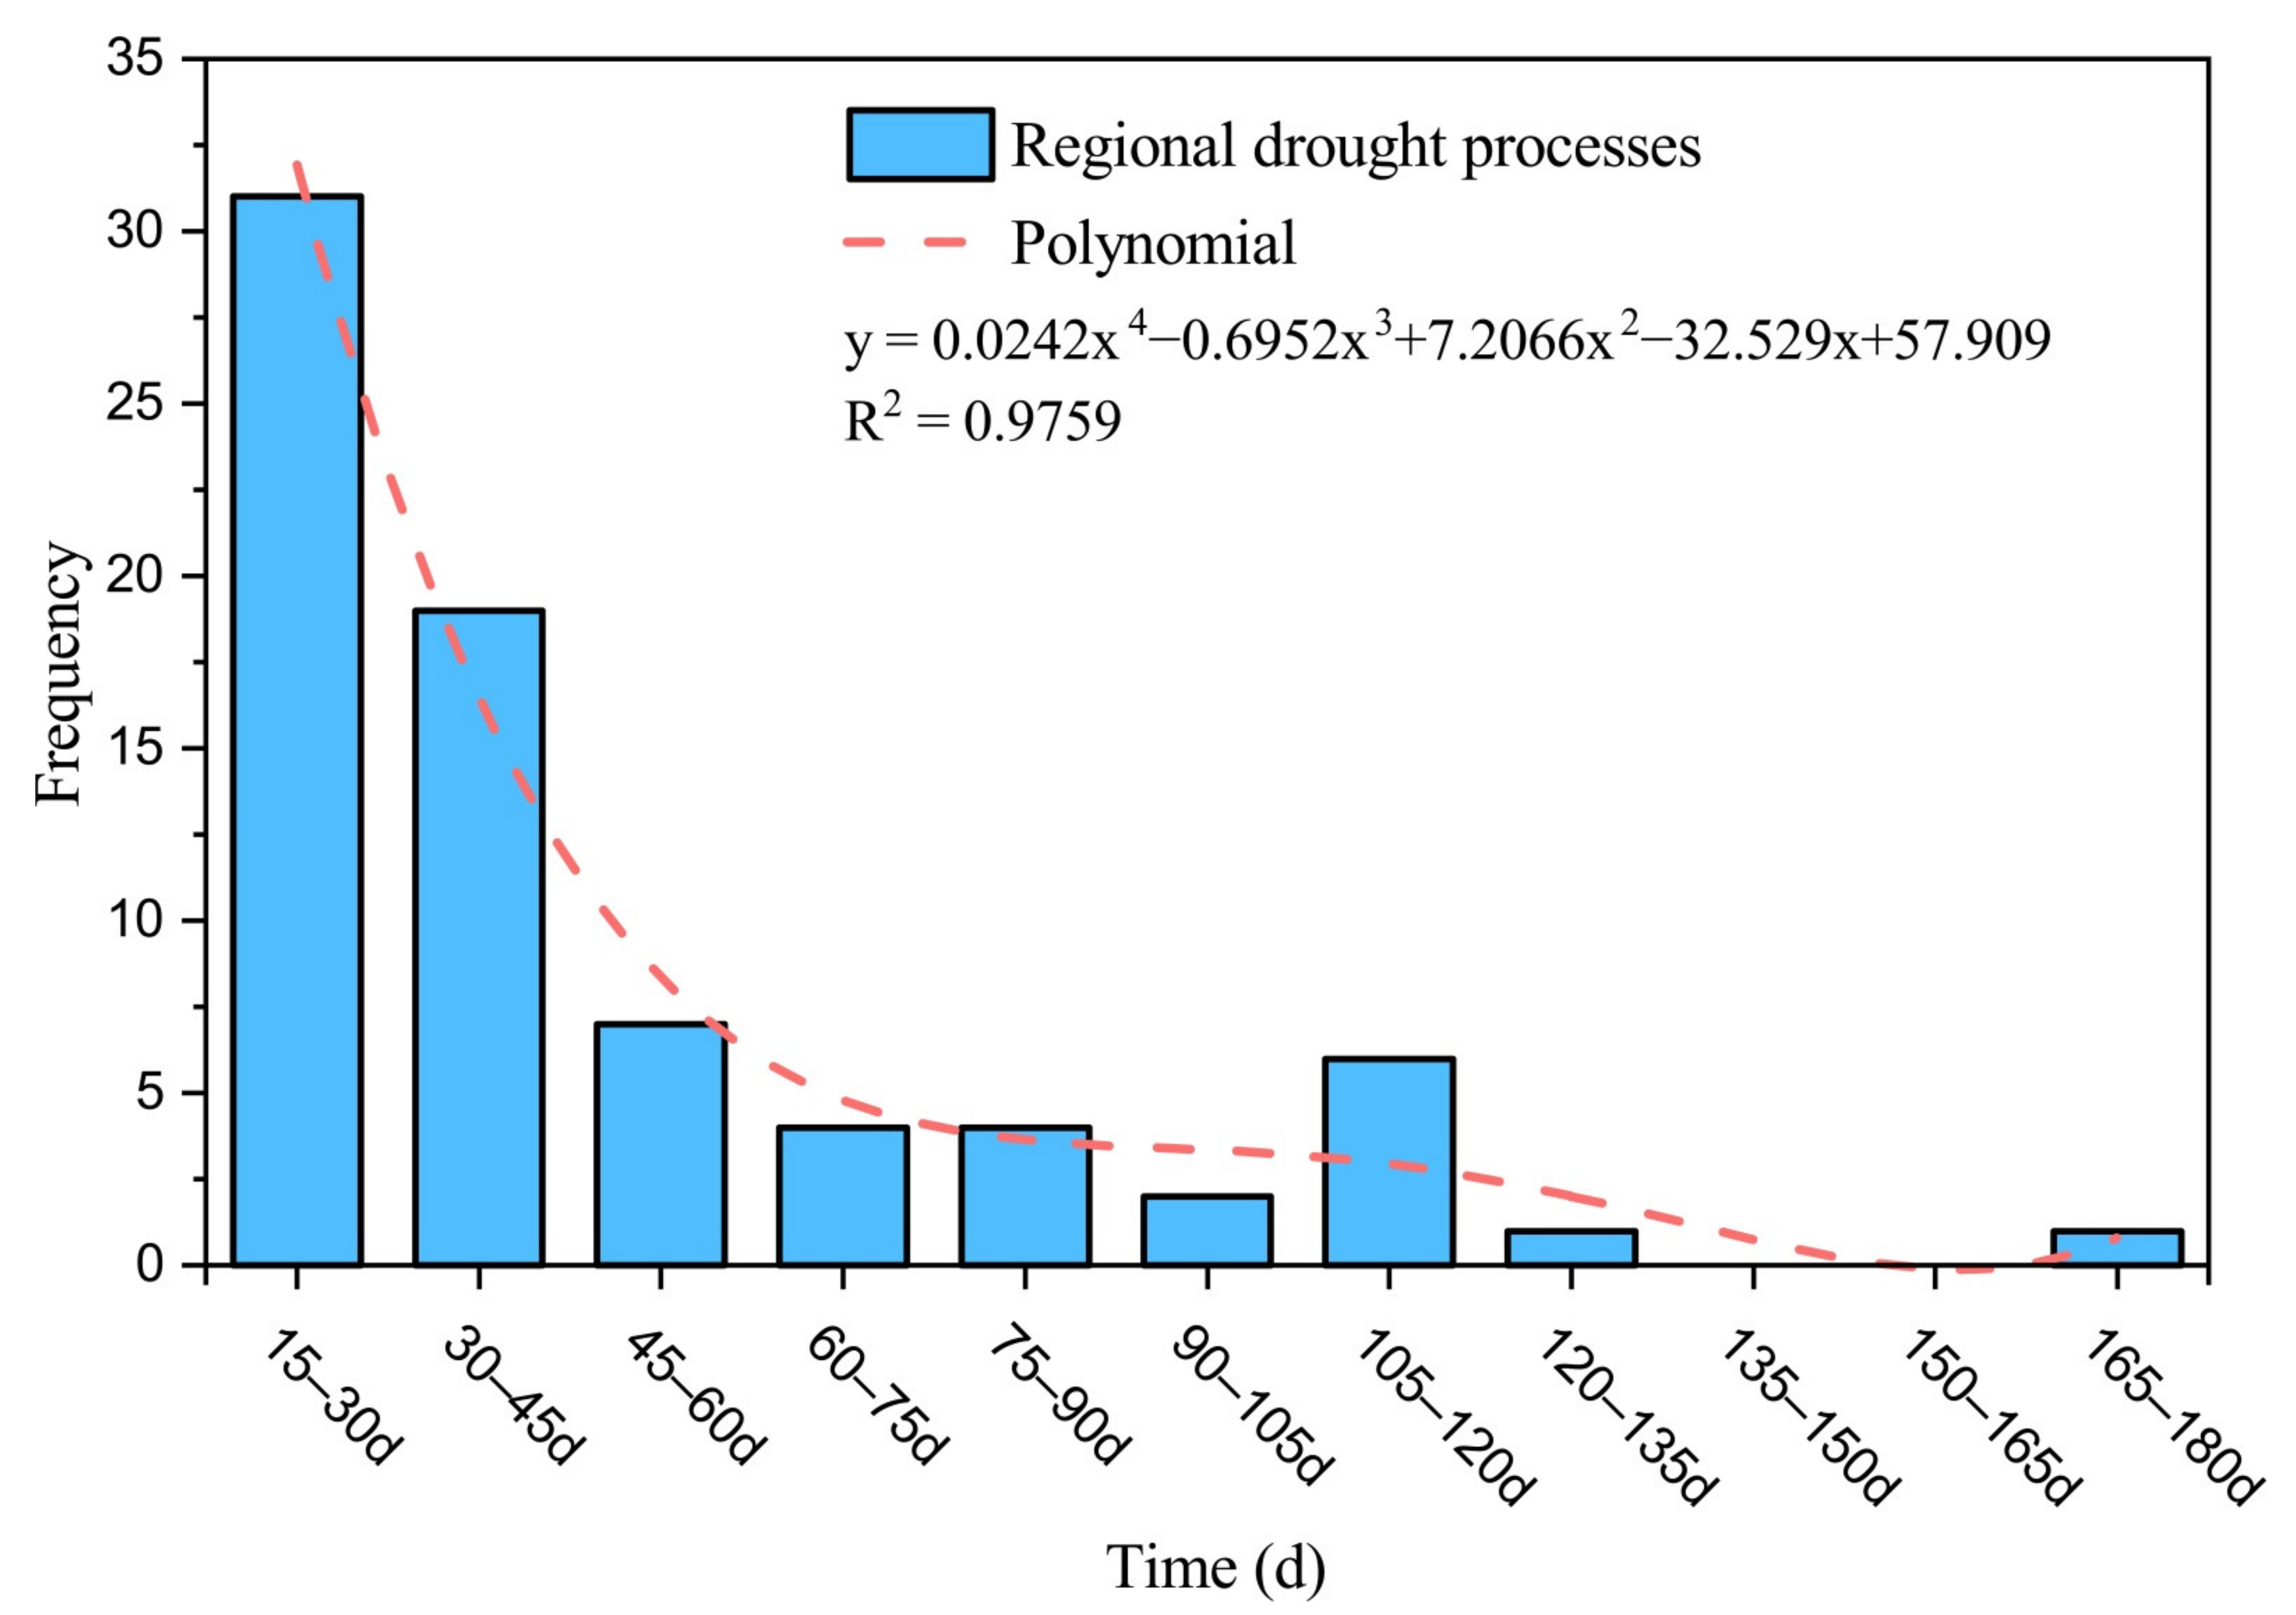
3.5.1. Identification of Regional Drought Process

Based on the drought process determination method, all regional drought processes in North China from 1960 to 2019 were identified, a total of 75 times. Among them, the spring drought process occurred 20 times, accounting for 26.7% of the total drought process; 18 times in summer, accounting for 24.0% and three times in autumn, accounting for 4.0%. There were 20 consecutive droughts in spring and summer, accounting for 26.7%. There were 10 consecutive droughts in summer and autumn, accounting for 13.3%. Drought occurred once in winter and spring, accounting for 1.3%. Drought occurred twice in spring, summer and autumn, accounting for 2.7%. Drought occurred once in winter, spring and summer, accounting for 1.3%. It can be seen that the drought process is the most frequent in spring, followed by summer. Regional drought processes with a duration of less than one month (15–30 days) occurred 31 times, accounting for 41.3% of all drought processes. There were 26 regional drought processes with a duration of 1–2 months (30–60 days), which accounted for 34.7% of all drought processes. The regional drought process with a duration of 2–3 months (60–90 days) occurred eight times, accounting for 10.7% of the total drought process. The regional drought process with a duration of 3–4 months (90–120 days) occurred eight times, accounting for 10.7% of the total drought process. The regional drought process with a duration of 4–5 months (120–150 days) occurred once, accounting for 1.3% of the total drought process. Regional drought processes lasting more than five months (150 days) occurred once, accounting for 1.3% of all drought processes. The three longest regional drought processes were from 18 May to 31 October 1965 (the drought lasted for 167 days); 27 April to 1 September 1972 (the drought lasted for 128 days) and 9 June to 1 October 1997 (the drought lasted for 115 days). The frequency distribution of regional drought processes in North China is shown in Figure 7. The longer the duration of drought processes, the lower the number of drought processes, and the determination coefficient (R2) is 0.98 (Figure 7).

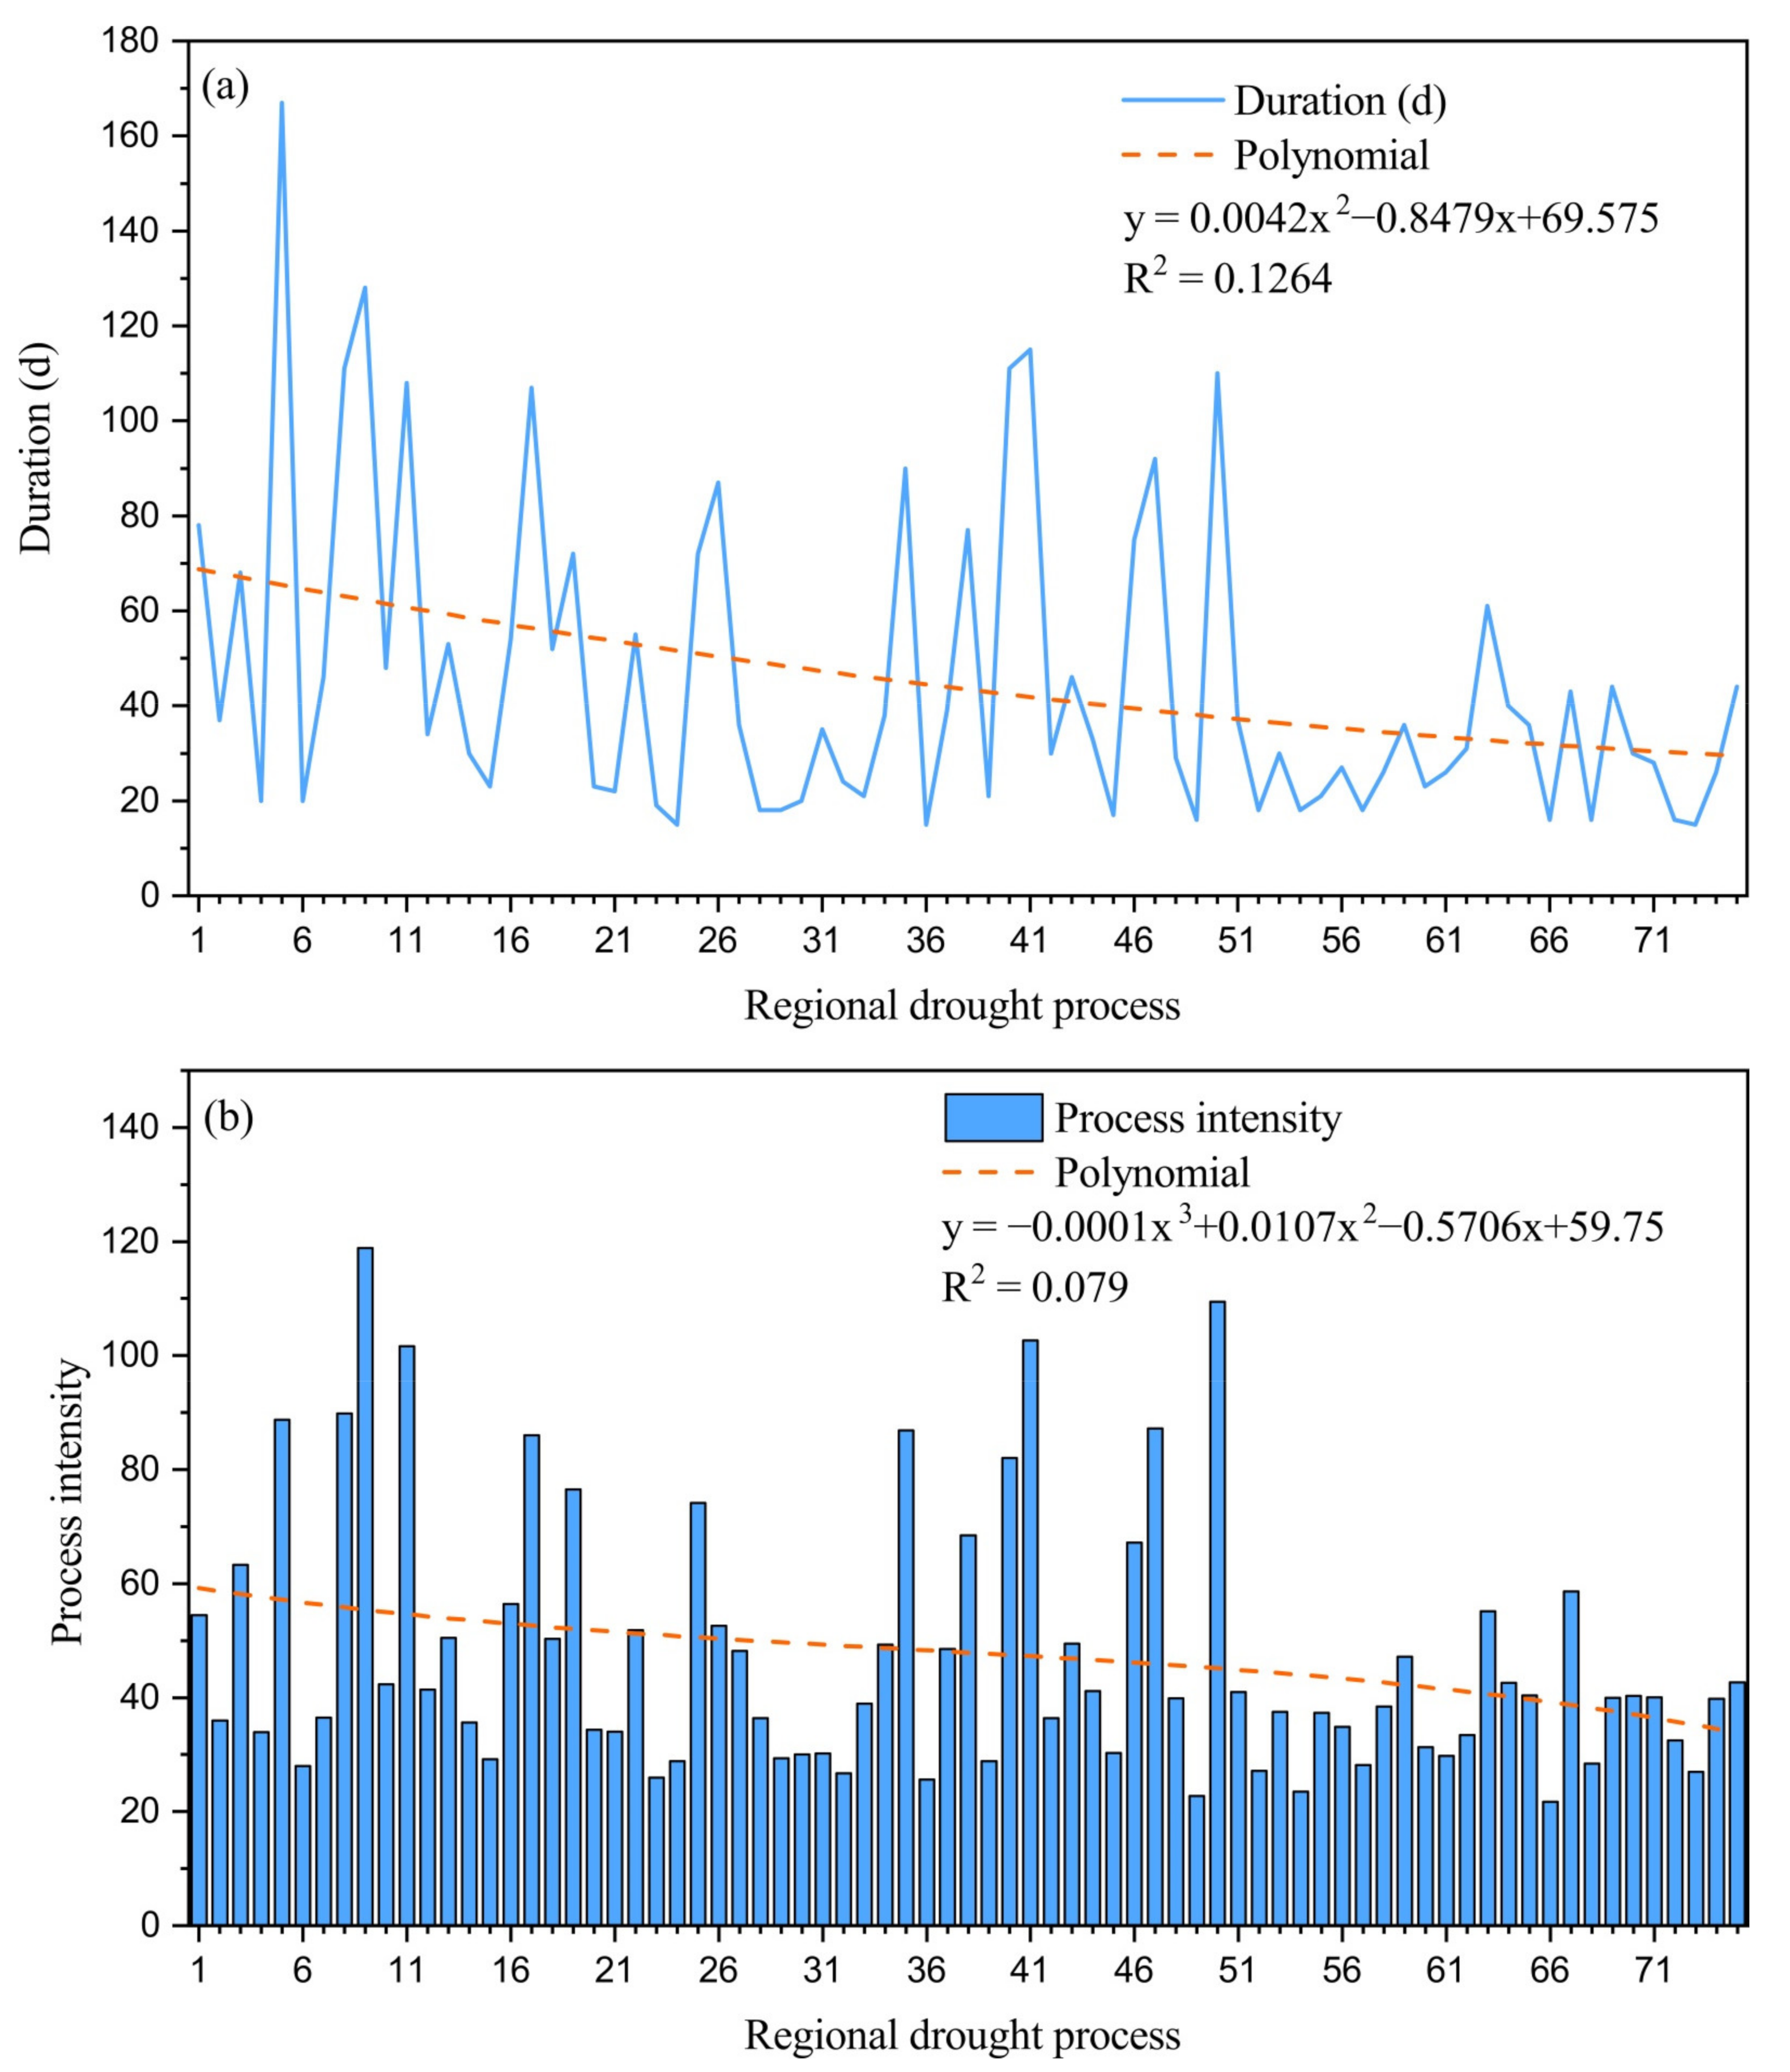
3.5.2. Variation Characteristics of Regional Drought Process

Based on 75 regional drought processes in North China from 1960 to 2019, the comprehensive intensity (Z) of regional drought processes was calculated and evaluated.
According to the single factor drought process, the longest drought process was from 18 May to 31 October 1965 (167 days), which lasted from late spring to autumn. As far as process intensity is concerned, the drought process from 27 April to 1 September 1972 was the strongest, resulting in continuous drought in spring, summer and autumn. The duration, average affected area and process intensity of regional drought process in North China fluctuate greatly. The average duration is 45 days, the longest duration is 167 days, the trend line is a quadratic function with positive quadratic term coefficient, the duration has a downward spiral trend and the determination coefficient (R2) is 0.1264 (passing the 95% significance test). The average influence area is 4595.9 km2, and the maximum influence area is 9555 km2. The trend line is a quadratic function with a negative quadratic term coefficient. The average influence area has a change trend of small at both ends and large in the middle, and the determination coefficient (R2) is 0.1085 (passing the 95% significance test). The trend line of process strength is a quadratic function with a positive quadratic term coefficient. The process strength has a downward trend of waves, and the determination coefficient (R2) is 0.079 (passing the 95% significance test) (Figure 8).
The annual drought-affected areas of each province were obtained, and the annual drought process intensity of each station in North China in the same period (1971–2019) was extracted to obtain the average annual drought process intensity and the evolution of annual drought-affected areas in North China from 1971 to 2019 (Figure 9). The annual average drought process intensity is consistent with the annual drought-affected area changing trend, and both show a weak decreasing trend, with a correlation coefficient of 0.55, which passed the 99% significance test, indicating that the identified regional drought process intensity has a strong correlation with the drought-affected area. In some years (such as 1987, 2008, 2009), the variation trend of drought intensity and the affected area is quite different, mainly because meteorological drought only indicates the lack of water in the atmosphere and does not consider the underlying crop situation. In years with large differences in the changing trend of drought process intensity and affected area, the drought process intensity is mainly distributed in autumn and winter, while the crop water demand in autumn and winter is lower, the impact of meteorological drought is lower and the drought disaster is relatively light. The same meteorological drought occurs in spring and summer, and the crop water demand is large, resulting in a significant increase in the drought area. The relevant departments can formulate corresponding disaster reduction measures according to the specific situation.

4. Discussion

The North China Plain is one of the important grain- and cotton-producing areas in China. However, due to the shortage of water resources and evapotranspiration caused by rising temperature, drought frequently occurs, which seriously restricts the social and economic development in this area [43]. A deep understanding of these problems and a clear understanding of the distribution and changing trend of drought in North China will facilitate rational use of water resources in this area. At the same time, it is of great practical significance to scientifically prevent and control drought.
At present, the National Climate Center of China Meteorological Administration mainly provides services for the government, such as precipitation and temperature measurements. The method of regional drought process identification and comprehensive drought intensity calculation studied in this work can be combined with future precipitation and temperature prediction to carry out regional drought intensity prediction. In the future, the method adopted in this study can be used to provide regional drought intensity prediction for government decision-making departments, so that government departments can be more targeted in the management of drought disaster prevention and mitigation.
In this study, based on the MCI, the EIDR theory was applied to calculate the drought intensity in the process of drought by sliding continuously, and the strongest (maximum) drought intensity was selected by comparison, so as to characterize the comprehensive intensity of regional drought process. This method identifies the regional drought process in North China from multiple perspectives such as single station intensity, duration and regional influence. Compared with the precipitation method and CI method alone, this method considers more factors, has a more complete time scale and is simpler than OITREE method.
According to the research results of Yao. N. et al., (2020) [44], the recent meteorological drought (SPI) in the south and north of China has a good correlation with agricultural drought (SSI) and hydrological drought (SRI). Compared with this, the meteorological drought comprehensive index (MCI) used in this study comprehensively considered this relationship, which is reflected in the coefficients a, b, c and d, including the distinction between the south and the north.
Affected by global warming, in recent decades, there has been a trend of rising temperature, increasing precipitation, generally decreasing ground wind speed and increasing relative moisture in Northern China, resulting in a decrease in potential evapotranspiration. According to the research results of Zhang Cunjie and others [45], the dryness index in most parts of China has been in a decreasing trend in the last 60 years, and there is a wetting trend in Northern China. This is consistent with the decreasing trend of the major drought process in Northern China.
It is worth noting that although drought is mainly caused by meteorological factors, it is also related to many factors such as season, soil type, underlying surface and manmade measures. Therefore, not every meteorological drought will eventually lead to disaster, and there is no strict one-to-one correspondence between the monitoring results of meteorological drought index and drought loss. The long-term change trend of meteorological drought in North China obtained in this study is basically similar to the results obtained by predecessors based on the change analysis of precipitation and other drought indexes [7,8,27,46,47,48], indicating that the above conclusions have high credibility and this method can be used for meteorological drought monitoring and drought change research and can also provide a more scientific theoretical basis for relevant departments to prevent and reduce drought.
Due to the different time scales and climatic factors used, there is great uncertainty in the evaluation results of different drought indexes for the temporal and spatial distribution characteristics of drought. There are great differences between Northern and Southern China. The north is dominated by temperate monsoon climate, and the south is dominated by subtropical monsoon climate; thus, the uncertainty of the evaluation results is more obvious when applied in different areas.
The evapotranspiration in the MCI used in this study was calculated by using the Thornthwaite method without considering the influence of factors such as sunshine and wind speed, which makes the evapotranspiration more affected by temperature. With the background of climate warming, the genetic mechanism of meteorological drought in North China needs to be further studied in the later stage.
The weight coefficient when calculating the intensity of the regional drought process was taken as 0.5 in this study. The most appropriate value still needs further examination and in-depth study.
At present, the method used in this study is directly applicable to the specific situation of China. How to make this method applicable to other parts of the world in the future is a very interesting topic.

5. Conclusions

According to the regional drought process identification method, it was identified that 75 regional drought processes occurred in North China from 1960 to 2019. The regional drought processes lasting less than 1 month account for 41.3% of the total drought processes, 34.7% for 1–2 months, 10.7% for 2–3 months, 10.7% for 3–4 months, 1.3% for 4–5 months and 1.3% for more than 5 months. The regional drought process with the longest duration was 167 days. With the increase in the duration of the drought process, the number of drought processes shows an obvious decreasing trend, and the determination coefficient (R2) is 0.98.
The duration, average affected area and comprehensive intensity of regional drought process in North China fluctuated greatly, with the longest duration of 167 days, showing a downward spiral trend. The average affected area has a small changing trend at both ends and a large changing trend in the middle, and the comprehensive intensity has a wave-like downward trend, all of which passed the 95% significance test.
The variation trend of average annual drought process intensity was consistent with that of annual drought-affected areas. The stronger the drought intensity, the larger the drought-affected area. The correlation coefficient was 0.55, which passed the 99% reliability test, indicating that the regional drought process intensity identified had a strong correlation with the drought-affected area.
In North China, the annual average number of mild and moderate drought days showed an upward trend, while the number of severe and extreme drought days showed a downward trend. Most drought days occurred in 1999. The monthly distribution characteristics are as follows: the highest number of light drought days occurred in May and the lowest in January. The highest number of drought days in North China occurred in June. In terms of interdecadal changes, the number of mild drought and moderate drought days showed an increasing trend, the number of severe drought days showed a decreasing trend and the number of moderate drought days was the highest in the 1990s.
The frequency of drought in North China is between 66.7% and 86.7%, of which Hebei has the highest drought frequency, 86.7%, followed by Beijing, 80.0%. The average annual mild drought, moderate drought, severe drought and the highest number of drought days above occurred in Tianjin, and the highest number of extreme drought occurred in Shanxi. In terms of season, the highest number of drought days occurred in spring in Beijing, summer in Inner Mongolia and autumn and winter in Hebei. From the perspective of seasonal continuous drought, continuous drought in spring and summer was the most frequent (18 times), followed by continuous drought in summer and autumn (10 times).
The regional drought process identification method was used to effectively identify 75 regional drought processes in North China from 1960 to 2019 and monitor and evaluate the drought process from multiple perspectives such as duration, average impact area and drought process intensity. The evaluation results are in good agreement with the historical drought disasters.

Author Contributions

Conceptualization methodology and validation, X.C., X.F. and Q.Z.; Software and data curation, D.C. and W.Z.; Formal analysis, X.C., Q.Z. and C.Z.; Investigation, C.C., W.F. and Y.Y.; Resources, Q.Z. and C.Z.; Writing—original draft preparation and visualization, X.C., X.F. and W.Z.; Writing—review and editing, X.C., X.F., Q.Z., C.Z., W.Z., C.C., W.F. and Y.Y.; All authors have read and agreed to the published version of the manuscript.

Funding

This research was funded by the National Key Research and Development Program of China (2020YFA0608203) and the Basic Research Fund (2021Z001) of Chinese Academy of Meteorological Sciences.

Institutional Review Board Statement

Not applicable.

Informed Consent Statement

Not applicable.

Data Availability Statement

The data analyzed in this study are subject to the following licenses/restrictions: The dataset can only be accessed from inside China Meteorological Administration. Requests to access these datasets should be directed to Xiuhua Cai, [email protected].

Acknowledgments

In the process of revising this paper, we have received strong guidance from researcher Ren Guoyu of CMA National Climate Centre, senior engineer Sun Jingli of CMA Public Meteorological Service Center and researcher An Xingqin of Chinese Academy of Meteorological Sciences.

Conflicts of Interest

The authors declare no conflict of interest.

Abbreviations

6.1Days·annual (d·a)
6.2Compound Index of meteorological drought (CI)
6.3the Extreme Intensity with both the Duration and the Region (EIDR)
6.4Relative Moisture Index (MI)
6.5Meteorological drought Composite Index (MCI)
6.6Objective Identification Technique for Regional Extreme Events (OITREE)
6.7Percentage of Precipitation anomaly (Pa)
6.8Palmer Drought Severity Index (PDSI)
6.9Potential Evapotranspiration (PET)
6.10Reconnaissance Drought Index (RDI)
6.11Standardized Precipitation Index (SPI)
6.12Standardized Precipitation Evapotranspiration Index (SPEI)
6.13Standardized Weighted Precipitation Index (SPIW)
6.14Precipitation Z index (Z)

References

  1. Mishra, A.K.; Singh, V.P. A review of drought concepts. J. Hydrol. 2010, 391, 202–216. [Google Scholar] [CrossRef]
  2. Gumbel, E.J. Statistical forecast of droughts. Bull. Int. Assoc. Sci. Hydrol. 1963, 8, 5–23. [Google Scholar] [CrossRef] [Green Version]
  3. Karl, T.R. Some spatial characteristics of drought duration in the United Stated. J. Clim. Appl. Meteorol. 1983, 22, 1356–1366. [Google Scholar] [CrossRef] [Green Version]
  4. Agnew, C.T.; Svoboda, M.D.; Wilhite, D.A.; Vanyarkho, O.V. Monitoring the 1996 drought using the standardized precipitation index. Bull. Am. Meteorol. Soc. 1999, 80, 429–438. [Google Scholar] [CrossRef]
  5. Banzragch, N.; Masato, S. Assessment of drought frequency, duration, and severity and its impact on pasture production in Mongolia. Nat. Hazards 2013, 66, 995–1008. [Google Scholar] [CrossRef]
  6. Marambanyika, T.; Mupfifiga, U.N.; Musasa, T.; Ngwenya, K. Local Perceptions on the Impact of Drought on Wetland Ecosystem Services and Associated Household Livelihood Benefifits: The Case of the Driefontein Ramsar Site in Zimbabwe. Land 2021, 10, 587. [Google Scholar] [CrossRef]
  7. Ma, Z.G.; Fu, C.B. Some evidence of dryingtrend over northern China from 1951 to 2004. Chin. Sci. Bull. 2006, 51, 2429–2439. [Google Scholar] [CrossRef]
  8. Zou, X.K.; Ren, G.Y.; Zhang, Q. Droughts variations in China based on a compound index of meteorological drought. Clim. Environ. Res. 2010, 15, 371–378. [Google Scholar] [CrossRef]
  9. Ren, G.Y.; Wang, T.; Guo, J.; Hao, Z.X.; Zhan, Y.J. Characteristics of precipitation variations in Haihe River Basin in modern times. Adv. Sci. Technol. Water Resour. 2015, 103–111. [Google Scholar] [CrossRef]
  10. Ren, F.M.; Gong, Z.Q.; Wang, Y.J.; Zou, X.K.; Li, Y.P. China’s Regional Extreme Events-Droughts, Intense Precipitations, Heatwaves and Low Temperature; China Meteorological Press: Beijing, China, 2015. [Google Scholar]
  11. Zhang, Q.; Yao, Y.B.; Li, Y.H.; Huang, J.P.; Ma, Z.G.; Wang, Z.L. Progress and prospect on the study of causes and variation regularity of droughts in China. Acta Meteor Sin. 2020, 78, 500–521. [Google Scholar] [CrossRef]
  12. Zhang, Q.; Xie, W.S.; Chen, X.Y.; Zhai, P.M.; Wu, B.W.; Duan, J.Q. Regional drought process and its variation characteristics in the Middle-lower Reaches of the Yangtze River from 1961 to 2019. Acta Meteor Sin. 2021, 79, 1–12. [Google Scholar] [CrossRef]
  13. Wu, Y.J.; Li, W.; Wang, W.J.; Quan, Q.; Chen, X.J.; Yin, H. Drought Characteristics in Inner Mongolia Based on Precipitation Anomaly Percentage. Arid. Zone Res. 2019, 36, 943–952. [Google Scholar] [CrossRef]
  14. Hu, G.H.; Li, T.; Sheng, F.; Shao, Q.X.; Gu, Q.F. Characteristics and adaptation of drought in Xiangjiang River based on the percentage of precipitation anomalies. J. Chang. Univ. Sci. Technol. 2020, 17, 74–82,91. [Google Scholar] [CrossRef]
  15. Yuan, F.; Zhang, Y.Q.; Liu, Y.; Ma, M.W.; Zhang, L.M.; Shi, J.Y. Drought assessment of Xijiang River Basin based on standardized Palmer drought index. Water Resour. Prot. 2021, 37, 46–52. [Google Scholar] [CrossRef]
  16. Li, H.J.; Jiang, Z.H.; Bai, Y.G. Evaluation and Improvement on Palmer Index of Tarim River Basin. Plateau Meteorol. 2015, 34, 1057–1064. [Google Scholar] [CrossRef]
  17. Yuan, W.P.; Zhou, G.S. Comparison Between Standardiaed Precipitation Index and Z-Index and Index in China. Acta Phytoecol. Sineca 2004, 28, 523–529. [Google Scholar]
  18. Ren, J.C.; Zhang, T.T. Evolution Characteristics of Drought and Flood in Shandong Province in Recent 45 Years Based on Standardized Precipitation Index. Res. Soil Water Conserv. 2021, 28, 149–154, 162. [Google Scholar]
  19. Wang, Z.W.; Zhai, P.M. Climate Change in Drought over Northern China during 1950–2000. Acta Geogr. Sin. 2003, 58, 61–68. [Google Scholar] [CrossRef]
  20. Zhang, Q.W.; Cui, N.B.; Zhao, L.S.H.; Xu, Y.; Li, Q.; Liu, F.P. Seasonal drought characteristics based on relative moisture index in Yunnan Province. Agric. Res. Arid. Areas 2020, 38, 278–284. [Google Scholar] [CrossRef]
  21. Ding, Y.B.; Xu, J.T.; Li, L.; Cai, H.J.; Sun, Y.N. Analysis of Drought Characteristics and Its Trend Change in Shaanxi Province Based on SPEI and MI. Sci. Agric. Sin. 2019, 52, 4296–4308. [Google Scholar] [CrossRef]
  22. Luo, N.; Mao, D.; Wen, B.; Liu, X. Climate Change Affected Vegetation Dynamics in the Northern Xinjiang of China: Evaluation by SPEI and NDVI. Land 2020, 9, 90. [Google Scholar] [CrossRef] [Green Version]
  23. Dubrovsky, M.; Svoboda, M.D.; Trnka, M.; Hayes, M.J.; Wilhite, D.A.; Zalud, Z.; Hlavinka, P. Application of relative drought indices in assessing climate-change impacts on drought conditions in Czechia. Theor. Appl. Clim. 2009, 96, 155–171. [Google Scholar] [CrossRef] [Green Version]
  24. Tsakiris, G.; Vangelis, H. Establishing a drought index incorporating evapotranspiration. Eur. Water 2005, 10, 3–11. [Google Scholar]
  25. Vangelis, H.; Tigkas, D.; Tsakiris, G. The effect of PET method on Reconnaissance Drought Index (RDI) calculation. J. Arid. Environ. 2013, 88, 130–140. [Google Scholar] [CrossRef]
  26. Zhao, H.Y.; Zhang, W.Q.; Zou, X.K.; Zhang, Q.; Shen, Z.Q.; Mei, P. Temporal and Spatial Characteristics of Drought in China under Climate Change. Chin. J. Agrometeorol. 2021, 42, 69–79. [Google Scholar] [CrossRef]
  27. Xie, W.S.; Zhang, Q.; Li, W.; Wu, B.W. Analysis of the Applicability of Drought Indexes in the Northeast, Southwest and Middle-lower Reaches of Yangtze River of China. Plateau Meteorol. 2021, 41. [Google Scholar] [CrossRef]
  28. Liao, Y.M.; Zhang, C.J. Spatio-temporal distribution character- istics and disaster change of drought in China based on meteorological drought composite index. Meteorol. Mon. 2017, 43, 1402–1409. [Google Scholar] [CrossRef]
  29. Li, Y.P.; Li, Y.H. Advances in adaptability of meteorological drought indices in China. J. Arid. Meteor 2017, 35, 709–723. [Google Scholar] [CrossRef]
  30. Ren, F.; Cui, D.; Gong, Z.; Wang, Y.; Zou, X.; Li, Y.; Wang, S.; Wang, X. An Objective Identification Technique for Regional Extreme Events. J. Clim. 2012, 25, 7015–7027. [Google Scholar] [CrossRef]
  31. Li, Y.J.; Ren, F.M.; Li, Y.P.; Wang, P.L.; Yan, H.M. A study of the characteristics of the southwestern China regional meteorological drought events during 1960–2010. Acta Meteor Sin. 2014, 72, 266–276. [Google Scholar] [CrossRef]
  32. Jin, Y.; Kuang, X.Y.; Yan, H.M.; Wan, Y.X.; Wang, P. Studies on distribution characteristics and variation trend of the regional drought events over Yunnan in recent 55 years. Meteor Mon. 2018, 44, 1169–1178. [Google Scholar] [CrossRef]
  33. An, L.J.; Ren, F.M.; Li, Y.J. Study on characteristics of regional drought events over North China during the past 50 years. Meteor Mon. 2014, 40, 1097–1105. [Google Scholar] [CrossRef]
  34. Zhang, Y.J.; Wang, C.Y.; Zhang, J.Q. Analysis of the spatial and temporal characteristics of drought in the North China plain based on standardized precipitation evaporation index. Acta Ecol. Sin. 2015, 35, 7097–7107. [Google Scholar] [CrossRef]
  35. Zhou, D.; Zhang, B.; Luo, J.; Zhang, C.L.; An, M.L.; Wang, D. SPEI-based intensity characteristics and cause analysis of drought in north China during recent 50 years. J. Nat. Disasters 2014, 23, 193–202. [Google Scholar] [CrossRef]
  36. Ni, S.H.; Gu, Y.; Peng, Y.J.; Liu, J.N.; Wang, H.L. Spatio-temporal pattern and evolution trend of drought disaster in China in recent seventy years. J. Nat. Disasters 2019, 28, 176–181. [Google Scholar] [CrossRef]
  37. Li, Z.H.; Wang, H.M.; Han, G.D.; Han, J.W.; Gao, J.X. Review on the flow-break in the lower reaches of Yellow River. Ecol. Environ. 2007, 16, 686–690. [Google Scholar] [CrossRef]
  38. Kong, Z.J.; Deng, M.J.; Ling, H.B.; Wang, G.Y.; Xu, S.W.; Wang, Z.R. Ecological security assessment and ecological restoration countermeasures in the dry-up area of the lower Tarim River. Arid. Zone Res. 2021, 38, 1128–1139. [Google Scholar] [CrossRef]
  39. Lu, E.; Zhao, W.; Zou, X.; Ye, D.; Zhao, C.; Zhang, Q. Temporal–Spatial Monitoring of an Extreme Precipitation Event: Determining Simultaneously the Time Period It Lasts and the Geographic Region It Affects. J. Clim. 2017, 30, 6123–6132. [Google Scholar] [CrossRef]
  40. Liao, Y.M.; Zhang, C.J.; Zou, X.K.; Ye, D.X.; Wang, X.F.; Li, W. QX/T 597-2021, Monitoring and Assessment Method of Regional Drought Process; China Meteorological Press: Beijing, China, 2021. [Google Scholar]
  41. Zhang, C.J.; Liu, H.B.; Song, Y.L.; Liao, Y.M.; Duan, J.Q.; Cai, W.Y. Grades of Meteorological Drought: GB/T 20481-2017; China Standards Press: Beijing, China, 2017. [Google Scholar]
  42. Xu, Y.; Tang, G.L.; Zhang, Q. Analysis of the Variation of the Air Temperature over China During the Global Warming Hiatus Period. Acta Meteor. Sin. 2017, 13, 569–577. [Google Scholar] [CrossRef]
  43. Ma, Z.G. The aridification over North China associated with the Pacific decadal oscillation. Chin. Sci. Bull. 2007, 52, 1199–1206. [Google Scholar] [CrossRef]
  44. Yao, N.; Zhao, H.; Li, Y.; Biswas, A.; Feng, H.; Liu, F.; Pulatov, B. National-Scale Variation and Propagation Characteristics of Meteorological, Agricultural, and Hydrological Droughts in China. Remote Sens. 2020, 12, 3407. [Google Scholar] [CrossRef]
  45. Zhang, C.J.; Ren, Y.Y.; Cao, L.J.; Zhang, S.Q.; Hu, C.Y.; Wu, X.L. Characteristics of Dry-Wet Climate Change in China during the Past 60 Years and Its Trends Projection. Clim. Chang. Res. Lett. 2021, 10, 728–741. [Google Scholar] [CrossRef]
  46. Ren, G.Y.; Wu, H.; Chen, Z.H. Spatial pattens of changes trend in rainfall of China. Q. J. Appl. Meteorol. 2000, 11, 322–330. [Google Scholar]
  47. Jiang, Z.H.; Chen, W.L.; Song, J.; Wang, J. Projeetion and evaluation of the precipitation extremes indices over China based on seven LPCC AR4 coupled climate models. Chin. J. Atmos. Sci. 2009, 33, 109–120. [Google Scholar] [CrossRef]
  48. Hu, Q.; Dong, B.; Pan, X.B.; Wang, X.X.; Wei, P.; Zhao, H.H. Spatiotemporal Variation and Causes Analysis of Dry-wet Climate at Different Time Scales in North China Plain. Chin. J. Agrometeorol. 2017, 38, 267–277. [Google Scholar] [CrossRef]
Figure 1. Land use distribution (a) and meteorological station distribution (b) in North China in 2020.
Land 10 01390 g001
Figure 2. Variation of annual average precipitation (a) and average temperature (b) in North China from 1960 to 2019.
Land 10 01390 g002
Figure 3. Flow chart for calculating the drought index and the intensity of the drought process.
Land 10 01390 g003
Figure 4. Spatial distribution of the days of mild drought (a), moderate drought (b), heavy drought (c) and extreme drought (d) in North China from 1960 to 2019.
Land 10 01390 g004
Figure 5. Characteristics of monthly changes from mild drought (a), moderate drought (b), heavy drought (c) and extreme drought (d) in North China from 1960 to 2019.
Land 10 01390 g005
Figure 6. Interannual variation and linear trend from mild drought to extreme drought in North China (a), Beijing (b), Tianjin (c), Hebei (d), Shanxi (e) and Inner Mongolia (f) from 1960 to 2019.
Land 10 01390 g006
Figure 7. Frequency distribution of regional drought processes in North China from 1960 to 2019.
Land 10 01390 g007
Figure 8. Variation of duration (a), comprehensive intensity (b) of regional drought processes in North China from 1960 to 2019.
Land 10 01390 g008
Figure 9. Variations of average annual drought process intensity and annual drought disaster area in North China from 1971 to 2019.
Land 10 01390 g009
Table 1. Classification table of meteorological drought composite index grades [41].
GradeNo DroughtMild DroughtModerate DroughtSevere DroughtExtreme Drought
MCI−0.5 < MCI−1.0 < MCI ≤ −0.5−1.5 < MCI ≤ −1.0−2.0 < MCI ≤ −1.5MCI ≤ −2.0
Table 2. Decadal average and linear trend rate of mild drought and above days for North China.
1960–19691970–19791980–19891990–19992000–20092010–2019Linear Trend/d (10a)−1
North China72.092.7105.6106.4110.693.84.6
Beijing90.987.3119.2110.2126.3107.65.4
Tianjing78.983.8101.1128.1124.4115.39.4
Hebei72.0107.8123.6120.8119.0112.66.6
Shanxi62.893.6106.4124.3115.092.76.6
Inner Mongolia92.8127.0147.1174.1163.2142.610.9
Table 3. Decadal average and linear trend rate of mid drought and above days for North China.
1960–19691970–19791980–19891990–19992000–20092010–2019Linear Trend/d (10a)−1
North China37.745.545.652.249.239.20.72
Beijing47.545.254.055.155.443.00.26
Tianjing43.039.743.966.953.648.12.58
Hebei39.756.352.060.549.546.70.66
Shanxi33.247.544.862.453.439.11.85
Inner Mongolia37.231.737.430.843.328.9−0.38
Table 4. Decadal average and linear trend rate of severe drought and above days for North China.
1960–19691970–19791980–19891990–19992000–20092010–2019Linear Trend/d (10a)−1
North China16.918.915.521.118.312.3−0.56
Beijing2022.420.321.717.612.8−1.4
Tianjing21.215.214.827.516.615.8−0.29
Hebei18.924.816.924.016.513.5−1.28
Shanxi14.720.415.127.22212.40.15
Inner Mongolia15.610.513.511.217.410.1−0.26
Table 5. Decadal average and linear trend rate of Extreme drought days for North China.
1960–19691970–19791980–19891990–19992000–20092010–2019Linear Trend/d (10a)−1
North China5.66.53.56.45.42.4−0.47
Beijing5.99.466.14.21.6−1.06
Tianjing6.85.438.15.43.4−0.34
Hebei6.39.63.56.84.22.3−0.94
Shanxi5.36.53.39.17.72.6−0.12
Inner Mongolia4.92.63.43.25.12.5−0.13
Publisher’s Note: MDPI stays neutral with regard to jurisdictional claims in published maps and institutional affiliations.

