1. Introduction
Land-use change is a globally heated topic [
1], among which construction land expansion and cultivated land loss are two key subjects that receive the most academic attention. On the one hand, construction land expansion is directly connected with socioeconomic development. Especially in developing countries, the expansion of construction land drives and signifies the structural change of land use during rapid urbanization and industrialization [
2,
3,
4]. On the other hand, cultivated land loss is associated with food security, which is a critical task and challenge for governments worldwide to ensure sustainable development [
5]. Moreover, the expansion of construction land is often accompanied by the occupation of cultivated land, which produces a significant conflict between urban development and cultivated land protection [
6,
7,
8].
Previous studies have widely explored the driving forces of construction land expansion and its occupation of cultivated land, such as economic growth, industrialization, and urbanization. The expansion of construction land is fundamentally driven by economic growth and the accompanying population agglomeration [
9,
10]. Both productive activities and residents’ living have demands for construction land. The models of industrialization and urbanization also play a crucial role in land-use change. The industrialization process is usually dominated by the rapid development of the secondary industry while the tertiary industry is the key driver in some regions. There are different demands for land in different industrial structures, which affect construction land expansion [
11]. In addition to industrialization, the urbanization process is also an important driver of construction land expansion [
12,
13,
14,
15]. The urban–rural distribution pattern of economic activities and population leads to different efficiencies of land use. Compared with villages, the land-use efficiency of cities is believed to be higher owing to agglomeration economies [
16].
China has undergone rapid economic development and urbanization in the past few decades. Land use has also changed continuously and drastically [
17]. Numerous studies have discussed construction land expansion across national, regional, and municipal scales [
18,
19]. For instance, some have investigated the spatial patterns of expansion from a multi-scalar perspective while others have interpreted the driving forces for and spatio-temporal heterogeneities of construction land expansion from different perspectives [
20,
21,
22,
23]. Scholars have also conducted multidimensional evaluations of the economic and ecological implications of the expansion [
24,
25]. Concerning cultivated land loss, a large amount of research exists at multiple levels, all of which have systematically unpacked the spatio-temporal heterogeneities [
26,
27] and identified the socioeconomic and institutional mechanisms of cultivated land loss [
28,
29,
30]. In addition, the literature has not only assessed the effectiveness of policies on cultivated land protection but also examined the impacts of cultivated land loss on food security and environment [
31,
32,
33,
34]. The findings of previous studies have suggested that socioeconomic development and construction land expansion have imposed an increasing pressure on cultivated land and the spatio-temporal changes of food production [
35,
36]. As a result, most scholarly work and policy instruments for managing construction land expansion stemmed from concerns on the reduction of quality cultivated land and the threat to national food security.
However, a careful examination of the nuances of and relationships between construction land expansion and cultivated land loss reveal some limitations in existing literature. First, most previous studies examined construction land expansion and cultivated land loss separately, whereas these two issues are taken into consideration simultaneously in Chinese land-use policies, which can be better evaluated and improved through an integrated study [
37,
38,
39]. Second, many studies have overlooked the structural characteristics of construction land expansion because settlements were not distinguished from transport and other basic infrastructure land use in the data, leading to inadequate explanations on the mechanisms of construction land expansion. Third, the dramatic disparities on development models in different regions have not been fully discussed because most of the academic attention has been paid to individual explanatory factors, such as economic development, population growth, industrialization, and urbanization [
40,
41]. Finally, quantitative methods have rarely been used in policy analysis as most studies on policy impacts were conducted qualitatively.
To address these research gaps, this paper attempts to investigate the spatio-temporal pattern of construction land growth and cultivated land occupation simultaneously. We have compiled a national land-use database of 1996–2006 to support the investigation for reasons of data availability and reliability (The specific rationales for data selection are elaborated in
Section 2.3). We concentrate on urban–rural construction land upon which most socioeconomic activities are carried out [
42]. The mechanisms of cultivated land occupation by urban–rural construction land are discussed by establishing explanatory models that integrate regional growth and economic development, development models, and relevant policies. The findings of this study will further clarify the characteristics and dynamics of construction land expansion and cultivated land protection, which could inform differentiated and specific policy formulation and implementation.
2. Methodology
2.1. Methods
The study first uses descriptive statistics to demonstrate the temporal changing characteristics of urban–rural construction land and its occupation of cultivated land (OCL) between 1996 and 2006. It then applies ArcGIS spatial visualization to analyze spatial variations across China’s 31 provinces. The study also establishes an econometric model to examine how economic development, population agglomeration, and their spatial patterns and regional development policies may influence the spatio-temporal disparity on urban–rural construction land expansion and its occupation of cultivated land. Based on interprovincial panel data, this study uses mixed ordinary least squares (OLS) model, random effects model, and fixed effects model to explain and discuss the final regression results.
2.2. Model
This paper sets up the following model to explain the occupation of cultivated land by the expansion of urban–rural construction land [
17]:
where OCL is the area of cultivated land occupied by urban–rural construction land, which is the function of development level (DL), development model (DM), and policy (P). According to this basic form, the empirical model is then specified to estimate the relationships between dependent variable and explanatory variables. The dependent variable is the area of occupation of cultivated land by urban–rural construction land in 1000 hectares. The explanatory variables are selected from three perspectives of development level, development model, and policy.
Table 1 presents the detailed description and data sources of all variables.
First, development level is the fundamental driving force for urban–rural construction land expansion, which is reflected in economic output, economic input, population, and income level [
43,
44,
45]. Economic growth and population agglomeration have space demands for productive activities and residential areas. They are measured by the increment of regional gross domestic product (GDP) and total population, respectively. Regional GDP reflects economic output while economic input is also considered in the empirical model. Investment projects are the main way to attract population agglomeration, promote economic growth, and affect construction demands for land. Thus, local fixed assets investment is selected as a proxy variable to reflect economic input. These three variables are expected to have positive impacts on the scale of cultivated land occupied by urban–rural construction land. To measure the effect of land-use efficiency, the income per capital is also included as the proxy of economic development level. It is expected to have a negative impact on urban–rural construction land expansion and its occupation of cultivated land. Regions with a higher level of economic efficiency are more inclined to use land intensively because of higher land prices and more advanced industrial structure. In other words, the construction land per unit population and economic activities is smaller, which may lead to a relatively less occupation of cultivated land.
Second, a different model of development causes regional differentiation of construction land expansion [
46,
47]. The model of industrialization measured by industrial structure is the direct manifestation of the model of economic development. The secondary and tertiary industries have different spatial agglomeration patterns and land-use efficiency. Their demands for urban–rural construction land and the corresponding areas of cultivated land occupation are also different [
38]. Therefore, percentage changes in the proportion of the secondary and tertiary industries are included in the model and are expected to have a positive and negative impact, respectively. The model of urbanization also plays an important role in urban–rural construction land occupying cultivated land. The distribution patterns of urban–rural population and economic activities affect the demands for construction land. Thus, the annual percentage increase in population urbanization rate is selected as the indicator of changing urban–rural patterns. Since the per capita land use in cities is usually lower than that in rural areas, this variable is expected to be conducive to the intensive use of construction land and have a negative impact on the dependent variable. Moreover, rural industrialization is regarded as a special model of urbanization in east Asian countries, especially in China. The ratio of rural employment to primary industry employment in the total employment of the region is selected to characterize the impact of rural industrialization on regional development. The regional development model dominated by rural development is generally related to lower land-use efficiency. In areas with higher indicators, urban–rural construction land is expected to grow faster and occupy more cultivated land. In addition to the model of industrialization and urbanization, China’s regional development has been profoundly affected by globalization. Especially in many coastal areas, industry and urban development are largely driven by exports. The impact of the economic growth model driven by the foreign economy on urban–rural construction land use is still controversial in existing literature. The increase in exports is selected as a proxy for the export-oriented economic growth model.
Third, regional development policies are also supposed to affect urban–rural expansion and its occupation of cultivated land [
38]. Various regional development policies are important means for national and local governments to guide land-use changes, which are highly related to the newly added construction land quotas. At the national level, the length of railway construction is used as a proxy of regional development policy to examine the effects of national regional development strategies. As a major transportation infrastructure, railway construction is usually undertaken by state funds. It can reflect the tendency of national strategy to an extent. At the local level, city governments are generally keen to apply for the establishment of development zones, and many provincial governments tend to relax the approval thresholds for development zones, through which they can strive for more new additions of construction land. Since the 2000s, the widespread establishment of economic development zones (EDZs) from provincial level down to city level has caused the rapid expansion of construction land and occupation of cultivated land. However, whether these newly added quotas are used reasonably and efficiently is an important issue that lacks discussion. Therefore, the numbers of newly added national and provincial development zones in each province in each year are taken as proxy variables to examine their impacts on the urban–rural construction occupation of cultivated land. It is expected that the impacts of both are positive, i.e., the land in the development zone has not been used efficiently.
Table 1.
Variables and data sources for empirical model.
Table 1.
Variables and data sources for empirical model.
| | Factors | Variables | Data Sources |
|---|
| Dependent | | OCL by urban–rural construction land | National Land Survey 1996–2006 |
| Development Level | Economic Output | GDP | China Compendium of Statistics 1949–2008 |
| Economic Input | investment | China Compendium of Statistics 1949–2008 |
| Population Agglomeration | population | China Population Statistics Yearbook |
| Economic development level | income | China Compendium of Statistics 1949–2008 |
| Development Model | Model of Industrialization | secondary | China Compendium of Statistics 1949–2008 |
| tertiary | China Compendium of Statistics 1949–2008 |
| Model of Urbanization | urbanization | China National Census 2000, China 1% Population Sample Survey 2005, Zhou and Tian [48] |
| urbmodel | Ratio of rural employment to primary industry employment |
| Model of Economy | export | China Compendium of Statistics 1949–2008 |
| Policy | Regional Development Strategy | rail | China Statistical Yearbook 1997–2007 |
| Economic Development Zone | EDZ_nation | National Economic Development Zone |
| EDZ_prov | Provincial Economic Development Zone |
2.3. Data
The construction land in this study refers to four categories of settlements and industrial/mining sites as defined in National Land Classification
1, namely city, town, rural settlements, and standalone industrial and mining sites. This definition coincides with the definition of construction land in the Land Management Law
2, excluding transport and communications, water conservancy facilities, salt pan, and land for special use (
Figure 1). Urban–rural construction land can likewise be divided into urban and rural areas. The urban part includes city, town, and standalone industrial and mining sites while the rural part is rural settlements. Land-use data are drawn from the 1996 National Land Census and annual surveys on land-use changes in the following decade. Please note that the 1997 survey data reflect the result of the land-use survey conducted at the beginning of 1998 because the 1996 survey data were still processed in 1997. Afterward, the annual surveys on land-use changes provide a matrix of land-use conversions, which could reveal the structure of sources for different types of construction land, particularly for the occupation of cultivated land.
We choose the decade from 1996 to 2006 as the study period for two main reasons. First, this is the period during which EDZs rapidly expanded. The EDZs, accounting for approximately 50% of construction land growth in China, have also occupied a large amount of quality cultivated land. The drastic urbanization and urban–rural development in China have been, to a large extent, dependent on the construction of EDZs, which have thus characterized the Chinese spatial urbanization model. In this sense, EDZs warrant specific examination to understand how the gross scale and structure of construction land may influence cultivated land loss. Second, the decade from 1996 to 2006 is the longest and latest period for which comparable land-use data are available in China. Since 2007, the second Chinese national land survey has adopted a new land-use classification
3 in which most previous EDZ-dominated standalone industrial and mining sites have been respectively divided into previous construction land for cities, towns, and rural settlements. The data on mining land of standalone industrial and mining sites have been individually collected (adding up to salt pan). As a result, no indicator in the national land-use survey could reflect the construction of EDZs since 2007. Therefore, this study chooses to exclude data from the second national land-use survey and subsequent annual surveys. We only use comparable data including standalone industrial and mining sites in the decade from 1996 to 2006. In addition, the matrix of land-use conversions in 2005 and 2006 does not indicate the amount of cultivated land occupied by each type of construction land. Therefore, we use data from 1997 to 2006 to analyze the total amount of cultivated land occupied by construction land, and the data from 1997 to 2004 to analyze the structure of cultivated land loss resulting from different types of construction land. Although our selection of data does not include the most recent land-use surveys, this is the only available data to systematically and reliably reflect the growth of standalone industrial and mining sites as well as reveal how the Chinese spatial urbanization model influences the structure and mechanisms of cultivated land loss.
Explanatory variables of our analysis are collected from a wide range of sources. The demographic data are derived from the Fifth National Census in 2000, the 1% National Sample Census in 2005, and studies from Zhou and Tian [
48] in other years during the study period. The employment data are collected from the Township Enterprise Statistic Yearbook of China. Other data of explanatory variables are collected from the China Compendium of Statistics (1949–2008) and China Statistical Yearbook (1997–2007).
3. Results
3.1. Temporal Pattern
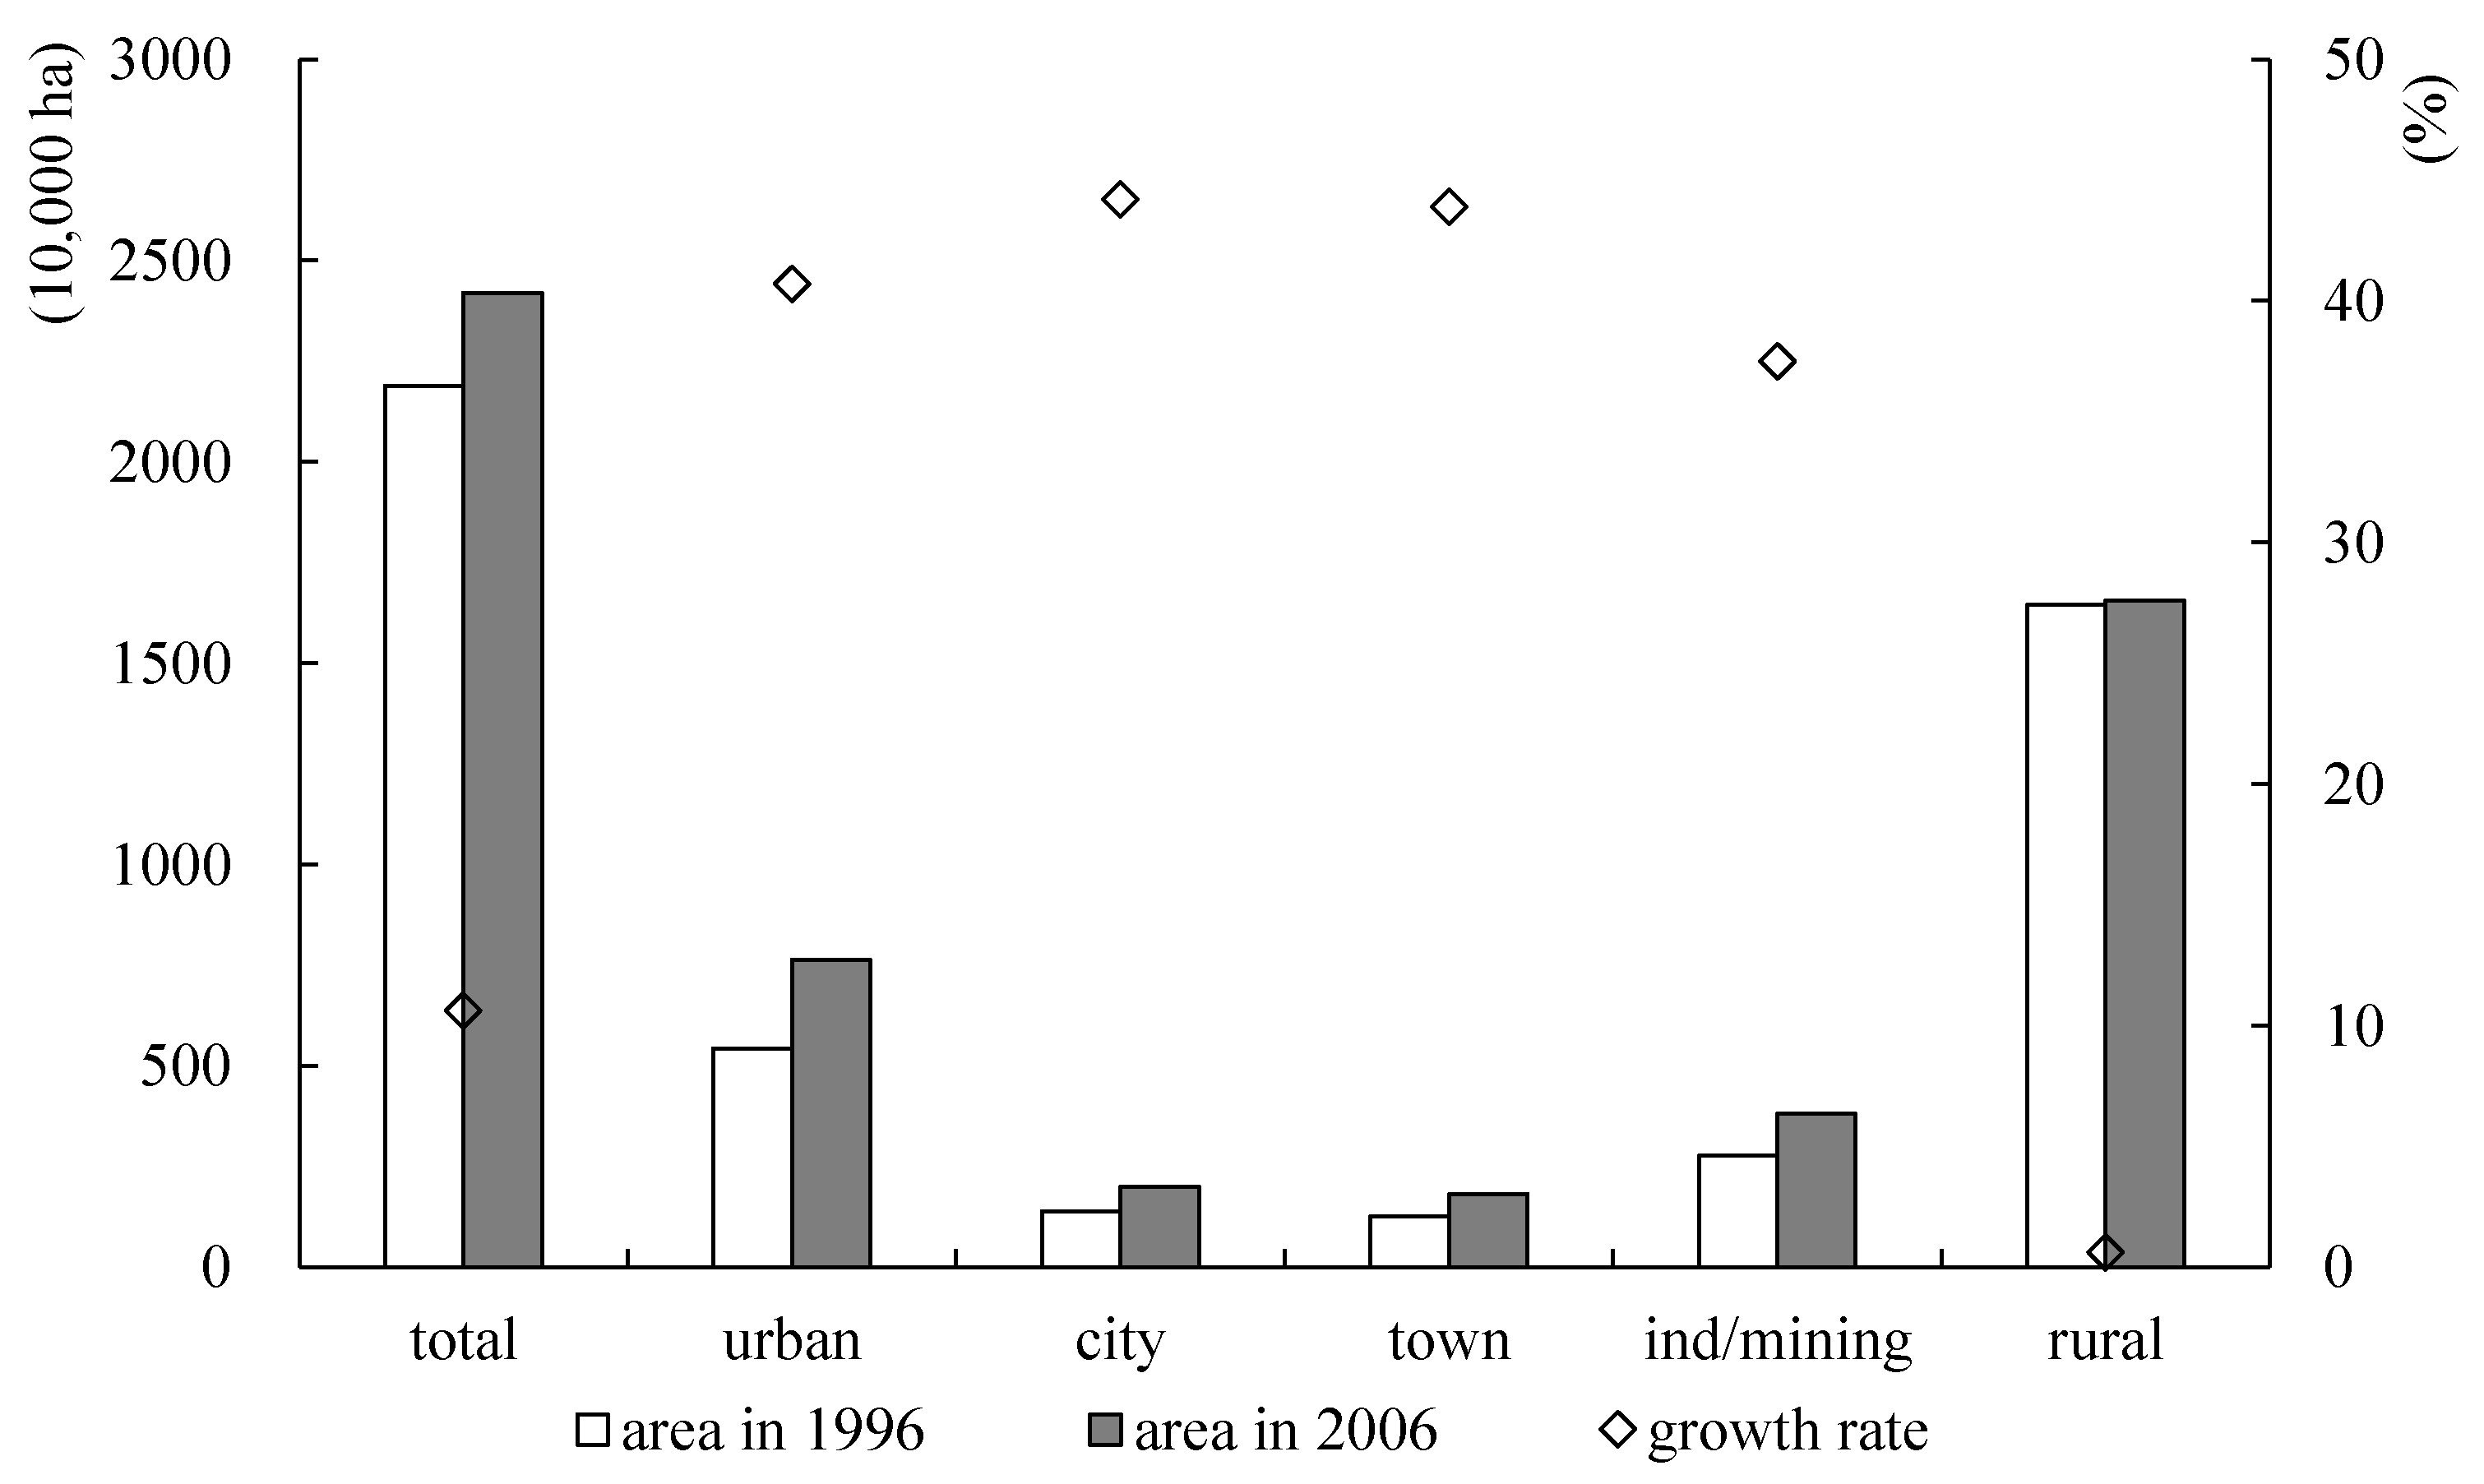
The land-use change survey 2006 revealed that China’s land use for urban–rural construction land expanded to 24.2 million hectares, 2.3 million hectares more than that from the national land survey in 1996. The expansion rate of urban–rural construction land (10.6%) was remarkably higher than that of the national population growth (6.5%) in the same period, implying the extensive expansion mode of construction land in China. The rigid demand from population growth is obviously not the only reason for China’s construction land expansion. The area of urban land increased 2.2 million hectares (40.7%) to 5.4 million hectares. This trend of rapid growth happened to all three kinds of urban land used for city, town, and industrial/mining sites, among which the industrial/mining sites accounted for nearly half of the increment, though with the lowest growth rate of 37.5% (
Figure 2). In the era of rapid urbanization with more than 10 million peasants migrating to cities and towns, China’s rural settlements continued to expand (0.1 million hectares, or 0.6%) rather than shrink, similar to what happened to agricultural land. As a result, the proportion of rural settlements in urban–rural construction land was still 68.5% (
Figure 3). Actually, the rural house sites of peasants working and living in cities and towns are mostly reserved for their basic living allowance rather than abandoned, since they will in all probability go back to their villages when they are too old to work in cities.
According to the annual land-use change survey, China’s urban land expanded continually in the recent 10 years while the land used for rural settlements fluctuated throughout this period. The increment of land used for urban settlements and industrial/mining sites decreased year by year before 2000 (
Table 2). However, this trend was reversed in 2001 when a multitude of state-level and provincial EDZs were approved and established in central cities of inland provinces. The increment of urban land remained around 300,000 hectares in and after 2002, which was about twice the average from 1997 to 2001. The share of industrial/mining sites in urban land expansion ranged widely between 18.4% and 63.8%. The proportions exceeding 50% happened mainly in 2000–2004 when the EDZs of both provincial- and state-level were approved much more frequently than before or since. More than 130 EDZs were established and/or approved by provincial or central governments every year from 2001 to 2003 (
Table 2). As a sub-strategy of the Western Development strategy, most of these newly approved EDZs were in central and western provinces as new growth poles of these regions.
Despite the increase of land used for rural settlements in the whole decade, the increment kept decreasing year by year (
Table 2). It tended to shrink in several years as well, especially after 2000. Since rural-to-urban migrant workers are now receiving much higher salaries from steadier jobs in cities and towns, an increasing number of them have decided to bring other family members together and are more eager to live in cities instead of going back to villages [
49]. As a result, it is easier for local governments to consolidate or expropriate land used for rural settlements. However, abandoning rural residential sites has remained a policy-driven passive reaction rather than an active rational choice of out-migrants. Hence, the shrinkage of rural construction land has not become a prevailing and continuous trend in rural China experiencing massive population loss. In fact, this might be the greatest challenge faced by the country in land development regulation [
38].
The quantity of OCL for urban–rural construction land can be extracted from the annual land-use change matrix. In the period 1997–2004, the expanded urban–rural construction land occupied 1 million hectares of cultivated land, sharing 70% of total expansion of urban–rural construction land (
Figure 4). Urban land expansion accounted for 78.6% of the total OCL. Industrial and mining sites tended to expand in the way of occupying more cultivated land than any other urban land classification. More than 70% of additional land used for industrial/mining sites was transferred from cultivated land. This ratio was much higher than that of land used for cities (40.0%) and towns (41.7%). As a result, industrial/mining sites occupied 524,000 hectares of cultivated land, which was more than half (51.8%) of the total or about four times of the city or town land expansion. Despite the tiny proportion (3.4%) of rural land expansion in urban–rural construction land growth, rural settlements occupied 21.4% of the total cultivated land occupied by urban–rural construction land, which was more than four times the increment of land used for rural settlements. In the era of rapid land urbanization, a large amount of land used for rural settlements is expropriated and transferred to state-owned city or town land while a larger amount of cultivated land is occupied by rural settlements and rural industries, the quantity of which is even larger than that directly occupied by cities or towns.
The temporal perspective shows that OCL for urban–rural construction land increased rapidly after the stable period of 1998–2001 (
Table 3). The proportion of urban–rural construction land transferred from cultivated land in total quantity of urban–rural expansion, however, was lower after 2001. In other words, urban–rural construction land tended to expand more in ways other than occupying cultivated land, implying the positive effect of farmland protection and relative policies in China. Although the large scale of cultivated land occupied by urban–rural construction land has attracted considerable official and academic attention, its share in cultivated land loss is actually very limited. This proportion declined from 38.8% in 1998 to 7.1% in 2003 and then increased to 24.4% in 2004. The ecological restoration and transportation infrastructure are the most important reasons for cultivated land loss in China.
Industrial and mining sites played an increasing role in occupying cultivated land, especially after 2000. The ratio of cultivated land transferred to industrial/mining sites to the total occupation of cultivated land steadily increased from less than 40% in 1998 to more than 60% in 2003 and 2004 (
Table 4). The new wave of establishing EDZs in inland China had undoubtedly shaped this trend. Newly established EDZs with plenty of land source attracted many factories in both urban and rural areas. Expansion of rural settlements, as a result, tended to be less important for cultivated land shrink. Despite a tiny downward trend, the contribution of the expansion of cities and towns to cultivated land loss was basically stable at the level of 20–30%.
3.2. Spatial Pattern
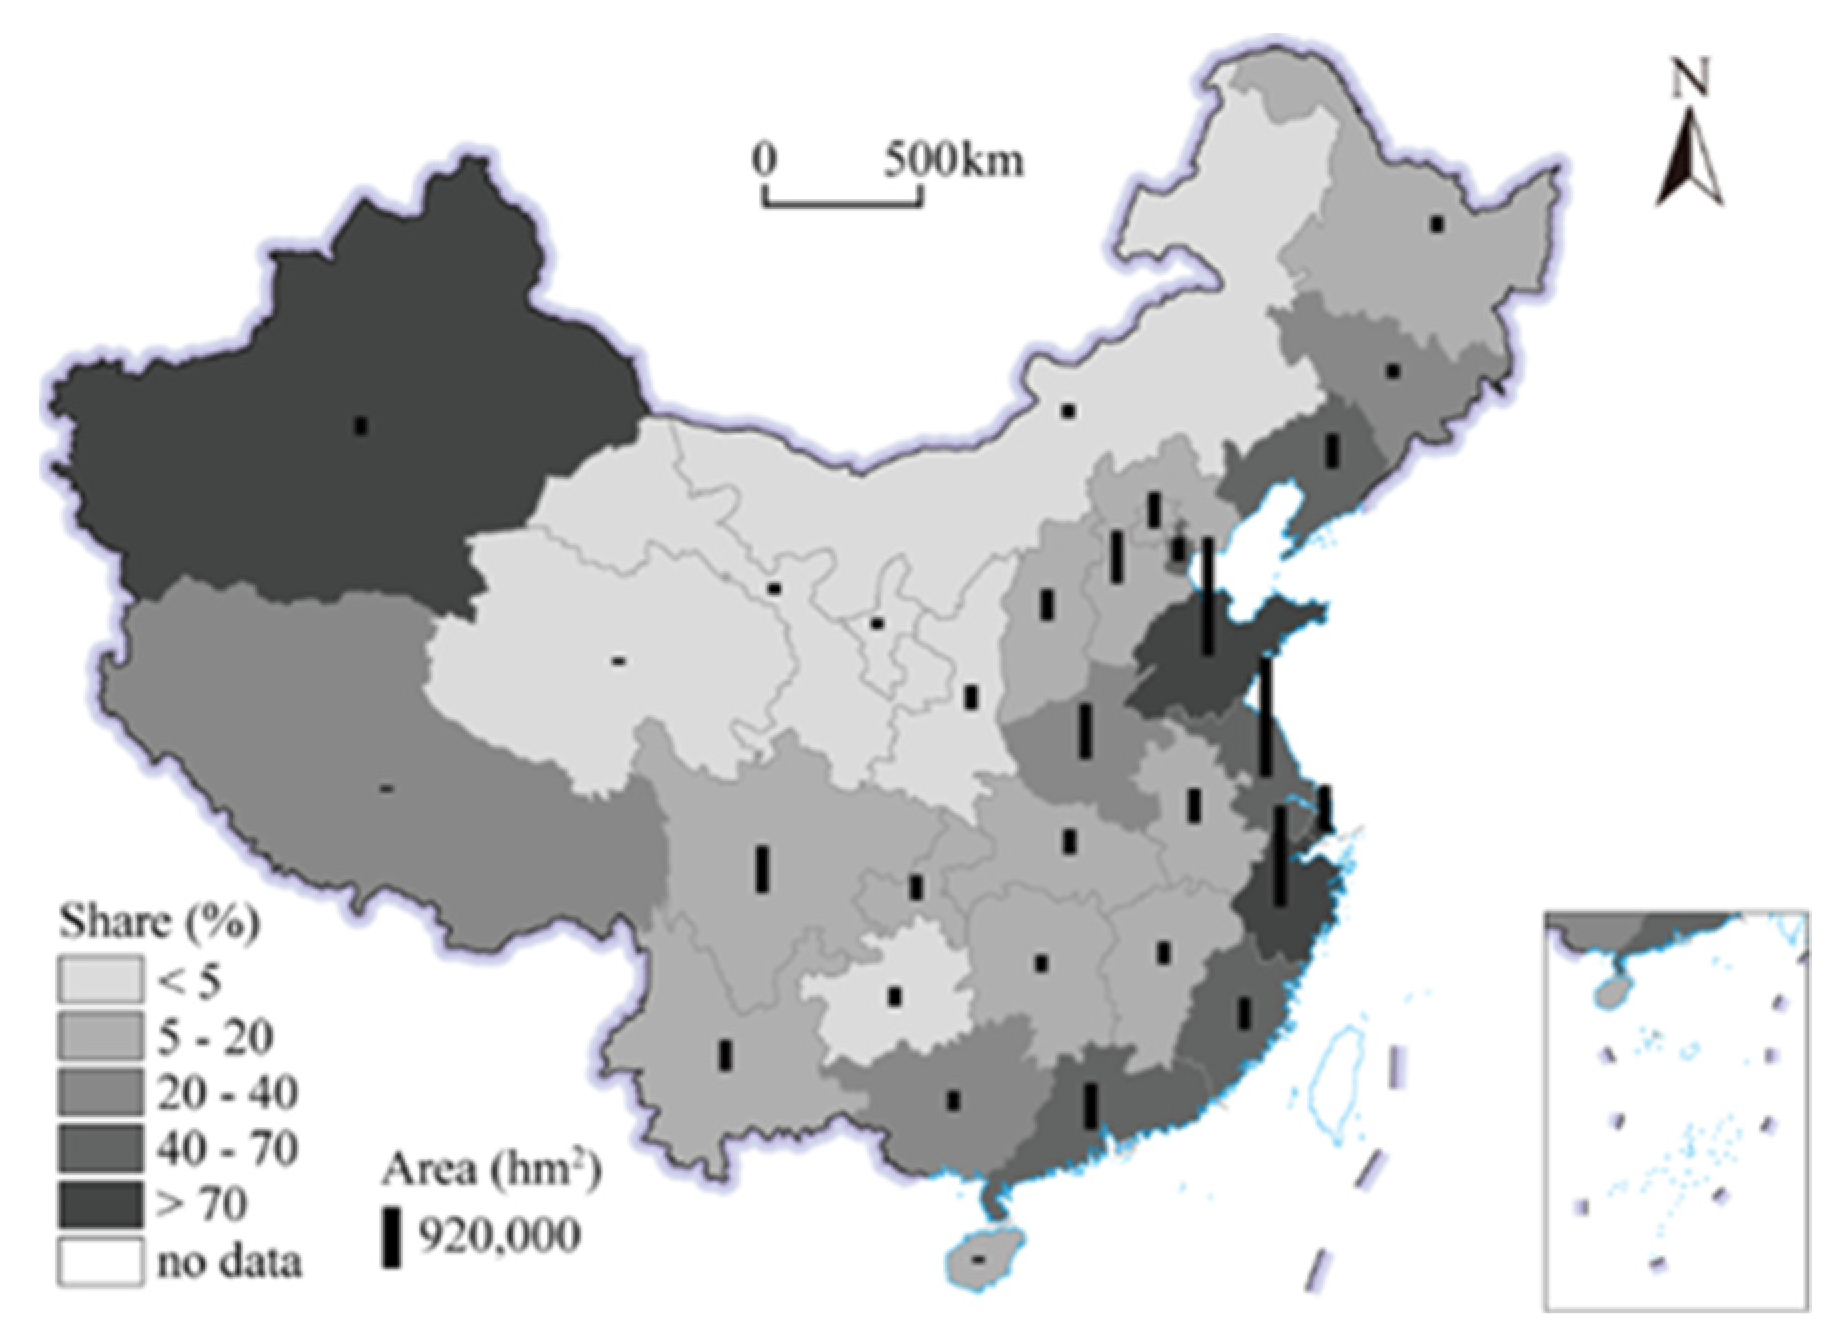
The results of land-use change survey revealed the significant spatial variability of urban–rural construction land use and its change patterns. In the vast territory of China, there are fundamental differences in natural conditions, economic location, and population size among provinces, leading to a wide range of urban–rural construction land sizes at the beginning of this study (i.e., 1996) (
Figure 5). A weak negative correlation seems to exist between the initial size of urban–rural construction land in a province and its growth rate in the study period. The largest increments of more than 200,000 hectares occurred in well-developed coastal provinces with large scales of population, such as Guangdong, Jiangsu, Zhejiang, and Shandong. Construction land increased rapidly in most coastal provinces by more than 20% and some western provinces with wide areas, such as Xinjiang and Qinghai, by more than 15%. Apart from the coast–inland division, the south–north difference was also an important characteristic of regional disparity of construction land expansion. Growth rates lower than 5% appeared in six provinces (i.e., Heilongjiang, Jilin, Shaanxi, Gansu, Henan, and Anhui), most of which are in north or northeast China, except part of Anhui province.
Compared with urban–rural construction land expansion from the perspective of spatial pattern, the occupation of cultivated land showed a more significant south–north difference (
Figure 6). Both the amounts and their share in cultivated land loss were higher in south provinces than in north ones. The coast–inland division of urban–rural expansion also existed in its occupation of cultivated land. This pattern, however, changed to a gradual declination from coastal to inland China, or gradient distribution, when we turned to OCL by urban–rural construction land and its share in cultivated land loss. There are at least three reasons for these spatial patterns of OCL by urban–rural construction land, especially for its share in farmland shrink. First, most ecological restoration projects are in northwest China, occupying a large amount of cultivated land. Second, the transportation infrastructure usually needs much more construction land in west provinces for their vast territories. Third, the development in east and south China is indeed much faster than that in west and north China, resulting in the need for a larger amount of urban–rural construction land.
3.3. Estimation Results
There are usually three estimated methods for panel data, including mixed OLS model, random effects model, and fixed effects model. These three methods are estimated successively. According to BP’s LM test results, the random effects model is better than the mixed model. Furthermore, the Hausman test results demonstrate the existence of fixed effects. Therefore, the fixed effects model is finally used, and its estimation results are shown in
Table 5.
3.3.1. Overall Results
The second column of
Table 5 reports the basic results of full-sample provinces.
First, the impact of development level on OCL is in line with expectations. Economic growth and investment are found to be the main driving factors for China’s urban–rural construction land occupation of cultivated land, whereas the impact of population growth is not significant. As expected, the more economic outputs and inputs, the more demands for space of economic activities, and the more occupation of cultivated land by construction land [
43,
44]. Although the coefficient of population growth is not significant, it may be caused by collinear relationship between economic and population factors in statistical indicators. Owing to the effects of agglomeration economy, the speed of economic agglomeration is usually higher than that of population agglomeration. The relationship between income level and farmland occupation is significantly negative, which is the same as expected. Areas with a higher economic development level can use less new construction land and occupy less arable land resources to achieve economic development and population agglomeration.
Second, the influence of development model is more complex than expected. For example, the share of tertiary industry has a significantly positive influence on OCL by urban–rural construction land while the share of secondary industry does not. Then, urbanization and rural industrialization are conducive to the intensive use of urban–rural construction land while the export-oriented development model will increase the dependence of construction land expansion on the occupation of cultivated land. Since the urban land use per capita is much smaller than the rural construction land per capita, the urbanization process of population transfer from rural areas to urban areas can effectively promote the intensive use of urban and rural land [
38].
Third, the effect of policy on OCL mainly comes from the establishment of EDZs. Although the coefficient of regional development strategy centered on major infrastructure is not significant, various EDZs play an important role in construction land expansion and its occupation of cultivated land. The establishment of national-level development zones are conducive to the intensive use of construction land, while the provincial-level development zones are a key driver of extensive land use.
3.3.2. Coast–Inland Differentiation
The sub-sample models are estimated to explore regional differentiation of influencing mechanisms. The third and the fourth columns of
Table 5 show the results of coastal provinces and inland provinces, respectively.
First, it is found that the impacts of economic growth and investment on OCL vary in different regions. Economic growth is positively related to OCL in inland regions, whereas investment is positively related to OCL in coastal regions. It can be explained by local investment structures. In coastal regions, the fixed asset investment is mainly productive, which means these investments can be directly reflected in the expansion of urban and rural settlements and have a stronger relationship with construction land expansion. However, the investment in inland regions is more concentrated in infrastructure construction. Not only can it not be directly reflected in construction land expansion, but its improvement may not be able to drive regional economic development quickly and effectively. In addition, the relationship between income level and OCL is mainly reflected in the developed coastal areas. Compared with inland areas, coastal areas have scarce land resources, higher land prices and more mature market economy. However, the development of inland areas is often achieved through low-cost supply and inefficient use of land, which pays a large price for arable land resources for limited regional development [
50].
Second, the unexpected impact of the tertiary industry in overall results can be explained by two models of coastal and inland areas. In the underdeveloped inland areas, the regions with rapidly growing tertiary industries are those that have not yet begun the industrialization process, which means their land use is terribly extensive. After entering the industrialization process, the share of the secondary industry will increase, that of the tertiary industry will decrease, and the land-use efficiency will be higher. Thus, the statistical result shows that the faster the growth of the tertiary industry, the more extensive the land use. This situation did not occur in developed coastal areas, which reveals that the land use of service industries in these regions is more intensive than that of secondary industries, thus offsetting the above effect.
Third, the land-saving effect of urbanization is weakly significant in developed coastal areas. In the process of Chinese urbanization, most rural-urban migrants do not abandon their rural homesteads, which leads to the phenomenon of double-occupation of construction land in both rural and urban areas. This phenomenon has greatly inhibited the land-saving effect of urbanization [
38]. At the same time, rural industrialization does not lead to extensive land use as expected but rather takes up less cultivated land resources, especially in coastal areas. This model is easily realized in developed coastal areas with ample investment and a mature industrial system.
Four, the efficiency of urban–rural construction land can be significantly improved due to the driving effect of high-quality investment on long-term development. Some studies have suggested that tilting the construction land quotas to the central and western regions will cause a serious waste of resources, which is not conducive to the intensive use of land. However, this study found that the national-level development zones established in inland areas have attracted high-intensity investment, which has led to population agglomeration and economic growth and promoted the level of intensive land use. However, the provincial-level development zones are mainly land enclosures in coastal provinces. The construction of these provincial-level development zones with low land-use efficiency requires more vigilance in the future.
3.3.3. Urban–Rural Differentiation
We also divide urban–rural construction land into urban and rural parts and then detect the different effects of various influencing factors. The results are shown in the fifth and sixth columns of
Table 5, respectively. There are two key findings as follows.
On the one hand, the impact of development level on cultivated land occupation is mainly reflected in urban land. The coefficient of economic growth is significantly positive in OCL by urban construction land, indicating that regional economic growth mainly influences the conversion of cultivated land into urban use [
51]. The influence of investment is the same in urban and rural construction land. The reason is that some productive investments directly prompt the expansion of urban and rural settlements and the occupation of cultivated land. Moreover, the effect of income level is significant in city where the advantage of agglomeration economy can be developed. Compared with urban expansion, the expansion of rural settlements is usually more autonomous and disorderly due to the lack of village plan.
On the other hand, the models of industrialization and urbanization play different roles in cultivated land occupation for urban and rural construction land. The effect of tertiary industry is significant in urban land because the scale of tertiary industry is relatively small in rural areas and rural construction land here only refers to the land used by rural settlement. The land-saving effect of urbanization exists in rural areas. It may be caused by the decrease in the number of rural settlements as migrants settle in cities. Rural industrialization leads to intensive land use in urban areas. The reason is that its spatial carrier is mainly township and county, which are included in urban construction land.
4. Discussion
The above estimation results not only reflected the direct impacts of economic growth and investment but also the important impacts of other factors on land-use efficiency. Existing studies have generally discussed the former while the discussion about the latter is relatively less, such as the influence of industrialization, urbanization, and policy. The analyses of these impacts contribute further to understanding driving mechanisms of cultivated land occupation by construction land. Therefore, an in-depth discussion based on the empirical findings is made as follows.
The regression results showed that the impact of the industrialization model on the intensive use of urban–rural construction land is not in line with expectations, i.e., the extensive expansion of construction land is not reflected in areas where the secondary industry is growing rapidly but concentrated in areas with a high share of tertiary industry. The sub-sample models of coastal and inland areas suggested that different regional development characteristics represented by industrial structure at different development stages have different impacts on construction land use. Hence, we can see that the areas with a higher proportion of tertiary industry are more likely to produce more waste of construction land resources. The reason for this may exist in the real estate industry. As an important fixed asset, housing has become a mode of family investment in China. The result is that a family usually has multiple houses, which lead to a high real estate vacancy rate in some regions. In addition to the real estate industry, some special tourism and leisure industries also have impacts on land-use efficiency to some extent. For example, the construction of a golf course is likely to occupy a large area of cultivated land. In any case, urban–rural construction land expansion and its occupation of cultivated land are closely related to regional industrial structure. When facing limited land resources, it is important to optimize the industrial structure and improve the efficiency of land use.
Although the impact of urbanization is relatively weak, its potential land-saving effect cannot be ignored. What distinguishes the city from the village is the agglomeration of population and economy. Urbanization can be regarded as the process of transforming land-use efficiency from low to high, and urban construction land can be efficiently used. In this context, urbanization will not lead to a waste of cultivated land. Currently, however, this effect has not become a widely effective means of saving land according to the empirical results. Only in the condition of OCL by rural construction land is the coefficient of population urbanization rate significantly negative. This result suggested that in areas where there are more township enterprises, the greater the potential for rural settlement consolidation, the less cultivated land is occupied. To extend this effect, it is necessary to improve village planning and renovate rural residential land. In most areas of China, owing to the lack of village planning, rural settlements cover a large area and have a scattered distribution, which leads to a general waste of rural construction land. The use efficiency of rural construction land needs to be improved.
The model of urbanization is crucial to the spatio-temporal patterns of urban–rural construction land expansion and its occupation of cultivated land. The unique Chinese urbanization model, which is characterized by a large amount of floating population, has brought about the growth of construction land in both urban and rural areas. In other words, Chinese urbanization fails to achieve the intensive use of land resources not only because urban construction land has expanded rapidly but because rural construction land also increased simultaneously. The floating population contributed to the double-occupation of construction land in both rural and urban areas, which is the major reason for urban–rural construction land expansion and its occupation of cultivated land. Recently, the Chinese government has introduced many policies, such connecting the increase of urban land and the decrease of rural construction land as well as reserving the rights to land use, homestead, and collective economy for floating populations. In this context, the evolving relationship between population urbanization and land urbanization remains unclear and thus requires further observation and evaluation.
Regional development policy is an important external factor affecting urban–rural construction land expansion. The quotas of new construction land and occupied cultivated land function as an important means for the state to control and guide land-use change. The allocation of these quotas has also been used to promote regional coordinated development. Therefore, all regions are competing for policy support to gain more development advantages. As the core representative of regional policies, whether national-level or provincial-level EDZs, their original intention is to promote regional economic development. However, in the actual development process, the land-use efficiency of these EDZs is greatly differentiated. The empirical results have shown the high efficiency of national-level EDZs in inland areas and the low efficiency of provincial-level EDZs in coastal areas. It suggested that EDZs have more important significance for inland areas, but such significance does not exist in coastal areas and even causes a waste of land resources. Considering this positive effect in inland regions, it is believed that there will be more relevant policies supporting the development of EDZs to promote regional coordinated development, and then attract more companies and population to move from coastal regions to inland regions. These factors will jointly drive the growth of urban–rural construction land in inland areas.
In addition, land-use classification methods are also worth discussing. The estimation results of all samples revealed leading impact of investment on construction land expansion and its occupation of cultivated land. According to sub-sample results, however, the impact is not significant in inland regions. This result suggested the necessity of excluding transportation, water conservancy, and other regional infrastructure land from construction land and analyzing the driving factors of urban–rural construction occupying cultivated land separately, which can more clearly demonstrate the internal mechanism of regional development and construction land expansion. In the Chinese land-use classification system, construction land usually includes the land used by settlements, industrial/mining sites, transport, communications, and water conservancy facilities. It contains various types and obscure the real influence mechanisms. The redefinition of urban–rural construction land in this paper shows its advantage in understanding influence mechanisms and provides a basis for reclassifying land-use types.
5. Conclusions
This paper investigates the spatio-temporal patterns of urban–rural construction land expansion and its occupation of cultivated land in China during the decade from 1996 to 2006 based on national land-use survey and interprovincial panel data. It further discusses the driving forces and mechanisms of cultivated land occupation by econometric models. The major findings of this paper are as follows.
First, urban construction land has expanded rapidly since the 21st century. The EDZs have contributed most to the occupation of cultivated land. Among the four types of urban–rural construction land, standalone industrial and mining sites continuously accounted for the highest proportion and the largest amount of cultivated land occupation. Specifically, over 70% of newly established standalone industrial and mining sites were converted from cultivated land, exceeding half of the total urban–rural construction land occupation. The expansion of cities and towns depended less on multiple sources of land, which reflected the positive impacts of China’s strictest institutions on cultivated land protection.
Second, economic development and investments for basic infrastructure are dominant driving forces for urban–rural construction land expansion and occupation of cultivated land. Empirical evidence indicated that the growth of economic outputs and investments prior to population agglomeration dominated the spatio-temporal patterns of construction land expansion and its occupation of cultivated land. Furthermore, basic infrastructure construction was the main driver for construction land expansion in inland regions, but its impacts on promoting regional economic development and population agglomeration were limited. From the long-term perspective, economic development is the fundamental approach to promoting the intensive use of land resources and cultivated land conservation.
Third, different stages of regional development witnessed different mechanisms of cultivated land occupation, which therefore required disparity in the solutions to the intensive use of land resources and cultivated land conservation. Specifically, industrial development in inland regions is beneficial to intensive land use, but the development of the service sector is needed more in the later period of industrialization. In addition, inland regions still need a centralized model of intensive industrialization and urbanization. In particular, the efficient management of national EDZs play a key role in intensive land use and cultivated land conservation. In coastal regions where a more sophisticated system of industries and policy instruments has been in place, rural industrialization is conducive to improving intensive land use and cultivated land conservation; provincial EDZs, instead, could become a tool that local governments use for land expansion.
This study also has some limitations that need further discussion and examination. On the one hand, the data used in the study could not reflect the latest land-use development owing to our requirements on data comparability and focus on EDZs. Although the overall trends of land-use change are stable in recent years with rapid urbanization, regional disparities would widen in future [
52]. Further studies could develop new methods to convert data collected under different statistical calibers and thus provide detailed insights into the more recent status of cultivated land occupation. On the other hand, interprovincial panel data cannot reveal more details of the spatial disparity in land-use changes. Future studies could discuss the activities of municipal governments, enterprises, and individuals, all of which may influence the urban–rural construction land occupation of cultivated land because multi-level management is inevitably involved in land development. In addition, the model established in this study mainly indicates the impacts on the occupation of cultivated land by the explanatory variables under the Chinese background. Future improvement on the models could help us develop a more profound, comprehensive understanding of land-use change worldwide.


