Abstract
The impact of urban rail transit on housing prices has attracted the extensive attention of scholars, but few studies have explored the heterogeneous impact of rail transit on housing prices with different price levels. To solve this problem, we adopted the hedonic price model based on ordinary least squares regression as a supplementary method of quantile regression to study the heterogeneous impact of the Chengdu Metro system on low-, middle-, and high-priced housing. The result shows that the housing price rises first, then falls with the distance from the housing to the nearest subway station. Besides, the influence of transportation accessibility on low-, middle-, and high-priced housing decreases progressively. This research can provide a reference for the government’s transportation planning and decision-making.
1. Introduction
In order to solve the problems of traffic jam and air pollution, many countries begin to invest in the construction of urban rail transit. However, the construction and operation of rail transit involves a high cost, and it will take a long time to recover the cost. Especially in developing countries, such as China, constructing rail transit will undoubtedly increase the government’s financial burden and is not conducive to the sustainable development of rail transit. Therefore, it is crucial to address this funding constraint. The value acquisition theory suggests that, if rail transit construction improves the accessibility of housing projects in the vicinity, it will increase the value of the surrounding land [1]. The government may take measures, such as joint development, with the developer or levying betterment tax to recover the increase in this part of the value to make up the cost of rail transit investment and promote the reinvestment of rail transit, to achieve the sustainable development of rail transport. However, there is no consensus among scholars on the impact of rail transit on real estate values. At the same time, in Hong Kong and Chongqing, two cities in China, the government imposed betterment tax to recover the real estate premium generated by rail transit, and other Chinese cities have not fully applied the value capture measures. Therefore, to achieve the sustainable development of rail transit construction, it is necessary to further explore the impact of rail transit accessibility on housing prices to provide evidence and reference for the acquisition of this part of the value.
However, in previous studies, most scholars found that the relationship between the proximity of rail transit systems and house price is linear [2,3], and that house prices decrease with the increase in distance from a rail transit station, but in practice, there is a difference between the positive factors, such as the distance from the rail transit station and the accessibility of the residential area, and the negative factors, such as the noise and congestion at the station, the relationship between housing price, and distance between housing and rail transit station, may be non-linear. Moreover, most studies do not consider the differences in the degree of dependence and preference for public transport among people of different income levels, which reflect the heterogeneous effects of rail transport on housing at different price levels. Therefore, this article takes the subway system in Chengdu, China, as an example to discuss the following issues:
What is the impact mechanism of subway proximity on housing prices?
Does the metro have a different impact on housing at different price levels?
The main contributions of this study are as follows. First, it discusses the nonlinear relationship between rail transit proximity and housing prices in depth. Second, it estimates the hedonic price model by quantile regression to explore the heterogeneity of low-, medium-, and high-priced housing in the vicinity of the metro system. In addition to introducing housing to the nearest subway station distance, a continuous variable to explore the relationship between rail transit and housing prices, we adopt the two strategies of transforming the continuous variable into a virtual variable and introducing the quadratic term of the variable to study the nonlinear relationship between the rail transit proximity and the housing price. In addition, the hedonic price model based on ordinary least squares (OLS) is usually used to study the impact of rail transit on housing prices, but OLS regression has some limitations in its interpretation of this problem. On the one hand, OLS reveals the average effect on all price levels of housing, which does not show the heterogeneity of the metro system on different price levels of housing. On the other hand, OLS regression is sensitive to outliers and strict to error terms. In contrast, quantile regression can reveal the heterogeneity of the impact of the subway on housing prices and become more robust and effective when observing outliers in the data. Therefore, this study will use quantile regression to estimate the hedonic price model of urban housing to analyze the heterogeneity of urban rail transit on different price housing.
The structure of this paper is as follows. The second section reviews the relevant literature; the third section describes the data and model; the fourth section gives the research results and discusses them; and, finally, the conclusion is drawn.
2. Literature Review
There has been extensive research on whether the construction of rail transit has a value-added effect on real estate. However, the academic research on the impact of rail transit on residential property value is inconsistent. Most studies show that urban rail transit does have a positive impact on housing prices. Dubé et al. (2013) found that the availability of trains increased the accessibility of nearby homes, which, in turn, increased their prices [4]. Zhang, Li, and Duan (2012) took Beijing Metro Line 1 as an example, and found that the impact of rail transit on suburban housing prices was higher than that of central area, and the scope of the impact was broader [5]. Su et al. (2015) conducted research in southwest Beijing and found that urban demand was more sensitive to rail transit in the short term of before and after the opening of rail transit, while in the long term, rail transit helped to increase the demand for housing in the suburbs [6]. Studies carried out by other scholars in China’s first-tier cities, such as Beijing [7,8], Guangzhou [9], and Shenzhen [10], as well as cities in developed countries, such as New York [11] and Naples [12], have also demonstrated the influence of rail proximity on housing prices. For example, Yen et al. (2018) argued that the highest premium effect of rail transit occurred after the firm financial commitment on rail transit construction, but that the premium would decrease during construction and operation [13]. In addition, the announcement of the Full Funding Grant Agreement on rail transit construction can also significantly promote the development of the real estate market. Cao and Porter-Nelson (2016) found that the announcement of the Full Funding Grant Agreement tended to increase the number of building permit by about 24% and the value by 80% [14]. However, some scholars have found that rail transit negatively impacts residential property. Q. S. Pan H. et al. (2014) found that the metro may have negative externalities, such as traffic congestion, public safety, noise, and pollution, which may cause a negative premium to the surrounding housing [15]. Dai et al. (2016) found a similar pattern that, within 200 m of the transfer station, rail transit has a negative impact on housing prices, because the transfer station traffic congestion, noise and other negative factors have a greater impact [16]. A small number of scholars claim that rail transit has no impact on the value of residential property. Camins-Esakov and Vandegrift (2018) found that the extension of the light rail did not have any impact on the value of the surrounding property [17]. Based on the difference in the influence of urban rail transit on housing prices, this paper will take Chengdu Metro as an example to explore the influence of urban rail transit on housing prices.
However, while most scholars focus on the average effect of rail transit accessibility on housing prices, few scholars focus on the impact of transport accessibility on housing prices at different price levels. The hedonic price model based on OLS regression is a powerful tool used by scholars to analyze the impact of rail transit on house prices, but this method reveals the conditional expectation relationship between rail transit and house prices, that different income groups have different preferences and dependence on public transport, and the impact of rail transit on different priced housing is heterogeneous. Forouhar and Hasankhani (2018) found that subways have a positive premium on residential property values in low-income neighborhoods and a negative premium in high-income neighborhoods [18]. Dziauddin (2019) reaches a similar conclusion [19]. These studies show that low- and middle-income people are more dependent on rail transit, which implies the heterogeneity of rail transit’s impact on housing at different price levels. However, the empirical research on the heterogeneity of low-, middle-, and high-priced housing is not enough, and the quantile provides an effective way to reveal the heterogeneity of different priced housing. In recent years, Lin et al. (2014) and L. Zhang (2016) have applied this method to study the real estate industry [20,21], but there are still very few studies about the impact of rail transit on real estate value. Wang et al. (2016) used quantile regression to investigate the effect of Shanghai Metro stations on rent, and found that the rail transit premium did not differ significantly at different rent levels [22]. With quantile regression research, Wen et al. (2018) found that the metro impact on high-end residential areas is larger than the mid-end residential area [23], while Mathur (2020) came to the opposite conclusion that, as the quartile increases, the price premiums decrease [24]. However, due to the different levels of economic development and social background, the impact of rail transit on housing prices is different, and previous studies in other cities are not universal. At the same time, there is no study to show whether the impact of urban rail transit on different price levels of housing is the same. Therefore, to fill this research gap, this paper will use the quantile regression-based hedonic price model to explore the heterogeneity of low-, medium-, and high-cost housing in the Chengdu Metro system.
3. Data and Models
3.1. Research Area
This paper mainly studies the influence of Chengdu Metro Line 1, Line 2, Line 3, Line 4, Line 7, and Line 10 on housing prices. As the Chengdu Metro developed recently, Line 1 opened on 27 September 2010, becoming the first metro in Chengdu. Of the subway lines selected, Line 7 was the latest to open, opening on 6 December 2017. These subway lines have been in stable operation for at least 2 years since their opening, and their impact on housing prices of residents along the lines has not fluctuated much. It is helpful to reveal the real premium effect of urban rail transit on housing prices.
The lines cover 10 districts, including the Jinjiang District, Wuhou District, Qingyang District, Chenghua District, Jinniu District, Pidu District, Wenjiang District, Xindu District, Longquanyi District, and Shuangliu District, with 165 stations and mileage totaling 191.3 km. These areas include most of the dwellings in Chengdu, and the impact of urban rail transit on the city real estate market can be estimated by obtaining housing information along the subway.
3.2. Variables
When using the hedonic price model, it is important to select explanatory variables. By reviewing the relevant literature, the variables used by scholars to study the impact of rail transit on urban housing prices are sorted [25,26,27,28,29]. Table 1 shows the traffic location variables and other location variables, neighborhood variables, and building structure variables, and it lists the name of each variable, unit, meaning, and the symbol of the expected impact of each variable.

Table 1.
Variable unit, description, and symbol of expected influence.
The characteristics of traffic location reflect the condition of public transport facilities around the housing. In this paper, we selected the straight distance (d_subway) from the house to the nearest subway station and transformed it into a virtual variable (d1–d6). In addition, this article also selected the straight distance (d_train) from the house to the railway station (Chengdu East station) and the straight distance from the house to the nearest bus station (d_bus). Main variables of interest in this study are d_subway and d1–d6, and the other characteristic variables are the control variables.
Other location characteristics reflect the location of the house in the city. The variable chosen in this paper is the straight distance (d_cbd) from the house to the traditional central business district (with the reference of the Chengdu International Financial Center). We introduce the 13 districts covered by the house (Xindu District as the reference) as the regional variable. The policy affects the High-Tech Zone, the High-Tech West Zone, and the Tianfu New Zone, which were set up for the country or region. Thus, we introduce regional variables to control the influence of different policies and public services on their fixed effects.
Neighborhood features reflect the convenience facilities and living environment around the house. The variables selected in this paper are the distance from house to the nearest park (d_park), to the nearest grade III, Class A hospital (d_hospital), the distance to the nearest primary and secondary school (d_school), and the distance to the nearest shopping mall (d_supermarket).
3.3. Data Source
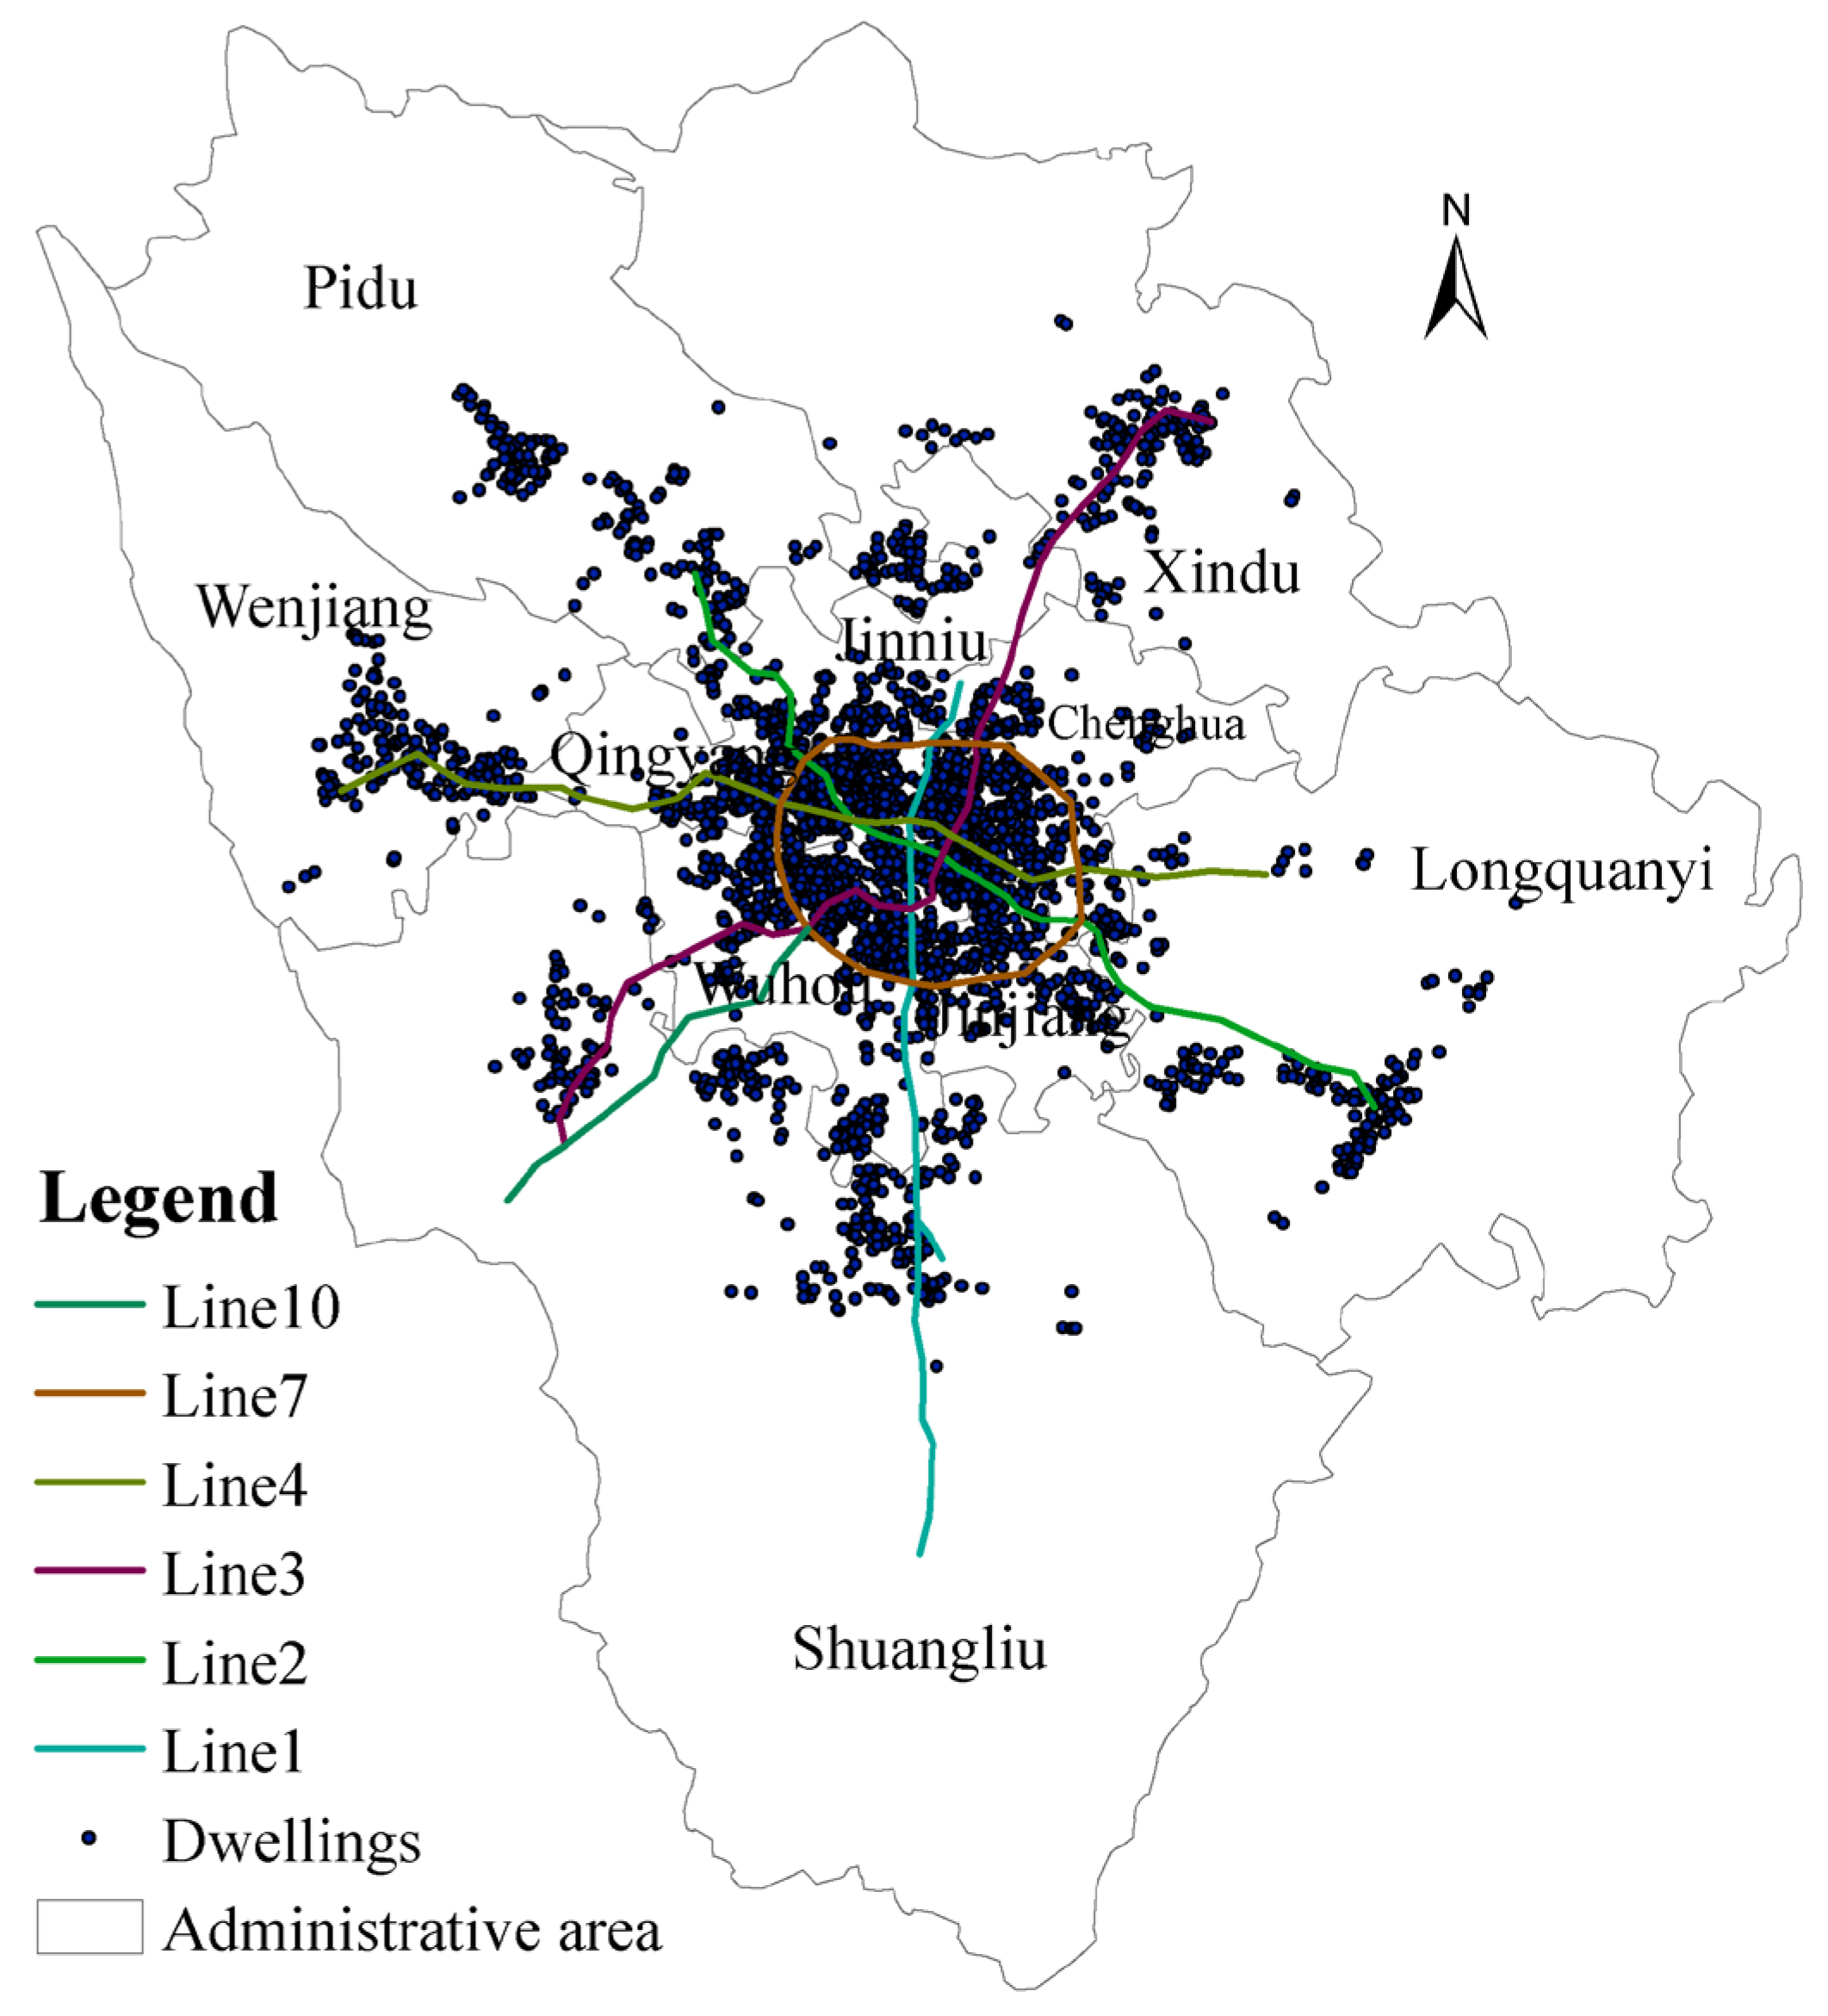
The data are taken from the website Lianjia, the Gaode Map, and the GIS platform. The study used a residential house as the basic unit of analysis, located in the residential areas of each district covered by the subway network. This article used housing-related data obtained through the network crawler extracted from lianjia.com, a leading website and heavy vertical real estate service platform in China that integrates real estate information searches, product research and development, and big data processing and service standards. Many Chinese scholars use the data from this website to illustrate its usefulness for research [30,31]. However, considering that the impact of rail transit on single-family houses, villas, and commercial houses are different, the collected data set excludes samples of single-family houses and villas. At the same time, the new house information of this website lacks a series of structure attribute information, and the new housing prices are easily affected by macroscopic policy. Therefore, the data collected in this research are limited to secondhand house-related information. This paper will only consider the secondhand commercial houses with seven or more floors to rule out the influence of elevators on house prices. This paper obtained a data set of valid housing information from a total of 22,507 residents after eliminating the missing samples of related attributes and other samples that did not meet the research requirements. The data obtained in this paper are cross-section data until 20 December 2019, so in the subsequent opening of Line 5, Line 10 phase II and the tram Rong 2 line are not in the scope of this study. Figure 1 shows the distribution of the housing sample in relation to the location of the subway.
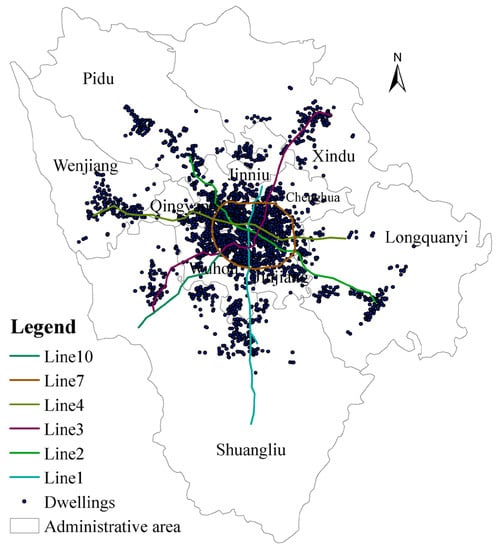
Figure 1.
Spatial distribution of subway lines and housing samples in Chengdu.
The detailed address information shown in the housing sample is on the Gaode Map API, China’s leading provider of digital map content, navigation, and location services, to obtain its latitude and longitude coordinates. POI information around the housing from the Gaode Map API, such as subway stations, supermarkets, schools, hospitals, bus stations, and so on, and the platform Acrgis presents the above information. Arcgis can measure the straight distance from residential housing to the nearest subway stations, supermarkets, primary and secondary schools, parks, hospitals, and other locations. Table 2 describes the basic statistics for each variable.
Table 2.
Descriptive information for variables.
3.4. Methods and Models
This paper establishes a hedonic price model using cross-sectional data to study the value-added effect of the metro on real estate prices. The hedonic price model holds that real estate is composed of many different characteristics and that the price of real estate is determined by the price implied by all the characteristics. Thus, the prices implied by the various factors can then be obtained, and the variables selected in Table 1 act as the basis for further estimation. Furthermore, to explore the impact of rail transit accessibility on the heterogeneity of housing at different price levels, this paper adopts estimates using the quantile regression-based hedonic price model.
- Hedonic price model based on OLS regression
There are three forms of hedonic price model based on OLS regression: the linear form, the semi-logarithmic form, and the all-logarithmic form:
Equation (1) can only reflect the house price and the price relations of these characteristics, but it cannot reflect the marginal effect or effectively express the marginal contribution of these characteristics to the house price. Equations (3) and (4) require that the explanatory variable must not be 0. Equations (2) and (4) use natural logarithms as dependent variables to reduce the size of the original dependent variables and, thus, to improve the heteroscedasticity. Therefore, to better express the economic meaning of the parameters and improve the heteroscedasticity, this paper uses the semi-logarithmic model, as shown in Equation (5). The model introduces metro-related variables to analyze the comprehensive effect of the metro on housing prices. Equation (5) is as follows:
P is the house price; lnP is the natural logarithm of the house price; d_subway is the straight distance from the house to the subway station; and represent a series of other characteristic variables of the house; is the constant term; , , and are the parameters to be estimated, which represent the percentage increase in the price of a house for each additional unit of the independent variable; and is the error term.
To explore the non-linear relationship between the transportation accessibility and the house price, this paper also discusses and analyzes the secondary term of the distance from the house to the subway station and the virtual variable of the distance from the house to the subway station. Equations (6) and (7) are designed as follows:
where represents the virtual variables of the distance between the house and the subway station, with a reference of more than 1500 m. Virtual variables are set every 250 m as an interval. The other variables have the same meaning as in Equation (5).
- 2.
- Quantile regression
The impact of the subway on housing prices may vary greatly vary depending on the level of housing prices. It is difficult to distinguish the heterogeneity of the influence of the subway on the housing price under different housing prices by the traditional OLS regression. Therefore, to understand the different price level of the subway on the heterogeneity of housing prices, based on the above model, this paper selects quantile regression to test the heterogeneity. Equations (8) and (9) are designed as follows:
where refers the percentile of the house price distribution; is the constant term; and , , , are the parameters to be estimated. Other variables have the same meaning as Equation (5).
4. Impact Mechanism
In Table 3, Equations (5)–(7) are estimated by least squares regression and robust standard error. After the ordinary least squares regression (OLS), the results of the white test show that the OLS regression does not satisfy the hypothesis of the same variance. To guarantee the robustness of the estimation coefficients, the heteroscedasticity robust standard error estimator is used to re-estimate the model. Therefore, the results reported in Table 3 are based on least squares regression and a robust standard error.
Table 3.
Results of ordinary least squares regression.
To explore the non-linear relationship between the rail transit proximity and the house price, this paper adopts the strategies of changing the variable ln(d_subway) into the virtual variable and adding the quadratic term of the variable. The results reported in Table 3 show that the of the three models is above 0.6, indicating that the explanatory power of the selected variables to the dependent variable is above 60%, and that the model has a good fitting degree. The significance level of the model is below 1%, showing the validity of the model. In addition, the coefficients of most variables in these three models are significant at the level of 5%.
First of all, the proximity of the subway has a significant positive effect on housing prices. The results of Equation (5) showed that the coefficient of variable d_subway was −0.032, and its significance level was less than 1%. This suggests that, for every 1% reduction in the distance between a house and a subway station, prices would fall by 3.2%. This is consistent with previous studies [32], which have shown that the proximity of the subway improves the accessibility of surrounding areas, saves the travel time of residents, and increases the availability of public services, therefore increasing housing prices. The proximity of metro stations will also attract more investment, leading to higher land values and greater availability of public services.
Secondly, dwellings too close to the subway station will also be affected by negative factors and lead to discounts. The results of Equation (6) show that the d1 coefficient is not significant, indicating that housing prices are not affected by metro proximity in the range of 0–250 m; however, in the range of 250–500 m, its housing prices are 7.8% higher than those beyond 1500 m (coefficient of d2 is 0.078, with a significance level of less than 1%), indicating a premium for housing close to the metro. In fact, this is due to the proximity to the subway station, where noise, air pollution, and safety problems caused by the traffic flow around the station can reduce the desire of urban residents to buy, resulting in lower housing prices [16]. With the influence of negative factors, the coefficient of d1 is not significant.
The relationship between housing price and distance to subway station presents an inverted U shape. Both the results of Equations (6) and (7) show a similar trend: an inverted U shape. This means that, with an increase in the distance to subway station, housing price rises first and then falls. In Equation (6), the coefficients of d1–d6 increase first and then decrease (although d1 is not significant), while the coefficient of d2 is the largest. In other words, the housing price premium is the highest in the range of 250–500 m from the subway station. The coefficients of d3–d5 are 0.057, 0.039, 0.015, respectively, decreasing gradually, which means that, as the distance continues to increase, the premium decreases. The coefficient of d6 becomes less significant, indicating that more than 1,250 m from housing to the subway station, the effect of subway proximity on housing price becomes less significant. To make the relationship between subway distance and house price more intuitive, we also explore Equation (7) to verify the Inverted U relationship between house price and the distance to the subway station.
5. What Is the Difference of the Premium Effect at Different-Price Levels?
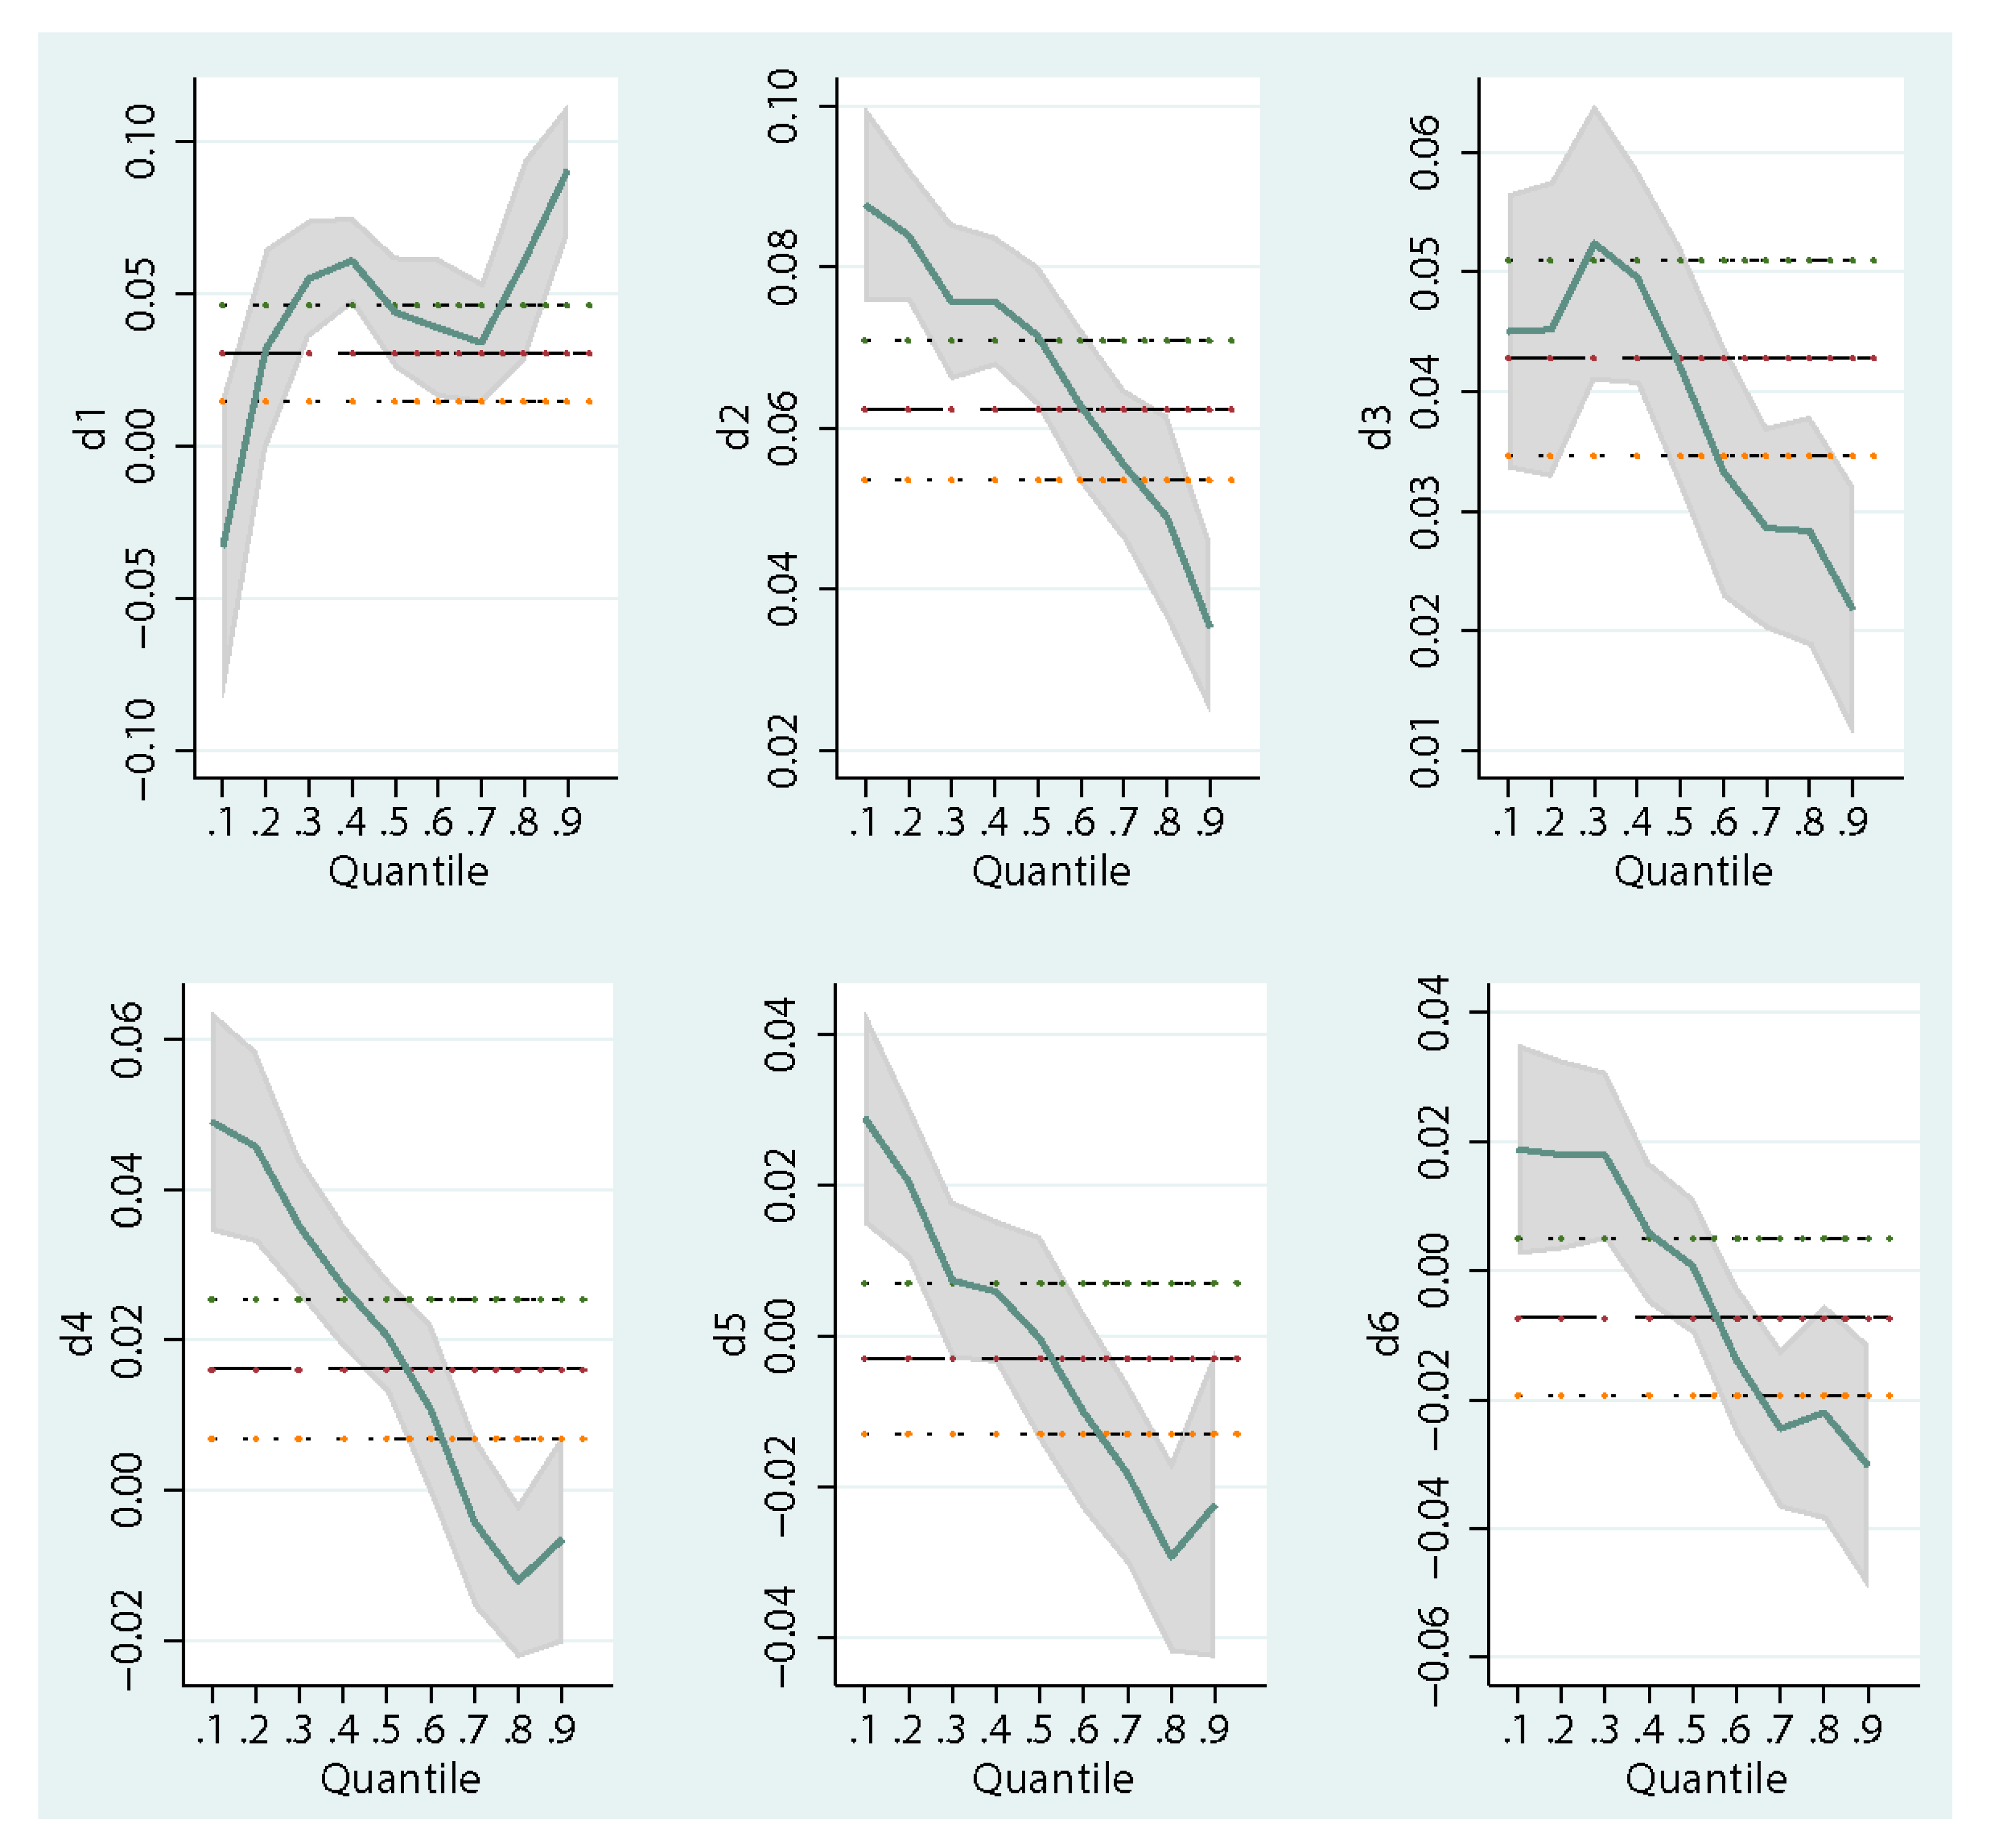
The estimators of regression coefficients under different quantiles show the influence of explanatory variables on dependent variables at different levels. In this study, quantile regression estimates show the impact of housing characteristics on housing prices at different levels. To study the influence of metro accessibility on low-, middle-, and high-priced housing, this paper explores the influence of metro accessibility on different quantile housing price distribution by quantile regression. This paper makes a quantile regression for the house prices under the 10–90% quantiles of Equations (8) and (9) to show the significance of the coefficient difference. As shown in Figure 2 and Figure 3, for the variables d1–d6, as well as ln(d_subway) and [ln(d_subway)]^2, their respective coefficients show significant differences in different quantiles, which indicates that the impact of rail transit on different levels of housing prices shows a certain regularity. To show the heterogeneity effects of rail transit on low-, medium-, and high-priced housing, this paper presents the results of the 25th, 50th, and 75th percentile regression models (QRM), respectively. The results are shown in Table 4.
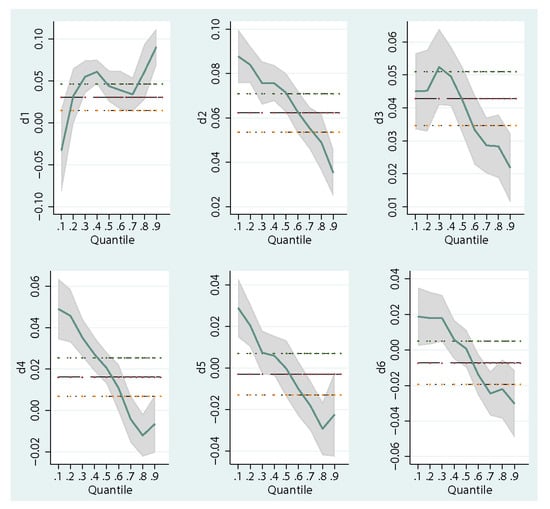
Figure 2.
Changes of coefficients of d1–d6 in different quantile regression results in Equation (8).
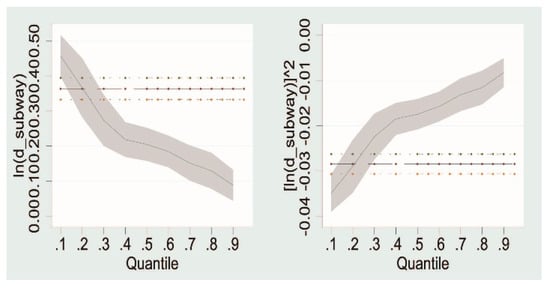
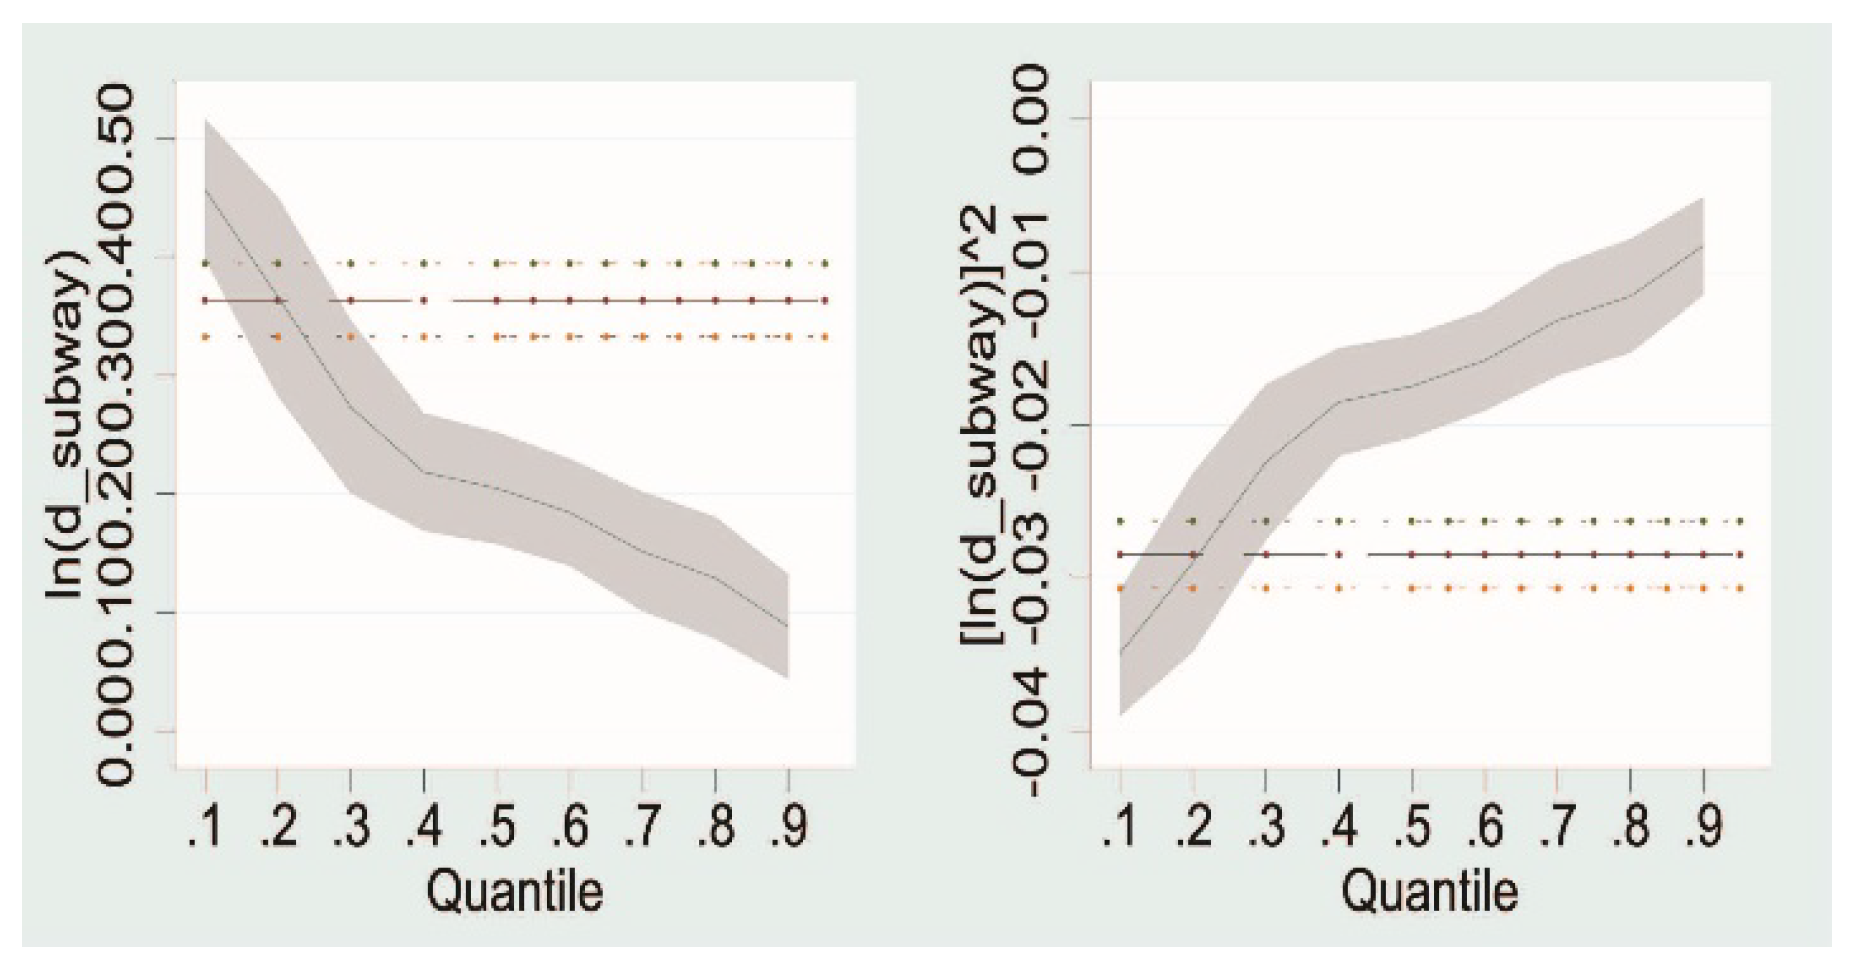
Figure 3.
Changes of coefficients of ln(d_subway), [ln(d_subway)]^2 in different quantile regression results in Equation (9).
Table 4.
Quantile regression results.
The results of quantile regression are similar to those of least squares regression. The results of Equation (8) quantile regression show that the coefficients of d1–d6 show a consistent trend, and that the values of d1–d6 increase first, then decrease. In Equation (9), the sign of the regression coefficient of each quantile is the same as that of the least squares regression, which indicates that the relationship between housing price and the distance from housing to the subway station is in an inverted U shape, further showing that the impact of rail transit on housing prices is a combination of positive and negative factors.
The regression results under each quantile also showed significant differences, where metro proximity has a greater impact on the scope of low-and medium-price housing. For the 25th percentile and 50th percentile, coefficients of d1–d6 are significantly positive at the 1% level, so the impact of rail on house prices can reach 1500 m. However, for the 75th percentile, the coefficients of d5 become insignificant, and the coefficient of d6 is significantly negative, so the impact of rail transit on high-cost housing is 1000 m, which indicates that the impact of rail transit on low-cost housing takes place in a larger range.
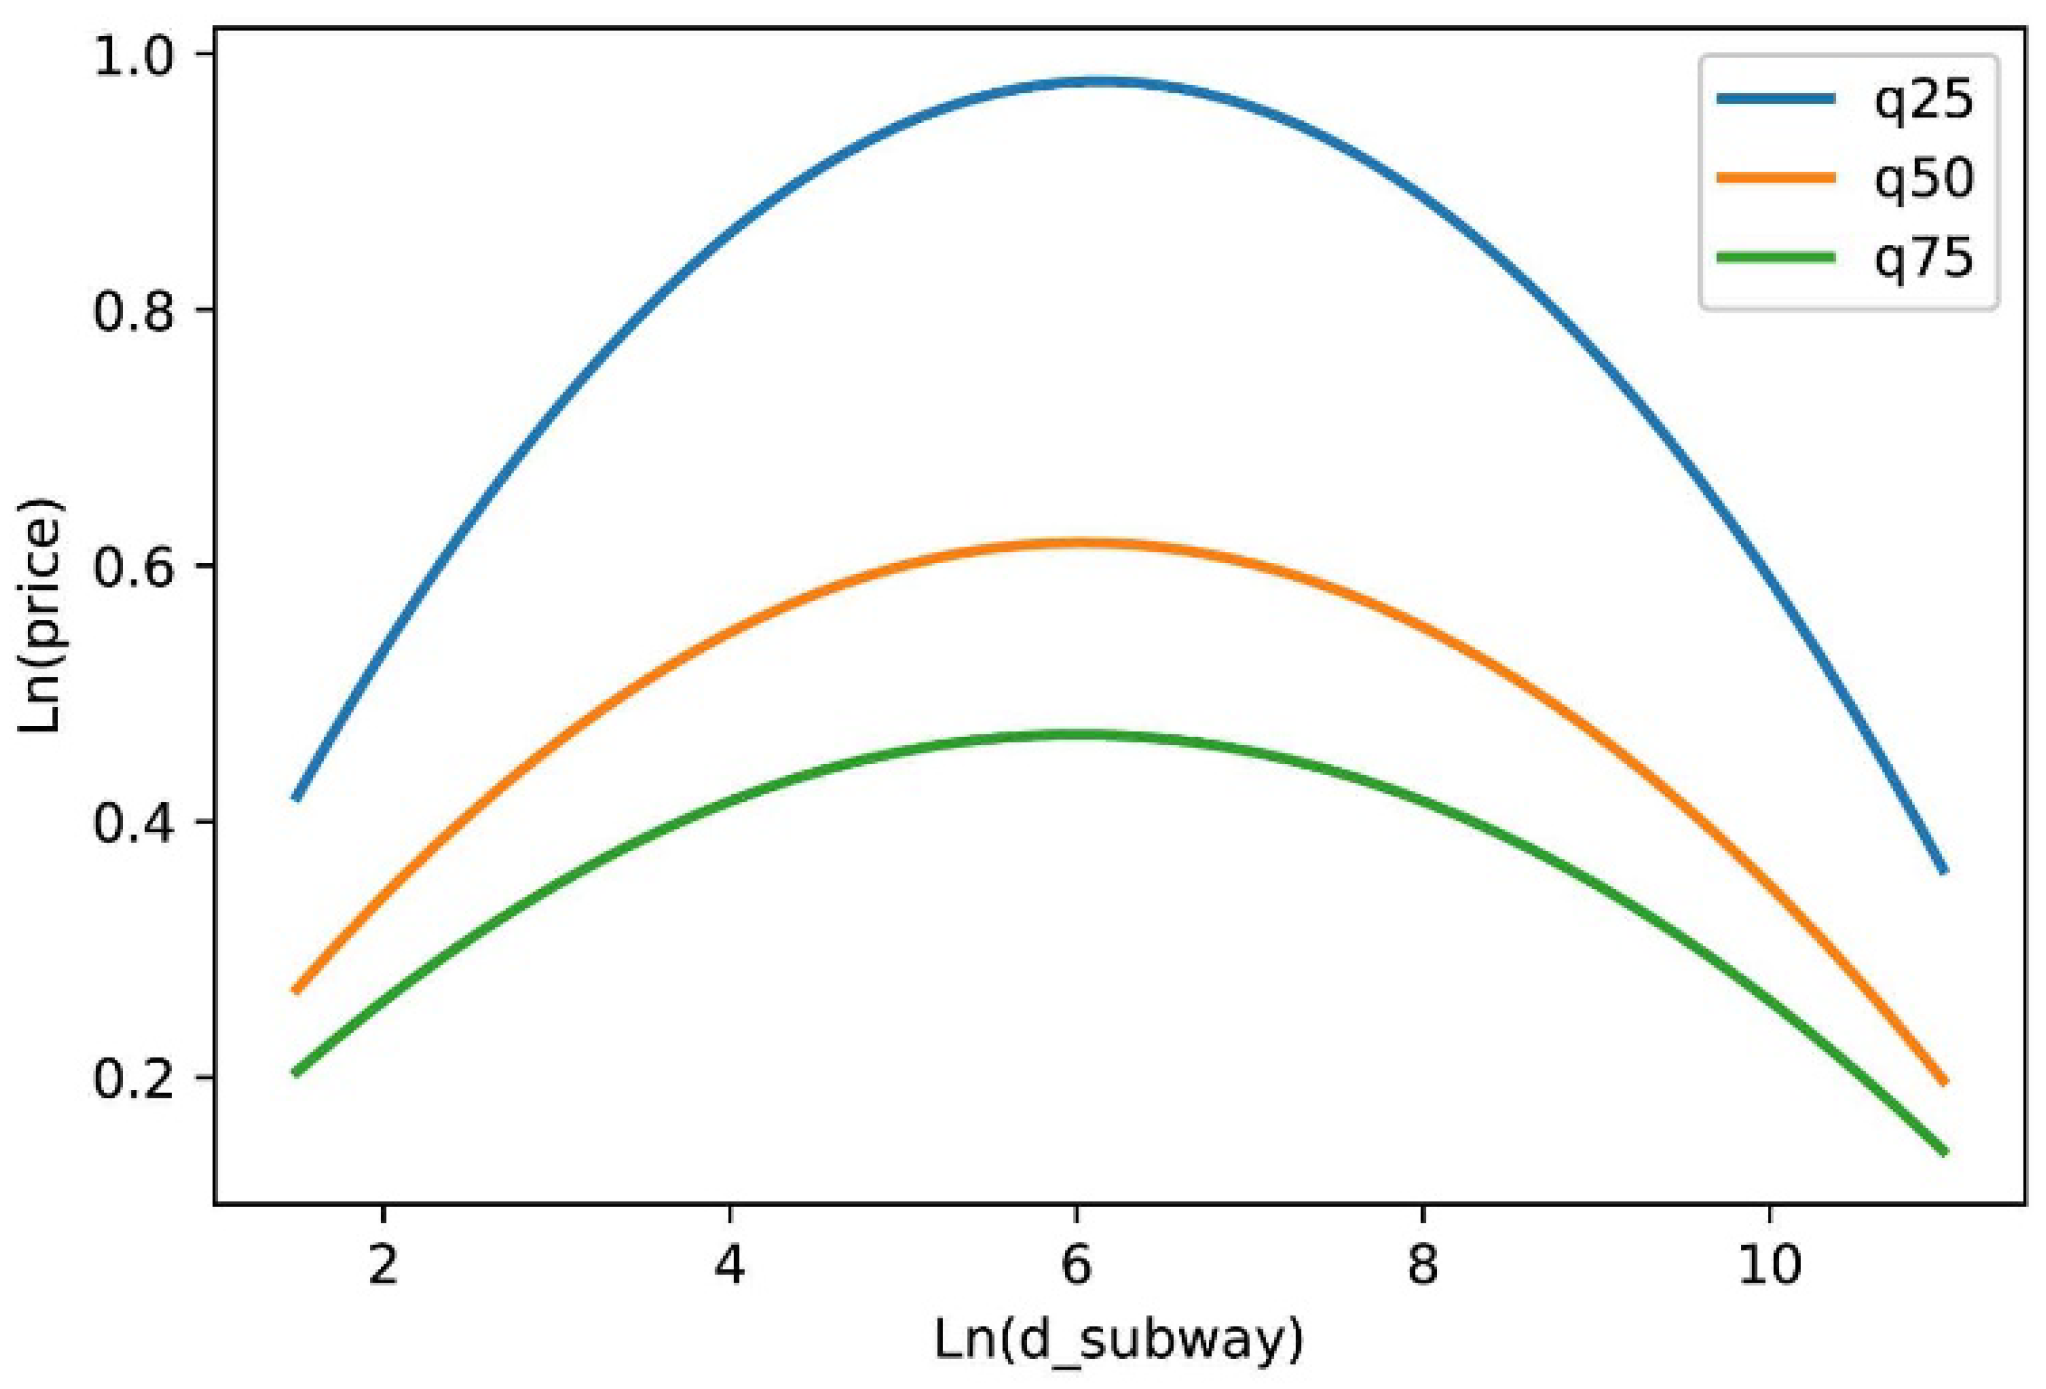
In addition, the proximity of the subway has a greater impact degree on low- and medium-price housing. For the same distance range in rail transit, the impact of subway station accessibility on housing prices is not the same degree. For example, if a house is 250–500 m away from a subway station, the coefficients of the 25th, 50th, and 75th percentiles are 0.092, 0.081, and 0.056, respectively, and they decrease in order, which means that, at the same distance from a subway station, rail transit accessibility has less impact on low- and medium-price housing. Equation (9) further supports this conclusion, which shows the functional relationship between housing price and distance from housing to subway station at each quantile when controlling other variables (as shown in Figure 4). As the distance increases, the slope of the rise and fall of house prices in the 25th percentile is the largest, followed by the 50th percentile and the 75th percentile, meaning that the low- and medium-housing prices change more rapidly as the distance from the subway station increases. This shows that low-cost housing is more sensitive to the impact of subway station proximity and subway station proximity to the impact of low-cost housing than high-cost housing.
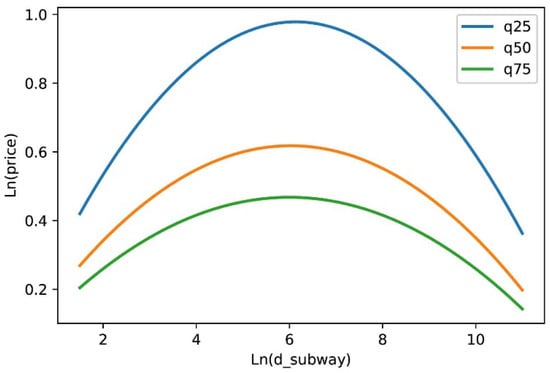
Figure 4.
The functional relationship between housing price and distance from houses to subway stations (Equation (9)).
6. Discussion
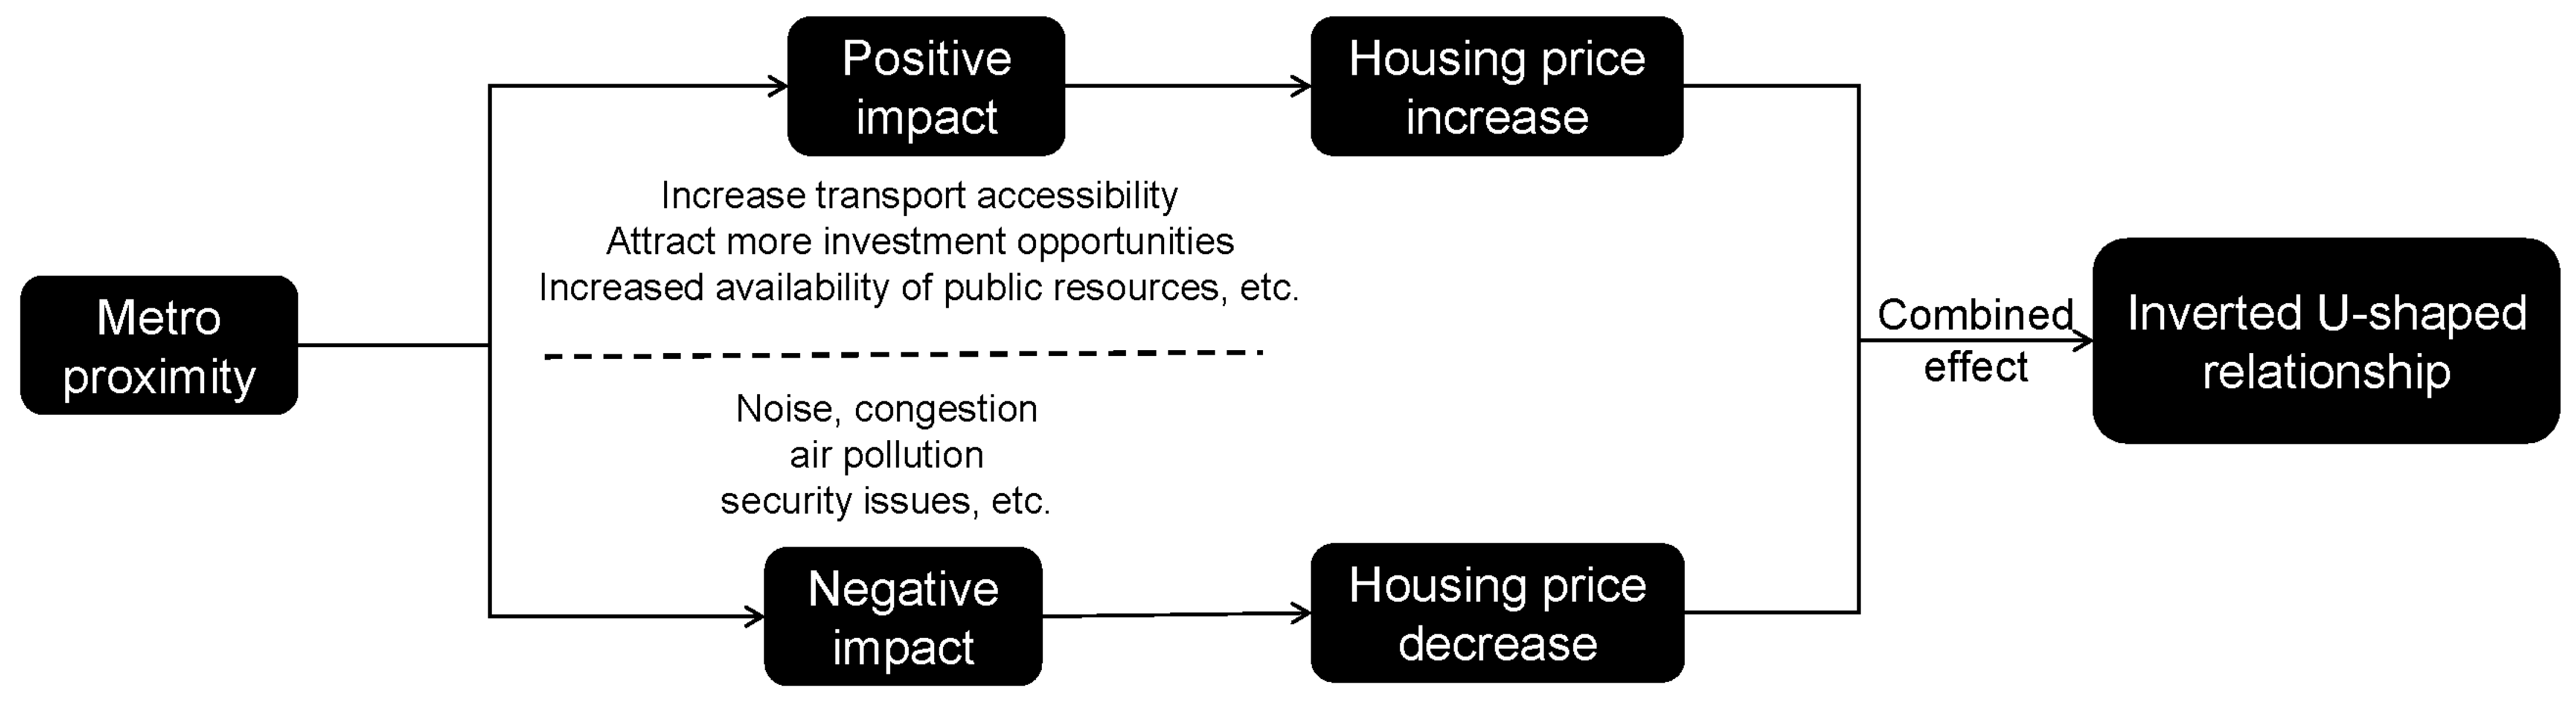
Taking the subway system of Chengdu as an example, this paper analyzed the impact mechanism of rail transit on housing price through hedonic price model based on OLS, and then in order to explore the heterogeneous influence of rail transit on housing price with different prices, we adopted quantile regression to study the heterogeneity of urban rail transit on low-, medium-, and high-priced housing. When exploring the nonlinear impact of rail transit proximity on housing prices, we adopted two different strategies: to shift the distance between housing and subway station from continuous variable to virtual variable, and to introduce the square term of the distance from the housing to the subway station. The virtual variable processing of the distance, on the one hand, can directly compare the influence of rail transit proximity on the housing price in different distance segments, and, on the other hand, can help to judge the impact range of the subway according to the significance of the coefficient. On the basis of retaining the original continuous variable of ln(d_subway), a quadratic term is introduced into the model, whose results prove the nonlinear effect of rail transit proximity on house price once again, making the nonlinear impact mechanism more authentic. As the distance increases, the house price rises first, and once it exceeds a threshold, the house price will decrease as the distance to the subway station increases. Geng et al. (2015) also found this phenomenon when they studied the effect of a high-speed rail station on spatial variations in housing price [33]. In fact, the influence of subway proximity on housing price is the result of positive and negative influence factors. As Figure 5 shows, the noise, congestion, and safety problems of the subway system will reduce the price of houses within a short distance of a subway station [34], but these negative effects will decrease as the distance from the subway station increases. While the metro system has a positive impact on the accessibility of residential areas, the combined effect of the two will lead to a rise in housing prices. However, as the distance from the metro station continues to increase, the negative externalities disappear, but with the reduced accessibility and convenience of the metro, the positive premium of the positive impact will be reduced and house prices will continue to decrease.
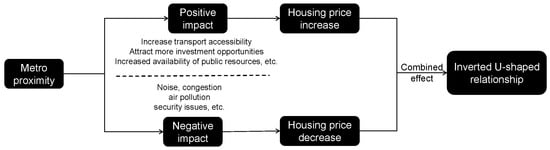
Figure 5.
The influence mechanism of subway accessibility on housing prices.
OLS reveals the relationship between independent variables and conditional expectation of dependent variables, while quantile regression reveals the relationship between independent variables and conditional quantiles of dependent variables, thus revealing the influence of independent variables on dependent variables at different levels. In other words, quantile regression provides an effective way to study the heterogeneous effects of rail transit on different housing prices. The impact of subway station proximity on higher quantile of housing prices means the impact of transport accessibility on the high-priced housing. The OLS regression results (Equation (6)) showed that the coefficient of d2 was 0.078, while the quantile regression results (Equation (8)) showed that d2 was 0.092, 0.081, and 0.056 in 25%, 50%, and 75% quantiles, respectively. Therefore, OLS estimates actually underestimate the impact of rail transit proximity on low-and middle-priced housing and overestimate the impact on high-priced housing. This further demonstrates the necessity for quantile regression. The quantile results show that the influence of metro proximity on low-, medium-, and high-priced housing is decreasing gradually, both in the scope and degree of influence. This result seems to be similar to previous studies, which have shown that the impact of mass transit is greater in the suburbs than in the city center [35], where land prices are relatively low compared with the city center, and therefore housing prices are relatively low. In other words, rail transit has a greater impact on low-priced housing. Additionally, Dziauddin (2019) suggests that the metro has a greater impact on lower-income areas than higher-and middle-income areas; that the cost of living increases as a result of increased car acquisition and maintenance costs; and that low- and middle-income people rely more on public transport than high-income people [19]. In general, buyers of low- and middle-priced homes represent low- and middle-income residents with lower disposable income than those with higher incomes, and who prefer to use public transportation in order to save money and thus are more willing to pay the premium which the subway accessibility produces. Therefore, this manifests the significant influence of rail transportation on low-cost housing.
It should be noted that this article still has some limitations, and the following aspects can be studied in depth. First of all, this study does not use spatial econometrics to overcome the spatial dependence. The spatial econometrics model can effectively solve this problem, as the combination of spatial econometrics and quantile regression should be one of the future research directions. Secondly, studies have shown that the services provided by subways also have a significant impact on housing prices [31]; however, due to the difficulty in obtaining data, variables such as the on-time rate of trains and the environment around stations cannot be obtained to reflect the variables of subways services. In the future, research should also include the variable index that reflects the quality of service. Finally, because this research cycle is short, it cannot keep track of the impact of rail transit on housing price in time; thus, in the future, we should continue to pay attention to the dynamic value-added effect of the subway on housing prices.
7. Conclusions
Based on the least squares regression and quantile regression, this paper analyzes the influence of urban rail transit on the heterogeneity of housing at different price levels. The result shows that the house price first rises and then decreases following an increase in the distance to the subway station, which is the result of the positive and negative effects of the subway system on the house price. Second, the quantile regression results provide a more complete picture of the impact of the Chengdu Metro on housing prices. The results show that the influence of the subway station accessibility on low-, middle-, and high-priced housing is gradually weakened, because the middle- and low-income people depend more on public transportation.
The results of this study can provide a reference for the government and urban planners to formulate policies. First, the rail generates a premium on the value of the surrounding housing, so the government can capture the added value of the rail to the surrounding housing. There are many mechanisms for capturing value, such as joint development with real estate developers, to bridge the funding gap for rail transit construction and operation [36,37]. It is important to note, however, that the subway system inflates the price of surrounding housing within a short distance of a subway station, suggesting that planners should not design lines or stations too close together. This is likely to make the site on the surrounding residential negatively impact the superposition, thus creating a more negative premium. More importantly, the results of quantile regression show that rail transit has a greater impact on low- and middle-cost housing, and that low- and middle-income people are more dependent on rail transit. Thus, when planning a route, planners should also take into account the geographical distribution of low- and middle-income groups.
Author Contributions
P.R.: Methodology, Formal analysis, Writing—original draft. W.C.: Conceptualization, Supervision, Funding acquisition. Z.L.: Conceptualization, data curation, Investigation, Software, Validation, Writing—review & editing. L.R.: data curation, Investigation. L.G.: Software, Visualization. All authors have read and agreed to the published version of the manuscript.
Funding
This study was supported by the Fundamental Research Funds for the Central Universities (No. 2021CDJSKCG27).
Institutional Review Board Statement
Not applicable.
Informed Consent Statement
Not applicable.
Data Availability Statement
Not applicable.
Acknowledgments
We thank the editor and anonymous referees, whose remarks have been very constructive and inspiring in preparing the final version of the paper. We are solely responsible for the opinions expressed in this paper.
Conflicts of Interest
The authors declare no conflict of interest.
References
- Mathur, S.; Smith, A. Land value capture to fund public transportation infrastructure: Examination of joint development projects’ revenue yield and stability. Transp. Policy 2013, 30, 327–335. [Google Scholar] [CrossRef]
- Zhang, D.; Jiao, J. How Does Urban Rail Transit Influence Residential Property Values? Evidence from An Emerging Chinese Megacity. Sustainability 2019, 11, 534. [Google Scholar] [CrossRef] [Green Version]
- Kim, K.; Lahr, M.L. The impact of Hudson-Bergen Light Rail on residential property appreciation. Pap. Reg. Sci. 2014, 93, S79–S97. [Google Scholar] [CrossRef] [Green Version]
- Dubé, J.; Thériault, M.; Des Rosiers, F. Commuter rail accessibility and house values: The case of the Montreal South Shore, Canada, 1992–2009. Transp. Res. Part A Policy Pract. 2013, 54, 49–66. [Google Scholar] [CrossRef]
- Su, Y.; Zhu, D.; Zheng, Y.; Wang, X.; Chen, G. The effects of subways on housing price gradients between urban area and suburb in southwest Beijing. Resour. Sci. 2015, 37, 125–132. [Google Scholar]
- Zhang, W.; Li, H.; Duan, X. The Impacts of Rail Transit on Property Values—The Case of No.1 Line in Beijing. Econ. Geogr. 2012, 32, 46–65. [Google Scholar]
- He, D.; Jin, F. An Analysis of the Spatio-temporal Impacts of Major Infrastructure on Real Estate Prices—Take Beijing Metro Line 4 as an Example. J. Beijing Union Univ. 2013, 27, 7–15. [Google Scholar]
- Su, Y.; Feng, C. An Analysis on Influences to the Residential Price of Real Estate Brought by Urban Railway System: A Case Study of Beijing MTR 4th Line and Batongxian. Urban Stud. 2011, 18, 108–113. [Google Scholar]
- Mei, Z.; Xu, S.; Ouyang, J.; Liu, J. Spatio-temporal Impact Effects of Guangzhou Metro 3rd Line on Housing Prices. Sci. Geogr. Sin. 2011, 31, 836–842. [Google Scholar]
- Nie, C.; Wen, H.; Fan, X. The spacial and temporal effect on property value increment with the development of urban rapid rail transit: An empirical research. Geogr. Res. 2010, 29, 801–810. [Google Scholar]
- Mulley, C.; Tsai, C.-H.; Ma, L. Does residential property price benefit from light rail in Sydney? Res. Transp. Econ. 2018, 67, 3–10. [Google Scholar] [CrossRef]
- Gallo, M. The Impact of Urban Transit Systems on Property Values: A Model and Some Evidences from the City of Naples. J. Adv. Transp. 2018, 2018, 1–22. [Google Scholar] [CrossRef]
- Yen, B.T.H.; Mulley, C.; Shearer, H.; Burke, M. Announcement, construction or delivery: When does value uplift occur for residential properties? Evidence from the Gold Coast Light Rail system in Australia. Land Use Policy 2018, 73, 412–422. [Google Scholar] [CrossRef]
- Cao, X.; Porter-Nelson, D. Real estate development in anticipation of the Green Line light rail transit in St. Paul. Transp. Policy 2016, 51, 24–32. [Google Scholar] [CrossRef] [Green Version]
- Pan, Q.; Pan, H.; Zhang, M.; Zhong, B. Effects of Rail Transit on Residential Property Values. Transp. Res. Rec. J. Transp. Res. Board 2014, 2453, 118–127. [Google Scholar] [CrossRef]
- Dai, X.Z.; Bai, X.; Xu, M. The influence of Beijing rail transfer stations on surrounding housing prices. Habitat Int. 2016, 55, 79–88. [Google Scholar] [CrossRef]
- Camins-Esakov, J.; Vandegrift, D. Impact of a light rail extension on residential property values. Res. Transp. Econ. 2018, 67, 11–18. [Google Scholar] [CrossRef]
- Forouhar, A.; Hasankhani, M. The effect of Tehran metro rail system on residential property values: A comparative analysis between high-income and low-income neighbourhoods. Urban Stud. 2018, 55, 3503–3524. [Google Scholar] [CrossRef]
- Dziauddin, M.F. Estimating land value uplift around light rail transit stations in Greater Kuala Lumpur: An empirical study based on geographically weighted regression (GWR). Res. Transp. Econ. 2019, 74, 10–20. [Google Scholar] [CrossRef]
- Lin, Y.J.; Chang, C.O.; Chen, C.L. Why homebuyers have a high housing affordability problem: Quantile regression analysis. Habitat Int. 2014, 43, 41–47. [Google Scholar] [CrossRef]
- Zhang, L. Flood hazards impact on neighborhood house prices: A spatial quantile regression analysis. Reg. Sci. Urban Econ. 2016, 60, 12–19. [Google Scholar] [CrossRef]
- Wang, Y.; Feng, S.; Deng, Z.; Cheng, S. Transit premium and rent segmentation: A spatial quantile hedonic analysis of Shanghai Metro. Transp. Policy 2016, 51, 61–69. [Google Scholar] [CrossRef] [Green Version]
- Wen, H.; Gui, Z.; Tian, C.; Xiao, Y.; Fang, L. Subway Opening, Traffic Accessibility, and Housing Prices: A Quantile Hedonic Analysis in Hangzhou, China. Sustainability 2018, 10, 2254. [Google Scholar] [CrossRef] [Green Version]
- Mathur, S. Impact of transit stations on house prices across entire price spectrum: A quantile regression approach. Land Use Policy 2020, 99, 104828. [Google Scholar] [CrossRef]
- Zhong, H.; Li, W. Rail transit investment and property values: An old tale retold. Transp. Policy 2016, 51, 33–48. [Google Scholar] [CrossRef]
- Yang, L.; Zhou, J.; Shyr, O.F.; Huo, D. Does bus accessibility affect property prices? Cities 2019, 84, 56–65. [Google Scholar] [CrossRef]
- Wu, C.; Ye, X.; Du, Q.; Luo, P. Spatial effects of accessibility to parks on housing prices in Shenzhen, China. Habitat Int. 2017, 63, 45–54. [Google Scholar] [CrossRef]
- Hess, D.B.; Almeida, T.M. Impact of proximity to light rail rapid transit on station-area property values in Buffalo, New York. Urban Stud. 2007, 44, 1041–1068. [Google Scholar] [CrossRef]
- Wen, H.; Zhang, Y.; Zhang, L. Do educational facilities affect housing price? An empirical study in Hangzhou, China. Habitat Int. 2014, 42, 155–163. [Google Scholar] [CrossRef]
- Tan, R.; He, Q.; Zhou, K.; Xie, P. The effect of new metro stations on local land use and housing prices: The case of Wuhan, China. J. Transp. Geogr. 2019, 79, 102488. [Google Scholar] [CrossRef]
- Li, S.; Chen, L.; Zhao, P. The impact of metro services on housing prices: A case study from Beijing. Transportation 2017, 46, 1291–1317. [Google Scholar] [CrossRef]
- He, S.Y. Regional impact of rail network accessibility on residential property price: Modelling spatial heterogeneous capitalisation effects in Hong Kong. Transp. Res. Part A Policy Pract. 2020, 135, 244–263. [Google Scholar] [CrossRef]
- Liu, K.; Wu, Q.; Wang, P. Econometric analysis of the impacts of rail transit on property values: The number 1 and 2 lines in Nanjing. Resour. Sci. 2015, 37, 133–141. [Google Scholar]
- Geng, B.; Bao, H.J.; Liang, Y. A study of the effect of a high-speed rail station on spatial variations in housing price based on the hedonic model. Habitat Int. 2015, 49, 333–339. [Google Scholar] [CrossRef]
- Yang, L.C.; Chen, Y.; Xu, N.L.; Zhao, R.; Chau, K.W.; Hong, S.J. Place-varying impacts of urban rail transit on property prices in Shenzhen, China: Insights for value capture. Sustain. Cities Soc. 2020, 58, 102140. [Google Scholar] [CrossRef]
- Medda, F. Land value capture finance for transport accessibility: A review. J. Transp. Geogr. 2012, 25, 154–161. [Google Scholar] [CrossRef]
- Fensham, P.; Gleeson, B. Capturing Value for Urban Management: A New Agenda for Betterment. Urban Policy Res. 2003, 21, 93–112. [Google Scholar] [CrossRef]
Publisher’s Note: MDPI stays neutral with regard to jurisdictional claims in published maps and institutional affiliations. |
© 2021 by the authors. Licensee MDPI, Basel, Switzerland. This article is an open access article distributed under the terms and conditions of the Creative Commons Attribution (CC BY) license (https://creativecommons.org/licenses/by/4.0/).