Article

Hotspots of Agricultural Ecosystem Services and Farmland Biodiversity Overlap with Areas at Risk of Land Abandonment in Japan

1
Department of Animal Ecology & Systematics, Justus Liebig University Giessen, Heinrich-Buff Ring 26-32, 35392 Giessen, Germany
2
Graduate School of Media and Governance, Keio University, Fujisawa 252-0882, Japan
3
Faculty of Science and Engineering, Chuo University, 1-13-27 Kasuga, Bunkyo-ku, Tokyo 112-8551, Japan
4
Faculty of Environment and Information Studies, Keio University, Fujisawa 252-0882, Japan
5
Nature & Science Consulting Co., Ltd., Yokohama 231-0032, Japan
*
Author to whom correspondence should be addressed.
Land 2021, 10(10), 1031; https://doi.org/10.3390/land10101031
Submission received: 28 August 2021 / Revised: 20 September 2021 / Accepted: 27 September 2021 / Published: 1 October 2021
(This article belongs to the Special Issue Cultural Landscapes)

Abstract

:
Agriculture provides a wide range of ecosystem services and has the potential to contribute to biodiversity conservation. In Japan, many of the resources associated with agroecosystems are threatened by farmland abandonment. Identifying where and to what extent agricultural ecosystem services and farmland biodiversity are affected by farmland abandonment is essential for developing effective strategies to counter the potential loss of these services and the biological communities that support them. Our study aimed to examine how a set of indicators for ecosystem services and biodiversity linked to agroecosystems (proportions of land dedicated to rice production and other agricultural production, proportion of agricultural land on slopes potentially providing landscape aesthetics, proportion of villages promoting rural tourism, and densities of forest edges and irrigation ponds in agricultural land) are distributed at the municipal level across the Japanese Archipelago, and to analyze their spatial patterns in relation to the distribution of farmland abandonment. It was hypothesized that hotspots of agricultural ecosystem services and farmland biodiversity occur in areas at risk of farmland abandonment owing to shared drivers. The cluster analysis identified four distinct ecosystem service bundle types, two of them representing areas specializing in agricultural production, while the other two provided high levels of cultural services and habitats for diverse biological communities. The latter two bundles were located in hilly and mountainous areas and accounted for 58% of rice production, 27% of other agricultural production, 77% of landscape aesthetics, 77% of rural tourism, 64% of forest edges, and 87% of irrigation ponds in Japan. In support of the hypothesis, farmland abandonment was pronounced in these areas, with 64% of recently abandoned fields located where 44% of agricultural land was found. This spatial overlap suggests that substantial losses of ecosystem services and biodiversity may occur if current patterns of farmland abandonment continue. In order to prevent large-scale losses of agricultural ecosystem services and farmland biodiversity, measures to counteract the ongoing abandonment trends should prioritize hilly and mountainous areas, and future studies should further evaluate the multiple functions of agricultural areas to improve policies that aim to ensure sustainable development of rural areas in Japan.

1. Introduction

Farmland abandonment is changing rural landscapes worldwide [1,2,3]. The trend towards abandonment is driven by a combination of ecological and socio-economic factors [2,4]. Affected areas often have unfavorable environmental conditions such as low productivity soils, climatic constraints or topographic challenges—steep slopes or high elevation—which make them particularly prone to abandonment [5,6]. Low farm income, rural-urban migration, aging population of farmers, limited access to modern agriculture and market globalization are socio-economic factors contributing to this trend [6,7]. Areas where farming is no longer viable are often located in remote and mountainous areas where traditional farming systems have been maintained until now [1,7].
Agricultural landscapes show a large variation in structure and function [8]. Traditional farming systems that have evolved from long-term interactions between humans and nature play a key role in shaping and maintaining this diversity [9,10]. The unique values of traditional agriculture have been discussed with regard to biodiversity (e.g., wildlife and habitats; [11,12,13]) and cultural aspects (e.g., traditional knowledge and cultural landscapes; [14,15,16]), reflecting the fact that such land use systems create coupled social-ecological systems [17]. In regions dominated by intensive agricultural practices, traditional agricultural landscapes represent hotspots in particular for regulating and cultural ecosystem services and biodiversity [18].
Given the multifunctional nature of traditional farming systems [12,19], there may be spatial aggregation of different agricultural ecosystem services and farmland biodiversity in those parts of agricultural landscapes where such farming systems persist. In conjunction with farmland abandonment being pronounced in traditional farming systems [20], it is possible that areas with high levels of multiple ecosystem services and high biodiversity are concentrated in areas which are disproportionately affected by abandonment trends. If such spatial overlap exists, agricultural ecosystem services and farmland biodiversity may decline due to vegetation succession following the cessation of agricultural management. An obvious consequence of farmland abandonment is the loss of production potential for food, feed, and fiber. Environmentally, scrub and tree encroachment can lead to a loss of landscape heterogeneity and mosaic features and threaten a range of species that have adapted to farming systems over time [2,19,21,22]. The loss of landscape character induced by vegetation succession can also affect cultural and heritage values of landscapes shaped by humans [2,23]. Negative environmental impacts of farmland abandonment have been reported, particularly from regions with high forest cover [2] where small-scale/low intensity agriculture is often retained [21]. By contrast, some ecosystem services and elements of biodiversity have been found to increase during secondary succession on former farmland [4]; these include the stabilization of soils [24] along with soil recovery [25], carbon sequestration [26], and water regulation [27]. Successional vegetation development allows biodiversity recovery in simple landscapes (rewilding; [28]), and shifts biological communities towards species favoring woody vegetation [29,30]. However, findings from previous studies in mountain areas reveal that species colonizing old field sites were predominantly common ones [29,30], suggesting that there may be only a small gain in species diversity from adding shrubs and trees in areas where woody vegetation is already abundant. In regions where forests cover most of the land, negative effects of farmland loss may outweigh positive effects of forest gain.
This study focused on agricultural ecosystem services and elements of biodiversity that are linked to agroecosystems; these variables are negatively affected when agricultural management ceases, and the effects may be difficult to reverse once they have occurred [31]. We elucidated the relationships between ecosystem services and biodiversity across basic types of agricultural landscapes in different topographic settings, and we tested whether the spatial distribution of these ecosystem services and biodiversity elements is systematically linked to the distribution of areas where farmland abandonment is pronounced. Such information on the spatial relationships between ecosystem services, biodiversity and farmland abandonment is important for decision makers tasked with improving policy design and spatial planning for sustainable development, including the International Partnership for the Satoyama Initiative, that aims to accomplish societies in harmony with nature [9,32].
We used the concept of ecosystem service bundles to capture key patterns in the distribution of agricultural ecosystem services and farmland biodiversity across the Japanese archipelago. Ecosystem service bundles have been defined as sets of ecosystem services that repeatedly occur together across space [33]; this approach has been applied successfully to link such bundles to socio-ecological subsystems of a landscape [33,34,35,36]. We applied this method to identify hotspots of agricultural ecosystem services and farmland biodiversity in landscapes with different topographic characteristics and levels of agricultural land use intensity. Our study aimed to investigate (i) whether there is spatial aggregation of different agricultural ecosystem services and farmland biodiversity in Japan, and (ii) whether the identified hotspots coincide with areas affected by farmland abandonment trends.

2. Methods

2.1. Agricultural Areas in Japan

Japan extends over several biomes ranging from subboreal coniferous forest in the north to subtropical evergreen broad-leaved forest in the south. It has a wide topographic gradient ranging from coastal plains to high mountain zones. Due to the dominance of hilly and mountainous areas, the land is mainly covered by forests, comprising 67% of the land surface, whereas farmland makes up only 12% [37]. The main crop is rice (Oryza sativa), accounting for 54% of the total cultivated land [38]. Traditional rural landscapes in Japan are referred to as ‘satoyama,’ where a mosaic of forests, semi-natural grasslands, agricultural fields, irrigation channels, ponds and settlements are managed as an integral part of socio-ecological systems (see [9,11,12] for images of satoyama landscapes). In these landscapes, farmland abandonment has become a major challenge owing to an aging population, migration to urban areas, a shortage of farm labor, and a set-aside program for rice production [39,40]. Abandoned fields occupy approximately 10% of the total farmland area [41], and the trend towards abandonment is expected to continue [39]. Japan is thus suited to study how spatial patterns of multiple agricultural ecosystem services and farmland biodiversity are related to the distribution of abandoned fields.

2.2. Quantification of Ecosystem Services and Biodiversity

We screened nationwide public statistics and land-use datasets for proxies of ecosystem services and biodiversity. Two provisioning services (rice production and other agricultural production), two cultural services (landscape aesthetics and rural tourism), and two landscape indicators (forest edges and irrigation ponds) relevant for biodiversity were assessed across Japan. This selection of indicators was based on their relationship to agroecosystems, their susceptibility to farmland abandonment, and on data availability. Regulating services were not included, because many of them would be expected to recover with secondary succession, or because their provision relies on conditions and management intensity at the local level. Extensively managed grassland, which is equally relevant for biodiversity, was not included in the analysis because grasslands are rare at the national scale, making up less than 1% of the total land surface [42]. Table 1 provides a summary of ecosystem services and biodiversity indicators assessed.
We used administrative units at the municipal level to evaluate the spatial variation of the selected indicators for ecosystem services and biodiversity across Japan. By choosing this administrative level for summarizing the information, we intended to generate results that can be used in existing decision-making structures and policy implementation mechanisms [43]. Data were collected for 1719 municipalities. Because data on irrigation ponds were available only at the prefectural level (n = 47), the same values were assigned to all municipalities within each prefecture; details are given below. Proxies were quantified using data for 2015 or as close as possible to this date, except for landscape aesthetics and forest edges that were based on land-cover data in 1998. Land-cover was derived from the vector dataset Actual Vegetation Map of Japan [44]. The Land Cover Classification System developed by the Food and Agriculture Organization [45] was applied to reclassify the 774 vegetation communities into 22 land-cover classes: namely, cropland, pasture, rice fields, tree crop, shrub crop, broad-leaved forest, mixed forest, coniferous forest, mangrove, bamboo, shrub, herbaceous, sparse vegetation, lichen/moss, water body, fresh and brackish water wetland, salt marsh, bare area, snow/ice, vegetated urban, urban, and unknown (Supplementary Material 1). Classification of vegetation communities was carried out in reference to the classification scheme proposed by Ogawa et al. [46]. Generation of spatial data was performed using ArcGIS® 9.3 (ESRI, http://www.esri.com/, accessed on 30 June 2017).

2.2.1. Provisioning Service: Rice Production

Rice plays a special role as the staple food in Japan. Following the approach of Raudsepp-Hearne et al. [33] and Maes et al. [47], the share of rice fields as a fraction of the total land area of each municipality was used to indicate how much land is dedicated to rice production. Rice production in municipality i was expressed as Rice.productionij [%] = A.riceij [ha]/A.landij [ha] × 100, where A.riceij and A.landij are the area of rice fields [48] and total land [49] of municipality i in prefecture j, respectively.

2.2.2. Provisioning Service: Other Agricultural Production

Production of agricultural commodities besides rice (i.e., non-rice arable fields, permanent crops, and pasture) was assessed using an estimation method similar to that which was applied to rice production. It was defined as Other.agricultural.productionij [%] = A.otherij [ha] / A.landij [ha] × 100, where A.otherij and A.landij are the area of other agricultural fields [48] and total land of municipality i in prefecture j, respectively. Pasture is often separated from crops as it is associated with livestock production [47]. In Japan, however, pasture occupies only 13.5% of total farmland, where the majority of pasture is found in the northernmost island Hokkaido (83.5% of pasture; [50]). As the category Area of Upland Fields did not differentiate between pasture and cropland at the municipal level, we also treated them in the same category in our analysis rather than making two separate categories.

2.2.3. Cultural Service: Landscape Aesthetics

Terraced fields are common agricultural landscapes in hilly and mountainous areas of Japan [51]. Terraced landscapes receive much attention as areas of high aesthetic value among different groups of people such as tourists [52,53], conservation activists [52], and local residents [54]. For their scenic beauty, rice terraces are one of the few agricultural features included in the Top 100 Selection series, which lists outstanding sites of a given theme across Japan [55]. Terraced landscapes are under pressure from abandonment because much of the agricultural work on steep slopes requires manual labor [54], and a large number of new policies have been enacted to conserve such cultural landscapes [51]. In the study, the share of terraced fields in farmland was used as an indicator for its aesthetic potential provided by agricultural landscapes. Areas with a high likelihood of containing terraced fields were delineated using two spatial datasets, namely, the Elevation, Degree of Slope Tertiary Mesh Data [56] and the land-cover dataset. The elevation dataset includes minimum and maximum degrees of slope on a 1 km2 grid basis. We extracted grid cells with maximum degrees of slope ≥15°, because the Direct Payment for Hilly and Mountainous Areas, which supports farmers in managing fields on slopes, sets this value as a minimum threshold for supporting non-rice arable fields and grasslands on steep slopes [57]. The extracted grid cells were then overlaid with farmland polygons derived from the land-cover dataset (i.e., cropland, pasture, rice fields, tree crop, and shrub crop); we interpreted the overlapping areas as terraced fields. Terraced landscapes as an indicator for landscape aesthetics in municipality i in prefecture j was formulated as Landscape.aestheticsij [%] = A.terraceij [ha]/A.farmpolyij [ha] × 100, where A.terraceij and A.farmpolyij are the area of terraced fields and farmland polygons, respectively.

2.2.4. Cultural Service: Rural Tourism

Rural tourism provides visitors with recreational opportunities using a variety of local resources [58,59]. It is largely supported by local industries, as the activities involve overnight stays, participation in hands-on learning programs offered by the locals, direct sales of local products, and cultural exchanges in farming, forestry, and fishing villages [60]. The percentage of villages involved in rural tourism indicates the degree of attractiveness of a municipality as a recreational destination for such activities. It was expressed as Rural.tourismij [%] = N.tourismvillagesij [villages]/N.totalvillagesij [villages] × 100, where N.tourismvillagesij and N.totalvillagesij are the number of villages that promote rural tourism and the total number of villages in municipality i in prefecture j, respectively. The data are available from the Census of Agriculture and Forestry [61].

2.2.5. Biodiversity: Forest Edges

Forest edges are one of the key features influencing biodiversity in agricultural landscapes of Japan [39]. The length of forest edges per unit area tends to be long in those regions where the topography has facilitated the development of typical land-use patterns of satoyama; flat land at the bottom of valleys is used for rice production, while the hillsides are covered by forests, forming complex landscapes with long boundaries of forests and rice fields [11]. Having both habitats closely connected enhances habitat quality for organisms that require them at different stages of their life cycle [11]. Examples include amphibian species that inhabit forests and breed in aquatic habitats in agricultural areas (e.g., Hynobius nebulosus and Rana ornativentris; [62,63]) and umbrella species of birds that use forests for breeding and farmland and grassland for feeding (e.g., Butastur indicus and Accipiter gentilis; [64,65]). Strips of grassland maintained along the boundaries are known to support many plant species typical for open habitats [66]. We used the length of forest edges per unit area in farmland to indicate the availability of borders that support important aspects of farmland biodiversity in Japan. The length of forest edges where farmland polygons are adjacent to forest polygons (i.e., broad-leaved forest, mixed forest, coniferous forest, and mangrove) was calculated based on the land-cover dataset. Forest edges were estimated by Forest.edgesij [m ha−1] = L.forestedgesij [m]/A.farmpolyij [ha], where L.forestedgesij and A.farmpolyij are the length of forest edges and the area of farmland polygons in municipality i in prefecture j, respectively.

2.2.6. Biodiversity: Irrigation Ponds

Irrigation ponds are part of rice farming systems in regions where water resources are scarce (i.e., low-rainfall areas and/or areas with catchments of limited size in hilly and mountainous areas), and approximately 70% of them were constructed more than 150 years ago [67]. Habitats under irrigation regimes contribute to spatial and temporal heterogeneity and are home to many aquatic plants and animals [13]. For example, irrigation ponds serve as stepping stones for birds [68] and Odonata species [69], and are also refuges for some aquatic insects when fields are drained [70]. The dredging of bottom sediment establishes vegetation at different succession stages in shallow water, providing a range of micro-habitats to aquatic animals [69]. We used the density of irrigation ponds to express the availability of permanent aquatic habitats in agricultural landscapes. It was defined as Irrigation.pondsj [ponds ha−1] = N.pondsj [ponds]/A.rice14j [ha], where N.pondsj and A.rice14j are the number of irrigation ponds [67] and the area of rice fields [71] in prefecture j, respectively. Both data were taken in 2014. The prefectural values were assigned to municipalities that belong to the same prefecture (Irrigation.pondsij = Irrigation.pondsj).

2.3. Agricultural Data

There are two types of publicly available data related to agriculture in Japan: Crop Statistics and the Census of Agriculture and Forestry (hereafter addressed as Census Statistics). The former generally surveys all agricultural fields, but there is no information on the area of abandoned fields at the municipal level. The latter includes a special category ‘Area of Abandoned Fields,’ but it does not cover all fields; only land owners with ≥0.05 ha agricultural land are included, and land owners who don’t live locally are not part of the survey. Here, an abandoned field is defined as an agricultural field that has not been cultivated for more than a year and is not considered for production in the next several years [61]. We used Crop Statistics [48] and Census Statistics [61] to obtain information on the area of cultivated and abandoned fields in 2015. Municipalities for which information on abandonment was not available were excluded, leaving 1651 municipalities covering 99.3% of the total area of abandoned fields for analysis.

2.4. Statistical Analysis

Non-normally distributed indicators were transformed (Rice.productionij0.1, Other.agricultural.productionij−0.2, Landscape.aestheticsij0.3, Rural.tourismij0.1, Forest.edgesij0.5, Irrigation.pondsij−0.1) using the Box–Cox transformation function of the “MASS” package in R [72]. Other agricultural production and irrigation ponds were additionally multiplied by −1, so higher indicator values correspond to greater provision of respective services. Normality of the resulting frequency distributions was confirmed by the skewness measure available in R package “e1071” (|S| < 0.5; [73]). Pearson’s correlation analysis was performed to assess pairwise relations between the proxies (rp), and significance levels for rp were corrected for spatial autocorrelation by adjusting the degree of freedom using Dutilleul’s method [74]. We evaluated the degree of spatial clustering for each service using Moran’s I available from the “spdep” package in R [75].
A two-step approach was taken to analyze if ecosystem services and biodiversity co-vary, i.e., whether they repeatedly occur together and form ‘bundles’. Applying the sequence used by Turner et al. [76] and Schirpke et al. [77], we first used a principal component analysis (PCA) to extract the main multivariate interrelationships among the variables. Using principal components for cluster analysis can provide a more robust clustering, as removing features with low variance acts as a filter to characterize the non-random structure in the data [78]. Following the Kaiser–Guttman criterion (eigenvalue >1; [79]), PCA yielded two main axes for describing the spatial patterns of ecosystem services and biodiversity. In a second step, cluster analysis was applied to identify groups of municipalities according to the first two principal component scores. In line with earlier works [33,34,76,77], we used K-means clustering in R package “cluster,” which minimizes within-group variability [80]. The optimal number of clusters was determined by examining scree plots, and the number of iterations was set at 10,000 to stabilize clustering. The spatial clustering of ecosystem bundles was assessed by using Moran’s I. We tested differences in the values of ecosystem service and biodiversity proxies among the bundles by using Kruskal–Wallis tests and between pairs of bundles by using the Mann–Whitney U test. The mean values of ecosystem service and biodiversity proxies were calculated for each bundle. They were then standardized by the respective largest mean values among the bundles, and were visualized using star plots to show differences in the level of service provision. We used ArcGIS® 9.3 (ESRI, http://www.esri.com/, accessed on 30 June 2017) for mapping ecosystem services and biodiversity as well as the identified ecosystem service bundles.
The share of ecosystem services and biodiversity as a fraction of the respective total amounts in Japan was calculated to examine how much of service provision each bundle accounts for. We used the values at the municipal level taken from public statistics or spatial data. If data were only available at the prefectural level (i.e., irrigation ponds), then municipal values were estimated by redistributing the prefectural amounts to their affiliating municipalities. The number of irrigation ponds at the municipal level was estimated by redistributing the number at the prefectural level based on the density of irrigation ponds in prefecture j (Irrigation.pondsj) and the area of rice fields in 2014 in municipality i that belonged to the prefecture (A.rice14ij, [71]). It was expressed as N.pondsij [ponds] = Irrigation.pondsj [ponds ha−1] × A.rice14ij [ha]. The municipal values were summed across Japan and according to the bundles to calculate the share.
The area of cultivated and abandoned fields was compared among the ecosystem service bundles using 1651 municipalities with abandonment data. The Kruskal–Wallis test was used to test differences among the bundles, and the Mann–Whitney U test was then carried out to test differences between pairs of bundles.
Statistical analyses were conducted using R-3.2.4 [81].

3. Results

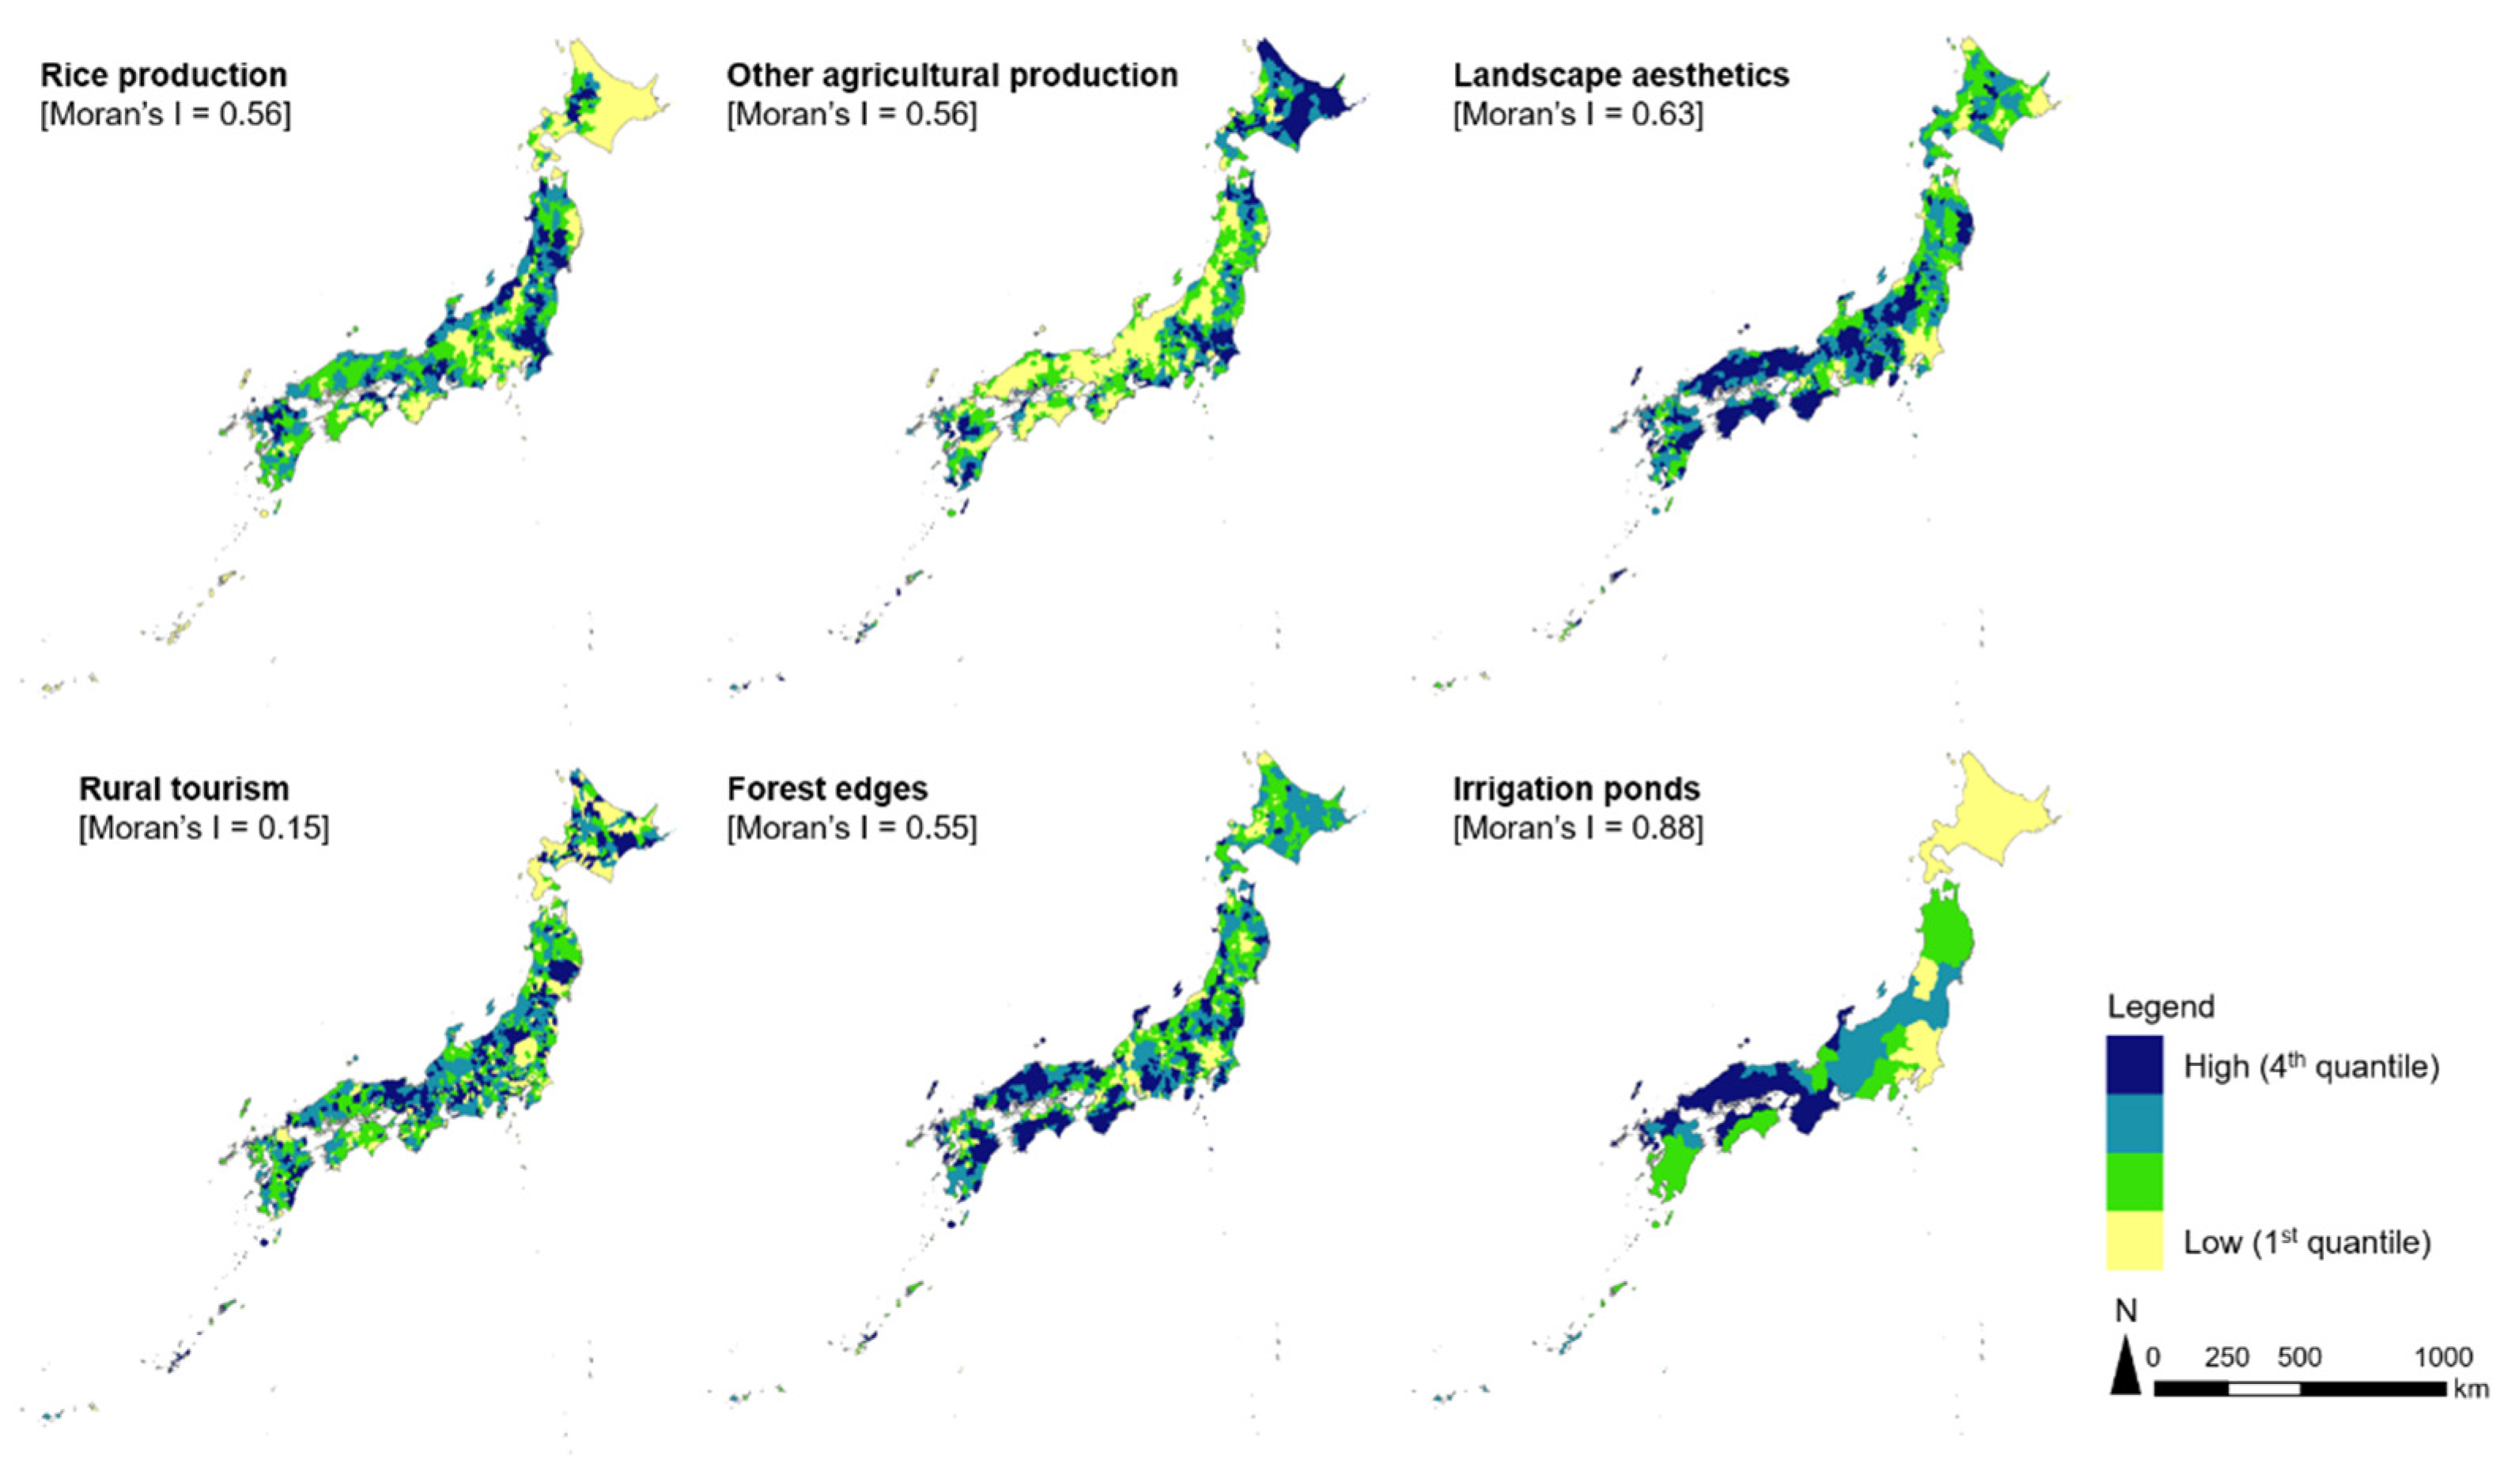
3.1. Spatial Patterns and Interactions of Ecosystem Services and Biodiversity

Agricultural ecosystem services and farmland biodiversity showed distinct spatial patterns (Figure 1). The spatial distributions of landscape aesthetics and forest edges were positively correlated (r = 0.70; SM2), and were conjointly found in the mountain ranges (Figure 1). These two ‘mountain indicators’ showed contrasting patterns with provisioning services (SM2). Rice and other agricultural production shared areas of high concentration, but there were also cases in which they were spatially segregated (e.g., rice production close to alluvial plains vs. other agricultural production in Hokkaido and near the Tokyo Metropolis; Figure 1), resulting in a weak correlation (r = 0.12; SM2). Rural tourism was found throughout Japan (Figure 1), and was weakly but positively associated with landscape aesthetics and irrigation ponds (r = 0.10 and 0.14, respectively; SM2). Irrigation ponds were most commonly observed in the western part of Japan (Figure 1), and showed a weak positive and a moderate negative correlation with rice and other agricultural production, respectively (SM2).

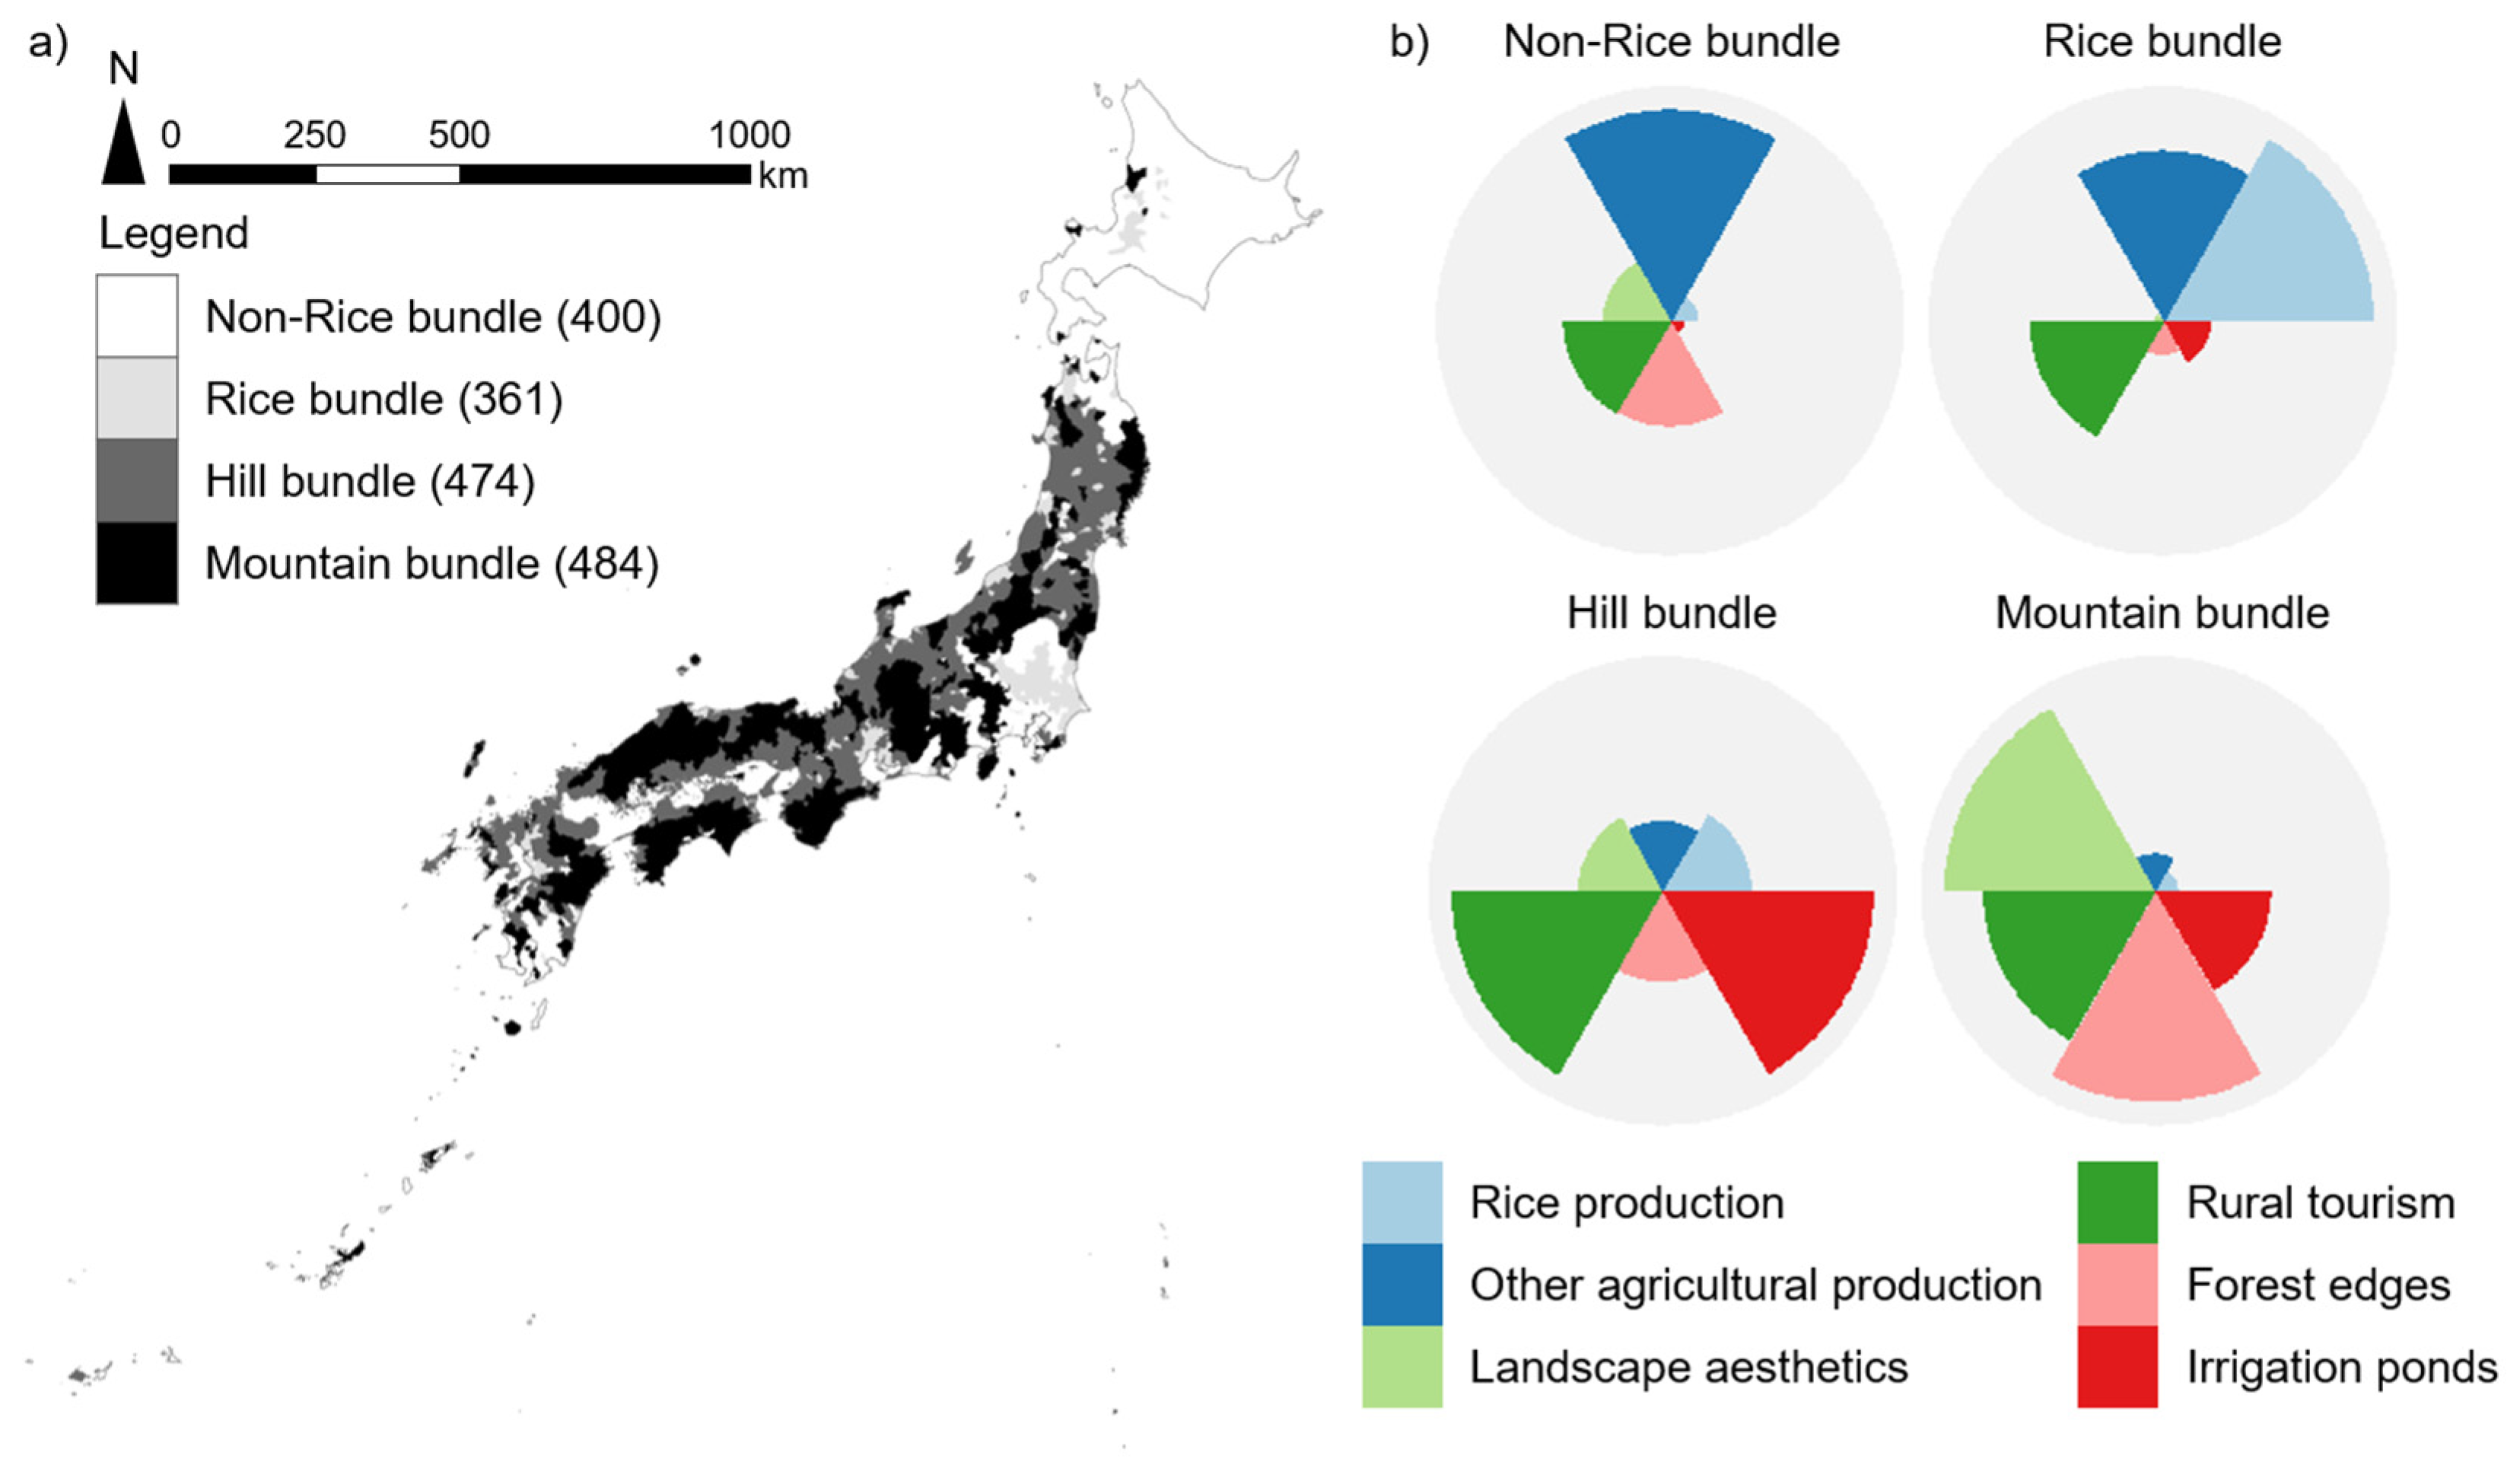
3.2. Ecosystem Service Bundles

PCA was used prior to cluster analysis, and the first two axes accounted for 60.6% of the total variance in ecosystem services and biodiversity (Table 2). The first principal component explained 38.9% of the variation, and contrasted areas surrounded by forests (negative loadings; landscape aesthetics and forest edges) with food production areas (positive loadings; rice and other agricultural production). The second component accounted for an additional 21.7% of the variation, and separated rice production-related services (rice production and irrigation ponds) and other agricultural production.
The 1719 municipalities were clustered into four ecosystem service bundles according to the two principal components. They were namely: non-irrigated agriculture (hereafter addressed as Non-Rice, n = 400), irrigated agriculture on flat land (Rice, n = 361), agriculture in hilly areas (Hill, n = 474), and agriculture in mountainous areas (Mountain, n = 484).
The four ecosystem service bundles showed geographical clustering (Moran’s I = 0.58, p < 0.001; Figure 2), each representing distinct patterns in the distribution of ecosystem services and biodiversity (SM3, Kruskal–Wallis test, all p < 0.001). For example, the first two bundles (i.e., Non-Rice and Rice) comprised municipalities whose land was dedicated to food production. Municipalities in the Non-Rice bundle were mainly distributed in Hokkaido and some in the Greater Tokyo Area. This bundle showed the highest level of other agricultural production and the lowest level of rice production and irrigation ponds. Many of the municipalities in the Rice bundle were found on large alluvial plains and had the highest mean rice production. Levels of cultural services and biodiversity were generally low in this bundle. By contrast, the latter two bundles (i.e., Hill and Mountain) were linked to cultural services and biodiversity. Municipalities in the Hill bundle were found almost all over Japan and were often located between the Rice and Mountain bundles. Here, in agricultural landscapes with moderate food production, moderate to high levels of cultural services and biodiversity were also observed. Municipalities in the Mountain bundle were distributed near mountain ranges. They had the highest landscape aesthetics, and despite its having the lowest food production, moderate to high levels of all other farmland resources were observed.
The share of ecosystem services and biodiversity in their respective total amounts in Japan was summarized for each bundle (Table 3; n = 1719). For instance, the Non-Rice bundle accounted for 59.8% of the total amount of other agricultural production in Japan. Similarly, the Rice bundle accounted for 28.9% of rice production. The Hill bundle held the largest share for many of the ecosystem services and biodiversity in Japan. They were not only responsible for food production (i.e., 43.9% rice production and 16.6% other agricultural production), but also had large quantities of cultural services and biodiversity such as landscape aesthetics (35.8%), rural tourism (46.6%), forest edges (30.7%), and irrigation ponds (62.5%). In addition, the Mountain bundle accounted for a moderate share such as landscape aesthetics (41.1%), rural tourism (30.2%), forest edges (32.9%), and irrigation ponds (24.8%) within remarkably small food production areas (12.3% of cultivated fields).

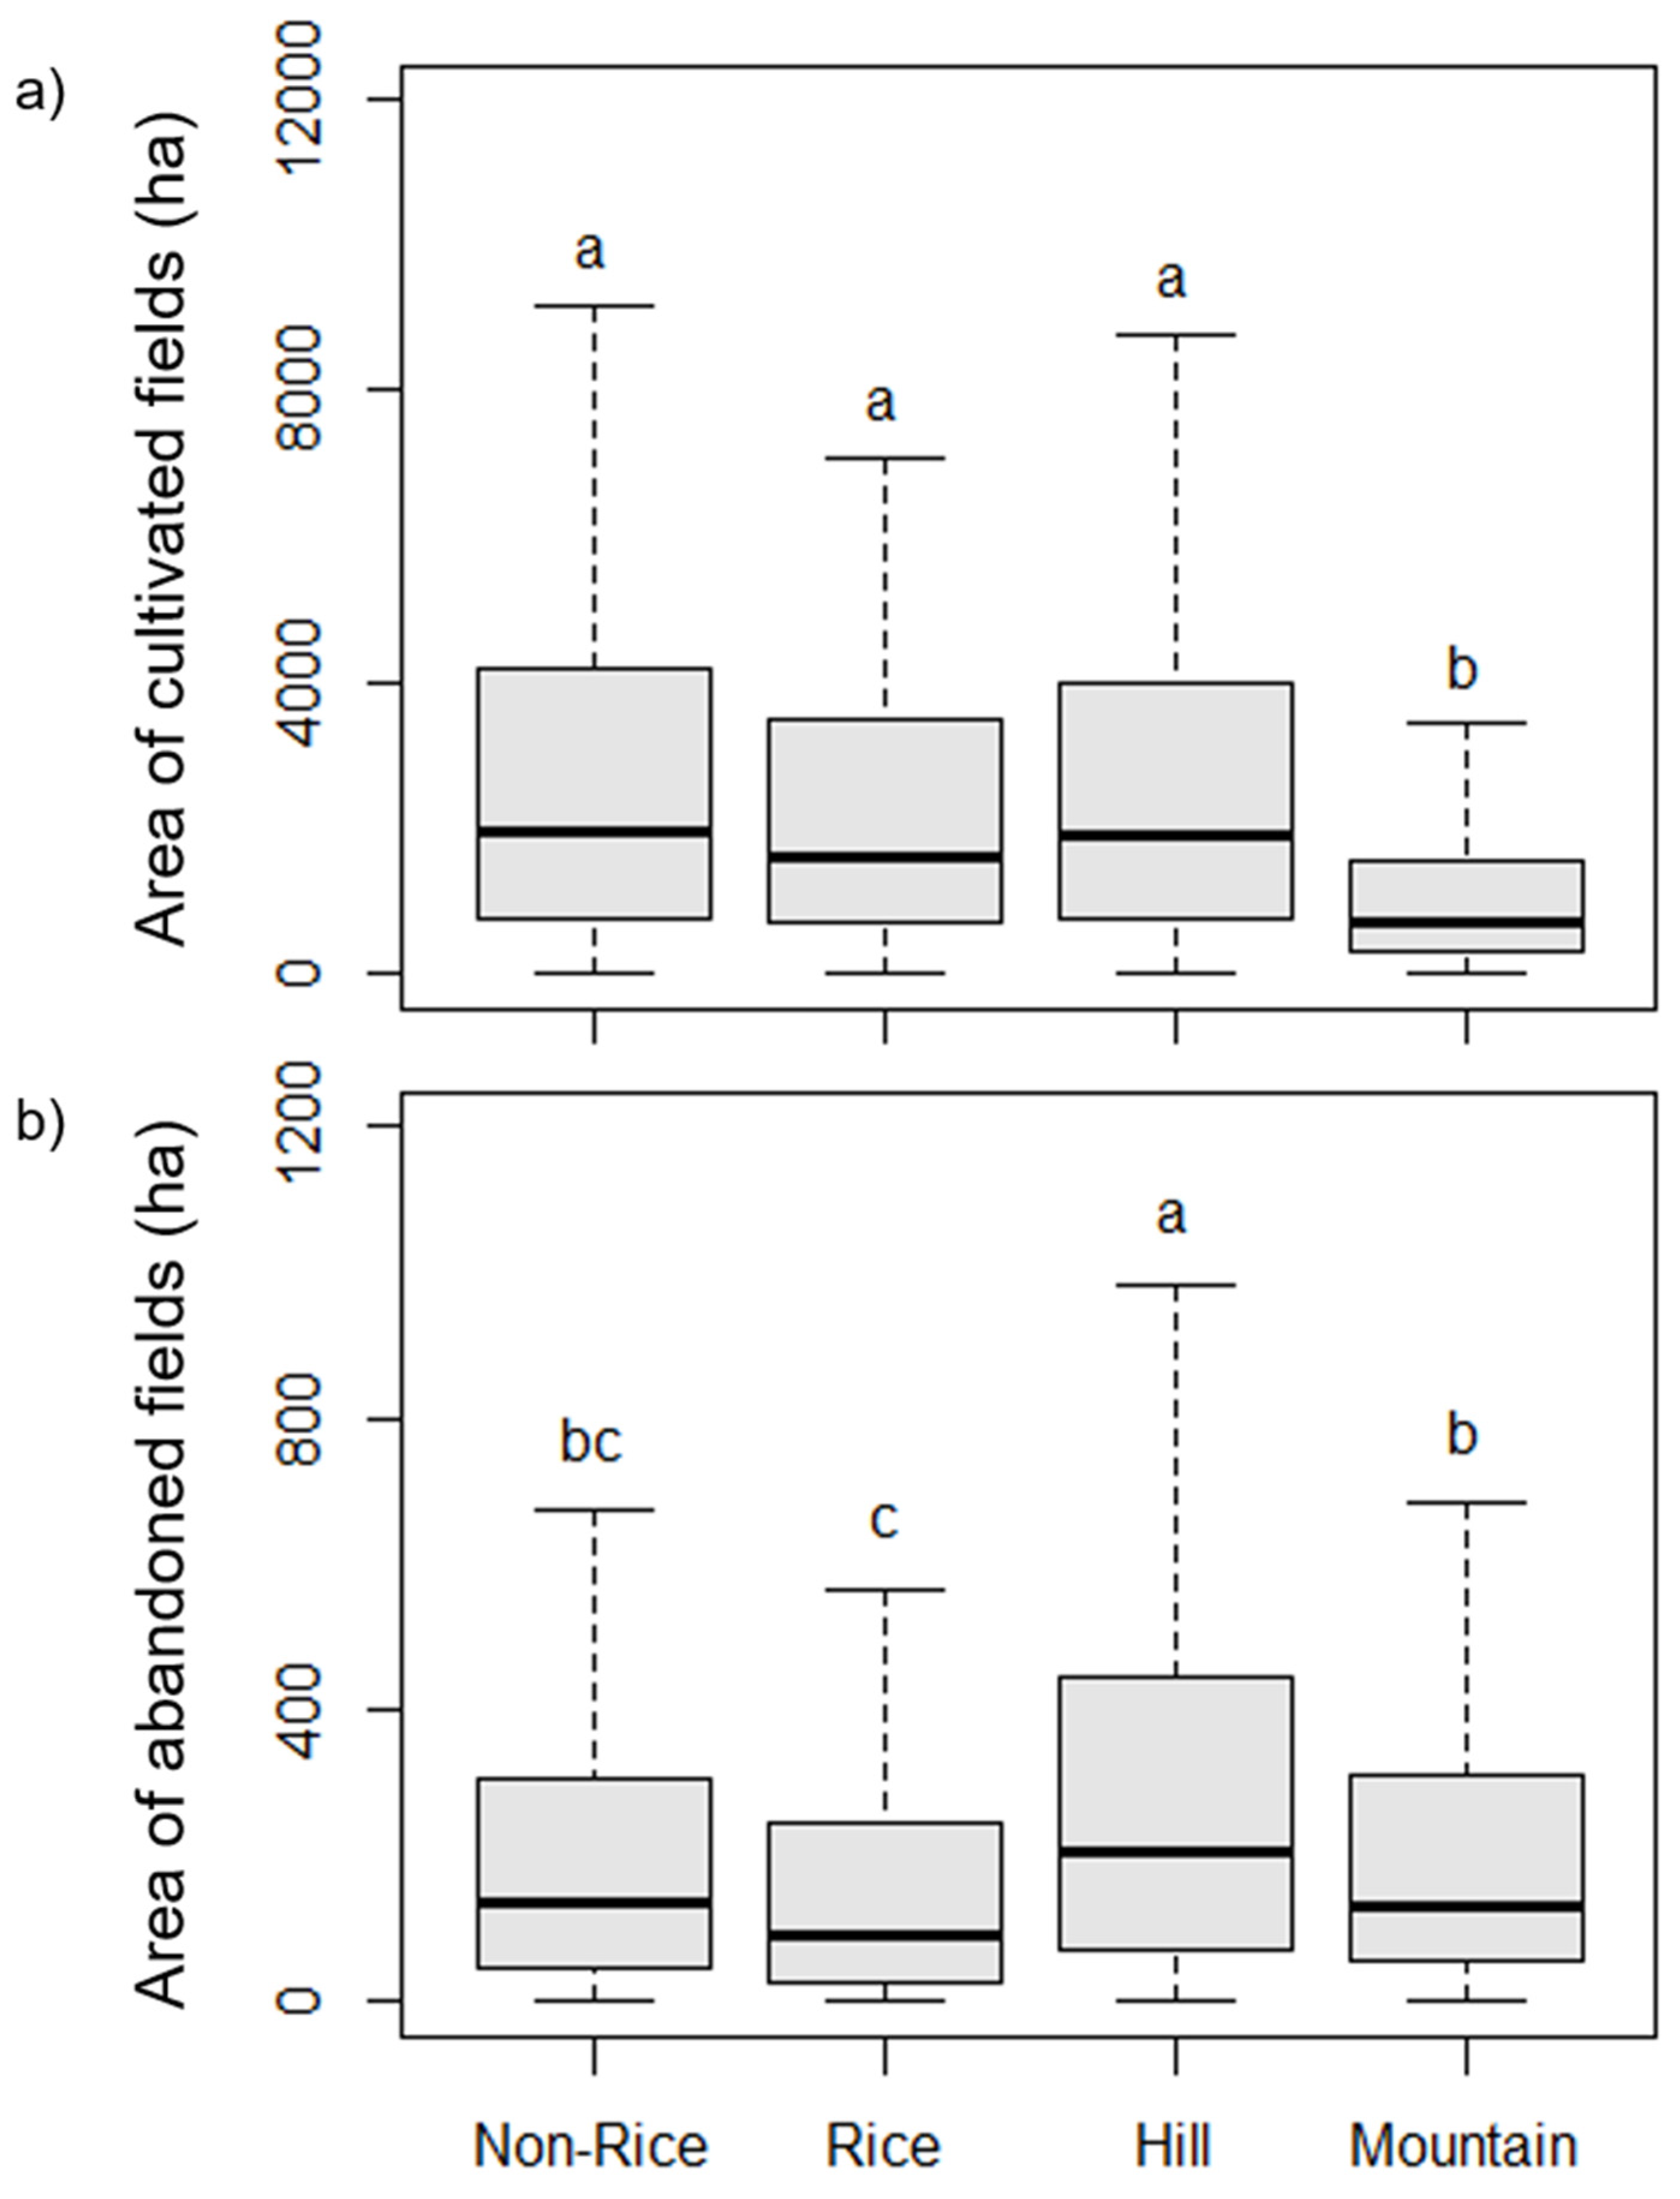
3.3. Farmland Abandonment

Different distribution patterns of abandoned fields were observed among the ecosystem service bundles (n = 1651; Figure 3; Kruskal–Wallis Test, all p < 0.001). The Hill bundle had the largest area of abandoned fields (Figure 3b), although that of cultivated fields did not significantly differ from those of the Non-Rice and Rice bundles (Figure 3a). The Mountain bundle had a markedly large area of abandoned fields (Figure 3b), given its smallest cultivated area (Figure 3a). In total, the Non-Rice, Rice, Hill, and Mountain bundles comprised 34.3%, 21.9%, 31.5%, and 12.3% of 4,496,697 ha cultivated fields in 2015, respectively, and did 20.1%, 16.0%, 38.5%, and 25.4% of 419,978 ha abandoned fields, respectively. Farmland abandonment was observed all over Japan, with higher abandonment trends in the hilly and mountainous areas.

4. Discussion

Our study demonstrated that ecosystem services and biodiversity linked to agroecosystems are spatially aggregated and form hotspots in hilly and mountainous regions in Japan. The ecosystem service and biodiversity hotspots coincided with areas with high proportions of abandoned fields, suggesting that ecosystem services and biodiversity established by long-term human–nature interrelationships are at risk. We structure the discussion into three sections: (1) the relationships among ecosystem services in agricultural landscapes in Japan, the resulting spatial patterns of ecosystem services (ecosystem service bundles), and the possible mechanisms that underlie these patterns; (2) the processes leading to farmland abandonment and the feedback effects on agricultural ecosystem services; and (3) the implications for the management of agricultural landscapes in Japan.

4.1. Bundles of Agricultural Ecosystem Services and Biodiversity

The first principal component that separated municipalities according to a forest–agriculture gradient was related to topography. Japan is predominantly covered by forests due to the steepness of its slopes, which limits their suitability for agriculture. In municipalities in flat and easily accessible areas (i.e., the Non-Rice and Rice bundles), relatively large tracts of land were dedicated to agricultural uses, while in municipalities on slopes (i.e., the Hill and Mountain bundles), agriculture was practiced at a smaller scale. The second principal component was linked to a rice–other agricultural production gradient. Three types of agricultural landscapes were distinguished along this axis. The first type corresponded to the Rice bundle represented by high proportions of rice fields on alluvial plains. Biophysical factors such as stable water supply through access to groundwater and surface water and fertile soils created by a long history of sedimentation are responsible for the establishment of the major rice production areas [82]. The second type was associated with the opposite end of the gradient, namely, the Non-Rice bundle. It was found in regions characterized by special conditions; both socioeconomic and ecological factors played a significant role in allocating land for non-rice and dairy farming. For example, the boreal climate in much of Hokkaido is not suited to growing rice, restricting its production to the alluvial plain in the western part of the northernmost island. Dairy farming was promoted by the Japanese government in the second half of the 19th century, contributing to the dominance of this type of agriculture. The Greater Tokyo Area, another region where the Non-Rice bundle is widespread, is focused on producing vegetables and fruits due to its proximity to the capital [83]. The third type was related to the Hill and Mountain bundles characterized by a mixture of rice and other agricultural production. In these regions, rice paddy cultivation occurs on valley bottoms or on terraced fields, whereas other arable fields and grasslands are distributed on the uplands [84]. Irrigation ponds were also an important variable correlated to the second principal component. The majority were found in the western part of the main island Honshu where the Hill and Mountain bundles were dominant.
In the Non-Rice and Rice bundles, food provisioning services were pronounced, but cultural services and biodiversity were relatively low. The contrasting spatial patterns of food production with landscape aesthetics and irrigation ponds were most likely due to the differences in locations where flat farmland and these services are distributed (i.e., terraced fields on slopes and irrigation ponds in areas where water availability is scarce). On the other hand, high levels of food production and low levels of forest edges and rural tourism have possibly occurred due to land being diverted to agriculture. Productive and easily accessible land is generally prone to agricultural intensification. Simple landscapes resulting from intensified farming practices might explain the low participation rate of villages in hosting rural tourism in these bundles, as landscape homogenization can lower landscape appreciation of the countryside [85,86]. Our results suggest that prioritizing provisioning services not only induces trade-offs with regulating and cultural services provided by a total landscape (i.e., across land use/land cover types) as reported by previous studies [18,33,35,76,77,87,88,89,90,91], but can also degrade cultural services and biodiversity that are supported by traditional agriculture.
The Hill and Mountain bundles, in contrast, showed a joint supply of cultural services and farmland habitat features in space and have been identified as hotspots for agriculture-related ecosystem services and biodiversity in today’s modern society. Areas with moderate to high proportions of landscape aesthetics coincided with areas where the extent of agricultural activities was constrained due to their topographic conditions. The Hill and Mountain bundles also revealed a high potential for biodiversity support, as shown by moderate to high levels of forest edges and irrigation ponds. Our finding is in line with previous studies, which reported that high nature value farmlands in Japan distribute in hilly and terraced landscapes where a mosaic of landscape elements occur within a limited area [11,13]. In Japan, a significant portion of farmland biodiversity has been lost due to land consolidation [40]. Traditional agricultural land which remains unconsolidated is most likely to occur in hilly and mountainous areas, as steep slopes impede modernization of agriculture. In addition, the two bundles showed the highest participation rate of villages in promoting rural tourism. Traditional rural landscapes like terraced fields and coppice woodlands are strongly linked to people’s emotional attachment in Japan [52] and are considered to be the key source of rural tourism [58,59]. High occurrence of these landscape elements in areas of active rural tourism found in our study supports people’s preference for such landscapes.
Overall, our broad analysis showed that the Hill and Mountain bundles are key to sustaining food security, cultural values, and farmland biodiversity, as these two bundles together accounted for two to three quarters of agricultural ecosystem services and biodiversity in Japan. One should note, however, that the study did not consider regulating services provided by agroecosystems, as many of them would either increase along with secondary succession or are not quantifiable at the national level due to their dependence on site-specific conditions and management intensity. Examples for the latter case include pollination and pest control for crops and mitigation of hazards such as landslides and floods. Mitigation of landslide damages is often optimized according to local ecological knowledge, where people for instance allocate grassland on slopes of thin-layer volcanic soil to keep the biomass or potential mass flows small [92]. In some parts of Japan, the locals utilize agricultural land as a retarding basin by the use of traditional open levees and mitigate flood damages at the site and downstream [93]. For ecosystem services optimized at the local level, suitable proxies were not available for all municipalities in Japan, and regional scales are suited to studies that investigate where and to what extent services are maintained by agricultural management. Since cultural diversity and biological diversity are the long-term outcomes of social–ecological systems [10,15,16,19], we think that the analysis of the selected indicators nevertheless provides useful insights into the challenges and opportunities involved in the maintenance and conservation of goods and services that are linked to agroecosystems in Japan.
Other limitations of the study are related to the use of an ecosystem service bundles approach. First, ecosystem service bundles delineated by cluster analysis are dependent on the variables used [87]. It is possible that different sets of ecosystem services and their indicators produce different cluster solutions, but we consider that overall clustering patterns would not be too deviated from the one presented here. This is because, in a country like Japan, where there is a clear contrast between areas of flat land and steep slopes, we would expect variables selected for agriculture-related ecosystem services and habitat features to reflect the topographic gradient to some extent. Variables would also be influenced by the gradient of rice and non-rice farming systems, which determines the types of agricultural infrastructure maintained as well as associated ecosystem services and biodiversity [13]. It is likely that cluster solutions fit somewhere along the two gradients, unless there are region-specific services that would override the influences of the gradients. Second, we assumed all services and biodiversity to be of equal weight. We did so because we do not have the a priori knowledge necessary for assigning different values. Their valuation can also vary considerably among different groups of people, even for the same service in the same region [94]. Instead of ‘valuing’ the bundles by giving them different weights, we considered them as a measure of ecosystem service diversity representing the number of services and the intensity with which they are delivered, as in the previous study done by Rodriguez-Loinaz et al. [95].

4.2. Ecosystem Service and Biodiversity Hotspots at Risk of Farmland Abandonment

Hotspots of agricultural ecosystem services and farmland biodiversity and areas of high abandonment trends overlapped spatially, as the largest area of abandoned fields was found in the Hill bundle and the second largest in the Mountain bundle, given its smallest agricultural area. This spatial coincidence is probably associated with shared drivers inherent in hilly and mountainous regions. For instance, the conversion of traditional landscapes to more simplified landscapes has occurred in regions where biophysical and structural conditions for agriculture are favorable [96]. Traditional farming systems on marginal land have thereby avoided landscape homogenization processes. Agricultural intensification can, however, occur alongside abandonment of less productive land [97], meaning that it indirectly induces farmland abandonment to take place in hilly and mountainous regions where ecosystem service hotspots persist. Natural disadvantages such as steep slopes and difficult access are themselves the geo-physical causes of farmland abandonment [5].
Succession on abandoned fields generally leads to communities dominated by trees and replaces agricultural ecosystem services by forest ecosystem services over time. In Japan, adding scrub and trees onto abandoned fields, which comprise 10% of the total farmland areas in 2015 [41], would only contribute to a 1.7% increase in forest area. One of the main negative impacts is clearly the loss of agricultural production potential. The loss is likely to become permanent, because it is increasingly difficult to restart agricultural use once the land has been abandoned [41]. Approximately two thirds of farmland abandonment have occurred in the Hill and Mountain bundles, and these two bundles were responsible for 58% of rice production and 27% of other agricultural production in Japan. As they constitute a large part of food security in the country, measures need to be taken to avoid a permanent loss of agricultural production potential from these special locations.
Previous studies revealed that farmland abandonment occurs at the expense of cultural heritage and aesthetic landscape values [2,23,98]. In our study, the Hill and Mountain bundles were shown to be responsible for more than three quarters of landscape aesthetics and rural tourism, meaning that these cultural values retained in rural Japan are likely be lost due to the cessation of farming practices that is happening at a higher rate across the country. The loss of character or identity unique to traditional farming systems might weaken the emotional bonds that people have established to these places [99]. Such character loss also implies that municipalities active in rural tourism (i.e., those in hilly and mountainous areas) might lose the opportunity to explore economic alternatives, which would hinder rural development in these regions. Degradation of cultural services on top of declining agricultural economy due to farmland loss puts pressure on the maintenance of viability in rural areas.
Another issue is the loss of biological diversity uniquely established in social–ecological systems [16]. First of all, forest expansion is likely to put open-landscape specialists at risk of local and regional extinction due to the small area of their habitats available in Japan [100]. With regard to paddy fields, a meta-analysis by Koshida and Katayama [101] revealed that abandonment effects on multiple groups of taxa were negative overall, and implied that abandonment is not necessarily followed by ecological restoration in cases where farming practices support high levels of biodiversity. The loss of secondary wetland habitats (i.e., paddy fields) and associated landscape elements (e.g., field margins, irrigation channels, ponds, and forest edges) is found to have deteriorating effects on farmland biodiversity in many cases [11,13,101]. In our study, the Hill and Mountain bundles accounted for 64% of forest edges and 87% of irrigation ponds, contributing largely to supporting farmland biodiversity in Japan. Threatened plant species that depend on certain farming practices were also found to be in areas of high abandonment trends according to studies conducted in Japan [22,102]. High probabilities of farmland abandonment taking place in areas with high biodiversity potential have also been reported elsewhere. In Europe, areas at risk of abandonment were found to occur in areas with a large proportion of high nature value (HNV) farmland, which includes a range of semi-natural habitats and associated species of nature conservation importance [7,21,103]. There, projections even suggest that abandonment could further take place in HNV farmland areas, leading to a decline in farmland biodiversity [98,104]. Japan is likely to follow spatial trends similar to Europe, as farmland abandonment is expected to occur on marginal land [39], where high amounts of farmland habitat features are maintained.

4.3. Management Implications

Management schemes that aim to maintain agricultural ecosystem services and farmland biodiversity provided by agroecosystems should target locations where abandonment pressure is likely severest [22], i.e., hilly and mountainous areas, as their hotspots were shown to be at risk of disappearance due to farmland abandonment.
In 2000, the Japanese government introduced a direct payment scheme specifically targeted at hilly and mountainous areas [57]; it aims at preventing further farmland abandonment in these disadvantaged areas. It is an adaptation of the European Union’s Less Favoured Areas (LFA) measure. As in the EU, the Japanese LFA payments are designed to ensure a continuation of farming through provision of an annual compensatory allowance for permanent natural disadvantages. The Japanese LFA differs from the European one in that payments are made to rural communities, not to individual farmers. The idea is that members use the payments to engage in community activities that contribute to maintaining agricultural production (e.g., prevention of abandoning fields, management of common pool resources such as irrigation facilities and farmland roads, and machine sharing; see [105] for further details). The payment scheme is widely accepted in Japan, where 72% of rural communities eligible to receive LFA payments took the opportunity in 2005 [106]. According to a survey conducted toward LFA participants [107], approximately 80% of rural communities evaluated the payments as positive for the prevention of farmland abandonment. Although modest, LFA payments were found to have positive effects on continued farming through the maintenance of farm households and their members [105]. The scheme also contributes to increased communication among community members, as it requires them to plan together and to take shared roles [107]. Its implementation has led to the development of another direct payment scheme, i.e., multifunctional payment, which provides support for community activities in a similar manner but to a broader audience working on agricultural land. It appears that the policy tools do contribute to the maintenance of agricultural production but are not sufficient enough to support rural areas, as agricultural land has increasingly been abandoned despite these efforts [40].
The FAO [108] recommends that issues of land abandonment should be taken with a broader approach, which contributes to the revitalization of marginal areas. They propose different policy options according to agronomic potential and population density of marginal areas: revitalization through nature, recreation, and economic development. Revitalization through nature applies to cases where both agronomic potential and population density are low, e.g., remote and mountainous areas. The standpoint of this approach is that agriculture produces public goods and services, and that positive externalities should be preserved and compensated for. Examples include public goods-based incentives established for terraced fields through the latest LFA payments, where the government compensates JPY (approximately 94.39 USD or 77.58 EUR on 25 February 2020) 0.1 ha−1 year−1 for terraced landscape conservation [57]. Such agricultural support should also be applicable to agricultural areas of natural and cultural significance like FAO Globally Important Agricultural Heritage Systems (GIAHS). Moreover, agroecosystems represented by positive and sustained long-term outcomes that are taking place outside protected areas have the potential to contribute to the IUCN’s ‘other effective area-based conservation measures’ [109]. Their integration in well-connected conservation systems will be important for ensuring a range of positive conservation outcomes as well as for the achievement of Aichi Target 11. The second approach, i.e., revitalization through recreation, is suggested for areas where agronomic potential is low and population density is medium to high. The main objective here is to maintain characteristic landscapes by utilizing available natural and human capitals, like off-farm activities such as rural tourism. Our study showed consistent results with this approach, as agricultural landscapes in the Hill bundle, which were characterized by cultural and biological diversity, benefited from rural tourism the most. In these areas, farmers have opportunities to explore incomes from direct selling, organic food, and branding and labelling of local products. The third approach, i.e., revitalization through economic development, is recommended when agronomic potential is high and population density is low. The primary concern is to maintain a satisfactory population base by transforming a primary sector-based economy into a highly diversified, secondary and tertiary sector-based rural economy. Not many rural areas fall under this category in a developed society where usable land is limited, but revitalization through agricultural development will be essential under depopulation conditions in Japan. At last, areas with high agronomic potential and high population density are mostly urban or peri-urban areas, where problems are more related to environmental pollution and landscape degradation. Revitalization policies are not required for these areas, but eco-friendly farming should be promoted in order to keep the environment healthy and sustainable.
In Japan, the population is expected to decline by 25% compared to its peak year 2008 by 2050, where population ages 65 and above will make up approximately 40% of the total population [110]. In addition to demographic issues, it is reported that almost a half of today’s abandoned fields are owned by non-farmers [111], e.g., absentee landowners who live far away from land which they inherited from older generations. Such socio-economic structures make it difficult for the national government and regional authorities to reach landowners and prescribe appropriate measures with agricultural and rural development policies. Considering that not all communities are viable in the future due to depopulation problems, re-naturalization should also be seen as one land management option. Similar discussion exists for secondary forests, where it is stated that leaving land for natural processes may be wise if it is in a state close to natural forests [112]. In the case of farmland, active interventions such as afforestation and its maintenance at early development stages might be needed to foster succession and mitigate negative consequences of land abandonment like soil erosion. If agricultural land has to be abandoned completely, broadleaf species should be promoted for reforestation in order to keep land in good environmental condition.

5. Conclusions

Our study demonstrated that agricultural ecosystem services and farmland biodiversity in Japanese agroecosystems are spatially linked and form ecosystem service bundles. Trade-offs were found between provisioning services and cultural services as well as biodiversity indicators. Ecosystem service hotspots occurred in areas where farmland abandonment is pronounced, suggesting that existing support schemes for agriculture in marginal areas have not been sufficient to counteract the underlying socio-economic drivers. Large quantities of agricultural ecosystem services and farmland biodiversity may be lost if farmland abandonment continues to follow the recent spatial trends at the national level. We consider that regional studies addressing a wider range of indicators will help develop more comprehensive assessments of ecosystem services and biodiversity supported by agroecosystems. Contributions of agricultural land to regulating services as part of ecosystem-based disaster risk reduction (Eco-DRR) will be particularly important owing to the increasing frequency of extreme weather events associated with climate change. Integrated evaluation of the multiple functions of agricultural areas should be included in monitoring schemes to improve policies that aim to ensure sustainable development of rural areas in Japan.

Supplementary Materials

The following are available online at https://www.mdpi.com/article/10.3390/land10101031/s1, SM1 Classification table of 774 vegetation communities recorded in the Actual Vegetation Map of Japan into 22 land-cover types. Classification was done in reference to the work by Ogawa et al., and land-cover types used in this study were those suggested by FAO; SM2 Pearson correlation coefficients between pairs of indicators of agricultural ecosystem services and farmland biodiversity; SM3. Average values and standard deviations (mean ± SD) of agricultural ecosystem services and farmland biodiversity found within each bundle. Kruskal-Wallis test and Mann-Whitney’s U test were performed to test the differences among and between the bundles, respectively.

Author Contributions

Conceptualization, K.S. and S.H.; methodology, K.S.; validation, K.S., S.H., T.I., T.D. and V.W.; formal analysis, K.S.; investigation, K.S.; resources, V.W.; data curation, K.S.; writing—original draft preparation, K.S. and S.H.; writing—review and editing, K.S., S.H., T.I., T.D. and V.W.; visualization, K.S., S.H. and V.W.; supervision, S.H. and V.W.; project administration, S.H. and V.W.; funding acquisition, V.W. All authors have read and agreed to the published version of the manuscript.

Funding

The study was supported by the German Federal Ministry of Education and Research (BMBF) in the JAGUAR project (project-ID 01LC1106A).

Data Availability Statement

All data and materials are available upon request.

Conflicts of Interest

The authors declare no conflict of interest.

References

  1. Baldock, D.; Beaufoy, G.; Brouwer, F.; Godeschalk, F. Farming at the Margins: Abandonment or Redeployment of Agricultural Land in Europe; Institute for European Environmental Policy: London, UK; The Hague, The Netherlands, 1996; ISBN 9789052423685. [Google Scholar]
  2. MacDonald, D.; Crabtree, J.R.; Wiesinger, G.; Dax, T.; Stamou, N.; Fleury, P.; Gutierrez Lazpita, J.; Gibon, A. Agricultural abandonment in mountain areas of Europe: Environmental consequences and policy response. J. Environ. Manag. 2000, 59, 47–69. [Google Scholar] [CrossRef]
  3. Queiroz, C.; Beilin, R.; Folke, C.; Lindborg, R. Farmland abandonment: Threat or opportunity for biodiversity conservation? A global review. Front. Ecol. Environ. 2014, 12, 288–296. [Google Scholar] [CrossRef]
  4. Benayas, J.M.R.; Martins, A.; Nicolau, J.M.; Schulz, J.J. Abandonment of agricultural land: An overview of drivers and consequences. CAB Rev. Perspect. Agric. Vet. Sci. Nutr. Nat. Resour. 2007, 2, 1–14. [Google Scholar] [CrossRef] [Green Version]
  5. Gellrich, M.; Zimmermann, N.E. Investigating the regional-scale pattern of agricultural land abandonment in the Swiss mountains: A spatial statistical modelling approach. Landsc. Urban Plan. 2007, 79, 65–76. [Google Scholar] [CrossRef]
  6. Su, G.; Okahashi, H.; Chen, L. Spatial pattern of farmland abandonment in Japan: Identification and determinants. Sustainability 2018, 10, 3676. [Google Scholar] [CrossRef] [Green Version]
  7. Pointereau, P.; Coulon, F.; Pierre, G.; Lambotte, M.; Stuczynski, T.; Ortega, V.S.; Del Rio, A. Analysis of Farmland Abandonment and the Extent and Location of Agricultural Areas that Are Actually Abandoned or Are in Risk to be Abandoned: JRC Scientific and Technical Reports; JRC: Luxembourg, 2008. [Google Scholar]
  8. Power, A.G. Ecosystem services and agriculture: Tradeoffs and synergies. Philos. Trans. R. Soc. B Biol. Sci. 2010, 365, 2959–2971. [Google Scholar] [CrossRef] [PubMed]
  9. Duraiappah, A.K.; Nakamura, K.; Takeuchi, K.; Watanabe, M.; Nishi, M. Satoyama–Satoumi Ecosystems and Human Well-Being: Socio-Ecological Production Landscapes of Japan; United Nations University: Tokyo, Japan, 2012; ISBN 9789280812107. [Google Scholar]
  10. Plieninger, T.; Bieling, C. Resilience and the Cultural Landscape; Cambridge University Press: Cambridge, UK, 2012; ISBN 9781139107778. [Google Scholar]
  11. Katoh, K.; Sakai, S.; Takahashi, T. Factors maintaining species diversity in satoyama, a traditional agricultural landscape of Japan. Biol. Conserv. 2009, 142, 1930–1936. [Google Scholar] [CrossRef]
  12. Takeuchi, K. Rebuilding the relationship between people and nature: The Satoyama Initiative. Ecol. Res. 2010, 25, 891–897. [Google Scholar] [CrossRef] [Green Version]
  13. Natuhara, Y. Ecosystem services by paddy fields as substitutes of natural wetlands in Japan. Ecol. Eng. 2013, 56, 97–106. [Google Scholar] [CrossRef]
  14. Berkes, F.; Colding, J.; Folke, C. Rediscovery of Traditional Ecological Knowledge as Adaptive Management. Ecol. Appl. 2000, 10, 1251–1262. [Google Scholar] [CrossRef]
  15. Antrop, M. Why landscapes of the past are important for the future. Landsc. Urban Plan. 2005, 70, 21–34. [Google Scholar] [CrossRef]
  16. Mauerhofer, V.; Ichinose, T.; Blackwell, B.D.; Willig, M.R.; Flint, C.G.; Krause, M.S.; Penker, M. Underuse of social-ecological systems: A research agenda for addressing challenges to biocultural diversity. Land Use Policy 2018, 72, 57–64. [Google Scholar] [CrossRef]
  17. Cetinkaya, G. Challenges for the maintenance of traditional knowledge in the Satoyama and Satoumi ecosystems, Noto Peninsula, Japan. Hum. Ecol. Rev. 2009, 16, 27–40. [Google Scholar]
  18. Früh-Müller, A.; Hotes, S.; Breuer, L.; Wolters, V.; Koellner, T. Regional patterns of ecosystem services in cultural landscapes. Land 2016, 5, 17. [Google Scholar] [CrossRef]
  19. Plieninger, T.; Höchtl, F.; Spek, T. Traditional land-use and nature conservation in European rural landscapes. Environ. Sci. Policy 2006, 9, 317–321. [Google Scholar] [CrossRef]
  20. Fischer, J.; Hartel, T.; Kuemmerle, T. Conservation policy in traditional farming landscapes. Conserv. Lett. 2012, 5, 167–175. [Google Scholar] [CrossRef] [Green Version]
  21. Keenleyside, C.; Tucker, G.M. Farmland Abandonment in the EU: An Assessment of Trends and Prospects: Report Prepared for WWF.; Institute for European Environmental Policy: London, UK, 2010. [Google Scholar]
  22. Osawa, T.; Kohyama, K.; Mitsuhashi, H. Areas of increasing agricultural abandonment overlap the distribution of previously common, currently threatened plant species. PLoS ONE 2013, 8, 1–9. [Google Scholar] [CrossRef] [Green Version]
  23. Schirpke, U.; Timmermann, F.; Tappeiner, U.; Tasser, E. Cultural ecosystem services of mountain regions: Modelling the aesthetic value. Ecol. Indic. 2016, 69, 78–90. [Google Scholar] [CrossRef] [Green Version]
  24. Tasser, E.; Mader, M.; Tappeiner, U. Effects of land use in alpine grasslands on the probability of landslides. Basic Appl. Ecol. 2003, 4, 271–280. [Google Scholar] [CrossRef]
  25. Ruecker, G.; Schad, P.; Alcubilla, M.M.; Ferrer, C. Natural regeneration of degraded soils and site changes on abandoned agricultural terraces in Mediterranean Spain. Land Degrad. Dev. 1998, 9, 179–188. [Google Scholar] [CrossRef]
  26. Houghton, R.A.; Hackler, J.L.; Lawrence, K.T. The U.S. carbon budget: Contributions from land-use change. Science 1999, 285, 574–578. [Google Scholar] [CrossRef] [PubMed]
  27. Bruijnzeel, L.A. Hydrological functions of tropical forests: Not seeing the soil for the trees? Agric. Ecosyst. Environ. 2004, 104, 185–228. [Google Scholar] [CrossRef]
  28. Navarro, L.M.; Pereira, H.M. Rewilding Abandoned Landscapes in Europe. Ecosystems 2012, 15, 900–912. [Google Scholar] [CrossRef] [Green Version]
  29. Laiolo, P.; Dondero, F.; Ciliento, E.; Rolando, A. Consequences of pastoral abandonment for the structure and diversity of the alpine avifauna. J. Appl. Ecol. 2004, 41, 294–304. [Google Scholar] [CrossRef]
  30. Zakkak, S.; Kakalis, E.; Radović, A.; Halley, J.M.; Kati, V. The impact of forest encroachment after agricultural land abandonment on passerine bird communities: The case of Greece. J. Nat. Conserv. 2014, 22, 157–165. [Google Scholar] [CrossRef]
  31. Fu, B.; Zhang, L.; Xu, Z.; Zhao, Y.; Wei, Y.; Skinner, D. Ecosystem services in changing land use. J. Soils Sediments 2015, 15, 833–843. [Google Scholar] [CrossRef]
  32. Ministry of the Environment. Satoyama Initiative: Aiming at Realizing Socieities in Harmony with Nature. Available online: https://www.env.go.jp/nature/satoyama/pamph/en_satoyama_initiative_pamph.pdf (accessed on 20 September 2021).
  33. Raudsepp-Hearne, C.; Peterson, G.D.; Bennett, E.M. Ecosystem service bundles for analyzing tradeoffs in diverse landscapes. Proc. Natl. Acad. Sci. USA 2010, 107, 5242–5247. [Google Scholar] [CrossRef] [Green Version]
  34. Hamann, M.; Biggs, R.; Reyers, B. Mapping social-ecological systems: Identifying “green-loop” and “red-loop” dynamics based on characteristic bundles of ecosystem service use. Glob. Environ. Chang. 2015, 34, 218–226. [Google Scholar] [CrossRef]
  35. Baró, F.; Gómez-Baggethun, E.; Haase, D. Ecosystem service bundles along the urban-rural gradient: Insights for landscape planning and management. Ecosyst. Serv. 2017, 24, 147–159. [Google Scholar] [CrossRef] [Green Version]
  36. Frei, B.; Renard, D.; Mitchell, M.G.E.; Seufert, V.; Chaplin-Kramer, R.; Rhemtulla, J.M.; Bennett, E.M. Bright spots in agricultural landscapes: Identifying areas exceeding expectations for multifunctionality and biodiversity. J. Appl. Ecol. 2018, 55, 2731–2743. [Google Scholar] [CrossRef]
  37. Statistics Bureau. Statistical Handbook of Japan 2015. Available online: http://www.stat.go.jp/english/data/handbook/pdf/2015all.pdf (accessed on 31 March 2021).
  38. Ministry of Agriculture Forestry and Fisheries. Crop Statistics 2015: Farmland Area. Available online: https://www.maff.go.jp/j/tokei/kouhyou/sakumotu/menseki/index.html#r (accessed on 7 June 2017). (In Japanese).
  39. Ichinose, T.; Asmiwyati, I.G.A.A.R.; Kataoka, M.; Arifin, N.H.S. Land-use change and irrigation systems in the agricultural landscape of terraced paddy fields in Awaji Island, central Japan. Landsc. Ecol. Eng. 2007, 3, 171–177. [Google Scholar] [CrossRef]
  40. Katayama, N.; Baba, Y.G.; Kusumoto, Y.; Tanaka, K. A review of post-war changes in rice farming and biodiversity in Japan. Agric. Syst. 2015, 132, 73–84. [Google Scholar] [CrossRef]
  41. Ministry of Agriculture Forestry and Fisheries. Prevention and Reduction of Devastated Agricultural Land. Available online: https://www.maff.go.jp/j/nousin/tikei/houkiti/ (accessed on 28 March 2021). (In Japanese).
  42. Ministry of the Environment. Land-Use Changes after 1850 (Grassland, Farmland, Inland Water, and Coast). Available online: https://www.biodic.go.jp/biodiversity/activity/policy/kyosei/23-2/files/1-2.pdf (accessed on 30 March 2021). (In Japanese).
  43. Council of Local Authorities for International Relations. Local government in Japan 2016 (2019 revised edition). Available online: http://www.clair.or.jp/j/forum/pub/docs/jichi2019-en.pdf (accessed on 6 August 2021).
  44. Environment Agency; Asia Air Survey Co. Ltd. The 5th National Survey on the Natural Environment: Report of Vegetation Survey 1999; Environment Agency: Tokyo, Japan, 1999. (In Japanese) [Google Scholar]
  45. Gregorio, A.D.; Jansen, L.J.M. Land Cover Classification System (LCCS): Classification Concepts and User Manual; FAO: Rome, Italy, 2000; ISBN 9789251042168. [Google Scholar]
  46. Ogawa, M.; Takenaka, A.; Kadoya, T.; Ishihama, F.; Yamano, H.; Akasaka, M. A comprehensive new land-use classification map for Japan for biodiversity assessment and species distribution modeling. Jpn. J. Conserv. Ecol. 2013, 18, 69–76. (In Japanese) [Google Scholar] [CrossRef]
  47. Maes, J.; Paracchini, M.M.L.; Zulian, G. A European Assessment of the Provision of Ecosystem Services: JRC Scientific and Technical Reports; JCR: Luxembourg, 2011; ISBN 9789279196638. [Google Scholar]
  48. Ministry of Agriculture Forestry and Fisheries. Crop Statistics 2015: Farmland Area by Municipalities. Available online: https://www.e-stat.go.jp/stat-search/files?page=1&layout=datalist&toukei=00500215&tstat=000001013427&cycle=7&year=20150&month=0&tclass1=000001033085&tclass2=000001079196 (accessed on 7 June 2017). (In Japanese).
  49. Geospatial Information Authority of Japan. Area of Prefectures and Municipalities 2015. Available online: https://www.gsi.go.jp/KOKUJYOHO/MENCHO-title.htm (accessed on 20 October 2014). (In Japanese).
  50. Ministry of Agriculture Forestry and Fisheries. Crop Statistics 2015: Area of Upland Fields, Pasture, and Permanent Crops. Available online: https://www.maff.go.jp/j/tokei/kouhyou/sakumotu/me (accessed on 30 June 2017). (In Japanese).
  51. Fukamachi, K. Sustainability of terraced paddy fields in traditional satoyama landscapes of Japan. J. Environ. Manag. 2017, 202, 543–549. [Google Scholar] [CrossRef]
  52. Kieninger, P.R.; Penker, M.; Yamaji, E. Esthetic and spiritual values motivating collective action for the conservation of cultural landscape—A case study of rice terraces in Japan. Renew. Agric. Food Syst. 2013, 28, 364–379. [Google Scholar] [CrossRef]
  53. Chen, B.; Qiu, Z.; Nakamura, K. Tourist preferences for agricultural landscapes: A case study of terraced paddy fields in Noto Peninsula, Japan. J. Mt. Sci. 2016, 13, 1880–1892. [Google Scholar] [CrossRef]
  54. Iiyama, N.; Kamada, M.; Nakagoshi, N. Ecological and social evaluation of landscape in a rural area with terraced paddies in southwestern Japan. Landsc. Urban Plan. 2005, 70, 301–313. [Google Scholar] [CrossRef]
  55. Japan Top 100s—Database Broken Down by Prefecture: Japan Top 100s. Available online: http://j100s.com/en/ (accessed on 6 August 2021).
  56. Ministry of Land Infrastructure Transport and Tourism. Elevation, Degree of Slope 5th Mesh Data. Available online: http://nlftp.mlit.go.jp/ksj-e/gml/datalist/KsjTmplt-G04-d.html (accessed on 20 October 2015).
  57. Ministry of Agriculture Forestry and Fisheries. Direct Payment for Hilly and Mountainous Areas. Available online: https://www.maff.go.jp/j/nousin/tyusan/siharai_seido/attach/pdf/index-29.pdf (accessed on 28 March 2021). (In Japanese).
  58. Agency for Cultural Affairs. The Report of the Study on the Protection of Cultural Landscapes Associated with Agriculture, Forestry and Fisheries. Available online: https://dl.ndl.go.jp/view/download/digidepo_1164546_po_nourinsuisan.pdf?contentNo=1&alternativeNo= (accessed on 31 March 2021).
  59. Garrod, B.; Wornell, R.; Youell, R. Re-conceptualising rural resources as countryside capital: The case of rural tourism. J. Rural Stud. 2006, 22, 117–128. [Google Scholar] [CrossRef]
  60. Ministry of Agriculture Forestry and Fisheries. About Green Tourism. Available online: https://www.env.go.jp/nature/ecotourism/try-ecotourism/env/review/pdf/3kai/05.pdf (accessed on 31 March 2021). (In Japanese).
  61. Ministry of Agriculture Forestry and Fisheries. Census of Agriculture and Forestry 2015. Available online: https://www.maff.go.jp/j/tokei/census/afc/2015/top.html (accessed on 9 February 2017). (In Japanese).
  62. Natuhara, Y.; Miyoshi, F.; Morimoto, Y. The effect of abandonment of paddy cultivation on the distribution of the Clouded Salamander, Hynobius nebulosus and preliminary test of the habitat restoration. Jpn. J. Environ. Entomol. Zool. 2002, 13, 11–17. [Google Scholar]
  63. Osawa, S.; Katsuno, T. Distribution pattern of amphibian on rural landscape in the middle reaches of the Oita river, northeast Kyusyu. Jpn. Inst. Landsc. Archit. 2005, 68, 563–566, (In Japanese with English summary). [Google Scholar] [CrossRef]
  64. Matsuura, T.; Yokohari, M.; Azuma, A. Identification of potential habitats of gray-faced buzzard in Yatsu landscapes by using digital elevation model and digitized vegetation data. Landsc. Urban Plan. 2005, 70, 231–243. [Google Scholar] [CrossRef]
  65. Kudo, T.; Ozaki, K.; Takao, G.; Sakai, T.; Yonekawa, H.; Ikeda, K. Landscape analysis of northern goshawk breeding home range in northern Japan. J. Wildl. Manag. 2005, 69, 1229–1239. [Google Scholar] [CrossRef]
  66. Kitagawa, Y.; Okubo, S.; Yamada, S.; Takeuchi, K. Species Composition and Species Richness of Herbaceous Vegetation on Lowermost Hillside-slopes in Hilly Yatsuda Landscape. J. Jpn. Inst. Landsc. Archit. 2004, 67, 551–554. [Google Scholar] [CrossRef] [Green Version]
  67. Ministry of Agriculture Forestry and Fisheries. Irrigation Ponds 2014. Available online: https://www.maff.go.jp/j/nousin/bousai/bousai_saigai/b_tameike/ (accessed on 13 June 2017). (In Japanese with English summary).
  68. Deguchi, S.; Katayama, N.; Tomioka, Y.; Miguchi, H. Ponds support higher bird diversity than rice paddies in a hilly agricultural area in Japan. Biodivers. Conserv. 2020, 29, 3265–3285. [Google Scholar] [CrossRef]
  69. Moriyama, H.; Iijima, H.; Shiraki, S.; Osada, M. Species recruitments of the dragonflies sustained by the Yatsuda landscape patterns. Environ. Inf. Sci. 1992, 21, 84–88, (In Japanese with English summary). [Google Scholar]
  70. Mukai, Y.; Baba, N.; Ishii, M. The water system of traditional rice paddies as an important habitat of the giant water bug, Lethocerus deyrollei (Heteroptera: Belostomatidae). J. Insect Conserv. 2005, 9, 121–129. [Google Scholar] [CrossRef]
  71. Ministry of Agriculture Forestry and Fisheries. Crop Statistics 2014: Area of Rice Fields. Available online: https://www.e-stat.go.jp/stat-search/files?page=1&layout=datalist&toukei=00500215&tstat=000001013427&cycle=7&year=20140&month=0&tclass1=000001033085&tclass2=000001068005 (accessed on 14 June 2017). (In Japanese).
  72. Venables, W.N.; Ripley, B.D. Modern Applied Statistics with S, 4th ed.; Springer: New York, NY, USA, 2002; ISBN 9781441930088. [Google Scholar]
  73. Meyer, D. e1071 R Package. Ver. 1.7-2. Available online: https://cran.r-project.org/web/packages/e1071/index.html (accessed on 8 July 2019).
  74. Dutilleul, P.; Clifford, P.; Richardson, S.; Hemon, D. Modifying the t-Test for Assessing the Correlation between Two Spatial Processes. Biometrics 1993, 49, 305. [Google Scholar] [CrossRef]
  75. Bivand, R.S.; Pebesma, E.; Gomez-Rubio, V. Applied Spatial Data Analysis with R, 2nd ed.; Springer: New York, NY, USA, 2013; ISBN 9781461476177. [Google Scholar]
  76. Turner, K.G.; Odgaard, M.V.; Bøcher, P.K.; Dalgaard, T.; Svenning, J.C. Bundling ecosystem services in Denmark: Trade-offs and synergies in a cultural landscape. Landsc. Urban Plan. 2014, 125, 89–104. [Google Scholar] [CrossRef]
  77. Schirpke, U.; Candiago, S.; Egarter Vigl, L.; Jäger, H.; Labadini, A.; Marsoner, T.; Meisch, C.; Tasser, E.; Tappeiner, U. Integrating supply, flow and demand to enhance the understanding of interactions among multiple ecosystem services. Sci. Total Environ. 2019, 651, 928–941. [Google Scholar] [CrossRef] [PubMed]
  78. Ben-Hur, A.; Guyon, I. Detecting Stable Clusters Using Principal Component Analysis. Funct. Genom. 2003, 224, 159–182. [Google Scholar] [CrossRef]
  79. Legendre, P.; Legendre, L. Numerical Ecology; Elsevier: Oxford, UK, 2012; ISBN 9780444538680. [Google Scholar]
  80. Mouchet, M.A.; Lamarque, P.; Martín-López, B.; Crouzat, E.; Gos, P.; Byczek, C.; Lavorel, S. An interdisciplinary methodological guide for quantifying associations between ecosystem services. Glob. Environ. Chang. 2014, 28, 298–308. [Google Scholar] [CrossRef]
  81. R Core Team. R: A Language and Environment for Statistical Computing. Available online: https://www.r-project.org/ (accessed on 29 March 2016).
  82. Obara, H.; Maejima, Y.; Kohyama, K.; Ohkura, T.; Takata, Y. Outline of the comprehensive soil classification system of Japan—first approximation. Jpn. Agric. Res. Q. 2015, 49, 217–226. [Google Scholar] [CrossRef] [Green Version]
  83. Ministry of Agriculture Forestry and Fisheries. Agriculture, Forestry and Fisheries of Tokyo Prefecture. Available online: https://www.maff.go.jp/kanto/to_jyo/nenpou/pdf/27_13_tokyo_03b.pdf (accessed on 8 March 2021). (In Japanese).
  84. Takeuchi, K.; Brown, R.D.; Washitani, I.; Tsunekawa, A.; Yokohari, M. Satoyama: The Traditional Rural Landscape of Japan; Springer Science & Business Media: Tokyo, Japan, 2003; ISBN 9784431000075. [Google Scholar]
  85. Hietala-Koivu, R.; Järvenpää, T.; Helenius, J. Value of semi-natural areas as biodiversity indicators in agricultural landscapes. Agric. Ecosyst. Environ. 2004, 101, 9–19. [Google Scholar] [CrossRef]
  86. Van Berkel, D.B.; Verburg, P.H. Spatial quantification and valuation of cultural ecosystem services in an agricultural landscape. Ecol. Indic. 2014, 37, 163–174. [Google Scholar] [CrossRef]
  87. Spake, R.; Lasseur, R.; Crouzat, E.; Bullock, J.M.; Lavorel, S.; Parks, K.E.; Schaafsma, M.; Bennett, E.M.; Maes, J.; Mulligan, M.; et al. Unpacking ecosystem service bundles: Towards predictive mapping of synergies and trade-offs between ecosystem services. Glob. Environ. Chang. 2017, 47, 37–50. [Google Scholar] [CrossRef] [Green Version]
  88. Queiroz, C.; Meacham, M.; Richter, K.; Norström, A.V.; Andersson, E.; Norberg, J.; Peterson, G. Mapping bundles of ecosystem services reveals distinct types of multifunctionality within a Swedish landscape. Ambio 2015, 44, 89–101. [Google Scholar] [CrossRef] [PubMed] [Green Version]
  89. Renard, D.; Rhemtull, J.M.; Bennett, E.M. Historical dynamics in ecosystem service bundles. Proc. Natl. Acad. Sci. USA 2015, 112, 13411–13416. [Google Scholar] [CrossRef] [Green Version]
  90. Jopke, C.; Kreyling, J.; Maes, J.; Koellner, T. Interactions among ecosystem services across Europe: Bagplots and cumulative correlation coefficients reveal synergies, trade-offs, and regional patterns. Ecol. Indic. 2015, 49, 46–52. [Google Scholar] [CrossRef]
  91. Maes, J.; Paracchini, M.L.; Zulian, G.; Dunbar, M.B.; Alkemade, R. Synergies and trade-offs between ecosystem service supply, biodiversity, and habitat conservation status in Europe. Biol. Conserv. 2012, 155, 1–12. [Google Scholar] [CrossRef]
  92. Aso World Heritage Promotion Office. Report on Cultural Landscapes in Aso: 3.2.5 Life and People. Available online: http://www.asosekaibunkaisan.com/files/25_ASO-CL_II_syousai_all.pdf (accessed on 6 August 2021). (In Japanese).
  93. Teramura, J.; Shimatani, Y. Advantages of the open levee (Kasumi-tei), a traditional japanese river technology on the matsuura river, from an ecosystem-based disaster risk reduction perspective. Water 2021, 13, 480. [Google Scholar] [CrossRef]
  94. Gómez-Baggethun, E.; de Groot, R.; Lomas, P.L.; Montes, C. The history of ecosystem services in economic theory and practice: From early notions to markets and payment schemes. Ecol. Econ. 2010, 69, 1209–1218. [Google Scholar] [CrossRef]
  95. Rodríguez-Loinaz, G.; Alday, J.G.; Onaindia, M. Multiple ecosystem services landscape index: A tool for multifunctional landscapes conservation. J. Environ. Manag. 2015, 147, 152–163. [Google Scholar] [CrossRef]
  96. Pinto-Correia, T.; Kristensen, L. Linking research to practice: The landscape as the basis for integrating social and ecological perspectives of the rural. Landsc. Urban Plan. 2013, 120, 248–256. [Google Scholar] [CrossRef]
  97. Busch, G. Future European agricultural landscapes—What can we learn from existing quantitative land use scenario studies? Agric. Ecosyst. Environ. 2006, 114, 121–140. [Google Scholar] [CrossRef]
  98. Van der Zanden, E.H.; Verburg, P.H.; Schulp, C.J.E.; Verkerk, P.J. Trade-offs of European agricultural abandonment. Land Use Policy 2017, 62, 290–301. [Google Scholar] [CrossRef]
  99. Giuliani, M.V. Theory of attachment and place attachment. In Psychological Theories for Environmental Issues; Bonnes, M., Lee, T., Bonaiuto, M., Eds.; Routledge: London, UK, 2003; pp. 137–170. ISBN 9781315245720. [Google Scholar]
  100. Katayama, N.; Amano, T.; Naoe, S.; Yamakita, T.; Komatsu, I.; Takagawa, S.I.; Sato, N.; Ueta, M.; Miyashita, T. Landscape heterogeneity-biodiversity relationship: Effect of range size. PLoS ONE 2014, 9, e93359. [Google Scholar] [CrossRef] [PubMed]
  101. Koshida, C.; Katayama, N. Meta-analysis of the effects of rice-field abandonment on biodiversity in Japan. Conserv. Biol. 2018, 32, 1392–1402. [Google Scholar] [CrossRef] [PubMed]
  102. Uematsu, Y.; Koga, T.; Mitsuhashi, H.; Ushimaru, A. Abandonment and intensified use of agricultural land decrease habitats of rare herbs in semi-natural grasslands. Agric. Ecosyst. Environ. 2010, 135, 304–309. [Google Scholar] [CrossRef]
  103. Renwick, A.; Jansson, T.; Verburg, P.H.; Revoredo-Giha, C.; Britz, W.; Gocht, A.; McCracken, D. Policy reform and agricultural land abandonment in the EU. Land Use Policy 2013, 30, 446–457. [Google Scholar] [CrossRef]
  104. Institute for European Environmental Policy/Alterra Wageningen UR. Reflecting Environmental Land Use Needs into EU Policy: Preserving and Enhancing the Environmental Benefits of “Land Services”: Soil Sealing, Biodiversity Corridors, Intensification/Marginalisation of Land Use and Permanent Grassland: Final Report to the European Commission; Institute for European Environmental Policy/Alterra Wageningen UR: London, UK; Brussels, Belgium; Wageningen, The Netherlands, 2010. [Google Scholar]
  105. Takayama, T.; Hashizume, N.; Nakatani, T. Impact of direct payments on agricultural land use in less-favoured areas: Evidence from Japan. Eur. Rev. Agric. Econ. 2020, 47, 157–177. [Google Scholar] [CrossRef]
  106. Takagishi, Y.; Hashizume, N. Effects of integration at community agreements on direct payment system in hilly mountainous areas. J. Rural Econ. 2010, 260–267. (In Japanese) [Google Scholar]
  107. Ministry of Agriculture Forestry and Fisheries. Direct Payment for Hilly and Mountainous Areas: Mid-Term Report [4th Period]. Available online: https://www.maff.go.jp/j/nousin/tyusan/siharai_seido/pdf/4ki_chukanhyouka_kekka.pdf (accessed on 28 March 2021). (In Japanese).
  108. FAO. The Role of Agriculture and Rural Development in Revitalizing Abandoned/Depopulated Areas; FAO: Rome, Italy, 2006. [Google Scholar]
  109. IUCN. Recognising and Reporting Other Effective Area-Based Conservation Measures. Available online: https://www.env.go.jp/nature/oecm/r2-2ref03.pdf (accessed on 30 March 2021).
  110. Ministry of Land Infrastructure Transport and Tourism. National Spatial Strategy (National Plan). Available online: https://www.mlit.go.jp/common/001127196.pdf (accessed on 28 March 2021).
  111. Ministry of Agriculture Forestry and Fisheries. Abandoned Agricultural Land: Current Situations and Measures. Available online: https://www.maff.go.jp/j/nousin/tikei/houkiti/Genzyo/PDF/Genzyo_0204.pdf (accessed on 13 March 2021). (In Japanese).
  112. Ministry of the Environment. Satoyama Areas that Are Likely to Become Vacant Due to Depopulation. Available online: https://www.biodic.go.jp/biodiversity/activity/policy/map/map22/index.html (accessed on 28 March 2021). (In Japanese).
Figure 1. Spatial distributions of agricultural ecosystem services and farmland biodiversity in Japan at the municipal or prefectural level. Values are classified in quantiles. Moran’s I is all p < 0.001.
Land 10 01031 g001
Figure 2. Results of cluster analysis showing: (a) spatial distributions of ecosystem service bundles and (b) average values of ecosystem services and biodiversity found within each bundle represented in flower diagrams. The number of municipalities per bundle is shown in parentheses next to the bundle names.
Land 10 01031 g002
Figure 3. Boxplots comparing the area of (a) cultivated fields, and (b) abandoned fields in 2015. Significant differences were observed among the bundles (Kruskal–Wallis test all p < 0.001). Different letters indicate significant differences between pairs of bundles (Mann–Whitney U test p <0.05) and are in descending order.
Land 10 01031 g003
Table 1. List of agricultural ecosystem services and farmland biodiversity assessed.
CategoryIndicatorProxyUnitData YearData Scale
ProvisioningRice productionPercent of rice fields in total land(%)2015Municipality
Other agricultural productionPercent of other agricultural fields in total land(%)2015Municipality
CulturalLandscape aestheticsPercent of terraced fields in farmland(%)1998Municipality
Rural tourismPercent of villages that promote rural tourism(%)2015Municipality
BiodiversityForest edgesDensity of forest edges per hectare of farmland(m ha−1)1998Municipality
Irrigation pondsDensity of irrigation ponds per hectare of rice fields(ponds ha−1)2014Prefecture
Note. References for databases are provided in the main body text.
Table 2. Principal component analysis of agricultural ecosystem services and farmland biodiversity at the national level in Japan (n = 1719). Results show PC loadings, eigenvalues, and the proportion of variance explained. Values in bold are the variables with the greatest weight in defining the two ordination axes.
PC1PC2
Rice production0.3970.467
Other agricultural production0.410−0.377
Landscape aesthetics−0.586−0.014
Rural tourism−0.0790.309
Forest edges−0.543−0.197
Irrigation ponds−0.1710.711
Eigenvalue1.5281.142
% variance explained38.921.7
Table 3. Percent share of ecosystem services and biodiversity in total for each ecosystem service bundle.
BundlesNon-RiceRiceHillMountain
Number of municipalities400361474484
Rice production ¹12.928.943.914.3
Other agricultural production ¹59.813.616.610.0
Landscape aesthetics ³20.62.535.841.1
Rural tourism ¹11.411.746.630.2
Forest edges ³29.17.330.732.9
Irrigation ponds ²1.810.962.524.8
Values derived from 1 2015, 2 2014, and 3 1998 data.
Publisher’s Note: MDPI stays neutral with regard to jurisdictional claims in published maps and institutional affiliations.

