Article

The Return of Wooded Landscapes in Wales: An Exploration of Possible Post-Brexit Futures

by
Syed Amir Manzoor
1,2,*,
Geoffrey Griffiths
3,
David Christian Rose
1 and
Martin Lukac
1,4
1
School of Agriculture, Policy & Development, University of Reading, Reading RG6 6EU, UK
2
Department of Forestry & Range Management, Bahauddin Zakariya University Multan, Multan 600 00, Pakistan
3
Department of Geography and Environmental Sciences, University of Reading, Reading RG6 6EU, UK
4
Faculty of Forestry and Wood Sciences, Czech University of Life Sciences Prague, 165 00 Prague, Czech Republic
*
Author to whom correspondence should be addressed.
Land 2021, 10(1), 59; https://doi.org/10.3390/land10010059
Submission received: 16 November 2020 / Revised: 5 January 2021 / Accepted: 8 January 2021 / Published: 11 January 2021

Abstract

:
Changes in agricultural policy may have a rapid impact, even on landscapes which have taken millennia to form. Here we explore the potential impact of the UK leaving the EU as a catalyst for profound changes in the pastoral landscapes of Wales. Impending change of the trading regime governing agricultural produce, concurrent with public pressure to use agricultural subsidies for environmental goals, may lead to unforeseen consequences for the Welsh natural environment. We employ a combination of change demand modelling and a ‘story and simulation approach’ to project the effect of five hypothetical plausible scenarios on land use and land use change in Wales by 2030. We show that the most extreme trade scenario would result in a significant expansion of broadleaf woodland across much of Wales. By contrast, the ‘green futures’ scenario introduced to supersede the Common Agricultural Policy, results in significant expansion of woodland but not at the level seen with the more extreme trade scenarios.

1. Introduction

Natural ecosystems are exposed to constantly changing natural variations in climatic conditions, which drives the long-term adaptation of dominant vegetation types. Prior to human influence, post-glaciation natural succession in Wales resulted a landscape covered by forest; the wildwood in existence about 6000 years ago [1]. European broadleaf temperate rainforests grew here, but forest clearance by people over the millennia has resulted in only remnants surviving on the western fringes of Wales [2]. Human habitation has thus left a significant mark on the Welsh landscape, the current forest cover stands at only around 15% [3], and many forest-dwelling species have declined or disappeared from the country. The Welsh landscape has been profoundly changed by the historical expansion of predominantly sheep grazing, to the extent that much of the upland landscape is now treeless. The pastoral system of sheep rearing has produced a rich and interesting cultural landscape in the ‘fridd’ landscapes that evolved on marginal land between the uplands and the lowlands [4,5,6,7].
During the last half a century or so, the rate of change has accelerated. A large body of literature documents the increasing rate of disappearance of species as diverse as mammals [8], birds [9], or insects [10] from agricultural landscapes. In Wales, the grazing landscapes have remained unchanged for millennia but the recent intensification of agriculture has altered them, causing local species extinctions [11]. Recognising the lack of sustainability of modern agriculture and its negative impacts on the environment, a recent spate of proposals for reforming Welsh agricultural policy has emerged. Proposals for diverting public subsidies away from production and towards supporting ecosystem service delivery are under debate [12], up to and including a complete removal of some agricultural land from production to encourage tree planting or rewilding schemes [13]. However, as the recent partial failure of a proposed rewilding scheme in Wales shows, such efforts face significant farmer and landowner resistance [14].
The UK voted to leave the European Union in June 2016, culminating with her official departure on 31 January 2020. During its membership, the primary driver of UK’s approach to agriculture was the EU’s Common Agricultural Policy (CAP). Post-Brexit, Wales is developing its own suite of agricultural policies as agriculture is a devolved issue in the UK. In 2018, the Welsh Government launched one of their largest ever consultations of farmers, rural communities, environmental groups and interested parties called “Brexit and Our Land” [15], attracting 12,000 responses. One of the outcomes was the preference for future support to be based around the principle of sustainability, with land managers providing key environmental services, as well as food. In response, the Welsh Government plans to pay farmers based on income foregone to provide environmental services (e.g., clean air, improved biodiversity, clean water) through the Sustainable Farming Scheme (Glastir), which will replace the CAP support [15,16,17]. Alongside an additional scheme to promote agricultural business through skills training, capital investment, and knowledge exchange, it is hoped that both will be fully in place by 2025. Current plans for post-Brexit Welsh agricultural policy are, therefore, different to the principles of the CAP, which has been criticised for not delivering on sustainability, for pushing up land prices, and for creating an entry barrier to younger farmers [15,16,18]
Despite agriculture being a devolved issue, however, the outcome of UK-EU negotiations and the nature of UK future trading relationships with the bloc and the rest of the world (RoW) is very likely to influence land use & land cover (LULC) in Wales, with the potential to enact significant changes to the landscape [19]. Since its inception, Brexit has represented a wide range of potential outcomes—ranging from a ‘soft’ departure (Brexit in name only) to a ‘hard’ reset of all regulation and trading agreements, including those pertinent to agriculture. The range of potential Brexit outcomes is large and their eventual impact currently unknown.
The post-Brexit future of Welsh landscape will depend on the agricultural policies adopted in 2021 or shortly after. Based on the information available at the time of conducting this study, expert knowledge of the land managers, policy-experts, and ecologists, we hypothesized five plausible post-Brexit scenarios, namely ‘Business-as-Usual’, ‘Green Future’, ‘Free Trade Agreement’, ‘World Trade Organization’, and ‘Unilateral Trade Liberalization’ (detailed description of each of these scenarios is presented in the Section 2.5). The main aim of this study is to model LULC for each scenario and to illustrate potential changes in Welsh landscape by 2030. Irrespective of the outcome of the trade deal that eventually emerges between the UK and the EU, this paper demonstrates how novel techniques can be used to project the consequences of probable changes in policy that will affect land use in Wales, and other parts of the UK, over the coming decades.
Evidence suggests that, where possible, land management policies should be evidence-based [20,21,22]. One tool that can be used to generate evidence and test policy scenarios is landscape modelling which can project the spatial and temporal implications of policies under consideration [23]. Spatially explicit LULC models can project land use change patterns according to given policy objectives and generate alternative scenarios [24,25], thus establishing a link between policy and its impact on the ground [26]. The LULC change models offer an evidence-based approach to visualize, analyze and quantify LULC changes in what-if future scenarios, thus providing useful insights to policy makers and relevant stakeholders to set priorities and reasonable goals for sustainable land management [27].
To date, several spatially explicit modelling environments have been developed by incorporating remote sensing data and geographical information system (GIS) tools to project future LULC change. Some of the most widely used models are based on Markov chain, logistic regression, artificial neural network and cellular automata models [28]. Integrated use of these models is often advised to overcome limitations of individual models and generate robust LULC change simulations [29]. In this study, we employed an integrated multi-layer perceptron–Markov chain analysis (MLP–MCA) method to quantify historic LULC change and to model future scenarios of LULC change in Wales. The MLP–MCA is a robust and well documented approach for modelling spatial and temporal LULC changes [22,30,31]. To develop realistic future scenarios of LULC change, it is critical to understand the spatial patterns of current LULC and to develop an understanding of the potential impacts of current and future policies affecting LULC change [22].
In this paper we carry out an analysis of recent LULC change and then consider the impact of the five Brexit-related scenarios on LULC in Wales in 2030. We use existing information on agricultural and environmental policy, together with a range of future trading arrangements to modify recently observed LULC change trends and use change demand modelling to predict how these will impact LULC in Wales. The focus of our work is to assess how Brexit may impact broadleaf forest and improved grassland cover, respectively indicators of natural habitat and of intensive grazing in Wales. To the best of our knowledge, this is the first study that presents a comparison of spatially explicit maps of Welsh future landscape based on a range of plausible future scenarios. The study is expected to inform policymaking and, at the same, stir debates among stakeholders on various agendas under consideration for post-Brexit agricultural policies.
The rest of this paper is organized into three main sections: Materials and Methods (describes the methods and tools used for past LULC analysis; choice of explanatory variables and explanation of how future LULC models are tuned and run); Results (describes key LULC change result, compare the LULC change in the five scenarios and presents spatially explicit maps of future Welsh landscape) and Discussion.

2. Materials and Methods

Wales is a country with an area of nearly 21,000 km2 and a population of over 3 million, many of which live in rural communities [32]. The population is unequally distributed, with most people living in coastal urban areas in the northeast and south Wales. The country is characterized by a wide variety of landscapes, reflecting both its rugged topography and a long history of agricultural settlement and industrialization. Significant areas of land (approx. 6000 km2) are at an altitude above 300 m. The Welsh countryside contains a range of important habitats, including woodlands, semi-natural grasslands, heathland, fens, bogs, coastal ecosystems including sand dunes and saltmarshes, and a diverse range of upland and montane habitats [33]. Only a small proportion—6%—of the country is occupied by arable agriculture, while the major land use types are grazing (77%) and woodland (15%) [34,35,36].

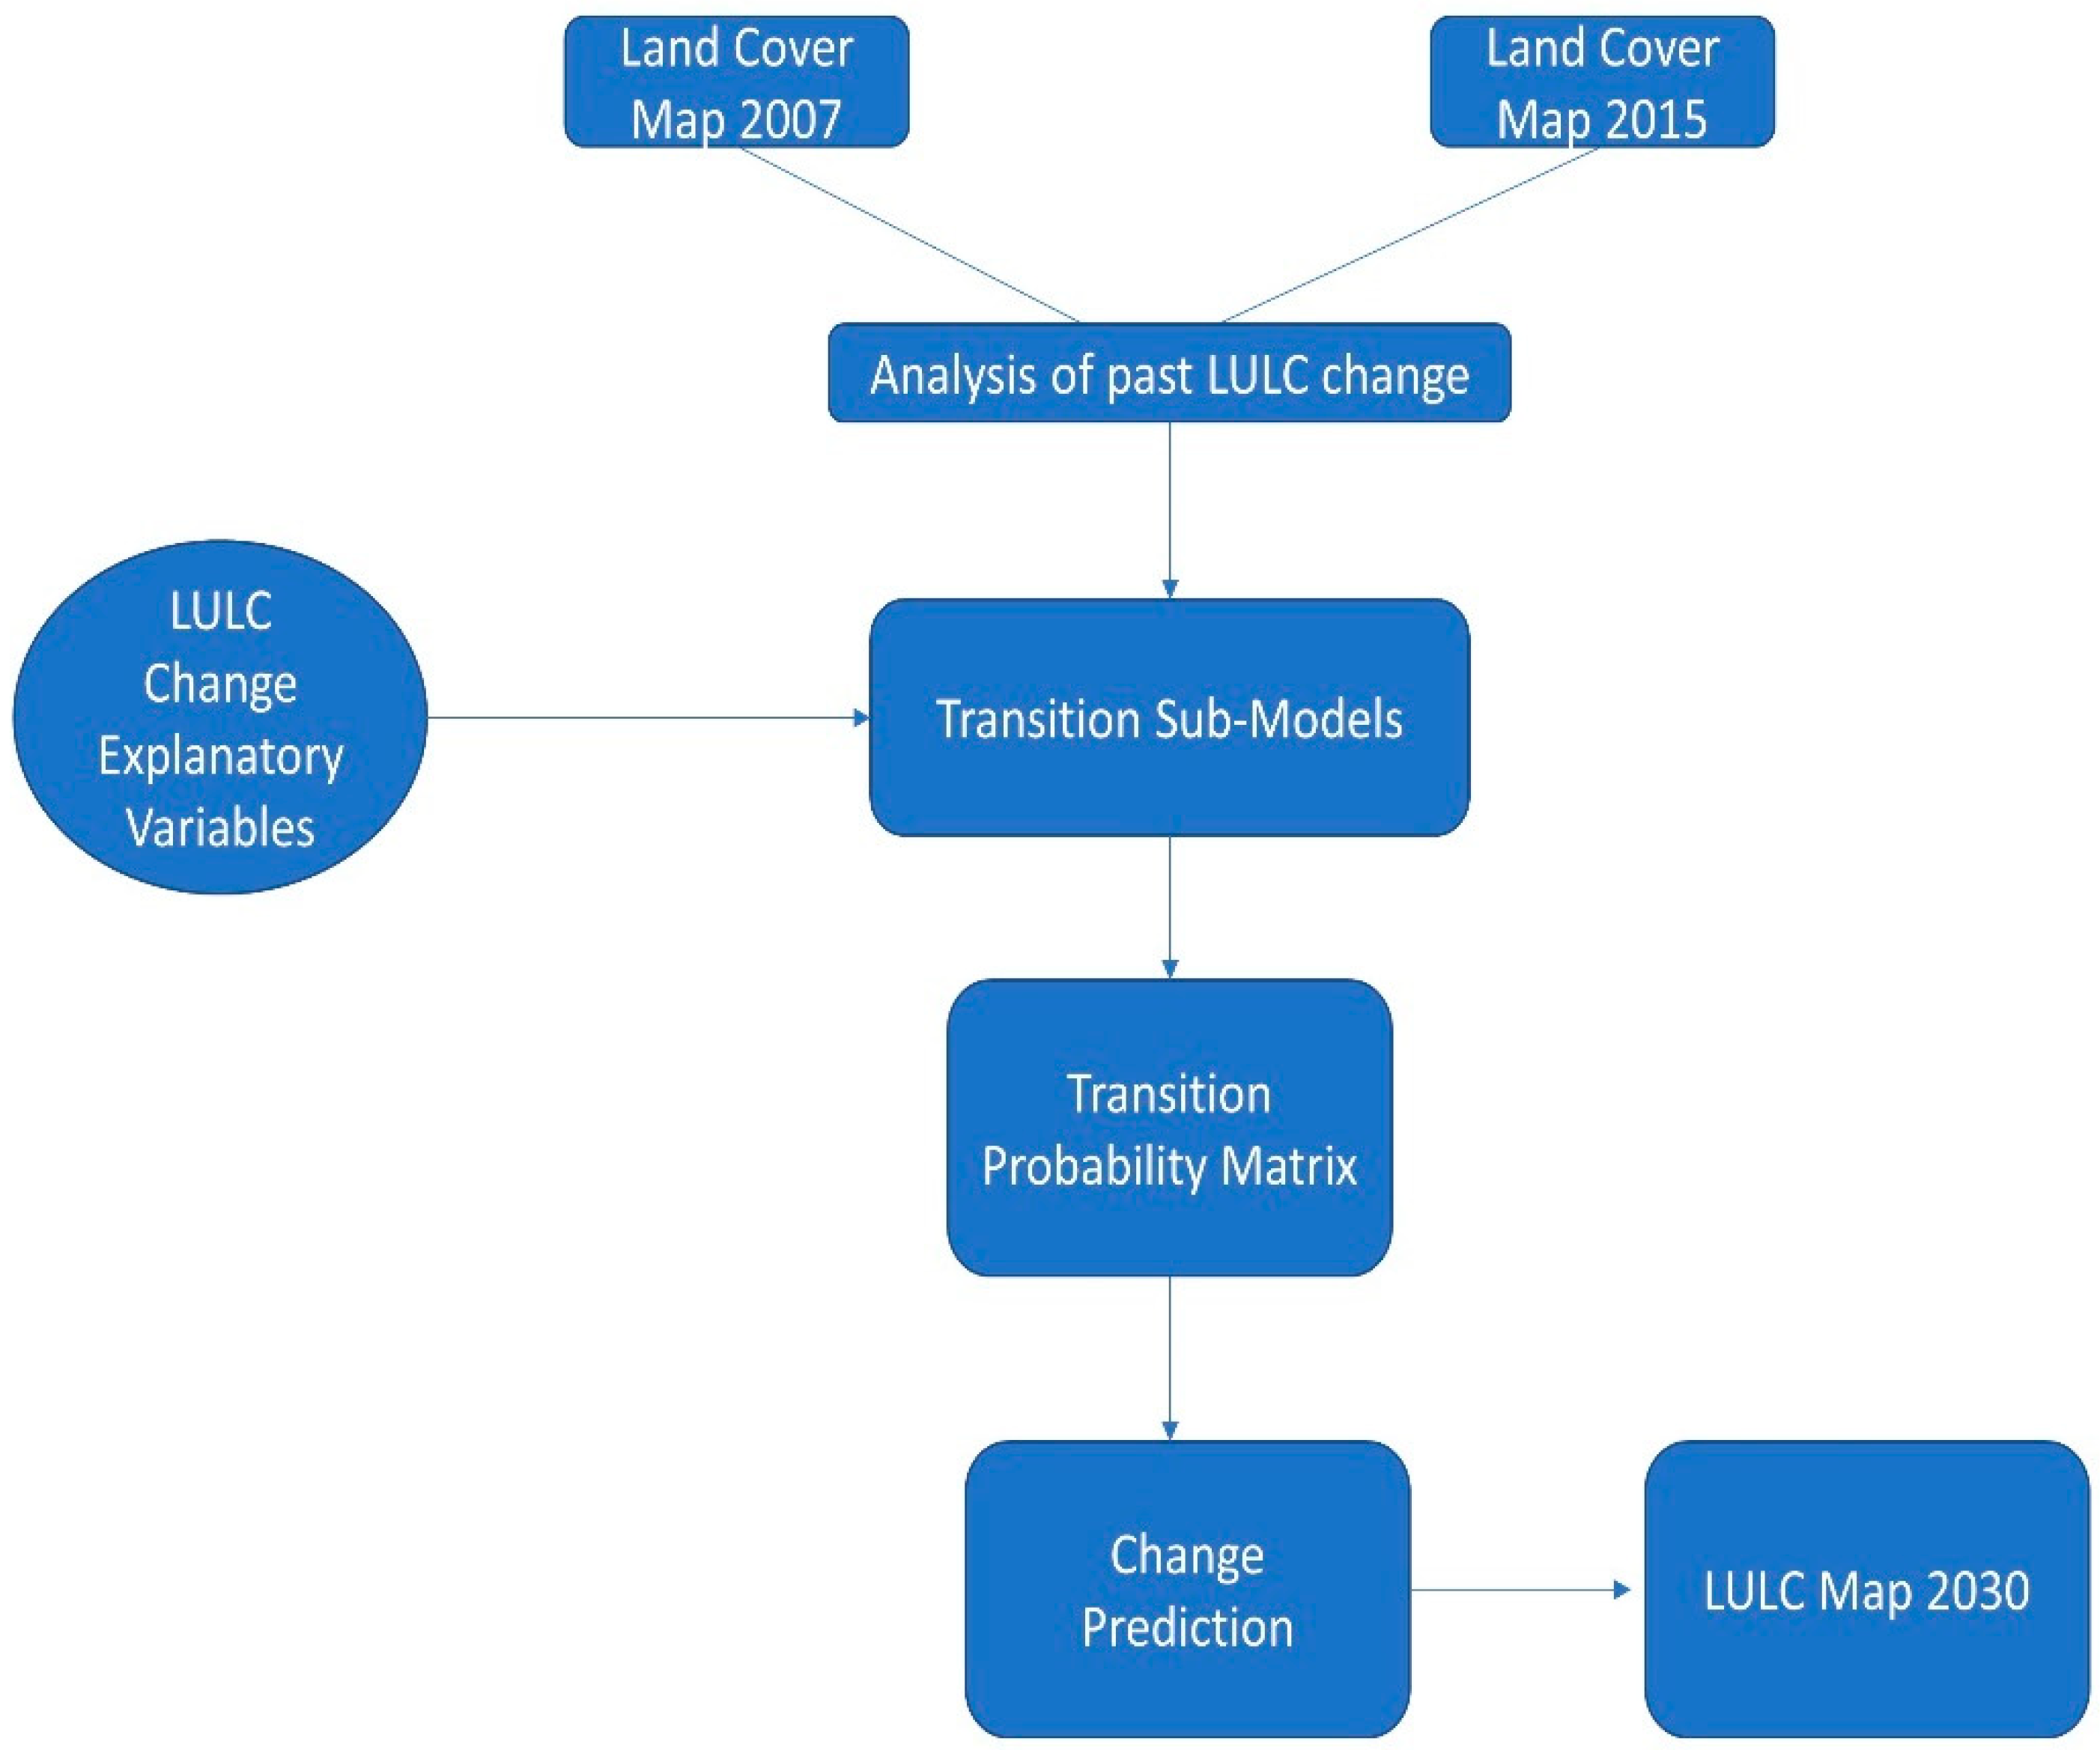
2.1. Outline of the LULC Change Methodology

The LULC change projection of Wales to 2030 involved five steps. In the first step, a change analysis for LULC changes between 2007–2015 was carried out to identify the past trends of LULC change in Wales. Each of the past LULC transitions is identified by a ‘transition sub-model’. In the second step, a set of explanatory variables were selected to explain the past LULC changes, i.e., the transition sub-models. In the third step, the selected explanatory variables were used to explain the past transitions and a Markov Chain prediction process was used to determine the area of land expected to undergo change by 2030 through a transition probability matrix, i.e., the business-as-usual scenario. In the fourth step, hypothetical alternative future scenarios were outlined, and, in the final step, transition probability matrix was manipulated to test alternative future scenarios, i.e., the change prediction. The different steps involved in LULC change modelling used in this study are presented in the Figure 1.

2.2. Analysis of Past Change

We used the ‘Land Change Modeler’ (LCM) tool in TerrSet Geospatial Monitoring & Modelling System (version 18.31, Clark Labs, Clark University, Worcester, MA, USA [37]) to analyze high-resolution (25 m) LULC maps of Wales from 2007 and 2015 (https://digimap.edina.ac.uk, [38]). We reclassified LULC types into the following nine classes: Broadleaf Forest; Coniferous Forest; Arable & Horticulture; Improved Grassland; Semi-natural Grassland; Mountain, Heath & Bog; Coastal Areas; Water Bodies and Built Areas (Supplementary Table S1). The main aim of reclassification was to simplify the map typology for ease of analysis and interpretation. We followed Land Cover Map 2015 Dataset documentation for reclassification of LULC maps [39]. A change analysis was then carried out by comparing the two historical LULC maps to identify past LULC transitions across the Welsh landscape. This analysis resulted in a total of 22 LULC transitions.

2.3. Explanatory Variable Selection

A wide range of factors is likely to affect future decisions of landowners and must be factored in LULC change modelling [40]. Climate change will undoubtedly have an impact on the Welsh landscape; however, profound changes of e.g., species distribution, ecosystem composition, crop productivity or water yield from the landscape are not predicted to take effect within the next decade. For this reason, this analysis does not explore the effects of climate change. We considered 29 variables in total, comprised of five biophysical, 14 proximate, two socioeconomic, and eight evidence likelihood transformation variables. The selection was based on a detailed review of the literature [22,31,41,42,43] and the initial suite of explanatory variables was filtered by a two-step process. In the first step, the potential of each of the 29 variables to explain observed LULC change was tested by calculating its Cramer’s V value [37]. Cramer’s V test is used to test the potential explanatory power of a variable. It is the measure of association between two nominal variables and its value ranges between 0 (no association) and 1 (perfect association). Although these values are not regarded as definitive, they can help in deciding whether to include an explanatory variable in the modeling process. Cramer’s V values of 0.15 or higher are ‘useful’ while those with values of 0.4 or higher are ‘good’. 8 variables were dropped on the basis of low Cramer’s V (V < 0.15) [37]. In the second step, we dropped highly correlated variables as collinearity is expected to increase uncertainty in model results. Using the recommended correlation cut-off value of 0.75 [44], we removed a further 9 highly correlated variables. As a result, 12 explanatory variables were used to account for the LULC changes observed in Wales between 2007 and 2015 (Table 1).

2.4. Transition Sub-Models and Change Demand Modelling

LCM enlists all LULC transitions identified by comparing the two historical LULC maps and represents each in a separate transition sub-model. We used a multi-layer perceptron (MLP) algorithm to run the transition sub-models to empirically model future LULC. The MLP is a class of feedforward artificial neural network that uses a back-propagation learning algorithm to calculate transition potentials over time. The MLP algorithm takes 10,000 randomly selected pixels for developing each transition sub-model. One-half of these pixels were used to train the model, while the other half were used for model validation. After explaining past LULC transitions, we used the ‘Change Demand Modelling’ function in LCM to predict the change likely to occur in selected LULC categories by 2030. By default, LCM uses a Markov Chain prediction process, which calculates the amount of change based on historical observations and determines the area of land expected to undergo such transition in the future through a transition probability matrix. LCM allows the user to manipulate this matrix to create and test alternative future scenarios.

2.5. Landscape Scenario Storylines

We developed spatially explicit scenarios by using the ‘story and simulation approach’ [45], combining quantitative models with qualitative assumptions to model future LULC. We used the scenario axes method [46] to combine effects of agricultural and environmental policy with changes of trading relationships. The scenarios are based on information available at the time of writing. B-a-U and GF assume no change to the trading pattern, while FTA, WTO and UTL depict various levels of trade disruption and are described in detail by Hubbard et al. 2018 [47]. Apart from B-a-U, all scenarios assume a shift towards supporting environmental services and benefits delivered alongside food production. The storylines used to develop the LULC criteria applied in each scenario can be summarised as follows:

2.5.1. Business-as-Usual Scenario (B-a-U)

B-a-U represents a simple extrapolation of land-use change trends observed in the recent past (2007–2015). We assume that the Wales continues to apply a non-reformed version of the Common Agricultural Policy (CAP).

2.5.2. Green Future (GF)

Wales pursues its own policy geared towards environmental responsibility and landscape sustainability, based on indicative proposals of the Welsh government. The most significant change is the move away from direct payment subsidies and towards paying for environmental benefits, while maintaining financial support for agriculture (Agriculture Bill [Wales] to be presented in 2020). In addition, we assume no material change to the trading relationship between UK and the EU or RoW. Key LULC change trends remain the same as B-a-U, but by 2030 we foresee a 100% increase in the 2015 area of broadleaf and 50% increase of conifer forests. There will be no further reduction of heath and bog and a continuing decrease of grassland.

2.5.3. Free Trade Agreement (FTA)

Agriculture policy is the same as in GF, while the UK reaches a comprehensive trade agreement with the EU keeping EU-UK tariffs at zero. UK adopts the EU common tariff on imports from RoW and maintains its share of EU tariff rate quotas applying to imports from RoW. There is a small increase in EU-UK trade costs (2% crops and 5% livestock, see [48] for details). We assume that these policy changes will translate to a faster decline of the area of semi-natural grassland (−32%) and a slowdown of the rate of loss of mountain heath and bog (−26%), explained by stronger support for environmental features and the sensitivity of marginal sheep grazing to increases in trade costs.

2.5.4. World Trade Organisation (FTA)

Agriculture policy is the same as in GF, but the UK does not achieve a trade deal with the EU and reverts to WTO rules and schedules relevant to trade in agricultural products. UK trades with the EU and RoW on the ‘most favoured nation’ terms and has the use of its share of current EU tariff rate quotas with the RoW. There is a medium increase in EU-UK trade costs (4% crops and 8% livestock). This policy and trading environment results in an increase of both broadleaf and conifer afforestation (+90 and +44% respectively), while there is a two-fold increase in the rate of loss of semi-natural grassland (−51%). There is no further loss of mountain heath and bog (environmental policy) or loss of arable & horticulture (high value crops are competitive).

2.5.5. Unilateral Trade Liberalisation

Agriculture policy is the same as in GF, the UK did not manage to reach a trade agreement so reverts to WTO terms. In addition, to maintain food supply to its population, the UK unilaterally removes all import tariffs for foodstuffs from the EU and RoW. This is an ‘extreme free trade’ scenario and entails significant export market disruption for Welsh agricultural exports (5% crops and 10% livestock) and a strong domestic market competition from abroad, leading to domestic price falls, particularly for beef and sheep. This results in destocking or land abandonment in hill areas as sheep farming becomes unviable. We model this scenario as a decrease of grazing semi-natural grasslands (−75%), accompanied by a decrease in the area of improved grassland (−27%). Land no longer used for grazing reverts to mountain heath and bog (+10%) or is used for an expansion of conifer plantations (+123% due to increasing demand for homegrown timber and fast carbon uptake) and broadleaf forests (+190% due to tree planting and secondary succession). This scenario also assumes an expansion of the most profitable crops (+15% arable & horticulture). Percentage changes in areas under each scenario are presented in Table 2.

2.6. Determining Transition Probability Matrices for Future Scenarios
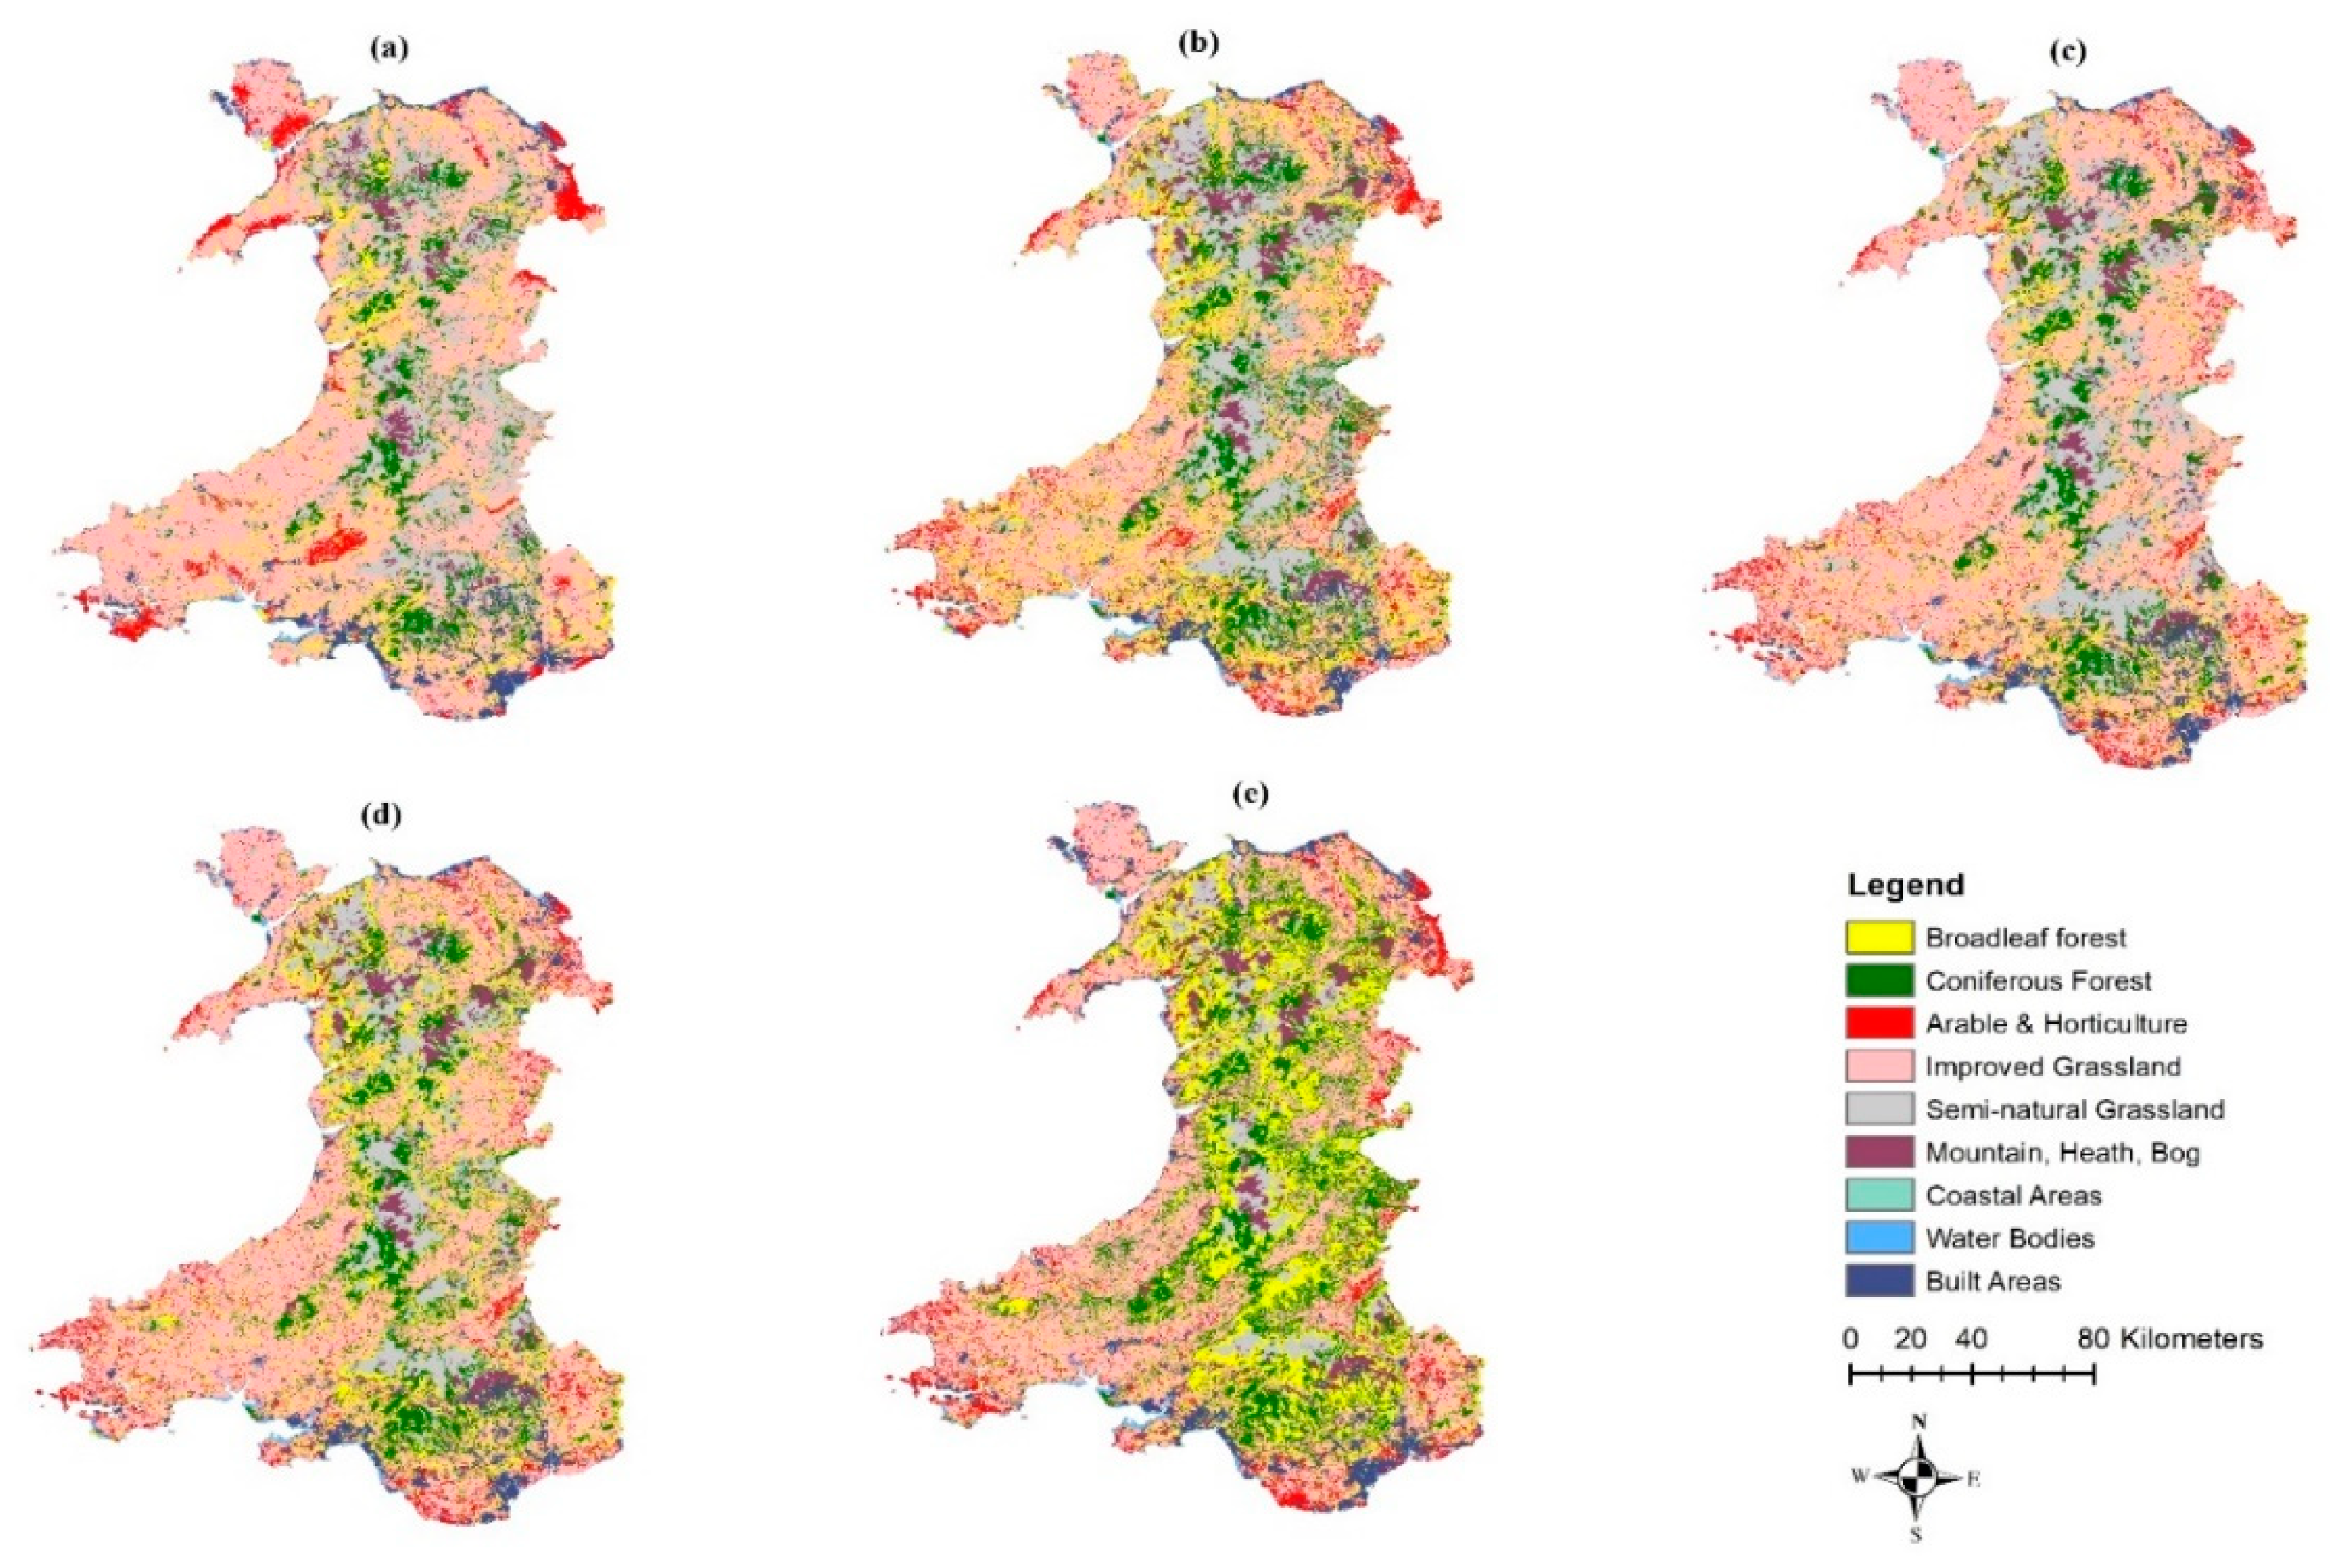
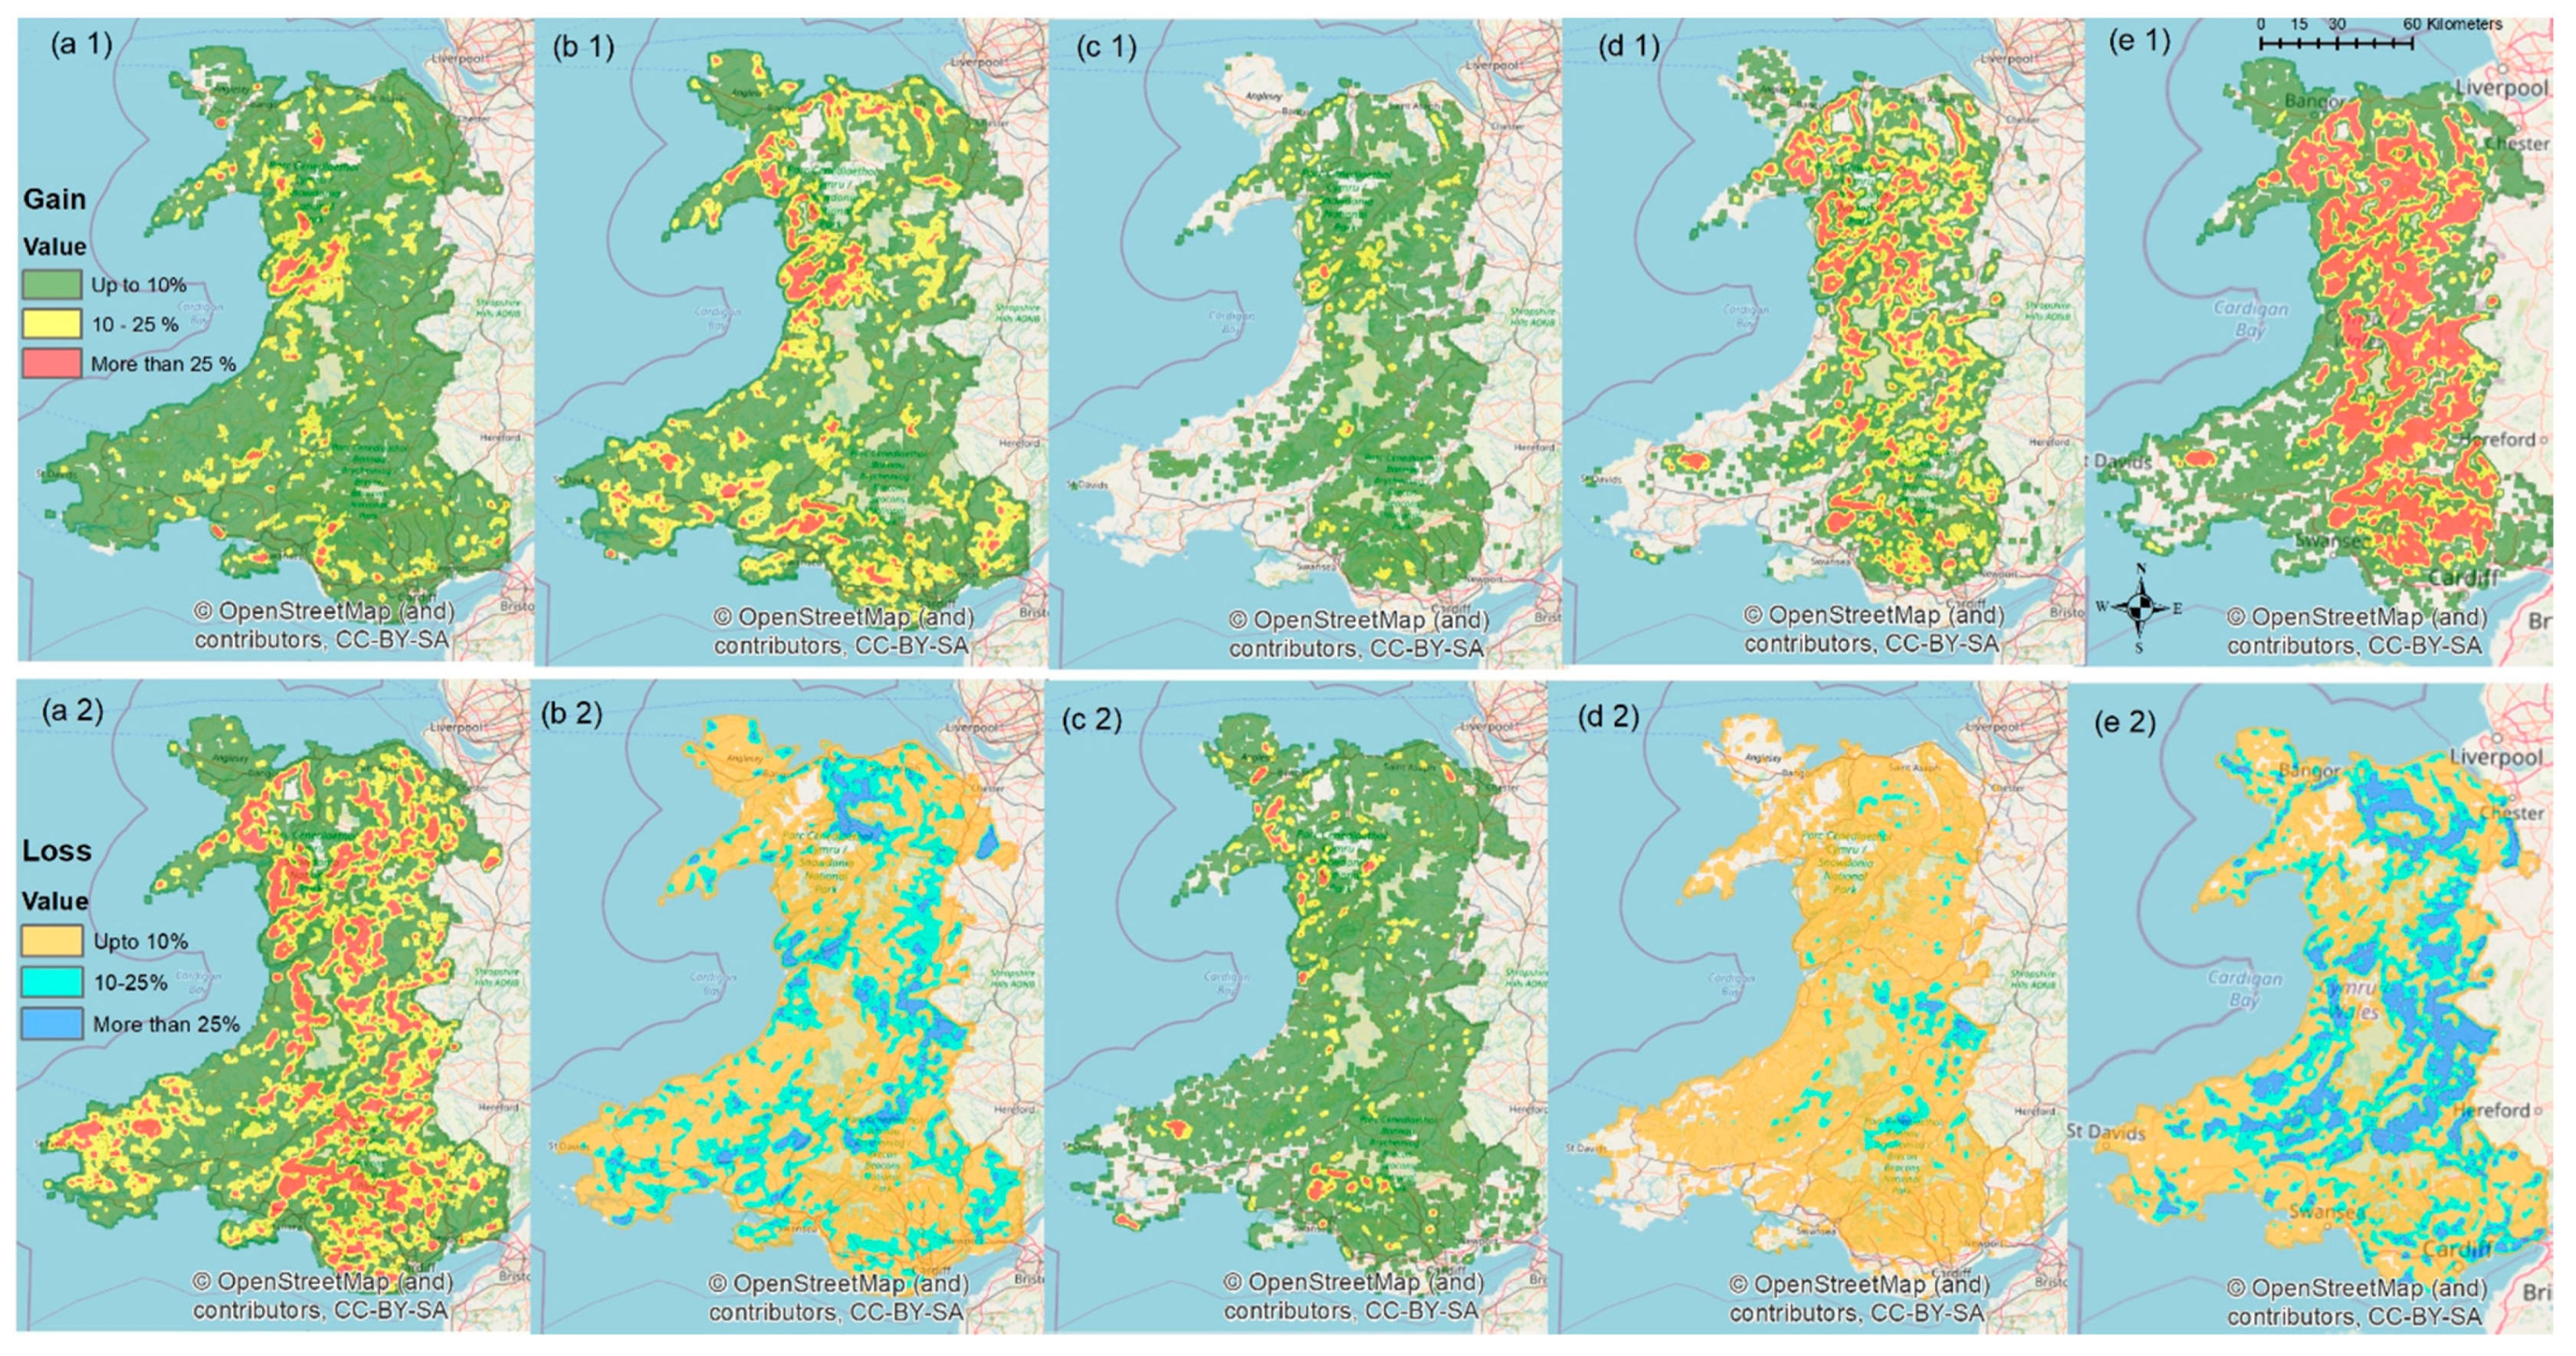
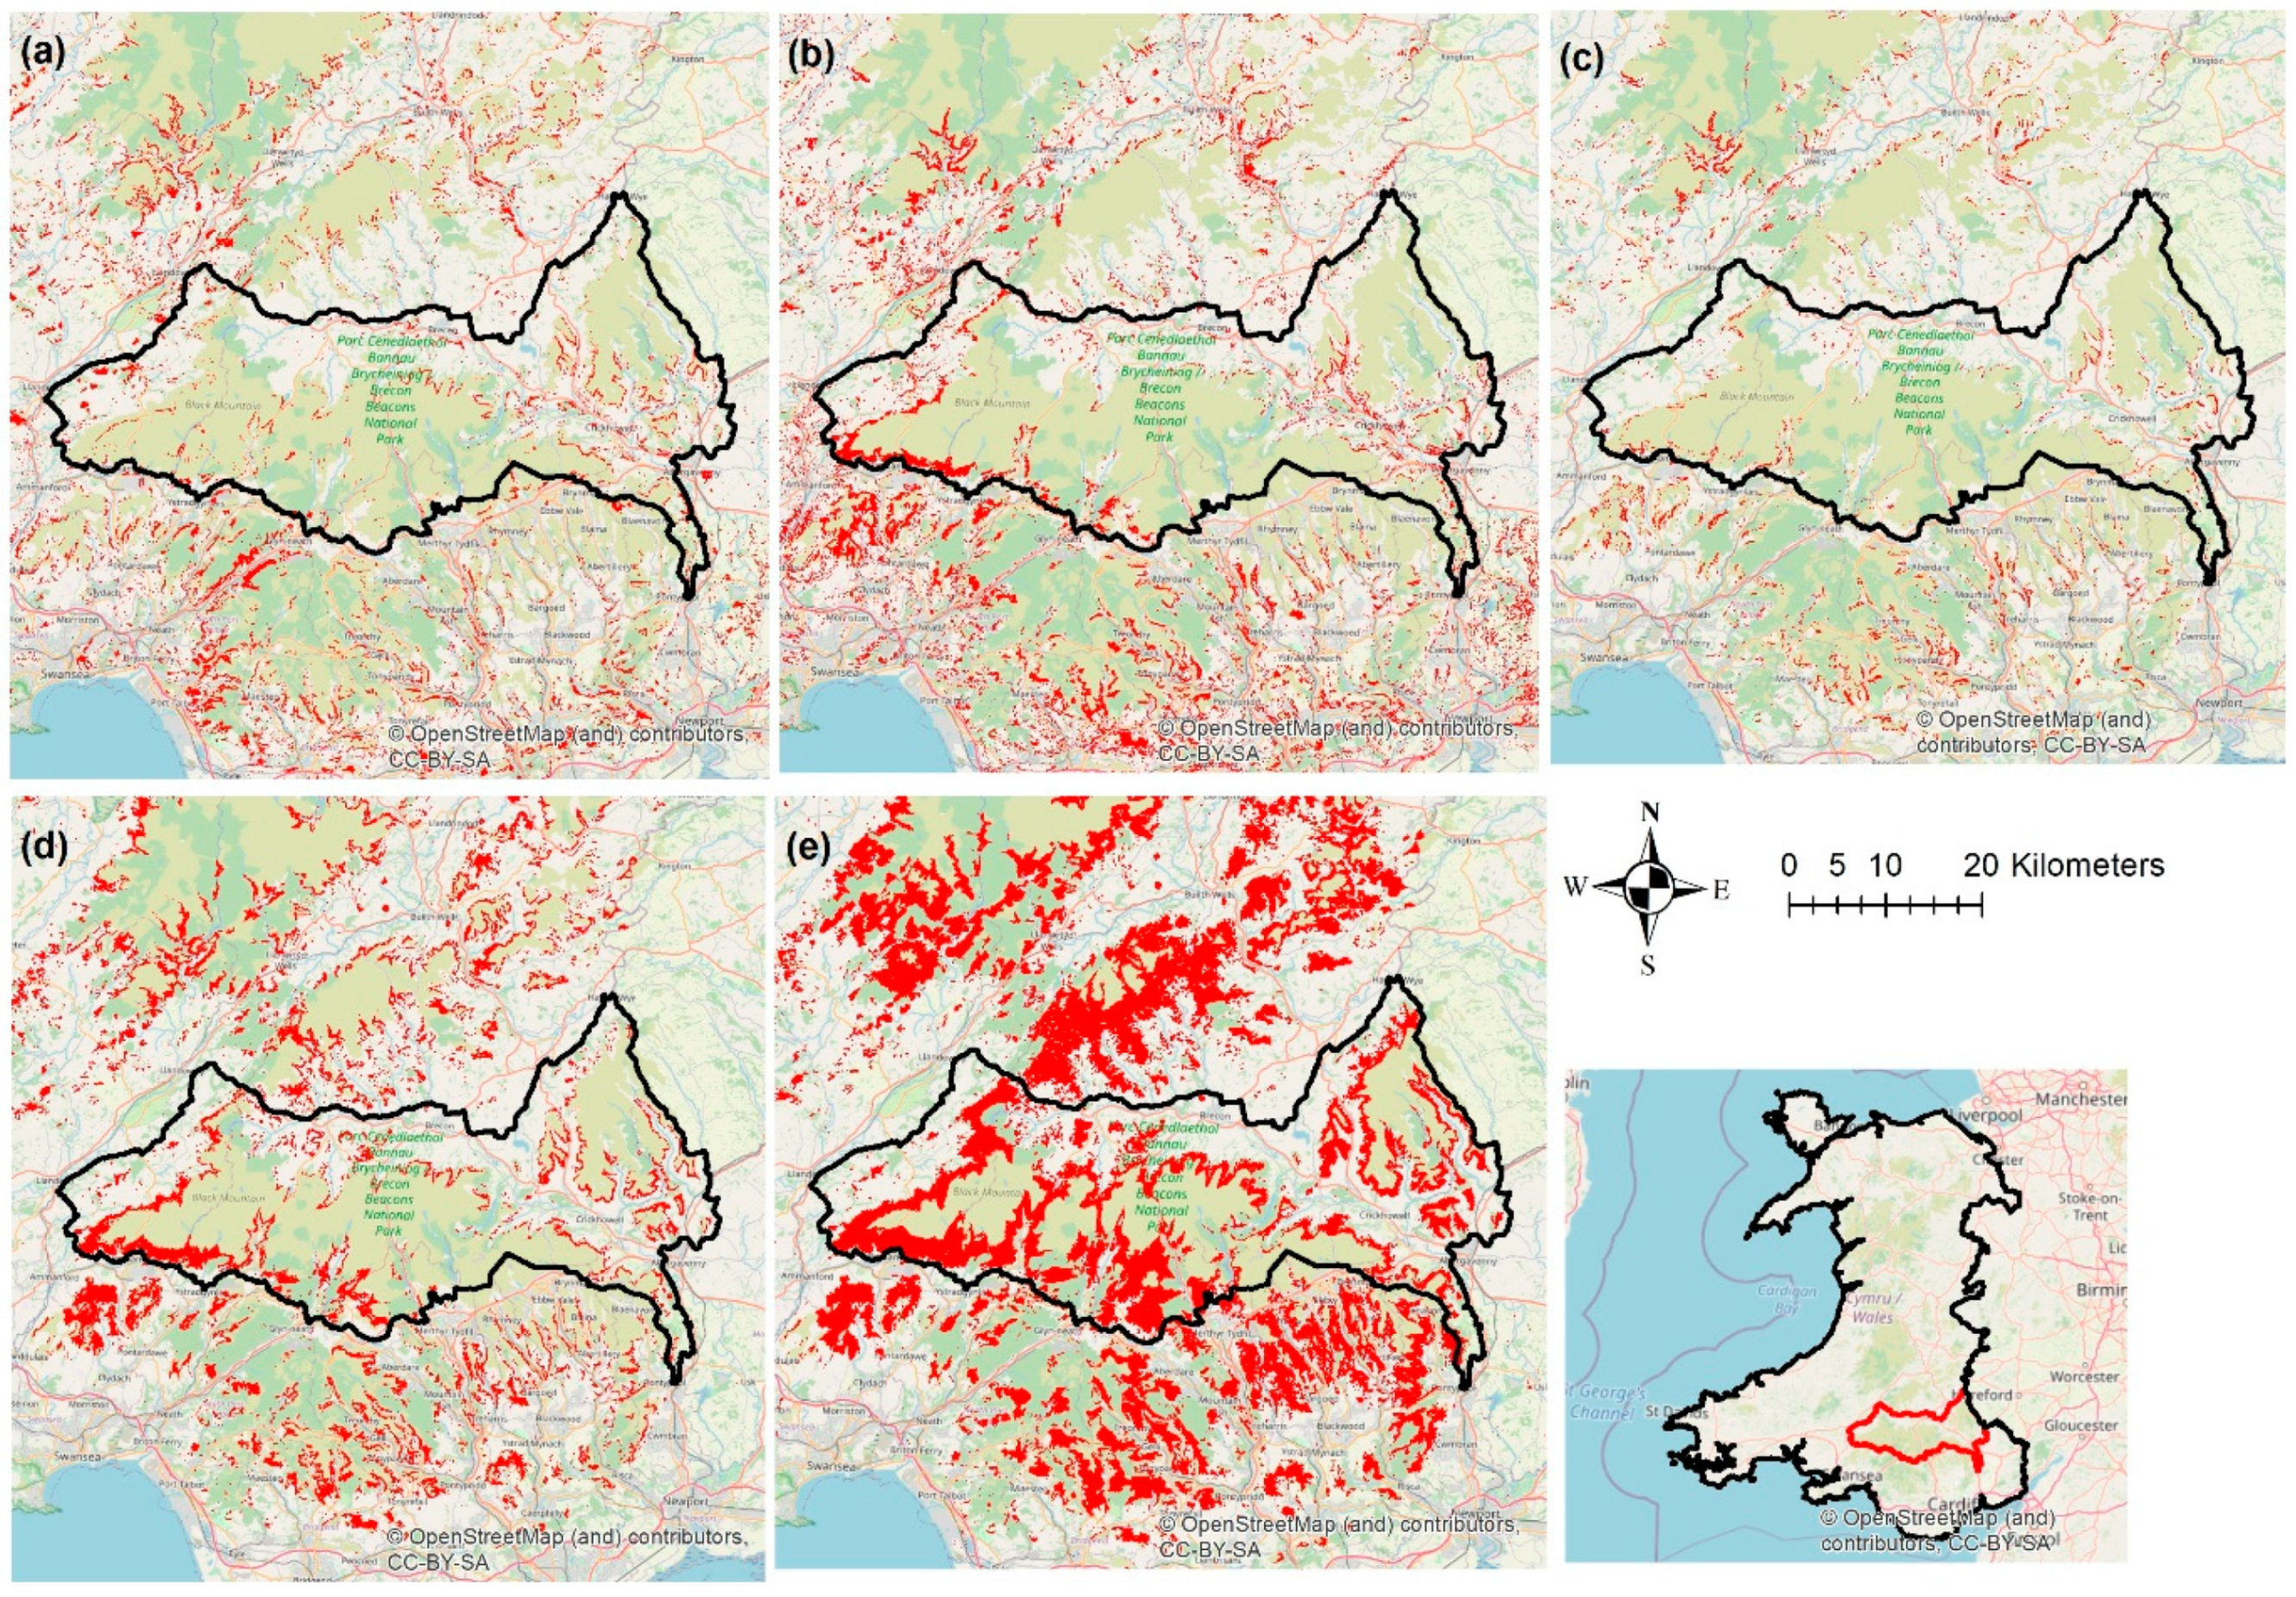
The transition probability matrix for the B-a-U scenario was based on past LULC transitions and constitutes the default result of Markov Chain analysis (Table 3). B-a-U future projection assumes an unchanged extrapolation of past trajectory of changes. In this process, a Markov Chain analysis first derives a LULC transition probability matrix which specifies the probability of each LULC class changing to every other class and then calculates the future land area of that class. In order to project land-use change under alternative scenarios, we first translated our policy and trade assumptions to future land demand in each LULC category. For each alternative post-Brexit scenario, we used the Linear Programming function in Microsoft Excel to generate transition probability matrix M (=(mij)) where mij denotes land transition probability from LULC category i to j within a given time period. The objective function of the Linear Programming is min i = 1 n   j = 1 n x i j c i j which is subject to i = 1 n   x i j =   l i , 2007 for i   = 1, 2, ……n, j = 1 n   x i j =   l j , 2030   f o r   i = 1 , 2 , n , where x i j and c i j denote the amount of transition area (ha) and the friction of land-use transition (unitless) from land-use class i to j, respectively. For the present study, due to insufficient information on the weighting, the friction of the land-use transition was arbitrarily defined as c i j =   { 1 ( i j ) 0 ( i = j ) .

3. Results

A wide range of factors is likely to affect future decisions of landowners and must be factored into LULC change modelling. The biophysical, proximate, and socioeconomic variables utilized in this study performed well; the average accuracy of all transition sub-models was 78.4%, where accuracy rate of 75% or above is considered indicative of good model performance [49]. Our modification of transition probability matrices during scenario building translates to a marked difference in area gains and losses between LULC types under different assumptions (Table 1 and Supplementary Figures S1 and S2). Looking at the two habitats of interest, by 2030 Broadleaf Forest may expand between 35,000 ha (B-a-U) and 313,000 ha (UTL) when compared to 2015. Improved Grassland, on the other hand, may shrink by 260,000 ha (UTL) or increase by nearly 60,000 ha (B-a-U and FTA).
The scenarios considered in this analysis indicate a markedly different composition of the Welsh landscape by 2030 (Figure 2). While some LULC categories do not have high capacity for changing location (e.g., mountain heath and bog), others are much more sensitive to the manipulation of transition probability matrices informed by possible policy changes. For example, the difference in Broadleaf Forest between GF and UTL scenarios is noticeable even on small-scale maps (Figure 2). Looking at change trends aggregated at 2.5 × 2.5 km scale, clear differences in certain LULC types dominating specific areas emerge. B-a-U is likely to result in an increase of Broadleaf Forest cover in the western part of Snowdonia, this trend is largely repeated in the GF and WTO scenarios. The UTL scenario, however, indicates that nearly all of Wales will contain land with Broadleaf Forest establishment on at least 25% of the 6.25 km2 block. Improved Grassland may increase in the hilly areas under B-a-U and Reformed CAP, but its predicted decrease under GF and UTL will be distributed all over the country (Figure 3).
Finally, we were interested how LULC change is affected at scales accessible to the people directly affected by it, namely at the farm or possibly, field scale. As an example, we focus on the area of the Brecon Beacons National Park. B-a-U indicates that small pockets of Broadleaf Forest would be expected to appear by 2030 even if current policy remains unchanged. The extreme free trade, UTL scenario offers the biggest contrast in terms of natural woodland expansion; well-connected tracts of Broadleaf Forest are predicted to emerge in the western and eastern parts of this national park (Figure 4).

4. Discussion

The EU is the largest international trading bloc, Brexit thus entails a significant disruption of existing trade flows which affect Welsh agriculture. At the time of writing, the UK government has followed a policy that rejected the membership of the EU Single Market and Customs Union [19], resulting in a ‘thin’ free-trade agreement provisionally agreed at the end of 2020. This involves at least the introduction of non-tariff barriers to Welsh agricultural exports [50]. These two factors directly affect the financial viability of Welsh farming, which in turn drives LULC change [51]. Welsh farmers may consider changing their land management practices to qualify for proposed environmental subsidies [52], may diversify or seek alternative employment, or downsize or de-intensify their farming operation [35]. Hubbard et al. [47] show that the total land held on farm holdings in Wales exposed to financial risk as a result of Brexit to be around 700,000 ha (out of the 2.07 million ha total), while ∼3.4 million sheep and ∼77,000 beef cows currently graze on land deemed at risk from subsidy policy change. For comparison, the amount of farmland affected by LULC change under the scenarios developed in this study ranges from 183 thousand ha (B-a-U) to 598 thousand ha (UTL).
In 2018, the Welsh Government launched one of their largest ever consultations of farmers, rural communities, environmental groups and interested parties called “Brexit and Our Land” [15]. This consultation sought to gather views on what agricultural policy in Wales should look like once the Common Agricultural Policy ceases to apply post-Brexit. One of the outcomes was the preference for future support to be based around the principle of sustainability, with land managers aiming to provide key environmental services, as well as food. In response, the Welsh Government plans to pay farmers based on income foregone to provide environmental services (e.g., biodiversity enhancement, clean water and air) through the Sustainable Farming Scheme, which will replace the CAP support [15,16,17]. Alongside an additional scheme to promote agricultural business through skills training, capital investment, and knowledge exchange, it is hoped that both will be fully in place by 2025. Current plans for post-Brexit Welsh agricultural policy are, therefore, different to the principles of the CAP. Upland farmers may thus receive payments to primarily use their livestock as a tool for existing habitat conservation, rather than for food production [53]. It is likely that, in order to maintain the viability of agriculture, Welsh farmers will need to find new and creative solutions to this crisis [54].
We show that Brexit and associated policy changes will have a significant potential to rapidly alter LULC in Wales. It is likely that rural areas of Wales, especially in the uplands, will face land abandonment and the return of natural ecosystems. Among the many drivers, socio-economic factors and public policies are known to drive land abandonment [55]. Evidence from Europe shows that abandoned land is rapidly re-colonised by trees [56], initiating a cascade of effects such as the loss of cultural landscapes [57] or the loss of biodiversity associated with open landscapes [58]. In Wales, the land no longer exposed to grazing pressure is likely to be reseeded by a variety of native broadleaf tree species, with a contribution of non-native trees currently grown in Wales [59]. Just as elsewhere in Europe, lowering the economic viability of agriculture thus has the potential to enact a swift and profound alteration of the landscape towards natural ecosystems.
Perhaps counterintuitively then, the extreme free trade UTL scenario exerting significant economic pressure may create the conditions for a future well-connected patchwork of broadleaf forests. This study illustrates the fact that shifts in the terms of trade may speed up nature recovery far more rapidly and profoundly than a targeted nature conservation policy. The trade deal agreed between the EU and the UK features numerous provisions for retaliatory tariffs should the UK depart from agreed regulatory environment, one of the advantages of modelling studies such as this is to illustrate the potential impact of such events on living landscapes. Whilst Brexit may trigger a fairly rapid regeneration of natural ecosystems typical for Wales prior to its settlement by humans, the process may come at the cost of losing some of the cultural landscapes associated with the evolution of pastoral farming over millennia in large parts of Wales. Should Welsh sheep and cattle farming be significantly suppressed by the new trading environment, the country will experience a profound change of its landscape.
Similar studies may consider the following points. The land cover products used for the analysis were the most accurate maps available at the time of this study. However, availability of more reliable and fine-resolution land cover maps would improve the projections in future. We included a comprehensive set of predictor variable to project LULC changes; however, many other variables such as landowners’ decisions and/or introduction of new land policies in Wales could potentially affect the trajectory of change for different LULC classes.

5. Conclusions

Leaving the EU will significantly affect the financial viability of a large proportion of Welsh farms, resulting in land use change affecting most of the country. Contrasting scenarios describing impending change can be constructed to consider the impact on the landscape; from a simple extrapolation of recent change into the future, all the way to predicting the effects of a significant downturn of sheep farming. Our modelling exercise indicates that even the Business-as-usual scenario predicts the expansion of pockets of new broadleaf woodland in certain parts of the country. However, should Welsh sheep farming be significantly suppressed by the new trading arrangement, the country will experience a profound change to its landscape.

Supplementary Materials

The following are available online at https://www.mdpi.com/2073-445X/10/1/59/s1, Table S1. Reclassification of land use types used in the historical land use maps of Wales and in the current study. Figure S1. Gain (green bars) and Loss (purple bars) in area (ha) under different LULC categories in Wales between 2015 and 2030 (5 scenarios). Figure S2. Land cover maps of Wales, (a) 2007 and (b) 2015.

Author Contributions

Conceptualization, S.A.M., G.G., D.C.R. and M.L.; methodology, S.A.M., G.G., M.L.; software, S.A.M., G.G.; validation, M.L. and D.C.R.; formal analysis, S.A.M. All authors have read and agreed to the published version of the manuscript.

Funding

This research received no external funding.

Institutional Review Board Statement

Not applicable.

Informed Consent Statement

Not applicable.

Data Availability Statement

The open access links to data used in this study are available in Table 1 of this paper.

Acknowledgments

S.A.M. was funded by the Commonwealth Scholarship Commission (2016-86). M. L. received support from the European Social Fund EVA 4.0 (OP RDE, CZ.02.1.01/0.0/0.0/16_019/0000803).

Conflicts of Interest

The authors declare no conflict of interest.

References

  1. Whitehouse, N.J.; Smith, D. How fragmented was the British Holocene wildwood? Perspectives on the “Vera” grazing debate from the fossil beetle record. Quat. Sci. Rev. 2010, 29, 539–553. [Google Scholar] [CrossRef]
  2. DellaSala, D.A.; Alaback, P.; Drescher, A.; Holien, H.; Spribille, T.; Ronnenberg, K. Temperate and Boreal Rainforest Relicts of Europe. In Temperate and Boreal Rainforests of the World: Ecology and Conservation; Island Press/Center for Resource Economics: Washington, DC, USA, 2011; pp. 154–180. ISBN 978-1-61091-008-8. [Google Scholar]
  3. Forestry Commission. Forestry Statistics 2019; Forestry Commission: Edinburgh, UK, 2019. [Google Scholar]
  4. Stevenson, A.C.; Thompson, D.B.A. Long-term changes in the extent of heather moorland in upland Britain and Ireland: Palaeoecological evidence for the importance of grazing. Holocene 1993, 3, 70–76. [Google Scholar] [CrossRef]
  5. Spencer, J.W.; Kirby, K.J. An inventory of ancient woodland for England and Wales. Biol. Conserv. 1992, 62, 77–93. [Google Scholar] [CrossRef]
  6. Smart, S.M.; Bunce, R.G.H.; Marrs, R.; LeDuc, M.; Firbank, L.G.; Maskell, L.C.; Scott, W.A.; Thompson, K.; Walker, K.J. Large-scale changes in the abundance of common higher plant species across Britain between 1978, 1990 and 1998 as a consequence of human activity: Tests of hypothesised changes in trait representation. Biol. Conserv. 2005, 124, 355–371. [Google Scholar] [CrossRef]
  7. Hopkins, A.; Wainwright, J. Changes in botanical composition and agricultural management of enclosed grassland in upland areas of England and Wales, 1970–1986, and some conservation implications. Biol. Conserv. 1989, 47, 219–235. [Google Scholar] [CrossRef]
  8. Ceballos, G.; Ehrlich, P.R. Mammal population losses and the extinction crisis. Science 2002, 296, 904–907. [Google Scholar] [CrossRef] [PubMed] [Green Version]
  9. Butler, S.J.; Vickery, J.A.; Norris, K. Farmland Biodiversity and the Footprint of Agriculture. Science 2007, 315, 381–385. [Google Scholar] [CrossRef]
  10. Benton, T.G.; Bryant, D.M.; Cole, L.; Crick, H.Q.P. Linking agricultural practice to insect and bird populations: A historical study over three decades. J. Appl. Ecol. 2002, 39, 673–687. [Google Scholar] [CrossRef] [Green Version]
  11. Chamberlain, D.E.; Fuller, R.J. Local extinctions and changes in species richness of lowland farmland birds in England and Wales in relation to recent changes in agricultural land-use. Agric. Ecosyst. Environ. 2000, 78, 1–17. [Google Scholar] [CrossRef] [Green Version]
  12. Simoncini, R.; Ring, I.; Sandström, C.; Albert, C.; Kasymov, U.; Arlettaz, R. Constraints and opportunities for mainstreaming biodiversity and ecosystem services in the EU’s Common Agricultural Policy: Insights from the IPBES assessment for Europe and Central Asia. Land Use Policy 2019, 88, 104099. [Google Scholar] [CrossRef]
  13. Loth, A.F.; Newton, A.C. Rewilding as a restoration strategy for lowland agricultural landscapes: Stakeholder-assisted multi-criteria analysis in Dorset, UK. J. Nat. Conserv. 2018, 46, 110–120. [Google Scholar] [CrossRef] [Green Version]
  14. Forgrave, A. Farming anger forces Rewilding Britain to pull out of Summit To Sea project in Mid Wales. Dailypost 2019, 1, 117. [Google Scholar]
  15. Welsh Government. Brexit and Our Land: Securing the Future of Welsh Farming—Consultation Overview; Land Management Reform Division: Cardiff, UK, 2018; ISBN 9781789374834.
  16. Welsh Government. Brexit and Our Land: Securing the Future of Welsh Farming—Our Response; Land Management Reform Division: Cardiff, UK, 2018; pp. 1–14.
  17. Hart, K.; Baldock, D. The Emerging Agricultural Policy Frameworks in the Four UK Administrations A Briefing for the UK Land Use Policy Group; Institute for European Environmental Policy: Glasgow, UK, 2019. [Google Scholar]
  18. Tsouvalis, J.; Little, R. Agriculture Bill: Here’s what it means for farming and the environment after Brexit. Conversat. UK 2020, 21, 133. [Google Scholar]
  19. Coe, S.; Ward, M. Brexit: Trade Issue for Food and Agriculture; Commons Library Briefing: London, UK, 2019. [Google Scholar]
  20. Yanhui, W.; Bonell, M.; Feger, K.-H.; Pengtao, Y.; Wei, X.; Lihong, X. Changing Forestry Policy by Integrating Water Aspects into Forest/Vegetation Restoration in Dryland Areas in China. Bull. Chin. Acad. Sci. Agric. Water Ecol. Bull. Chin. Acad. Sci. BCAS 2012, 2626, 59–67. [Google Scholar]
  21. Chappell, N.A. “Forests and floods: Moving to an evidence-based approach to watershed and integrated flood management” by Ian R. Calder (UK) and Bruce Aylward (USA). Water Int. 2006, 31, 541–543. [Google Scholar] [CrossRef]
  22. Manzoor, S.A.; Griffiths, G.; Latham, J.; Lukac, M. Scenario-led modelling of broadleaf forest expansion in Wales. R. Soc. Open Sci. 2019, 6, 190026. [Google Scholar] [CrossRef] [Green Version]
  23. Kamusoko, C.; Wada, Y.; Furuya, T.; Tomimura, S.; Nasu, M.; Homsysavath, K. Simulating Future Forest Cover Changes in Pakxeng District, Lao People’s Democratic Republic (PDR): Implications for Sustainable Forest Management. Land 2013, 2, 1–19. [Google Scholar] [CrossRef] [Green Version]
  24. Soares-Filho, B.S.; Nepstad, D.C.; Curran, L.M.; Cerqueira, G.C.; Garcia, R.A.; Ramos, C.A.; Voll, E.; McDonald, A.; Lefebvre, P.; Schlesinger, P. Modelling conservation in the Amazon basin. Nature 2006, 440, 520–523. [Google Scholar] [CrossRef]
  25. Koomen, E.; Koekoek, A.; Dijk, E. Simulating Land-use Change in a Regional Planning Context. Appl. Spat. Anal. Policy 2011, 4, 223–247. [Google Scholar] [CrossRef] [Green Version]
  26. Bounyang, V. Forestry Strategy to the Year 2020. Vientiane Lao PDR 2005, 1, 1–89. [Google Scholar]
  27. Buenemann, M.; Martius, C.; Jones, J.W.; Herrmann, S.M.; Klein, D.; Mulligan, M.; Reed, M.S.; Winslow, M.; Washington-Allen, R.A.; Lal, R.; et al. Integrative geospatial approaches for the comprehensive monitoring and assessment of land management sustainability: Rationale, Potentials, and Characteristics. L. Degrad. Dev. 2011, 22, 226–239. [Google Scholar] [CrossRef]
  28. Mishra, V.N.; Rai, P.K. A remote sensing aided multi-layer perceptron-Markov chain analysis for land use and land cover change prediction in Patna district (Bihar), India. Arab. J. Geosci. 2016, 9, 249. [Google Scholar] [CrossRef]
  29. Zhang, Q.; Ban, Y.; Liu, J.; Hu, Y. Simulation and analysis of urban growth scenarios for the Greater Shanghai Area, China. Comput. Environ. Urban Syst. 2011, 35, 126–139. [Google Scholar] [CrossRef]
  30. Ahmed, B.; Ahmed, R. Modeling Urban Land Cover Growth Dynamics Using Multi-Temporal Satellite Images: A Case Study of Dhaka, Bangladesh. ISPRS Int. J. Geo-Inf. 2012, 1, 3–31. [Google Scholar] [CrossRef] [Green Version]
  31. Ozturk, D. Urban growth simulation of Atakum (Samsun, Turkey) using cellular automata-Markov chain and Multi-layer Perceptron-Markov chain models. Remote Sens. 2015, 7, 5918–5950. [Google Scholar] [CrossRef] [Green Version]
  32. Office for National Statistics. Statistical Bulletin: Annual Mid Year Population Estimates: 2013; Office for National Statistics: London, UK, 2014.
  33. Swetnam, R.D.; Tweed, F.S. A tale of two landscapes: Transferring landscape quality metrics from Wales to Iceland. Land Use Policy 2018, 76, 565–576. [Google Scholar] [CrossRef]
  34. Forestry Commission. Chapter 1: Woodland Areas and Planting. For. Stat. 2017, 2017, 37. [Google Scholar]
  35. Welsh Government. Research Service Natural Resources Wales Forestry in Wales Quick Guide. For. Comm. For. Stat. 2013, 1, 1–5. [Google Scholar]
  36. Park, C.; Park, T. Review of Land Use Climate Change. An Assessment of the Evidence Base for Climate Change Action in the Agriculture, Land Use and Wider Foodchain Sectors in Wales; ADA UK Ltd.: Cardiff, UK, 2014. [Google Scholar]
  37. Clark Labs. TerrSet Tutorial; Clark Labs, Clark University: Worcester, MA, USA, 2015. [Google Scholar]
  38. Morton, D.; Rowland, C.; Wood, C.; Meek, L.; Marston, C.; Smith, G.; Wadsworth, R.; Simpson, I.C. Countryside Survey: Final Report for LCM2007—The New UK Land Cover Map. Countryside Survey Technical Report No 11/07. (CEH Project Number: C03259). 2011. Available online: https://www.ceh.ac.uk/sites/default/files/LCM2007%20Final%20Report.pdf (accessed on 24 November 2020).
  39. Building, M.; Lane, B.; Gifford, C.; Kingdom, U. Land Cover Map 2015 (25 m Raster, GB); Center for Ecology and Hydrology: Oxfordshire, UK, 2017; Volume 44, pp. 1–25. [Google Scholar]
  40. Verburg, P.H.; Schot, P.P.; Dijst, M.J.; Veldkamp, A. Land use change modelling: Current practice and research priorities. GeoJournal 2004, 61, 309–324. [Google Scholar] [CrossRef]
  41. Dadhich, P.N.; Hanaoka, S. Markov Method Integration with Multi-layer Perceptron Classifier for Simulation of Urban Growth of Jaipur City. In Proceedings of the 6th Wseas International Conference on Remote Sensing (Remote ‘10), Iwate Prefectural University, Takizawa, Japan, 4–6 October 2010; pp. 118–123. [Google Scholar]
  42. Iizuka, K.; Johnson, B.A.; Onishi, A.; Magcale-Macandog, D.B.; Endo, I.; Bragais, M. Modeling Future Urban Sprawl and Landscape Change in the Laguna de Bay Area, Philippines. Land 2017, 6, 26. [Google Scholar] [CrossRef]
  43. DasGupta, R.; Hashimoto, S.; Okuro, T.; Basu, M. Scenario-based land change modelling in the Indian Sundarban delta: An exploratory analysis of plausible alternative regional futures. Sustain. Sci. 2019, 14, 221–240. [Google Scholar] [CrossRef]
  44. Manzoor, S.A.; Griffiths, G.; Lukac, M. Species distribution model transferability and model grain size—Finer may not always be better. Sci. Rep. 2018, 8, 1–9. [Google Scholar] [CrossRef] [PubMed] [Green Version]
  45. Hashimoto, S.; DasGupta, R.; Kabaya, K.; Matsui, T.; Haga, C.; Saito, O.; Takeuchi, K. Scenario analysis of land-use and ecosystem services of social-ecological landscapes: Implications of alternative development pathways under declining population in the Noto Peninsula, Japan. Sustain. Sci. 2019, 14, 53–75. [Google Scholar] [CrossRef]
  46. Verburg, P.H.; van Berkel, D.B.; van Doorn, A.M.; van Eupen, M.; van den Heiligenberg, H.A.R.M. Trajectories of land use change in Europe: A model-based exploration of rural futures. Landsc. Ecol. 2010, 25, 217–232. [Google Scholar] [CrossRef]
  47. Hubbard, C.; Davis, J.; Feng, S.; Harvey, D.; Liddon, A.; Moxey, A.; Ojo, M.; Patton, M.; Philippidis, G.; Scott, C.; et al. Brexit: How Will UK Agriculture Fare? EuroChoices 2018, 17, 19–26. [Google Scholar] [CrossRef]
  48. Owen, J.; Stojanovic, A.; Rutter, J. Trade after Brexit: Option for the UK’s Relationship with the EU; Institute for Government: London, UK, 2017.
  49. Clark Labs. TerrSet Geospatial Monitoring and Modeling Software; Clark Labs, Clark University: Worcester, MA, USA, 2015. [Google Scholar]
  50. Symes, D.; Phillipson, J. ’A sea of troubles’ (2): Brexit and the UK seafood supply chain. Mar. Policy 2019, 102, 5–9. [Google Scholar] [CrossRef]
  51. Terres, J.M.; Scacchiafichi, L.N.; Wania, A.; Ambar, M.; Anguiano, E.; Buckwell, A.; Coppola, A.; Gocht, A.; Källström, H.N.; Pointereau, P.; et al. Farmland abandonment in Europe: Identification of drivers and indicators, and development of a composite indicator of risk. Land Use Policy 2015, 49, 20–34. [Google Scholar] [CrossRef]
  52. Forney, J. Blind spots in agri-environmental governance: Some reflections and suggestions from Switzerland. Rev. Agric. Food Environ. Stud. 2016, 97, 1–13. [Google Scholar] [CrossRef] [Green Version]
  53. Thompson, D.B.A.; MacDonald, A.J.; Marsden, J.H.; Galbraith, C.A. Upland heather moorland in Great Britain: A review of international importance, vegetation change and some objectives for nature conservation. Biol. Conserv. 1995, 71, 163–178. [Google Scholar] [CrossRef]
  54. Wilkinson, D. Defending British Farming Standards in Post-Brexit Trade Negotiations. EuroChoices 2020, 19, 4–10. [Google Scholar] [CrossRef]
  55. Lasanta, T.; Arnáez, J.; Pascual, N.; Ruiz-Flaño, P.; Errea, M.P.; Lana-Renault, N. Space–time process and drivers of land abandonment in Europe. Catena 2017, 149, 810–823. [Google Scholar] [CrossRef]
  56. Kolecka, N.; Kozak, J.; Kaim, D.; Dobosz, M.; Ostafin, K.; Ostapowicz, K.; Wężyk, P.; Price, B. Understanding farmland abandonment in the Polish Carpathians. Appl. Geogr. 2017, 88, 62–72. [Google Scholar] [CrossRef]
  57. Pereira, H.M.; Navarro, L.M. Rewilding European Landscapes; Springer International Publishing: New York, NY, USA, 2015. [Google Scholar]
  58. Beilin, R.; Lindborg, R.; Stenseke, M.; Pereira, H.M.; Llausàs, A.; Slätmo, E.; Cerqueira, Y.; Navarro, L.; Rodrigues, P.; Reichelt, N.; et al. Analysing how drivers of agricultural land abandonment affect biodiversity and cultural landscapes using case studies from Scandinavia, Iberia and Oceania. Land Use Policy 2014, 36, 60–72. [Google Scholar] [CrossRef]
  59. Linhart, Y.B.; Wheland, R.J. Woodland Regeneration in Relation to Grazing and Fencing in Coed Gorswen, North Wales. J. Appl. Ecol. 1980, 17, 827–840. [Google Scholar] [CrossRef]
Figure 1. Flowchart showing different steps involved in land use and land cover (LULC) change modelling.
Land 10 00059 g001
Figure 2. LULC maps of Wales projected to 2030 under a range of scenarios representing possible post-Brexit futures. Maps indicate the effect of Business as Usual (B-a-U, (a), Green Future (GF, (b), Free Trade Agreement (FTA, (c), World Trade Organisation (WTO, (d) and Unilateral Trade Liberalisation (UTL, (e) scenarios.
Land 10 00059 g002
Figure 3. Land use & land cover change intensity of Broadleaf Forest (top row) and Improved Grassland (bottom row) predicted under (a1,a2) Business as Usual (B-a-U), (b1,b2) Green Future (GF), (c1,c2) Free Trade Agreement (FTA), (d1,d2) World Trade Organisation (WTO) and (e1,e2) Unilateral Trade Liberalisation (UTL) scenarios. Colour mask indicates areas with gain/loss of up to 10%, between 10% and 25% and more than 25% of any 2.5 × 2.5 km2 block of land change.
Land 10 00059 g003
Figure 4. Projected expansion of Broadleaf Forest in and around the Brecon Beacons National Park, Wales by 2030, indicated by red overlay. Individual projections represent the (a) Business as Usual (B-a-U), (b) Green Future (GF), (c) Free Trade Agreement (FTA), (d) World Trade Organisation (WTO) and (e) Unilateral Trade Liberalisation (UTL) scenarios.
Land 10 00059 g004
Table 1. Explanatory variables considered in this study. Column (I) shows the categorization of variables, column (II) lists all considered explanatory variables in each class, and finally column (III) shows the Cramer’s V value of each variable. Variables with Cramer’s V < 0.15 were deselected in the first step, the remaining variables were then tested for correlation and the least correlated variables retained (highlighted in bold).
Category (I)Variables (II)Selection Thresholds (III)
Cramer’s V (>0.15) & Correlation (<0.75)
Source
Topography & SoilAltitude0.3239Shuttle Radar Topography Mission (SRTM), www.usgs.gov
Aspect0.165Shuttle Radar Topography Mission (SRTM), www.usgs.gov
Slope0.1504Shuttle Radar Topography Mission (SRTM), www.usgs.gov
Hillshade0.02Shuttle Radar Topography Mission (SRTM), www.usgs.gov
Soil Carbon Content0.06ISRIC World Soil Information, www.isric.org
ProximityDistance from Broadleaf Forest0.191TerrSet Software, https://clarklabs.org/terrset/
Distance from Conifer Forest0.167TerrSet Software, https://clarklabs.org/terrset/
Distance from Arable & Horticulture0.154TerrSet Software, https://clarklabs.org/terrset/
Distance from Improved Grassland0.154TerrSet Software, https://clarklabs.org/terrset/
Distance from Semi-natural Grassland0.165TerrSet Software, https://clarklabs.org/terrset/
Distance from Mountain, Heath, Bog0.21TerrSet Software, https://clarklabs.org/terrset/
Distance from Urban Areas0.2TerrSet Software, https://clarklabs.org/terrset/
Distance from Water Bodies0.182TerrSet Software, https://clarklabs.org/terrset/
Distance from Access Points0https://digimap.edina.ac.uk/
Distance from Green Spaces0https://digimap.edina.ac.uk/
Distance from Motorways0https://digimap.edina.ac.uk/
Distance from Road Links0.151https://digimap.edina.ac.uk/
Distance from Hydro-nodes0https://digimap.edina.ac.uk/
Distance from National Parks0.03https://digimap.edina.ac.uk/
SocioeconomicPopulation Density0.1763National Centers for Environmental Information, www.ngdc.noaa.gov/eog
Night Lights0.04National Centers for Environmental Information, www.ngdc.noaa.gov/eog
Evidence LikelihoodArable to Built0.1TerrSet Software, https://clarklabs.org/terrset/
Arable to Improved0.151TerrSet Software, https://clarklabs.org/terrset/
Conifer to Broad0.2647TerrSet Software, https://clarklabs.org/terrset/
Mountain, Heath, Bog to Semi-natural grassland0.1849TerrSet Software, https://clarklabs.org/terrset/
Semi-natural grassland to Arable0.1647TerrSet Software, https://clarklabs.org/terrset/
Semi-natural grassland to Broad0.17TerrSet Software, https://clarklabs.org/terrset/
Semi-natural grassland to Built areas0.17TerrSet Software, https://clarklabs.org/terrset/
Semi-natural grassland to Improved grassland0.17TerrSet Software, https://clarklabs.org/terrset/
Table 2. Area of each LULC category, historical observations in 2007 and 2015 (in ‘000 hectares). Business-as-usual (B-a-U), Green Future (GF), Free Trade Agreement (FTA), World Trade Organisation (WTO) and Unilateral Trade Liberalisation (UTL) translate effects of hypothesised policy changes to LULC transitions. Numbers show predicted area (in ‘000 hectares), square brackets indicate percentage changes of each LULC between 2015 and 2030. Total area of Wales is 2.078 million ha.
2030
20072015B-a-UGFFTAWTOUTL
Broadleaf forest124.5165200.2 [+21]330 [+110]199.7 [+21]313.5 [+90]478.6 [+190]
Coniferous Forest143161190.3 [+18]241.6 [+50]190 [+18]231.9 [+44]359.3 [+19]
Arable & Horticulture176.699.592.9 [−7]109.4 [+10]92.5 [−7]99.5 [0]114.5 [+15]
Improved Grassland841.3983.41045.7 [+6]792.7 [−19]1042.4 [+6]934.3 [−5]721.8 [−27]
Semi-natural Grassland510.9428.9314.4 [−27]317.4 [−26]292 [−32]212.1 [−51]107.2 [−75]
Mountain, Heath, Bog163.998.145.8 [−53]98.1 [0]72.6 [−26]98.1 [0]107.9 [+10]
Water Bodies12.912.112.1 [0]12.1 [0]12.1 [0]12.1 [0]12.1 [0]
Coastal Areas16.125.125.1 [0]25.1 [0]25.1 [0]25.1 [0]25.1 [0]
Built Areas88.5105151.8 [+44]151.8 [+44]151.8 [+45]151.7 [+44]151.7 [+44]
Table 3. Markov Chain transition probability matrix showing the probability of LULC transitions based on changes observed between 2007 and 2015 (in percent).
To:Broadleaf ForestConifer ForestArable Improved GrasslandSemi-Natural GrasslandMountain, Heath, BogWater BodiesCoastal AreasBuilt Areas
From:
Broadleaf Forest0.53410.13490.01850.18220.05940.01330.00330.01020.0441
Coniferous Forest0.18480.7480.00350.02890.020.00410.00190.00170.007
Arable & Horticulture0.050.00940.08960.6920.0740.00780.00190.01030.0652
Improved Grassland0.03940.00790.05560.7620.10040.00620.00060.00520.0227
Semi-natural Grassland0.07060.04770.03280.39550.36520.04950.00130.01260.0248
Mountain, Heath & Bog0.05950.08690.01870.16260.44090.20630.00240.00780.015
Water Bodies0.06580.01580.01280.05110.04410.01410.60680.15570.0338
Coastal Areas0.01610.00290.02040.06540.0410.00470.05920.74390.0463
Built Areas0.0770.0170.02490.1120.03420.0190.00350.02020.6921
Publisher’s Note: MDPI stays neutral with regard to jurisdictional claims in published maps and institutional affiliations.

