Article

Spatially Explicit Evaluation and Driving Factor Identification of Land Use Conflict in Yangtze River Economic Belt

1
Hubei Provincial Key Laboratory for Geographical Process Analysis and Simulation, Academy of Wuhan Metropolitan Area, College of Urban and Environmental Sciences, Central China Normal University, Wuhan 430079, China
2
School of Resource and Environmental Sciences, Wuhan University, Wuhan 430079, China
3
School of Geographical and Environmental Sciences, Guizhou Normal University, Guiyang 550025, China
*
Author to whom correspondence should be addressed.
Land 2021, 10(1), 43; https://doi.org/10.3390/land10010043
Submission received: 13 December 2020 / Revised: 31 December 2020 / Accepted: 1 January 2021 / Published: 5 January 2021
(This article belongs to the Special Issue Land Use Transitions under Rapid Urbanization)

Abstract

:
Regional land use transitions driven by the adaptive reconciliation of existing land use conflict with socioeconomic development can lead to positive economic effects as well as new land use conflict. Although research on land use transition has progressed considerably, limited studies have explored the spatiotemporal dynamic pattern of land use conflict during the land use transition period. Previous evaluation approaches on land use conflict that mainly focus on status or potential conflict lack conflict intensity evaluation during the land use transition process. A new spatially explicit evaluation framework of land use conflict that directly examines three aspects of conflict, namely, ecological and agricultural (EAC), agricultural and construction (ACC), and ecological and construction (ECC) land conflicts based on ecological quality and agricultural suitability, is proposed in this study. The spatiotemporal dynamic pattern and driving factors of land use conflict in the Yangtze River Economic Belt of China in the period of 2000–2018 are evaluated. The results indicated that comprehensive land use conflict (CLUC) intensity slightly decreased by 9.91% and its barycenter showed a trend toward the west during 2000–2018. ACC is the most drastic conflict among the three aspects of conflict. The mean intensity of ACC reduced remarkably by 38.26%, while EAC increased by 33.15% and ECC increased by 28.28% during the research periods. The barycenter of EAC moved toward the east while the barycenter of ACC and ECC moved toward the west. The changes in the intensity and spreading pattern of land use conflict indices demonstrated the changes in the pattern of territorial space development. Total population, population density, per capita GDP, number of mobile phone users, and road density were strong drivers that influenced the land use conflict of territorial space. Multiple policy recommendations including improving territorial space planning and governance ability, and improving land use efficiency, were proposed to manage and resolve the land use conflict of territorial space. The results and conclusions of this study will help improve future regional land use policies and reduce land use conflict.

1. Introduction

Along with increasingly extensive and intensive human activities, the exceptional pace, magnitude, and spatial reach of human alterations of Earth’s surface since the industrial revolution, or even earlier, has taken us to a new geological era called the Anthropocene [1]. Given that humans have increasingly become the predominant environmental force apart from geophysical sciences, the concept of the Anthropocene has been enthusiastically received [2,3]. The controversial idea of the “Age of Humans” has been extensively investigated by scholars from numerous other disciplines and public media and promoted the consideration of the human–nature relation [4]. Land use and land cover change (LUCC) is an important research topic that tackles the changing human–nature relation and a core project of IGBP (International Geosphere Biosphere Programme)and crossover research of IHDP (International Human Dimensions Programme on Global Environmental Change) [4]. The competition among different land use types over limited land use resources with remarkable urbanization and economic development, such as expansion of mankind landscape at the expense of ecological space, has been a primary feature of LUCC [5,6]. LUCC and the trade-off between different land use types has formed serious land use conflicts represented by environmental damage, including habitat loss, biotic diversity decline, climate change, and soil degradation [4,7,8], as well as social problems, such as the vulnerability of places and people to climatic and economic or sociopolitical perturbations [9,10,11,12]. In addition, many land use transitions have taken place over wild areas both from the dominant morphology and recessive morphology with the quantity, spatial structure, and function change of land use and land cover [13,14,15]. On the one hand, land use transitions are largely driven by different land use types representing the benefits of different departments conflicting in space and will lead to a new balance of regional land use morphology patterns [16,17].On the other hand, land use transitions may trigger new land use conflicts during transformations between different land use types and allocation of land resources due to policy and institutional failures [14,18]. Thus, exploring the spatiotemporal characteristics of land use conflicts is an important research topic to enhance the understanding of the human–nature relation and provide critical insights into the dynamics of land use transitions.
Land use conflicts occur whenever land use stakeholders have incompatible interests about how land is used in local areas [19]. Land disputes are the manifestation of land use conflicts when incompatible interests related to certain land units occur between specific stakeholders, such as developers, farmers, and local residents. For example, the controversial land compensation through large land investments and land acquisitions that led to a large number of land disputes between residents and developers, can pose a risk to social stability [20]. Another manifestation of land use conflict is the presence of the environmental land use conflict between land users and the public interest in ecological protection that typically occurs during the competition and compromise between different objectives for all land uses within a limited space [19,21]. Human land use (agriculture, exploitation of mineral resources, industrial production, and living activities) commonly have negative ecological and environmental impacts, such as consumption of highly productive agricultural land, occupation of rural residential communities, and destruction of ecological spaces that lead to growing conflicts between economic gains, social objectives (food security), and environmental goals (biodiversity conservation, ecosystem services provision, habitat integrity, and biodiversity) [22]. In addition, the implementation of some environmental protection policies can conflict with native residents, such as pastoral evictions due to the implementation of green economy in Tanzania [23]. Rapid urbanization and economic development cause extensive environmental land use conflicts. This complicated problem has attracted considerable research attention. Some scholars have carried out in-depth investigations on the ecological environmental impacts of land use conflicts [24,25]. Other scholars have focused on the potential land use conflict over current and proposed uses [26,27]. Another issue that has drawn considerable research attention is conflict resolution, and varied approaches have been proposed to solve this complicated problem [28,29,30]. However, comprehensive investigations on the spatiotemporal characteristics of land use conflict from the perspective of ecology based on a spatially explicit evaluation approach around a large-scale range are lacking, and studies on the driving factors of environmental conflicts are inadequate.
Land use conflicts are complex processes and various aspects must be considered. Several valuable approaches on land use conflict evaluation from an ecological perspective have been developed. Some scholars evaluate land use conflict through the degree of deviation between the actual land use from the most adequate land use standing on a capability evaluation (called natural use), while the ruggedness number is widely used to evaluate land capability [24,25]. The evaluation approach, based on the ruggedness number, is suitable for identifying the land use conflict in rural areas filled with farmlands and forest spots but unsuitable for rapidly urbanized areas. Some scholars proposed a linear conceptual model considering the complexity, vulnerability, and stability of land use units, while some scholars proposed another linear conceptual model considering spatial type, spatial structure, and spatial process conflict indices, to calculate the land use conflict in urbanized areas [21,31]. In addition, the comprehensive assessment from three aspects, including conflicts over land use structure, land conversion, and landscape pattern, were proposed to calculate the land use conflict [19]. These two evaluation approaches can properly evaluate the status of land use conflict but fail to examine the land use conflict occurring among land use transitions within a period. Furthermore, multicriteria analysis and multisuitability evaluation of construction, agricultural, and ecological lands were used to calculate potential land use conflict [32,33]. However, to date, analyses that directly examine the actual occurrence of land use conflict during land use transition processes are limited. A spatially explicit land use conflict evaluation approach that simultaneously considers the transition among ecological, agricultural, and construction lands triggered by human activities in rapidly urbanized areas is proposed in this study.
China has experienced rapid urbanization and economic development in the last 40 years since its opening and reform [34]. Acceleration of industrialization and urbanization as well as population and industrial agglomeration has intensified land development and utilization intensity [35]. Large-scale land development and utilization has led to alterations of local ecological landscapes and increasing food demand of the growing population driven by agricultural land reclamation. Chaotic land use patterns due to planning control failures and inefficient land utilization cause land use conflict in many regions across China [36,37]. Territorial space suffers from wastage and unreasonable use of land resources as well as environmental and ecological degradation [38,39]. Optimization of territorial space development has recently attracted considerable research attention under ecological civilization construction. Coordination and optimization of territorial space, which are crucial in effective territorial space development, have become important research topics [40]. However, scientific understanding of the spatiotemporal dynamic pattern and driving factors of land use conflicts is still limited, especially on a large regional scale [
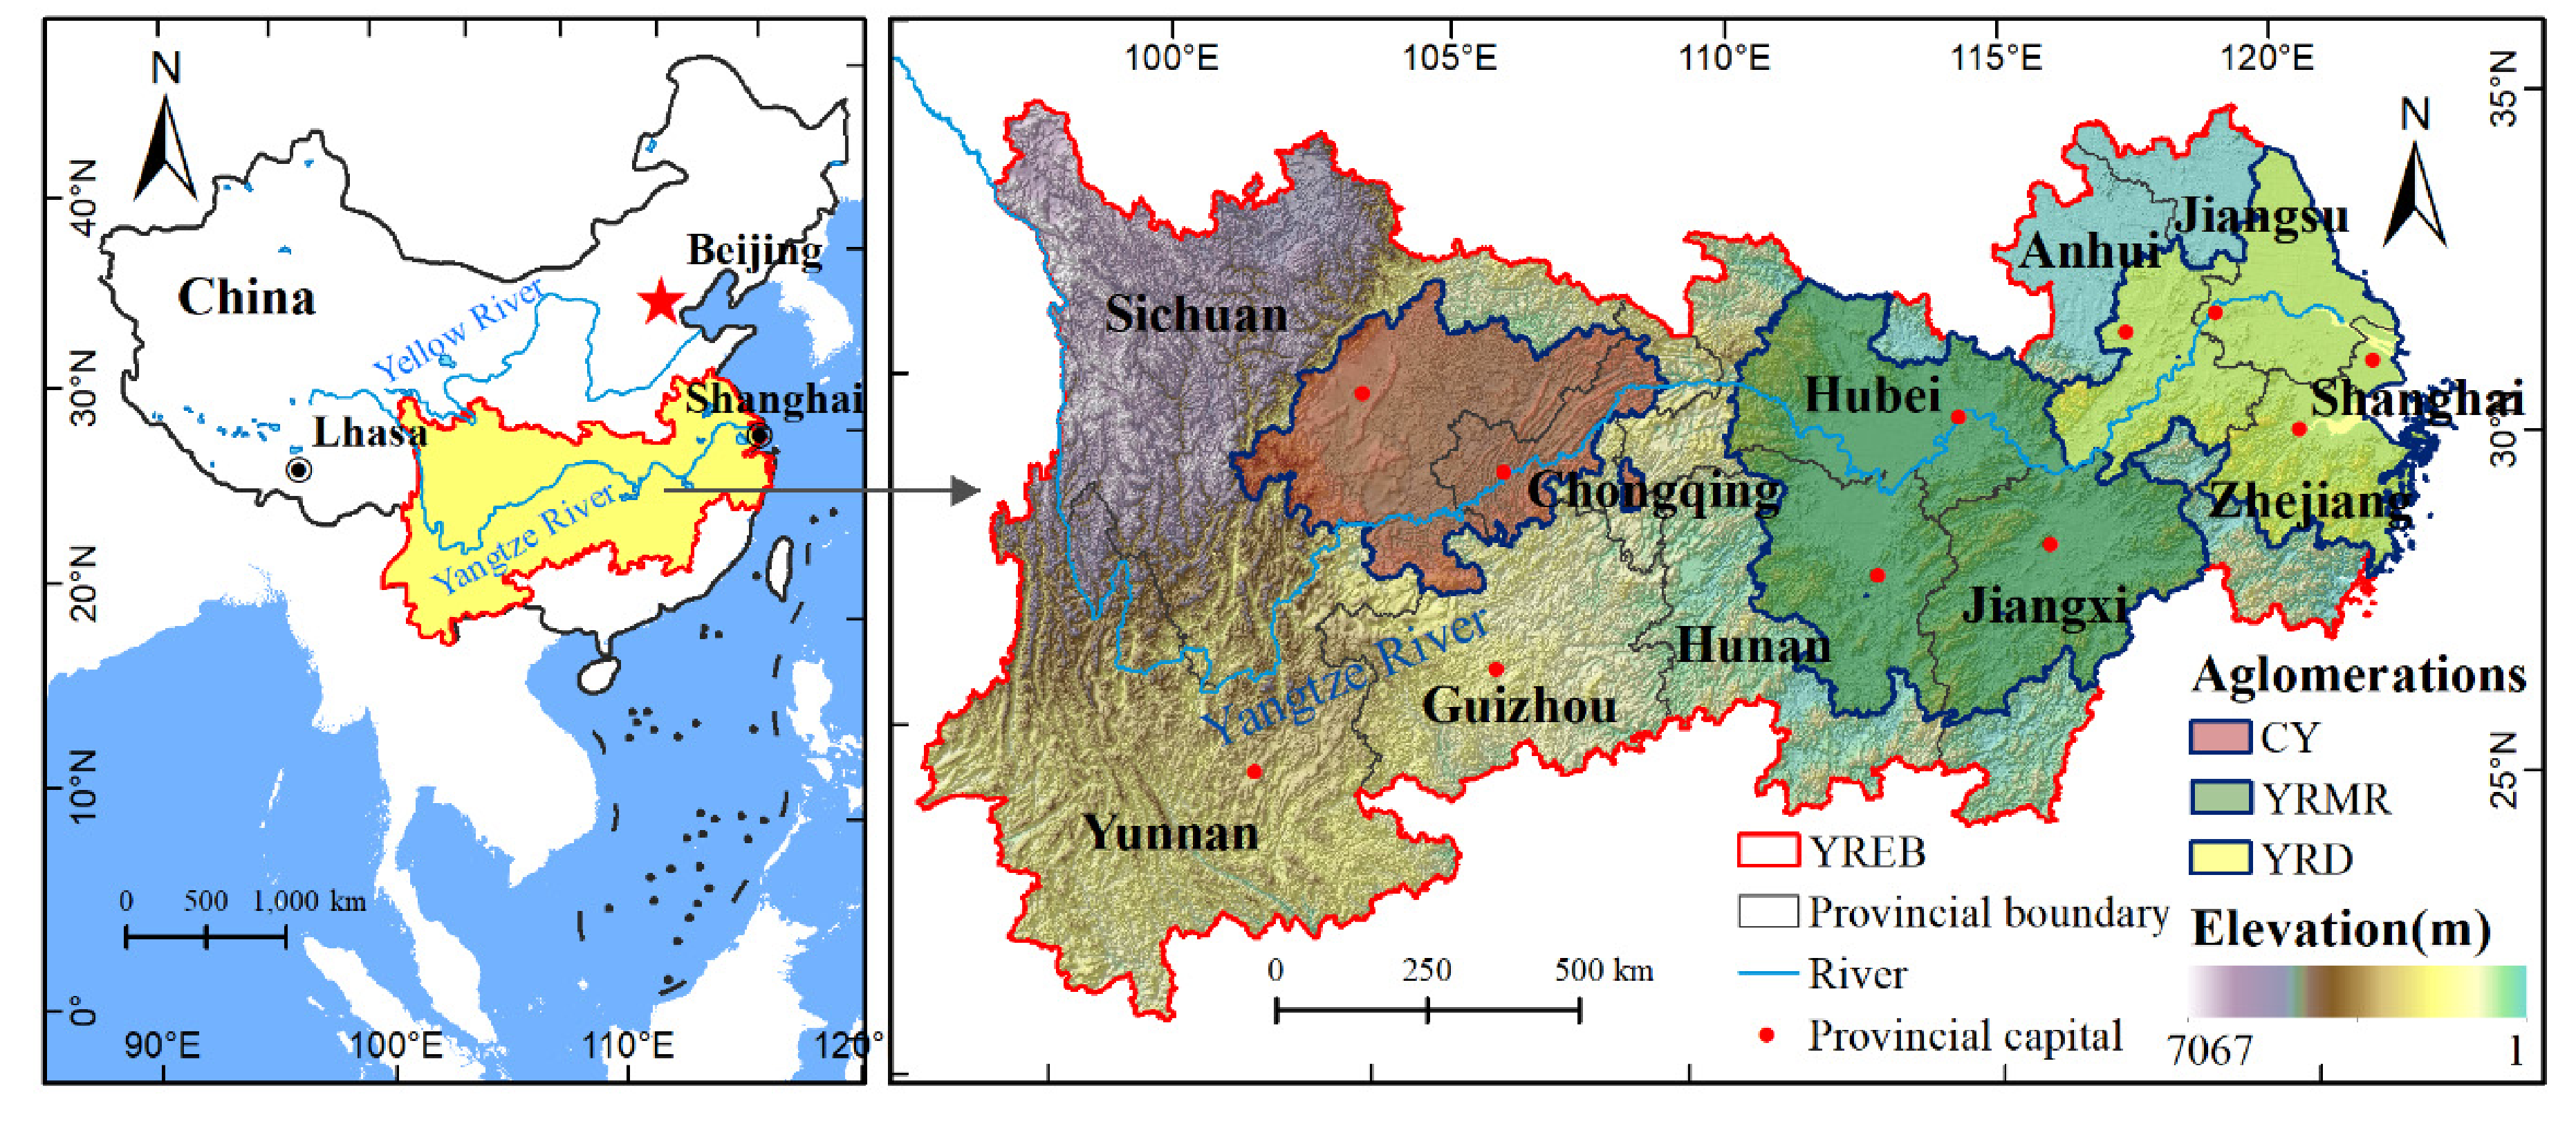
41]. The Yangtze River Economic Belt (YREB), a rapid economic development region in China with accelerated industrialization and urbanization, causes serious urban expansion and land use change [42]. Economic development, economic activities, infrastructure, and residences have clearly extended the scope and depth of urban areas to their surrounding virgin territories [43,44]. Natural land covers have been increasingly converted into urban impervious surfaces, with urban expansion exhibiting very fragmented characteristics [45,46]. The complexity of this phenomenon and its effects influence many ecological and environmental impacts, such as increased soil erosion [47], poor water quality [48], and reduced aquatic biodiversity [49], from local to global scales. The scarcity of land resource has led to the accumulation of land use conflicts over time. The spatial conflict of land use in small regions has been explored in many studies while investigations on spatial conflict in large regions and its driving forces are relatively rare [50,51]. Research on spatiotemporal patterns and land use conflict of the territorial space in YREB can help identify policies and practices to mitigate conflicts. This work examines issues that planners, land use managers, and practitioners must address when dealing with the complexity of land use change in the area.
This study primarily aims to (1) explore the spatiotemporal characteristics of land use conflict in YREB between 2000 and 2018, (2) develop a step-wise multiple linear regression model for identifying socioeconomic driving forces of spatial conflicts, and (3) propose some policy implications of the spatial control of territorial space within the study area while estimating land use conflict. Our study will provide a spatially explicit evaluation framework and contribute to the understanding of underlying driving forces of land use conflict.

2. Research Area and Data Sources

2.1. Research Area

The coastal economic belt and YREB are the top two largest economic and territorial space developments in China. As shown in Figure 1, YREB is located in the land belt adjoining the Yangtze River that stretches across three major regions of China (i.e., eastern, central, and western China). YREB covers nine provinces (i.e., Jiangsu, Zhejiang, Anhui, Jiangxi, Hubei, Hunan, Sichuan, Yunnan, and Guizhou) and two municipalities (i.e., Shanghai and Chongqing) with a population of 599 million inhabitants, which is 42.9% of China’s population, in its total area of approximately 2.05 million km2, which accounts for 21.4% of the country’s land mass. Benefiting from the golden waterway of the Yangtze, the high level of economic development in YREB contributed 46.2% of the nation’s gross domestic product (GDP), which reached CNY 45.78 trillion, in 2019.
Remarkable differences among regions in terms of natural conditions, regional transportation location, and socioeconomic development are due to the vast area and large span that crosses from east to west. Three urban agglomerations, namely, Cheng-Yu (CY), Yangtze River Middle Reaches (YRMR), and Yangtze River Delta (YRD), span the upper, middle, and lower reaches of YREB and represent the least developed western, less developed central, and most developed eastern regions in China, respectively. The development of YREB as a national strategy in 2014 has become one out of three regional development approaches in China that will change the country’s national landscape both economically and environmentally. YREB has remarkable advantages due to its geographical location and is important in the coordinated development of the three plates of the eastern, middle, and western parts of China and the opening up of areas along the Yangtze River. Despite its high level of economic development, YREB has received considerable attention in ecological civilization construction. The State Council has called for efforts to facilitate the development of YREB by promoting appropriately coordinated environmental conservation and avoiding excessive development activities (gong zhua da bao hu, bu gao da kai fa) because its ecological protection is critical to the sustainable development of the Yangtze River Basin, which serves as an important ecological security barrier area. The optimization of land use and development pattern is crucial in the coordinated development of the ecosystem, economy, and society because of the serious problem of urban overexpansion and uncoordinated land development in YREB. Hence, exploring the spatiotemporal dynamic pattern and land use conflict of the territorial space in YREB is necessary.

2.2. Data Sources

Land use data in 2000, 2010, and 2018 (spatial resolution: 30 m) were provided by the Resource and Environment Science and Data Center of the Chinese Academy of Sciences (http://www.resdc.cn/) and then validated using nationwide field surveys [52,53,54]. Land use raster data demonstrated a resolution of 30 × 30 m. These data consisted of six classes (cropland, forest, grassland, waterbody, built-up land, and unused land) and 25 subclasses with a classification accuracy of 90% [55].
Defense Meteorological Satellite Program/Operational Linescan System (DMSP/OLS) nonradiative calibration nighttime stable lighting data of 2000, 2010, and 2018 were downloaded from National Earth System Science Data Center (http://www.geodata.cn/). The resolution of nonradio-calibrated DMSP/OLS night-stabilized lighting data is 30 arc seconds and approximately 1 km at the equator. Data were strictly processed to remove effects of fire, sunlight, moonlight, clouds, and aurora. Stable lighting data include lights from cities, towns, and other places with long-lasting light sources with the removal of background noise [56].
Moderate resolution imaging spectroradiometer (MODIS) normalized difference vegetation index (NDVI) data of 2000, 2010, and 2018 were obtained from Resource and Environment Science and Data Center. The NDVI measures changes in chlorophyll content and spongy mesophyll within the vegetation canopy and is widely used to represent the vigor and photosynthetic capacity of vegetation canopy. The value of NDVI lies between −1 and 1, with high values typically representing large vegetation cover and growth. The annual maximum NDVI value generated from 16-d composite MODIS NDVI product was used in this study.
Soil quality data, including physical soil fertility (represented by area weighted soil organic carbon), reference soil depth, and soil texture (calculated by the clay fraction, gravel content, sand fraction, and silt fraction), were accessed from the harmonized world soil database [57,58,59]. The harmonized world soil database is a 30 arc-second raster database with over 15,000 soil mapping units that combines existing regional and national updates of soil information worldwide (Soil and Terrain database programme, European Soil Database, soil map of China, and World Inventory of Soil property Estimates) with the information contained within the 1:5,000,000-scale FAO-UNESCO (Food and Agriculture Organization of the United Nations- United Nations Educational, Scientific, and Cultural Organization) soil map of the world (FAO, 1971–1981) [59]. Explicit temporal component is absent in the data set. Data for the year 2000 are nominal [58].
Meteorological data were processed using gauge-based analysis of daily precipitation product from China Meteorological Administration [60]. DEM (Digital elevation model) was processed using the SRTM (Shuttle Radar Topography Mission) product from United States Geological Survey. Administrative boundary and road maps were downloaded from the National Catalogue Service for Geographic Information (http://www.webmap.cn/main.do?method=index).
The basic geographic information base map including national boundary, sea land border, and major rivers was obtained from the Standard Map Service System maintained by the Map Technology Review Center, Ministry of Natural Resources (http://bzdt.ch.mnr.gov.cn/index.html). Provincial boundary, Prefecture-level city boundary, and road map were extracted from 1:250,000 national basic geographic database provided by the National Catalogue Service for Geographic Information (https://www.webmap.cn/commres.do?method=result25W).
Socioeconomic data used in this study were mainly derived from statistical records and government publications, including statistical yearbooks of Chinese cities and provinces, statistical bulletins of each prefectural city, and government work reports at various administrative levels.
A detailed description of the data collected is in Table 1. All geographic data were organized and reprojected to a uniform geographic projection using ArcGIS software. SPSS was applied to carry out regression analysis during the study period.

3. Methodology

The research framework is presented in Figure 2. The land use classification system was established according to main functions of each piece of land. A land use conflict evaluation approach based on ecological quality and agricultural suitability was then constructed to estimate the land use conflict from the three aspects of ecological and agricultural (EAC), agricultural and construction (ACC), and ecological and construction (ECC) land conflicts. After evaluating the land use conflict of YREB according to the evaluation approach, temporal and spatial characteristics of land use conflict in the area as well as driving factors of land use conflict are explored. Finally, general policy suggestions for territorial space regulation are discussed in this study.

3.1. Land Use Classification System

Land use functions (LUFs) refer to the capacity of providing private and public products or services through diversified land use types and patterns [61]. Territorial space is a multifunctional comprehensive system and each piece of land provides one or combines several space functions in various forms [62]. According to the land use and functional statuses of various land use types in the study area, this article established a spatial classification system of construction, agricultural, and ecological areas [63]. Construction land mainly provides living, industrial production, and service industry functions. Agricultural land mainly provides agricultural production function. Ecological land mainly provides ecological functions such as climate regulation, gas regulation, water regulation, soil retention, and biodiversity. The development intensity of ecological, agricultural and construction lands and its disturbance to the natural ecosystems increase in turn. The classification system in this article can comprehensively reflect the change of land use functions and the transition of land use and development intensity. In addition, the land resources were classified as three land use types in the comprehensive zoning of land utilization [64]. Table 2 presents three classes of the territorial space.

3.2. Land Use Conflict

A new evaluation system for land use conflict based on real problems of land use practices and previous studies is proposed in this study (Figure 2). Our proposed index system includes three aspects, namely, ecological and construction (ECC), ecological and agricultural (EAC), and agricultural and construction (ACC) land conflicts. (1) ECC is defined by the deterioration of the ecosystem due to the intensification of human activities and construction land expansion during a certain period. Economic development and urbanization cause the construction land to expand with the occupation of large-scale ecological space. The shrinking ecological space through overexploitation generally indicates the deteriorating ecological environment and decreasing ecological service values [65,66]. Furthermore, increasing human activities may impose massive externalities to ecological land around the construction land [67]. Thus, both the increase and decrease in the total scale of ecological and construction land, as well as the negative externalities of construction land were considered in calculating ECC. (2) EAC is defined by the expanded agricultural land which unreasonably occupied a large area of ecological land during a certain period. The occupation of ecological land by agricultural land will reduce existing habitats, increase soil erosion, cause land degradation, and affect water quality, especially when the agricultural land is located in unsuitable areas [24,25,68]. (3) ACC is defined by the construction land expansion at the expense of agricultural land during a certain period. Decreasing agricultural land resources causes agricultural production risks and the threat of high food prices [69,70]. The increasing fertility of occupied agricultural land increases the conflict. The CLUC was calculated by considering the three kinds of land use conflict indicators.
ECC is calculated from the two aspects of ecological land loss index by construction expansion and threat indicator (TI) from human activities.
The ecological land loss index by construction expansion considers both the area and ecological quality of the ecological land loss as follows:
E L i , c o n s t r u c t i o n = j n A i j × E V i j T A i ,
where ELi, construction is the ecological land loss index of region i caused by construction expansion; Aij is the area of ecological land pixel j; EVij, the ecological value of ecological land pixel j represented by its NDVI, is set to 1 when the land use class of pixel j is a water body or shoal [67]; n is the total number of ecological land pixels occupied by construction land in region i, and TAi is the total area of region i.
This article estimated the level of threat posed by human activities to ecological land using the following modified TI:
T I i = j m r R A i j × E V i j × I C r × 1 d j r d j m a x T A i
where TIi is the threat level of human activities from construction land to ecological land in region i, R is the total number of construction land pixels within a certain distance to pixel j, ICr is the influence coefficient of the construction land pixel r measured by the standardized value of night light brightness, djr is the distance between ecological land pixel j and construction land pixel r, and djmax is the maximum effective distance of human threat reach across space, that was set to 5 km [71].
ECC is calculated by integrating ecological land loss index and TI of construction land. For the convenience of calculation, the average value of these two indexes is computed to express the following ECC:
E C C i = E L i , c o n s t r u c t i o n + T I i 2
where ECCi is the ECC in region i.
EAC is calculated according to the ecological land loss in the course of a progressive invasion of ecological land by the agricultural land and the ecological risk caused by the agricultural land reclamation. The main consequence ecological risk and hazards of agricultural land reclamation include water erosion and soil structure decline. The ecological risk was evaluated via a combination of basin relief and drainage network density called the ruggedness number (RN) [24,25]:
R N = H t × D d
where Ht is the basin relief and defined as the elevation difference between lowest and highest points within the buffer area and Dd is the drainage network density calculated by the kernel density of the drainage network.
EAC is calculated via the accumulated ecological risk by progressive invasion of ecological land by agriculture land as follows:
E A C i = j G A i j × R N i j T A i
where EACi is the EAC of region i, G is the total number of ecological pixels occupied by agriculture land in region i, and RNij is the RN of pixel j in region i.
ACC is calculated via the agricultural land loss index by using a combination of the agricultural land loss area and the suitability of the lost agricultural land. The high suitability of the lost agricultural land increases ACC. The agricultural land suitability is evaluated through GIS-based multicriteria analysis [72] with selected criteria (Table 3).
ACC is calculated using the accumulated suitability index of the lost agricultural land as follows:
A C C i = j H A i j × A S i j T A i
where ACCi is the ACC of region i, H is the total number of agricultural pixels occupied by construction land in region i, and ASij is the agricultural land suitability of pixel j in region i.
CLUC is calculated using the combination of EAC, ACC, and ECC.

3.3. Selecting Potentially Important Driving Factors

Identifying major underlying factors of spatiotemporal patterns of the land use conflict is necessary to recognize evolution rules and the internal mechanism of the spatial conflict indices. Previous studies showed that demography, economy, and residents living in the area are important factors that drive structural changes and the pattern evolution of the territorial space [43]. We hypothesized in this study that three kinds of driving forces, namely demographic, economic, and life factors, would be crucial to the land use conflict of the territorial space. Specifically, this article selected eight socioeconomic variables covering three kinds of factors, namely, total population, population density, per capita GDP, investment in fixed assets, total retail sales of consumer goods, number of hospital beds, number of mobile phone users, and road density, to examine their relation to the spatial conflict of the territorial space (Table 4). However, historical data on YREB covering 130 cities (including 2 municipalities, 109 prefecture cities, 15 autonomous prefectures, 3 province-governing counties, and 1 forest district) in the study’s time span from 2010 to 2018 are lacking. Therefore, given the regional characteristics of YREB and the difficulty in acquiring relevant data, this article gathered socioeconomic factors in 2018 to explore the driving forces of the land use conflict.

3.4. Statistical Analysis

Both Pearson correlation and step-wise linear regression were used in this study. Eight socioeconomic variables were examined via Pearson correlation analysis to determine their individual correlation with conflict indices in 2018. This article also performed step-wise linear regressions in which EAC, ACC, ECC, and CLUC were taken as dependent variables while nine socioeconomic driving factors were used as independent variables to verify their significant correlation with conflict indices when other factors are held constant.
In addition, this article computed standardized regression coefficients to compare significant socioeconomic factors and determine which ones are statistically significant in the step-wise linear regression. Standardized regression coefficients represent the amount of change in the dependent variable in response to a change of one standard deviation in an independent variable. Thus, the large absolute value of the standardized regression coefficient indicates the importance of the independent variable. Statistical analyses were performed using SPSS for Windows (version 19.0).

4. Results

4.1. Variation Characteristics of Land Use in YREB

The land use area and its rates in YREB from 2000 to 2018 were obtained according to the land use classification system (Table 5). The ecological land is the largest region that accounts for more than 66% of the territorial area. This finding indicates the satisfactory environmental background of YREB that benefits from its suitable latitude and humid climate. The large area of ecological land provides a livable environment for human beings and also lays an acceptable foundation for an environmentally friendly economy. Agricultural land is the second most dominant class in YREB that accounts for more than 29% of the total area. YREB’s long history of farming is because of its suitable climate, abundant labor force, and large plains. The high-level agricultural development leads to the large amount of agricultural population and high grain output. The Chinese government set up several agricultural production bases in YREB, including the area between Yangtze and Huai Rivers (jianghuaidiqu); Taihu, Poyang, and Dongting Lake Plains, and Jianghan and Chengdu Plains. Known as the “rice barn” of China, YREB plays an important role in China’s food security. Strengthening the protection of agricultural land in YREB and controlling the land use conflict between agricultural land and other land use categories are important [73]. However, fine planting and excessive pursuit of yield demonstrated a negative effect on the surrounding ecology, including nonpoint source pollution from fertilizers and pesticides. The land use conflict between ecological and agricultural lands must be considered to realize satisfactory ecological services in the region. The share of construction land is relatively low, but these areas demonstrating the maximum human activity also receive considerable attention. YREB is a primary development belt of China that demonstrates high-intensity progress. Rapid urbanization and industrialization has caused high-intensity land use conflict in YREZ.
The annual variation of each land use category is presented in Table 6. The three land classes changed in varying degrees. The construction land demonstrating the most remarkable changes increased rapidly by 3,448,260 ha during 2000–2018. Its ascending speed reached 18.51% per year during 2000–2010 and then decreased to 13.86% during 2010–2018. This finding evidently shows the land use front via urbanization and economic development, which accelerated at the expense of land use. By contrast, agricultural land reduced rapidly by 1,939,000 and 1,196,240 ha during 2000–2010 and 2010–2018, respectively, because the rapid urbanization and economic development used a considerable amount of arable land. Its decline speed first achieved −0.30% during 2000–2010 and then decreased to −0.24% during 2010–2018. The reduced consumption of agricultural land was due to the gradual tightening of arable land management policies concerning food security. The ecological land increased by 37,700 ha during 2000–2010 because of the Grain for Green policy and excavation of reservoirs and ponds for irrigation and fish culture by residents. However, ecological land reduced by 350,720 ha during 2010–2018 due to the strict farmland protection system. The agricultural land occupied by construction land is usually supplemented from the ecological land to accomplish the difficult task of minimizing farmland areas.

4.2. Spatiotemporal Dynamic Analysis of Each Land Use Conflict Indicator

4.2.1. Temporal Variability in Land Use Conflict during 2000–2010 and 2010–2018

The conflict indices of YREB during 2000–2010 and 2010–2018 are shown in Figure 3. The aggregative indicator of CLUC decreased slightly throughout the study period. The slight decrease in CLUC throughout the entire study period indicated that economic development and urbanization gradually reduce land type conversion and result in the reduction in the land function transformation. By comparison, ACC is the most serious conflict indicator among the three aspects of conflict indicators. ACC reduced considerably by 38.26% during the last decade due to strict arable land protection policies and the pressure of food security that effectively prevented land development from occupying arable land. EAC and ECC both demonstrated a trend of rising slowly due to the lack of spatial regulation and governance zoning of ecological land. The unlimited expansion of construction land occupying large ecological land and the arable land reclamation of ecological land that compensates for the lost arable land finally resulted in remarkable EAC and ECC. The intensifying EAC and ECC and still high ACC indicate the high demand of our spatial government ability.

4.2.2. Spatiotemporal Dynamic Pattern of Land Use Conflict Indicators

Spatial distribution patterns of land use conflict indicators during 2000–2010 and 2010–2018 are illustrated in Figure 4. This article classified the area into five types of regions, namely, low, semilow, medium, semihigh, and high value regions, according to natural breaking points. Different land use conflict indicators demonstrate unique distribution characteristics. High and semihigh values of the EAC are spread out over a large area. The midwest region exhibited serious conflict, especially in Yunnan, Hubei, Guizhou, and Eastern Sichuan. Eastern provinces, including Jiangsu, Zhejiang, Anhui, and Shanghai, demonstrated low-scale conflict values. The spatial distribution pattern of the EAC was controlled by multiple factors in which the economic development and topographic condition were the most evident. Relatively high values of the EAC were concentrated in interlaced zones of ecological and agricultural lands. Large populations strongly depend on farming for their living due to the area’s poor economic development. Residents expand the agricultural land to increase production and ecological land was compressed and perturbed by agricultural land which led to serious EAC, while increasing the vulnerability of the entire territory space. The period of 2010–2018 generally demonstrated an intensified trend of EAC compared to the period of 2000–2010. The area exhibited high, semihigh, and medium values from 40,100 km2 to 75,600 km2 and its mean conflict intensity increased by 33.15%. Hence, the agricultural development considerably affected the ecosystem in YREB, especially in the last decade. Responding to problems that cause damage to the environment and restricting the agricultural sustainable development, reform, and promotion of agricultural development are necessary. The status of the distributing pattern still presented the dispersion type. The EAC in Yunnan is still serious and the EAC in Guizhou and Hunan increased considerably in the second period.
Both periods demonstrated similar spatial distribution patterns of the ACC index. Areas with high and semihigh values concentrated around the three urban agglomerations indicated that the urbanization and economic development of urban agglomerations cause considerable ACC. The intensity and scope of ACC of YRD are considerably larger than other urban agglomerations along the upstream and midstream of the Yangtze River mainly because of the higher intensity of urban expansion at the expense of agricultural land in YRD than the findings in the two other urban agglomerations. The period of 2010–2018 demonstrated a considerably reduced ACC than the period of 2000–2010. The area with relatively higher and high values reduced from 50,700 km2 to 20,800 km2 and its mean conflict intensity reduced by 38.26%, thereby indicating that the overall agricultural land loss due to human activities and overall deterioration considerably reduced. The agricultural land protection policy played a crucial role in controlling ACC.
The ECC demonstrated evident east high and west low trend, as shown in Figure 4. High and semihigh value areas in YRD spread over a wide area. By comparison, high and semihigh value areas in the middle and western parts of the region concentrated in economically developed large cities. The high population density and rapid economic development in these regions required large amounts of construction land at the expense of ecological land. Meanwhile, the intensive production and living activities around these economic development zones interfere with the surrounding ecosystem and lead to severe land use conflict between humans and wild nature. The overall trend of the ECC increased both in size and distribution. The high, semihigh, and medium value areas increased from 61,500 km2 to 79,800 km2 and the average conflict intensity increased by 28.82%. Meanwhile, the distribution spread out from central cities to a wide area.
CLUC of YREB was calculated by integrating the three aspects of EAC, ACC, and ECC. As shown in Figure 4, CLUC in the eastern coastal region, especially YRD, is relatively high over a wide area. CLUC in middle and western inland regions is mainly concentrated in central cities. Wuhan, Chengdu, Chongqing, Changsha, and Nanchang are the five main conflict centers in the middle and western regions and are largely consistent with the range of the three national urban agglomerations. The rapid economic development and urbanization process in these areas stimulated the function transformation among ecological, agricultural, and construction lands and resulted in intense land use conflict. Areas with low values were located in western Hubei, western Sichuan, and Guizhou during 2000–2010. The overall trend of CLUC slightly declined by 9.91% during the research period.

4.2.3. Spatiotemporal Variation Pattern and Standard Deviation Ellipse Analysis of Land Use Indicators

The explicit variation and weighted standard deviation ellipse (SDE) of the conflict was calculated to further explore the variation of land use conflict indicators between the two periods (Figure 5).
Areas with increased EAC are mainly spread over middle and western regions. SDE locations of EAC spread along the western part of the study area confirmed the serious EAC in middle and western parts of YREB. Weighted mean centers revealed an evident shift in the direction of north by east due to the increase in EAC in the middle region and slight decrease in some areas in the western region of the study area. The increased degree of dispersion of EAC is depicted by the enlarged long and short axes of SDEs.
Areas with remarkably increasing ACC were mainly located in peripheral regions of Wuhan and Chengdu. These were star cities with rapid development in the past decade. At the same time, several cities, such as Kunming in Yunnan, Guiyang in Guizhou, Hefei in Anhui, and Nanchang in Jiangxi, also demonstrated considerably increasing ACC. By comparison, ACC evidently decreased in YRD and some regions in the central urban area of midwestern cities. This finding indicated that the urbanization process of YRD noticeably slowed down after reaching a high level. The weighted SDE of ACC was delineated to reveal its orientation and spatiotemporal development trends further. The weighted mean center of ACC clearly distributed along the east side indicated that ACC of the eastern part was considerably more serious than the western part. Furthermore, changes in the SDE location revealed a considerable shift in the direction of south by west. Hence, the land development intensity transferred from the eastern coastal area to the inland midwest because of the midwest regions accepting the industrial transfer from the eastern coastal area and the active economic development of the midwest region.
The comparison of distribution patterns of ECC in both periods showed that the intensity of ECC increases throughout the study area, except for a small region in Jiangsu and other big cities. The region development accelerated in the west, especially in Kunming and Guiyang, and caused a serious threat to the ecosystem. SDEs in both periods also demonstrated that ECC transferred to the west.
A large imbalance exists between western and oriental CLUC variance. CLUC decline regions are mainly located in the eastern coastal region and some urban centers of several big cities in middle and western inland regions, such as Wuhan, Chengdu, Changsha, and Nanchang. Regions with increasing CLUC were scattered around a wide area in the midwest. The level of dispersion of CLUC was enhanced considerably. SDEs of CLUC spread over northeast of the study area indicated the strong CLUC intensity in the east but weak CLUC intensity in the west. The overall CLUC transferred from east to west.

4.3. Driving Factors

Our correlation analysis showed that all selected socioeconomic variables were significantly correlated with land use conflict indices (with at least one indicator) although values of their Pearson correlation coefficients differed significantly (Table 7). Pearson correlation coefficients of total population of prefectural city (TPOP), number of hospital beds (HBN), and road density (RD) were larger than 0.60 and six of the variables were approximately 0.4 and less in the EAC conflict. High Pearson correlation coefficients of 0.807 between RD and EAC indicated that road extension leads to agricultural land reclamation through the destruction of ecological land. A Pearson correlation coefficient of −0.189 in POPD demonstrated that EAC occurs mainly in remote areas far from the city. Pearson correlation coefficients of TPOP, investment in fixed assets (IFA), total retail sales of consumer goods (TRSCG), HBN, and number of mobile phone users (MPUN) were larger than 0.7 with ACC. POPD, per capita GDP (GDPPC), and RD were approximately 0.3 and more with ACC. This finding indicated that population growth, economic development, and lifestyle improvement all generated ACC and exerted strong pressure on the protection of agricultural land. All driving factors demonstrated Pearson correlation coefficients of less than 0.6 with ECC. High Pearson correlation coefficients of more than 0.6 were observed in TPOP, IFA, TRSCG, HBN, MPUN, RD, and LUC. TPOP exhibited the highest Pearson correlation coefficient of 0.839 with CLUC, followed by HBN and MPUN with values of 0.824 and 0.790, respectively.
The step-wise multiple linear regression results revealed that conflict indices can be appropriately explained by socioeconomic factors. Table 8 indicates that R-square values of Models 1, 2, 3, and 4 can reach 0.653, 0.734, 0.360, and 0.803, respectively. Unlike the results of the Pearson correlation analysis, our step-wise multiple linear regression showed that only some of the selected socioeconomic factors are statistically significant. TPOP represents demographic variables with a significantly positive relationship with EAC, ACC, and CLUC. By comparison, the negative coefficient of POPD, EAC, and CLUC indicated that land efficiency improvement effectively reduces land use conflict. Economic factors showed significantly positive coefficients with EAC, ACC, ECC, and CLUC in different aspects. GDPPC is the most important driving factor and positively correlated with EAC, ECC, and CLUC. IFA mainly drives the land exploitation and is thus positively correlated with ACC and ECC. TRSCG mainly drives the increase in ACC.
The lifestyle transition of residents also significantly affects the land use conflict. The significantly positive relationship of the coefficient of HBN and EAC indicated that the public service upgrading intensifies the land use conflict. The positive influence of MPUN on ACC indicated that lifestyle improvement affects the land use conflict. The positive correlation of RD with EAC and CLUC at 0.448 and 0.512, respectively, implied that the transportation development seriously disturbs the ecological system. However, RD showed a significant negative relationship with ECC because the growth in the living standard of residents improves the awareness of ecological protection and reduces the conflict.

5. Discussion

5.1. Major Influencing Factors of Land Use Conflict in YREB

Our study demonstrated that the major influencing factors of land use conflict depend on the statistical methods used (i.e., Pearson correlation analysis vs. step-wise linear regression analysis in this case). The results of the Pearson correlation analysis indicated that all selected socioeconomic factors, except POPD, are significantly correlated with conflict indices individually (Table 6). This finding suggested that each factor can contribute to the land use conflict by enhancing human activities and intensifying land development. Particularly, the total population demonstrated the strongest positive correlation with all conflict indices. Population is a main driver of land development and urban expansion due to the requirement of sufficient production and living spaces [74,75]. People gathered together will generate various human activities and cause serious ecological space disturbance by encroaching on the natural habitat of animals and plants or polluting the water and soil [76,77]. For example, urbanization and population are important driving forces of the morphological change of lakes and the conflict between rapid urban growth and the maintenance of water landscape is increasingly intensified [78]. The increasing population causes a sharp rise in the land use conflict.
Road density is another important driver of land use conflict of the territorial space. On the one hand, roads split the natural environment and destroy the ecosystem integrity to some extent while exerting pressure on ecological and eco-production lands [79]. On the other hand, roads open the land for resource extraction and other human activities while increasing accessibility and mobility, thereby extending the level of human disturbance on many ecological processes [80,81]. Road networks affect the spatial structure of urban landscapes and exert additional widespread influences on the regional ecological environment with continuous expansion [82]. Hence, road density is an important driver of land use conflict, especially for EAC.
Other economic factors, such as per capita GDP, investment in fixed assets, and total retail sales of consumer goods all have significant relationships with conflict indices. The prevalence of the extensive use of land in economic development leads to the large consumption of land resources at the expense of ecological and eco-production land loss [83]. Overexploitation and utilization of the land and lack of land order administrative policies in economic development lead to remarkable changes in the territorial space. China is still in the period of rapid industrialization and urbanization, and massive land development will continue to intensify land use conflict and impose pressure on both ecological and food security. This trend is especially evident in many megacities, such as Beijing, and coastal regions of China, such as YRD and Pearl River Delta regions [51]. Accelerating transformations in economic development and land use modes is necessary in future developments.
Lifestyle improvements represented by the number of hospital beds and mobile phone users are also important driving factors of spatial conflicts. The rapid economic development that accompanied the industrialization and urbanization in China increased the demand of lifestyle experience. The industrialized lifestyle will consume additional energy and land and cause remarkable spatial conflict. Green and healthy lifestyles should be promoted seriously and become the habit and attitude of modern humans.
The step-wise linear regression analysis provided an efficient prediction model of spatial conflict using only socioeconomic variables with independent information. Hence, a small set of socioeconomic variables were statistically significant in this analysis due to the correlation between many variables. For example, the economic development represented by local financial revenue was strongly related to per capita GDP; hence, local financial revenue was excluded from the list of major influencing factors.

5.2. Policy Implications

Land use conflict is a serious problem during the land use transition process [14,84]. Promoting coordinated land use by exploring measures from the land use policy perspective of land use transitions is important. Land use policies play an important role in shaping the pattern of territorial space development and adjusting the land use conflict. China has introduced many land use policies that have serious effects on land use conflict since the 1980s (Table 9). For example, China’s farmland protection system set the state policy for protecting farmlands with a series of measures and regulations, such as cultivated land reserve index of each administrative region assigned by the land administration department and tax levy on farmland occupation. Basic farmland protection and farmland dynamic balance systems have been established to protect farmlands from human construction occupation. These farmland protection policies play a crucial role in the adjustment of ACC.
Meanwhile, China introduced several ecological control policies, such as nature reserve regulation, the Grain for Green Project, ecological red line plans, and national parks. The first nature reserve was initiated in 1956 in Zhaoqing, Guangdong Province, and the nature reserve regulation was issued in 1994 to regulate the institution and administration of nature reserves. Since then, many nature reserve areas have played a considerable role in protecting biodiversity, preserving natural heritage, improving the quality of the ecological environment, and safeguarding national ecological security. At present, China has 2750 nature reserves that cover approximately 15% of the entire land area. However, serious problems, such as overlapping extent, multiple management, and obscure boundaries, were observed in the past institution and administration of nature reserves [85]. The state intends to establish a system of protected natural areas dominated by national parks to solve such problems through natural area integration, marginal adjustment, and clear functional position. The ecological red line policy is another control plan for protecting areas with special and important ecological functions. The ecological red line includes more territory space than nature reserves and covers more than a quarter of the land area of the entire country. The Grain for Green Project is a policy implemented for actively restoring farmland to forests and livestock pastures to natural grasslands. The Grain for Green policy has been carried out in more than 33 million ha to expand the ecological land effectively and consolidate ecological security in the last 20 years. These ecological control policies play a remarkable role in the adjustment of EAC and ECC.
Our findings have several implications for policy implementation and land use management in YREB. Land use conflict in YREB is still serious despite these implemented land use policies. The coordination of ecological, agricultural, and construction lands should be seriously considered in existing territorial space planning. For example, territorial space planning should solve problems of crossing and overlapping of basic farmlands and ecological red lines. Human activities and infrastructure projects should be strictly limited and gradually exist from the core region of nature reserves.
Development concept and governance ability must be improved to realize territorial spatial pattern optimization, accelerate ecological civilization, and promote high-quality development in the implementation of territorial space planning. Territorial space planning should be formulated with a comprehensive understanding of evolution context and regularity feature of the regional physical geographical environment and land use spatial patterns. Evaluating the resource environment carrying capacity, suitability of territorial space development, and disaster risk will build a solid foundation for territorial space planning. The harmonizing and processing rule of land use conflict should be investigated further on the basis of coordinated relations among urban development, population, land use, industry, and resource environment background to optimize the territorial spatial pattern. The economic development and population growth both demonstrate significant relationships with spatial conflicts. Hence, policies and regulations should be introduced to coordinate the economic development, population growth, and land development and utilization, especially in highly urbanized and flourishing economic areas. Road density is another important variable that can influence the land use conflict. Road construction must demonstrate reasonable layout planning and reduce the segmentation in the ecological land. The few remaining roadless and low-traffic areas in YREB should be considered and additional conservation measures must be included in laws and policies [81]. Systems of organizational scheme, technical standard, implementation supervision, as well as regulations and policies related to territorial space planning should be completed. Additional detailed and specific land control measures and regulations should be introduced to build coordinated territorial space patterns.
The land use efficiency and functional quality of construction land should be improved via intensive utilization and compact development. The scale of urban and rural construction land should be strictly controlled through the delineation of urban development boundary. We should overall allocate the industrial distribution and promote industrial clustering and centralization. The coupling relationship of production and living lands should be optimized according to local conditions by using the new development model of city and industry integration. Food security is a critical mission for agricultural land. Ensuring agricultural land scale and committing to the guarantee of food supply are realistic tasks that can be achieved by allocating the agricultural land on the basis of the “no reduction in quantity, no loss of mass, improvement in ecology, and optimization in layout” strategy. The high-quality agricultural land should be protected and measures must be taken to facilitate the large-scale industrialization and modernization development of agriculture. The concept of ecological priority must be established for ecological land. Ecological protection space should be delineated first during the formulation of territorial space planning. Ecological corridors and networks should be constructed to form a complete regional pattern for ecological security. Comprehensive land adjustment and ecological remediation must be promoted to improve land quality, optimize space function, and enhance ecological services.

6. Conclusions

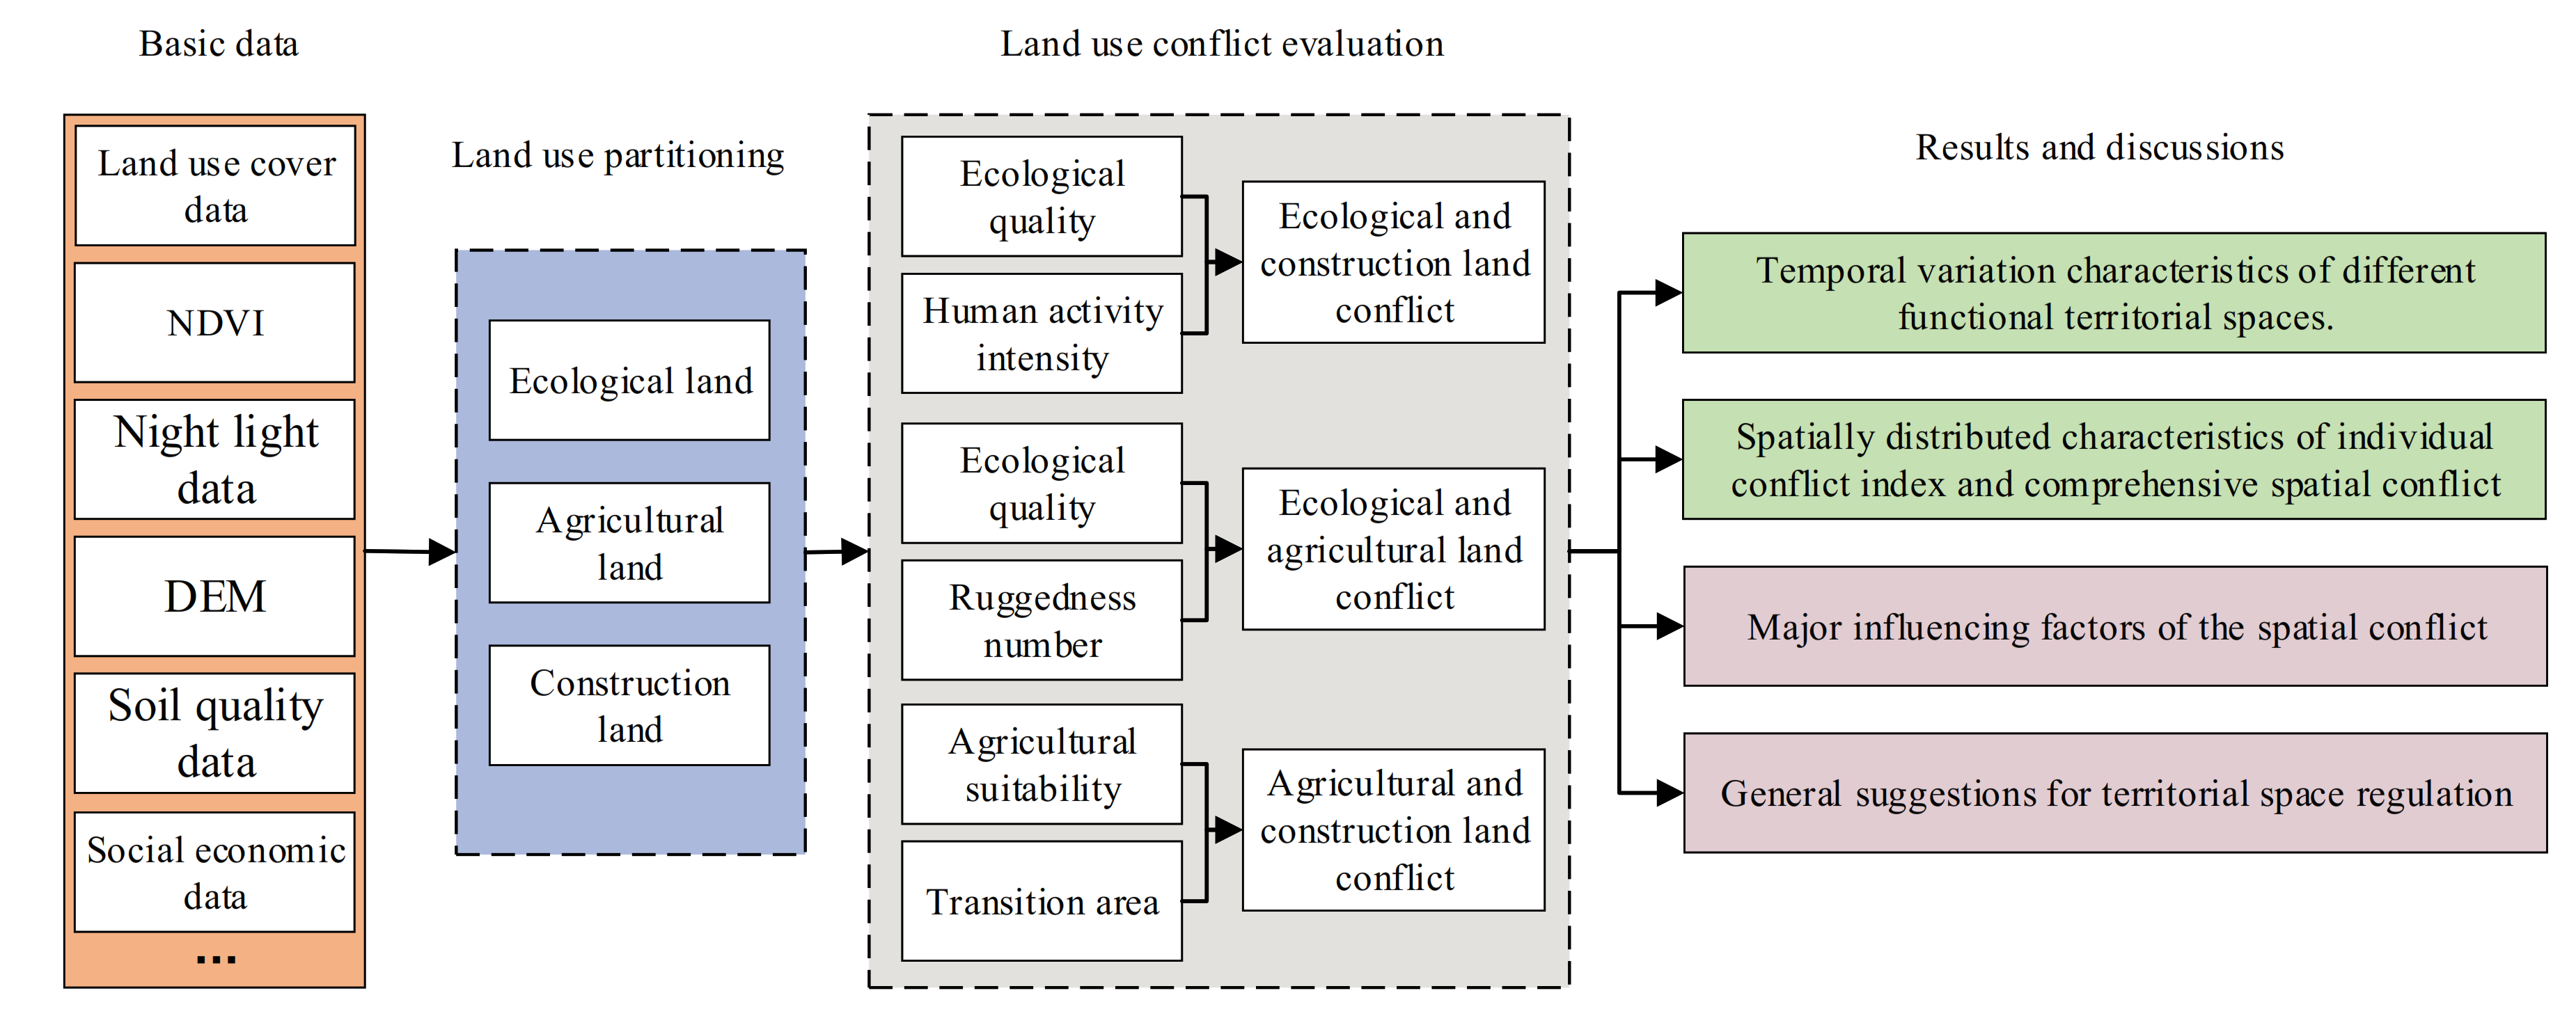
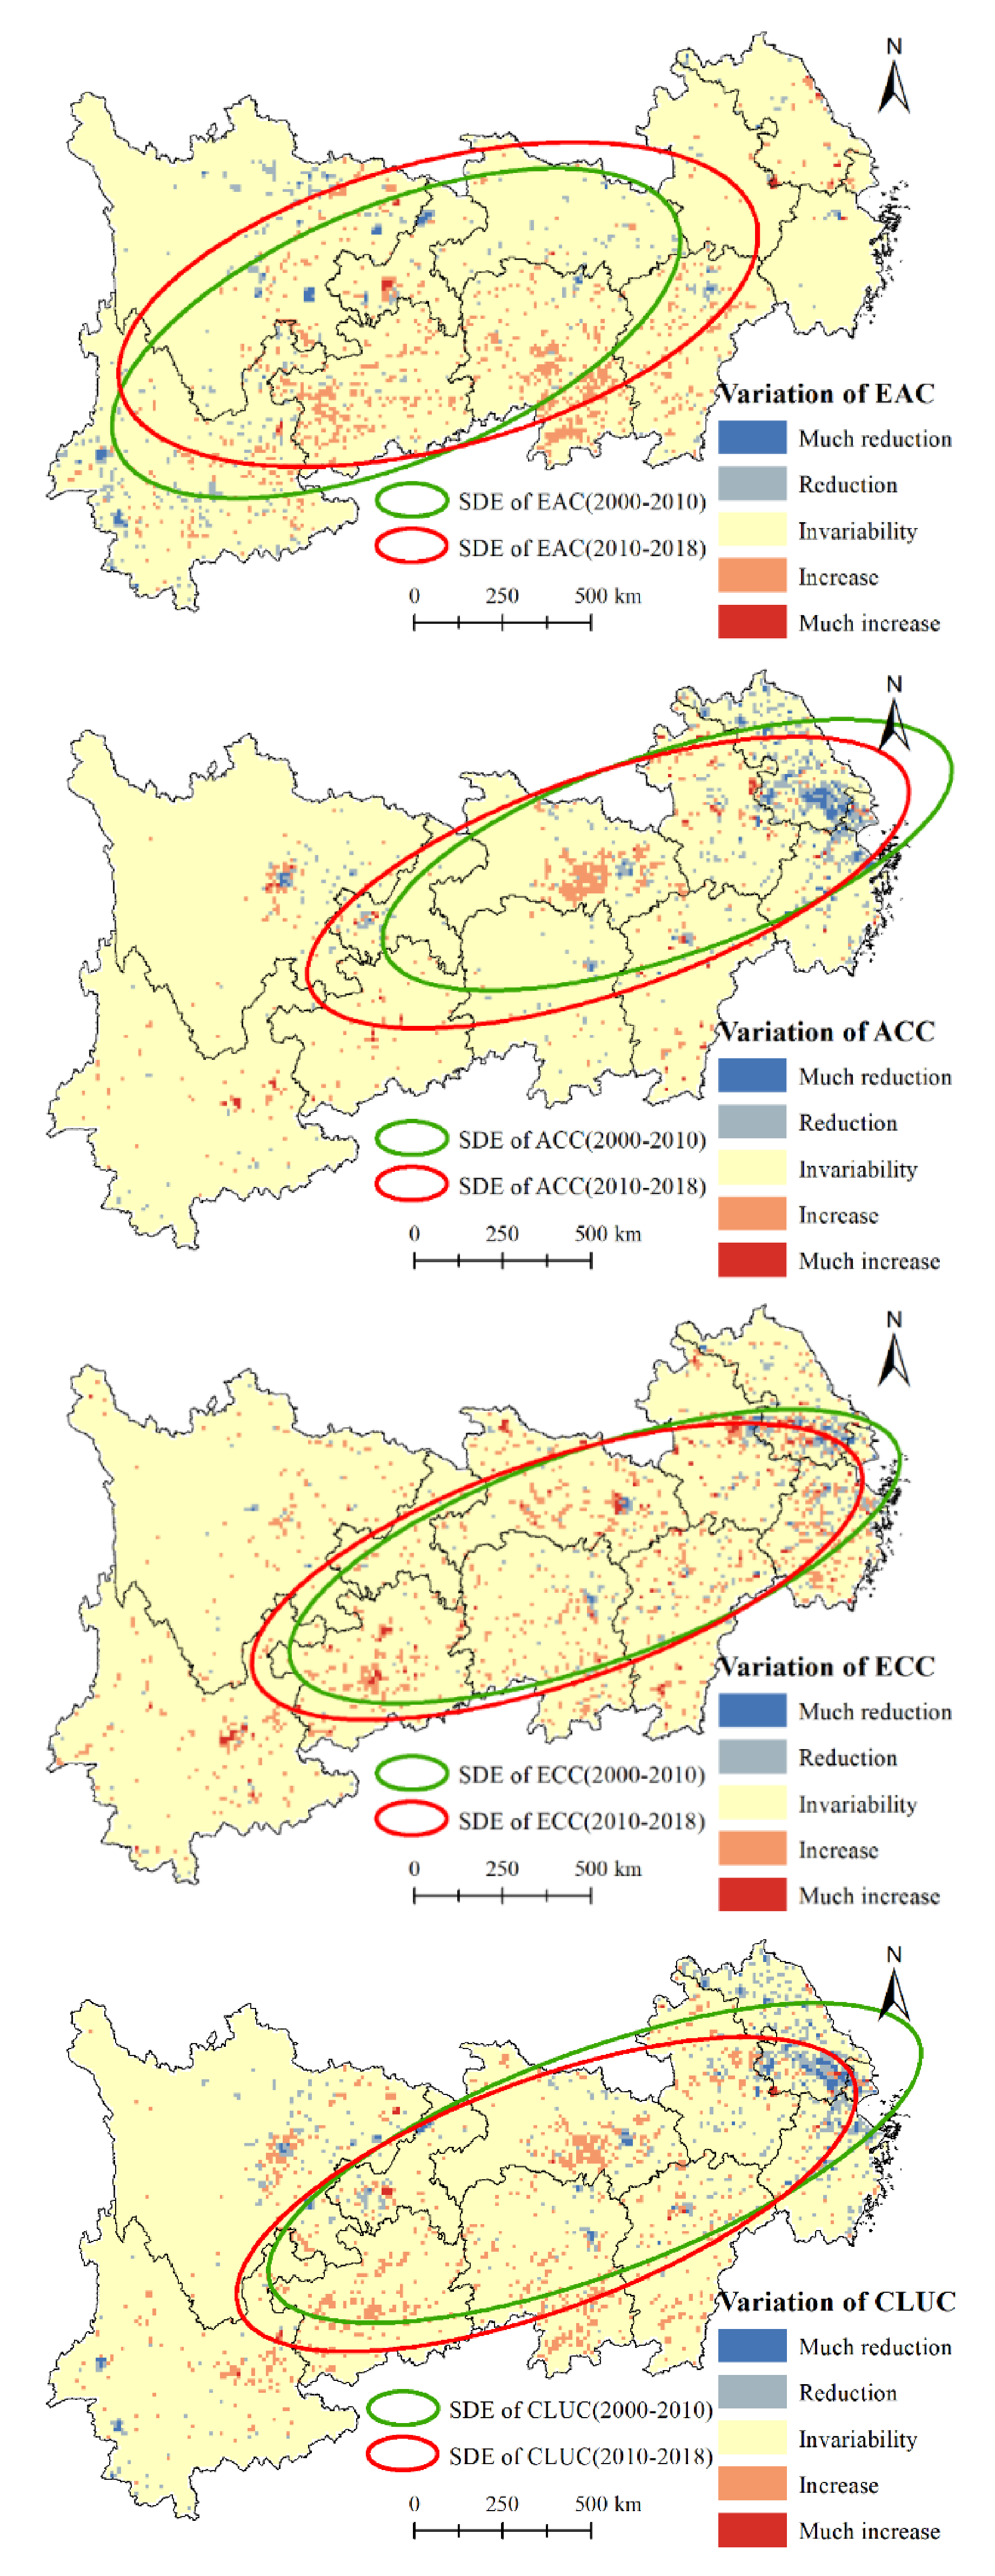
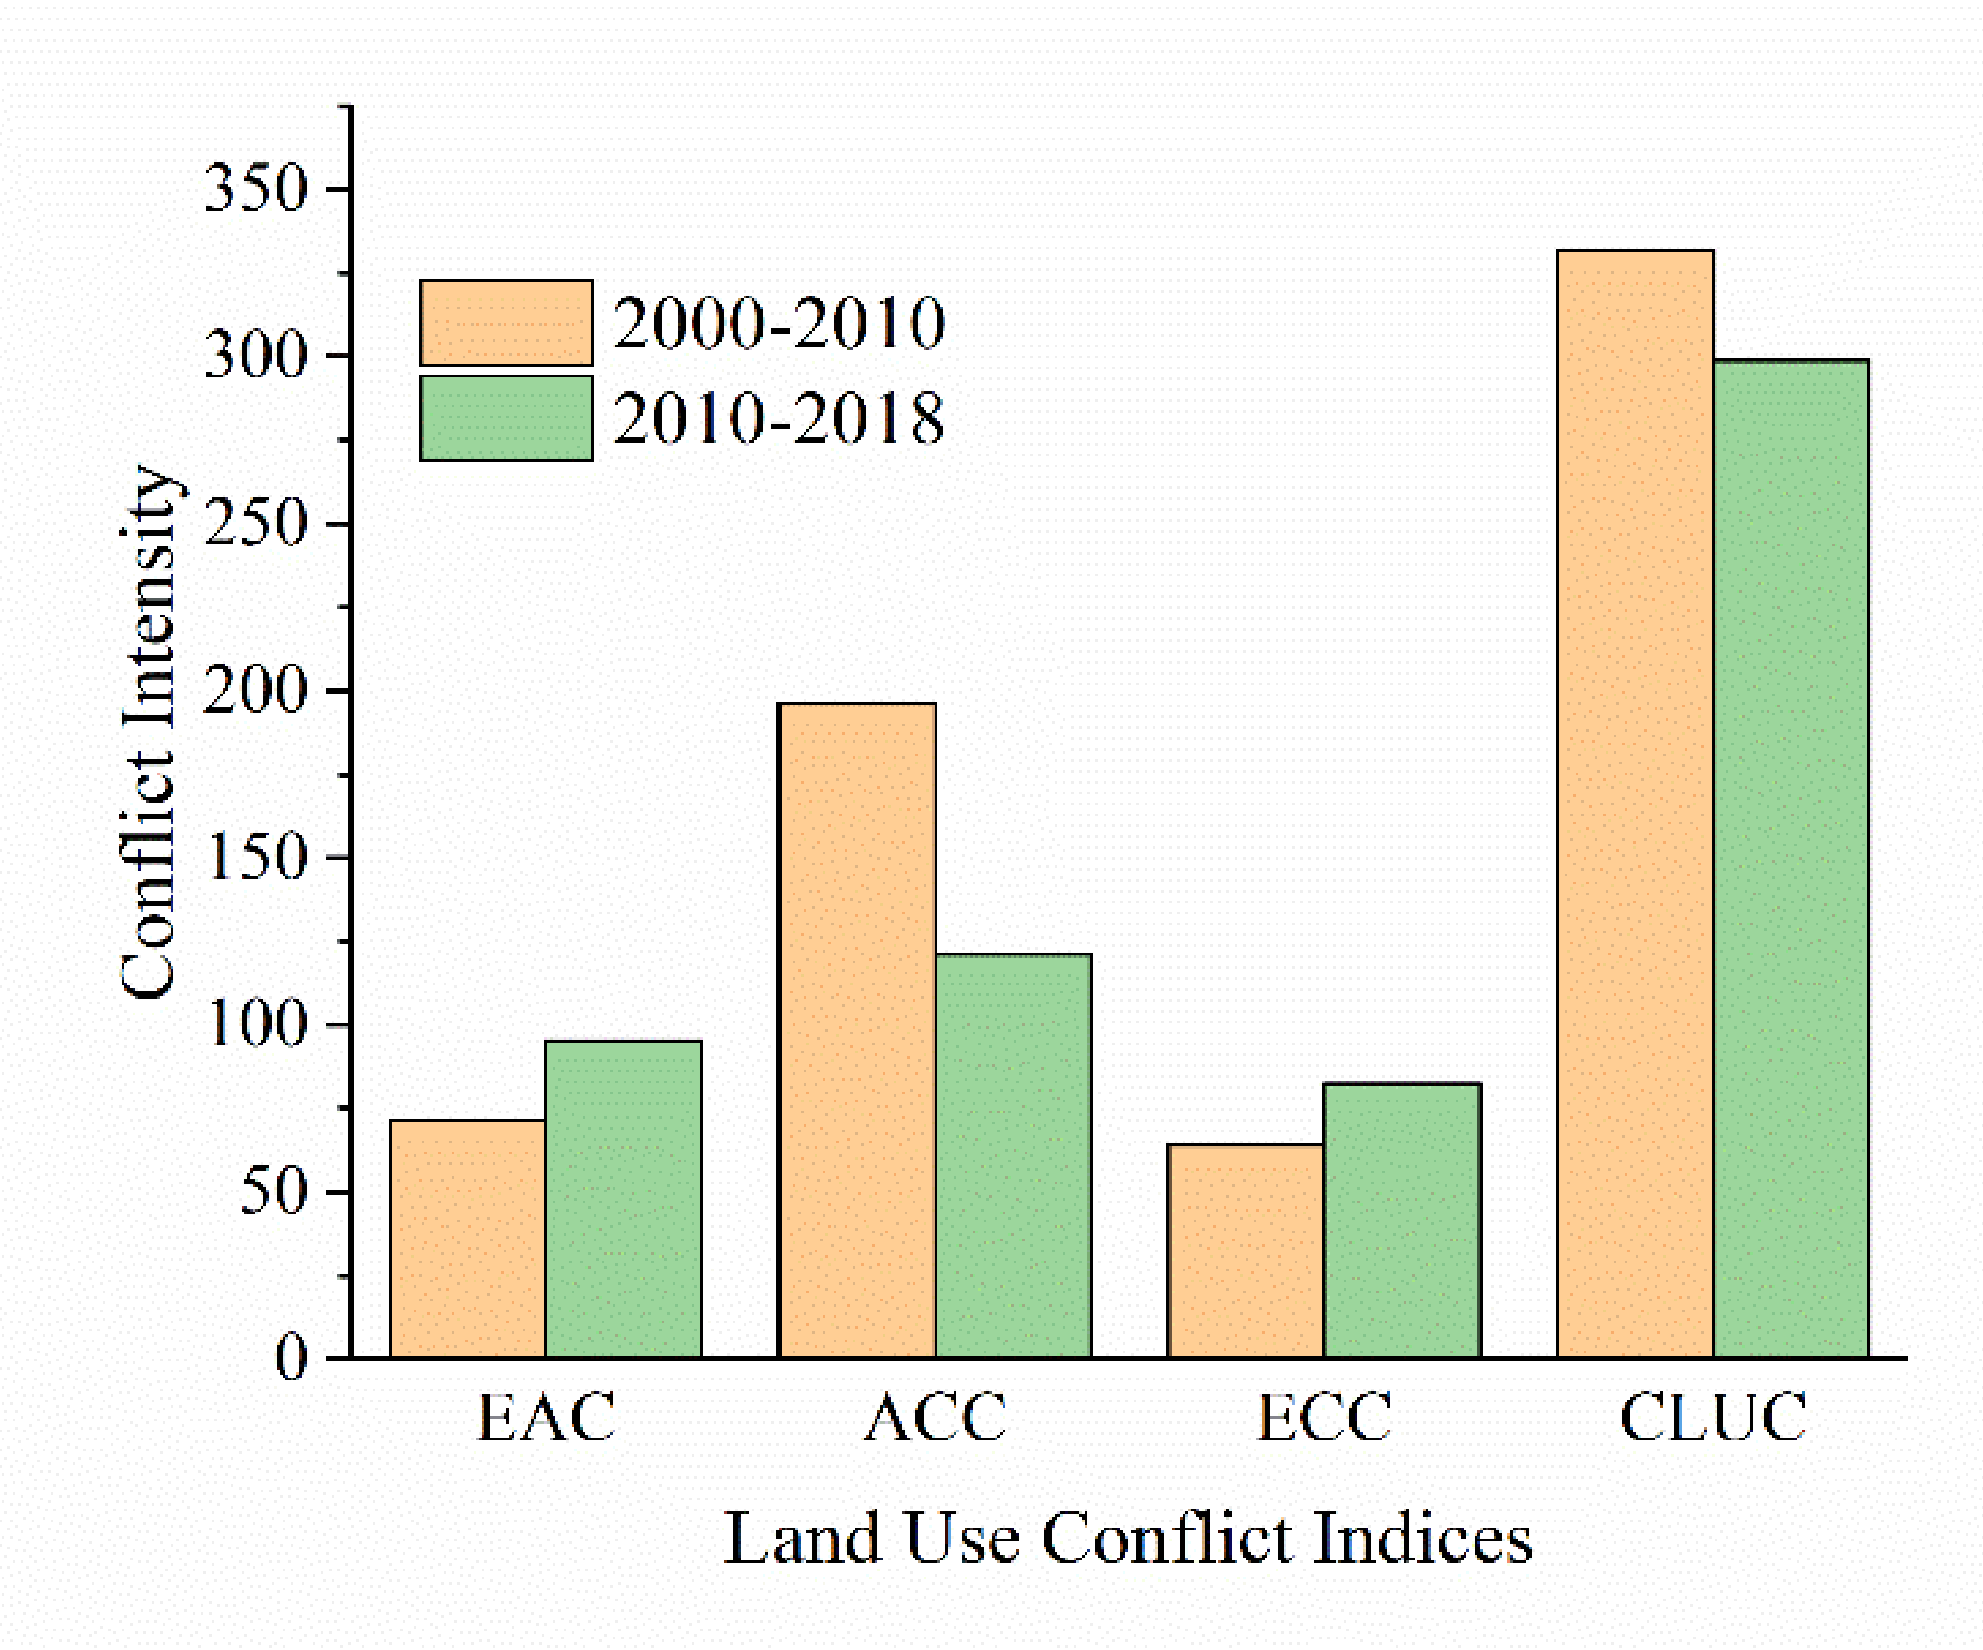
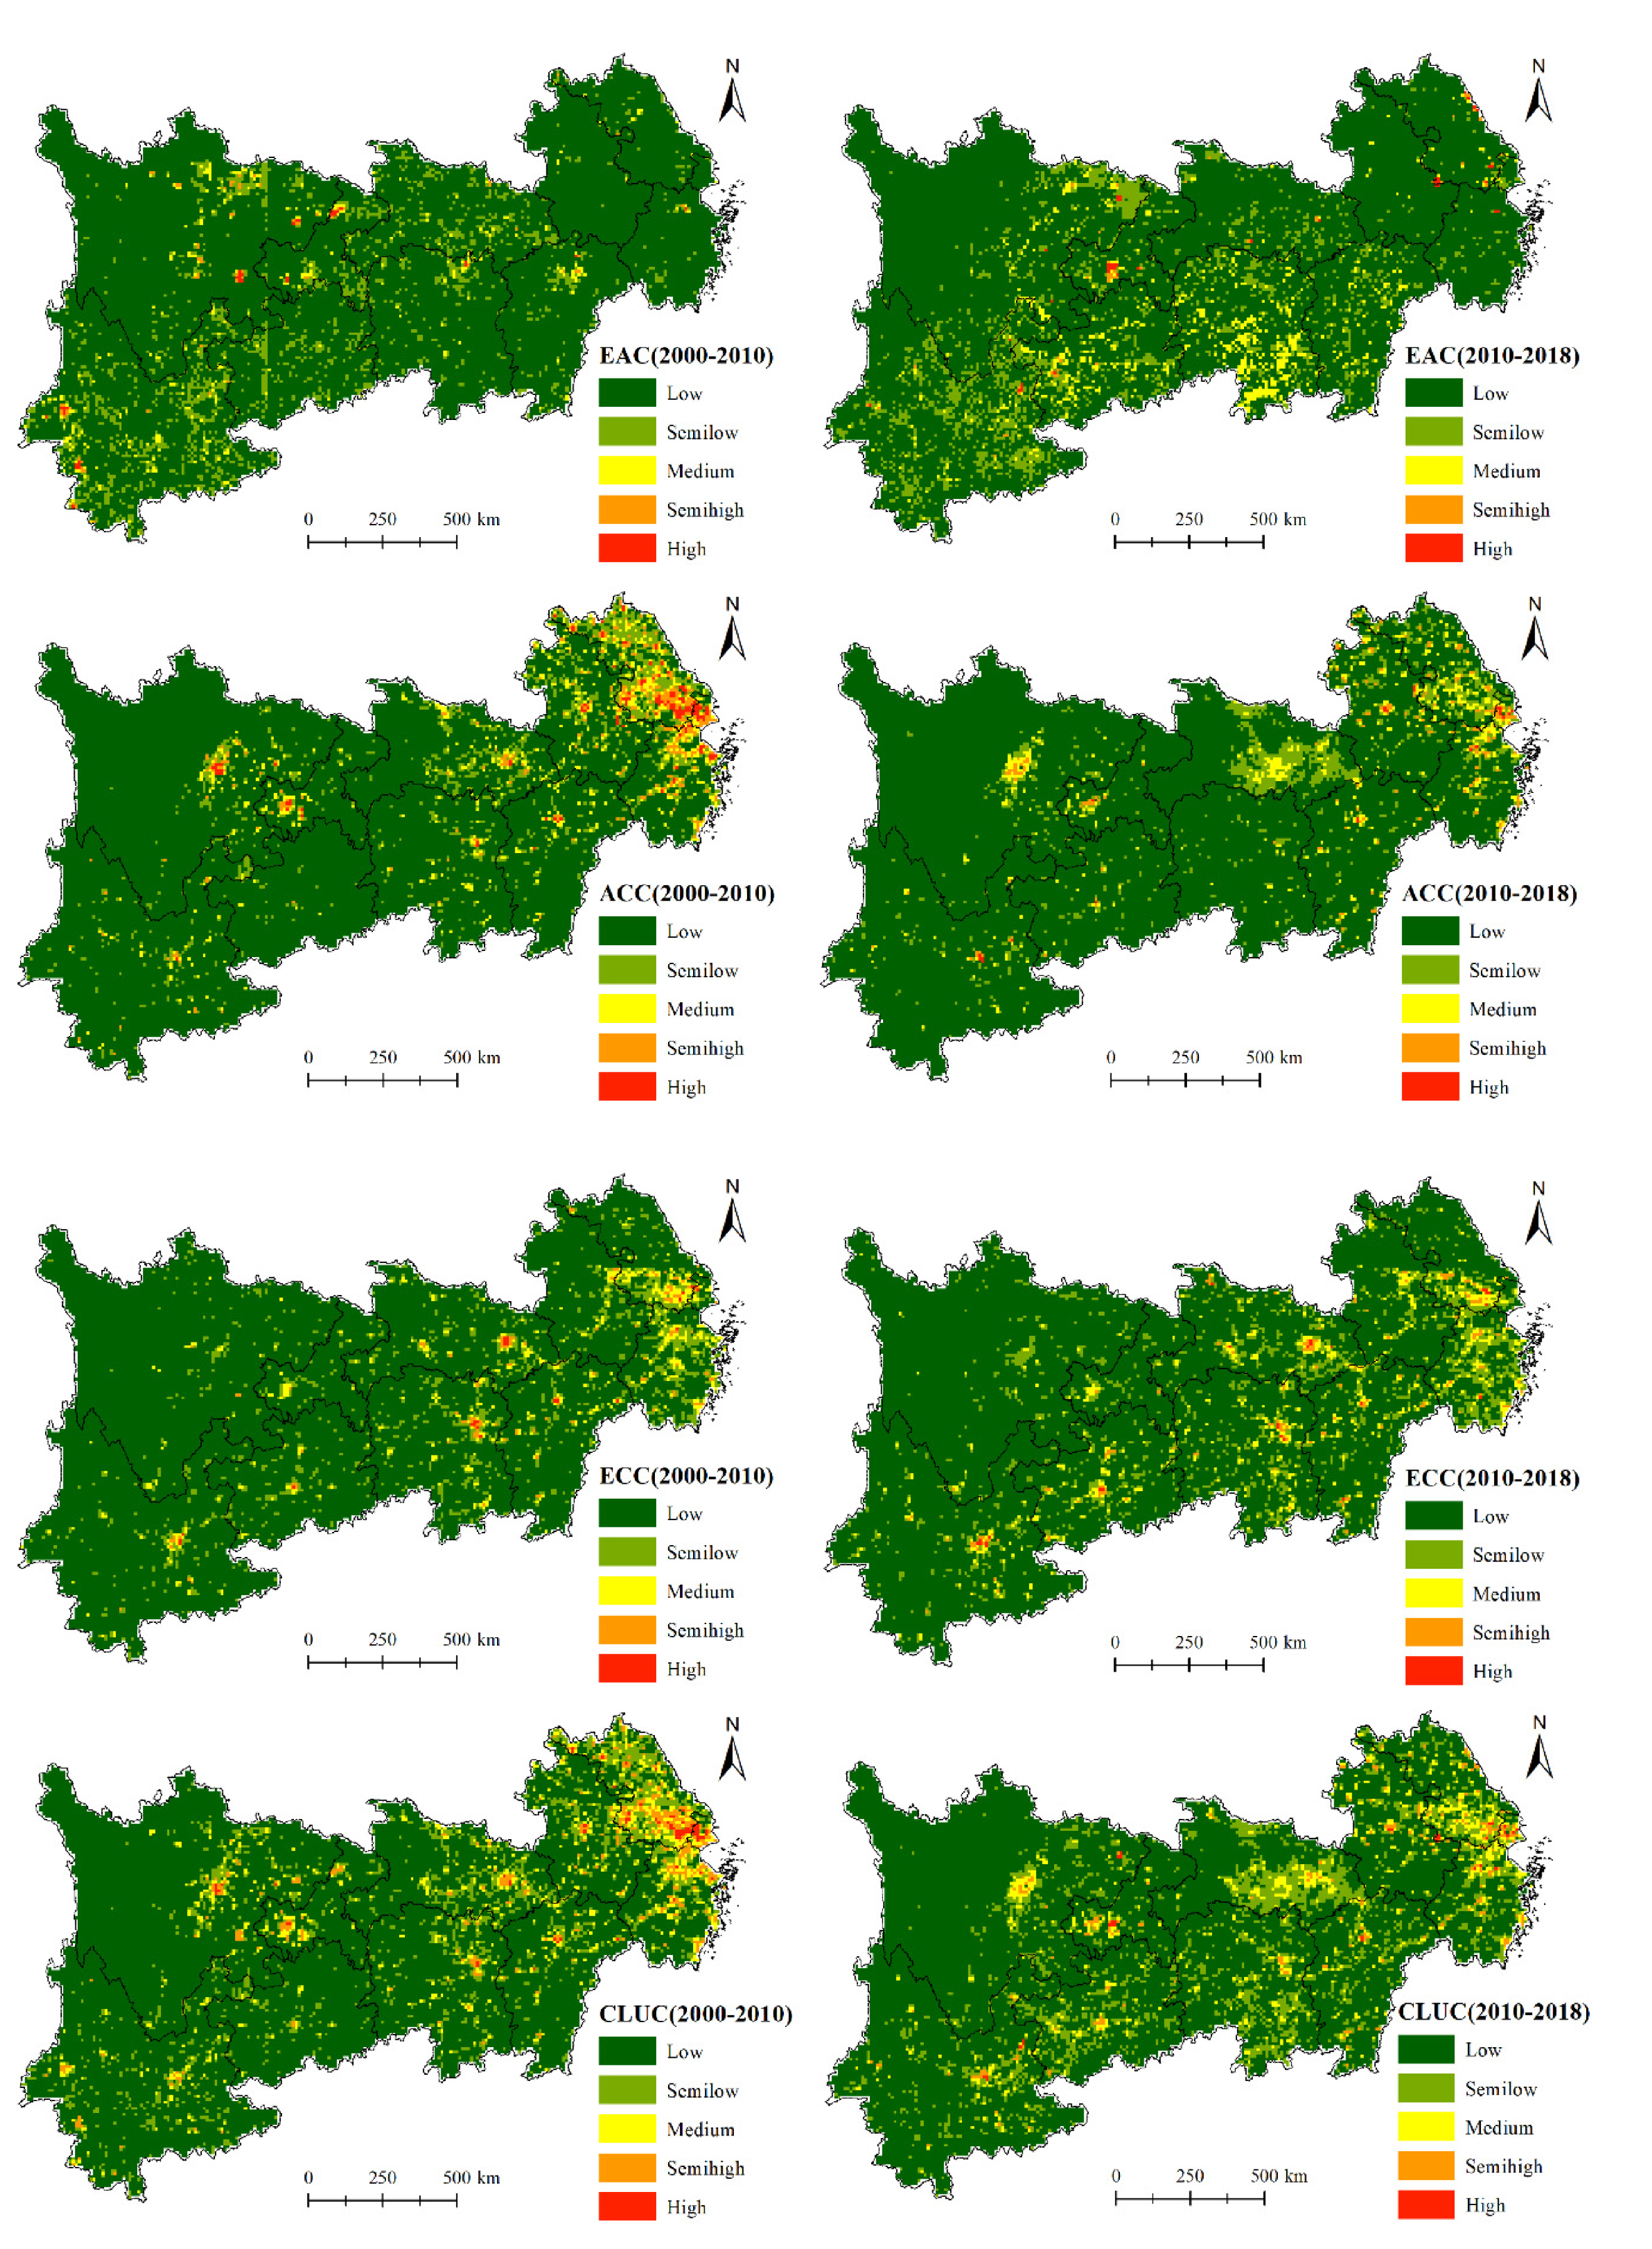
Land use conflict is an important problem in land use transitions and territorial space development. This article proposed a new framework to evaluate the land use conflict spatially and explicitly from the three aspects of EAC, ACC, and ECC. This article then examined dynamic changes of land use conflict and performed Pearson correlation versus step-wise linear regression to determine factors that influence land use conflict during 2000–2018 in YREB, which is an important economic belt in China. The period of 2010–2018 demonstrated slightly lower compressive land use conflict than the period of 2000–2010. However, considerable differences exist in various conflict types. ACC reduced remarkably by 38.26%, while EAC and ECC showed a slowly increasing trend. The spatiotemporal dynamic pattern of each conflict indicator exhibits unique features. Higher and high values of the EAC were relatively decentralized and mainly spread out over middle and western inland regions. The period of 2010–2018 demonstrated higher intensity of EAC, with its center shifting to the east, compared with the period of 2000–2010. Areas with higher and high values of ACC are concentrated around three urban agglomerations, with YRD exhibiting the highest intensity. Compared with the period of 2000–2010, ACC evidently reduced and shifted to the west during 2010–2018. The ECC trend was evidently high in the east and low in the west. Compared with the period of 2000–2010, the overall ECC trend increased both in size and distribution and transferred to the west during 2010–2018. CLUC was mainly concentrated in central cities in middle and western inland regions and widespread in YRD. The overall CLUC transferred from east to west. Variables from three aspects of demographic, economic, and life factors significantly affected land use conflict. Policies, such as improvement of the territorial space planning system and promotion of comprehensive land adjustment, were put forward to adjust land use conflict.
This work has the following limitations. The land use conflict only considers transitions of land use categories but ignores the landscape change of the region. In addition, the driving factor analysis includes incompetence socioeconomic factors due to the data limitation. The exploration of the spatiotemporal dynamic pattern of land use conflict is a significant piece of work which can enhance the understanding of the dynamics of land use transitions and reveal the problems of agricultural land shrinking and environmental and ecological degradation during rapid urbanization and industrialization. Therefore, it is important to constantly monitor the land use conflict to identify the state of regional territorial space development and constantly adjust governance measures. The evaluation approach of land use conflict needs further improvement to provide deeper insight and more details of the analysis results. Future studies can focus on improving the analysis framework of land use conflict and further explore additional driving factors.

Author Contributions

Conceptualization, J.C. (Jiaxing Cui); methodology, Y.Z.; software, J.S.; validation, Y.Z.; formal analysis, J.C. (Jiaxing Cui); investigation, J.S.; resources, J.C. (Jing Chen); data curation, J.C. (Jing Chen.); writing—original draft preparation, J.C. (Jiaxing Cui); writing—review and editing, Y.Z.; visualization, X.K.; supervision, X.K.; project administration, J.C. (Jiaxing Cui); funding acquisition, J.C. (Jiaxing Cui). All authors have read and agreed to the published version of the manuscript.

Funding

This research was funded by the National Natural Science Foundation of China, grant number 41901201 and 41961031, and the Fundamental Research Funds for the Central Universities, grant number CCNU20QN034.

Institutional Review Board Statement

Not applicable.

Informed Consent Statement

Not applicable.

Data Availability Statement

Publicly available datasets were analyzed in this study. Land use data can be found here: [http://www.resdc.cn/]. Soil quality data can be found here: [http://westdc.westgis.ac.cn/zh-hans]. Nighttime lighting data can be found here: [http://www.geodata.cn/]. The basic geographic information base map can be found here: [http://bzdt.ch.mnr.gov.cn/index.html. Digital elevation model data can be found here: [http://www.webmap.cn/main.do?method=index].

Acknowledgments

We are grateful to Ruihao Li, Qiuxia Li, Shenyang Li, Zhe Li, Yating Ma, Ran Sun, Xinyi Dai, Zixuan Dai, and Huajie Luo for their help in part of the data processing.

Conflicts of Interest

The authors declare no conflict of interest.

References

  1. Crutzen, P.J. Geology of mankind. Nature 2002, 415, 23. [Google Scholar] [CrossRef]
  2. Thomson, G.; Newman, P. Cities and the Anthropocene: Urban governance for the new era of regenerative cities. Urban Stud. 2020, 57, 1502–1519. [Google Scholar] [CrossRef]
  3. Trischler, H. The Anthropocene: A Challenge for the History of Science, Technology, and the Environment. NTM 2016, 24, 309–335. [Google Scholar] [CrossRef] [PubMed] [Green Version]
  4. Grimm, N.B.; Faeth, S.H.; Golubiewski, N.E.; Redman, C.L.; Wu, J.; Bai, X.; Briggs, J.M. Global change and the ecology of cities. Science 2008, 319, 756–760. [Google Scholar] [CrossRef] [Green Version]
  5. Tu, Y.; Chen, B.; Yu, L.; Xin, Q.; Gong, P.; Xu, B. How does urban expansion interact with cropland loss? A comparison of 14 Chinese cities from 1980 to 2015. Landsc. Ecol. 2020. [Google Scholar] [CrossRef]
  6. Curtis, P.G.; Slay, C.M.; Harris, N.L.; Tyukavina, A.; Hansen, M.C. Classifying drivers of global forest loss. Science 2018, 361, 1108–1111. [Google Scholar] [CrossRef]
  7. Zhang, W.; Villarini, G.; Vecchi, G.A.; Smith, J.A. Urbanization exacerbated the rainfall and flooding caused by hurricane Harvey in Houston. Nature 2018, 563, 384–388. [Google Scholar] [CrossRef]
  8. Pielke, R.A. Land Use and Climate Change. Science 2005, 310, 1625. [Google Scholar] [CrossRef] [Green Version]
  9. Jianchu, X.; Fox, J.; Vogler, J.B.; Yongshou, Z.P.; Lixin, Y.; Jie, Q.; Leisz, S. Land-use and land-cover change and farmer vulnerability in Xishuangbanna prefecture in southwestern China. Environ. Manag. 2005, 36, 404–413. [Google Scholar] [CrossRef]
  10. McNeeley, S.M.; Even, T.L.; Gioia, J.B.M.; Knapp, C.N.; Beeton, T.A. Expanding vulnerability assessment for public lands: The social complement to ecological approaches. Clim. Risk Manag. 2017, 16, 106–119. [Google Scholar] [CrossRef]
  11. Lioubimtseva, E. A multi-scale assessment of human vulnerability to climate change in the Aral Sea basin. Environ. Earth Sci. 2014, 73, 719–729. [Google Scholar] [CrossRef]
  12. Huang, X.; Huang, X.; He, Y.; Yang, X. Assessment of livelihood vulnerability of land-lost farmers in urban fringes: A case study of Xi’an, China. Habitat Int. 2017, 59, 1–9. [Google Scholar] [CrossRef]
  13. Liu, Y.; Fang, F.; Li, Y. Key issues of land use in China and implications for policy making. Land Use Policy 2014, 40, 6–12. [Google Scholar] [CrossRef]
  14. Qu, Y.; Long, H. The economic and environmental effects of land use transitions under rapid urbanization and the implications for land use management. Habitat Int. 2018, 82, 113–121. [Google Scholar] [CrossRef]
  15. Liang, X.; Jin, X.; Ren, J.; Gu, Z.; Zhou, Y. A research framework of land use transition in Suzhou City coupled with land use structure and landscape multifunctionality. Sci. Total Environ. 2020, 737, 139932. [Google Scholar] [CrossRef]
  16. Long, H.; Qu, Y. Land use transitions and land management: A mutual feedback perspective. Land Use Policy 2018, 74, 111–120. [Google Scholar] [CrossRef]
  17. Wang, J.; Li, Y.; Wang, Q.; Cheong, K.C. Urban–Rural Construction Land Replacement for More Sustainable Land Use and Regional Development in China: Policies and Practices. Land 2019, 8, 171. [Google Scholar] [CrossRef] [Green Version]
  18. Huang, L.; Hu, S.; Li, S.; Fu, Z. Nonmarketization Bargaining and Actual Compensation Level for Land Requisition: A Qualitative Comparative Analysis of China’s Land Requisition Conflict Events. Sustainability 2019, 11, 6084. [Google Scholar] [CrossRef] [Green Version]
  19. Ma, W.; Jiang, G.; Chen, Y.; Qu, Y.; Zhou, T.; Li, W. How feasible is regional integration for reconciling land use conflicts across the urban–rural interface? Evidence from Beijing–Tianjin–Hebei metropolitan region in China. Land Use Policy 2020, 92, 104433. [Google Scholar] [CrossRef]
  20. Wu, Y.; Heerink, N. Foreign direct investment, fiscal decentralization and land conflicts in China. China Econ. Rev. 2016, 38, 92–107. [Google Scholar] [CrossRef]
  21. Zhou, D.; Lin, Z.; Lim, S.H. Spatial characteristics and risk factor identification for land use spatial conflicts in a rapid urbanization region in China. Environ. Monit. Assess. 2019, 191, 677. [Google Scholar] [CrossRef] [PubMed]
  22. Liu, Z.; Liu, Y.; Baig, M.H.A. Biophysical effect of conversion from croplands to grasslands in water-limited temperate regions of China. Sci. Total Environ. 2019, 648, 315–324. [Google Scholar] [CrossRef] [PubMed]
  23. Bergius, M.; Benjaminsen, T.A.; Maganga, F.; Buhaug, H. Green economy, degradation narratives, and land-use conflicts in Tanzania. World Dev. 2020, 129, 104850. [Google Scholar] [CrossRef]
  24. Pacheco, F.A.L.; Varandas, S.G.P.; Sanches Fernandes, L.F.; Valle Junior, R.F. Soil losses in rural watersheds with environmental land use conflicts. Sci. Total Environ. 2014, 485–486, 110–120. [Google Scholar] [CrossRef]
  25. Valle Junior, R.F.; Varandas, S.G.; Sanches Fernandes, L.F.; Pacheco, F.A. Groundwater quality in rural watersheds with environmental land use conflicts. Sci. Total Environ. 2014, 493, 812–827. [Google Scholar] [CrossRef]
  26. Moore, S.A.; Brown, G.; Kobryn, H.; Strickland-Munro, J. Identifying conflict potential in a coastal and marine environment using participatory mapping. J. Environ. Manag. 2017, 197, 706–718. [Google Scholar] [CrossRef] [Green Version]
  27. Kim, I.; Arnhold, S. Mapping environmental land use conflict potentials and ecosystem services in agricultural watersheds. Sci. Total Environ. 2018, 630, 827–838. [Google Scholar] [CrossRef]
  28. Helwege, A. Challenges with resolving mining conflicts in Latin America. Extr. Ind. Soc. 2015, 2, 73–84. [Google Scholar] [CrossRef]
  29. Helbron, H.; Schmidt, M.; Glasson, J.; Downes, N. Indicators for strategic environmental assessment in regional land use planning to assess conflicts with adaptation to global climate change. Ecol. Indic. 2011, 11, 90–95. [Google Scholar] [CrossRef]
  30. Chen, S.; Yi, Z.-F.; Campos-Arceiz, A.; Chen, M.-Y.; Webb, E.L. Developing a spatially-explicit, sustainable and risk-based insurance scheme to mitigate human–wildlife conflict. Biol. Conserv. 2013, 168, 31–39. [Google Scholar] [CrossRef]
  31. He, Y.; Tang, C.; Zhou, G.; He, S. The Analysis of Spatial Conflict Measurement in Fast Urbanization Region from the Perspective of Geography——A Case Study of Changsha-Zhuzhou-Xiangtan Urban Agglomeration. J. Nat. Resour. 2014, 29, 1660–1674. [Google Scholar]
  32. Zou, L.; Liu, Y.; Wang, J.; Yang, Y.; Wang, Y. Land use conflict identification and sustainable development scenario simulation on China’s southeast coast. J. Clean. Prod. 2019, 238, 117899. [Google Scholar] [CrossRef]
  33. Iojă, C.I.; Niţă, M.R.; Vânău, G.O.; Onose, D.A.; Gavrilidis, A.A. Using multi-criteria analysis for the identification of spatial land-use conflicts in the Bucharest Metropolitan Area. Ecol. Indic. 2014, 42, 112–121. [Google Scholar] [CrossRef]
  34. You, H.; Yang, X. Urban expansion in 30 megacities of China: Categorizing the driving force profiles to inform the urbanization policy. Land Use Policy 2017, 68, 531–551. [Google Scholar] [CrossRef]
  35. Long, H.; Qu, Y.; Tu, S.; Zhang, Y.; Jiang, Y. Development of land use transitions research in China. J. Geogr. Sci. 2020, 30, 1195–1214. [Google Scholar] [CrossRef]
  36. Xu, Y.; McNamara, P.; Wu, Y.; Dong, Y. An econometric analysis of changes in arable land utilization using multinomial logit model in Pinggu district, Beijing, China. J. Environ. Manag. 2013, 128, 324–334. [Google Scholar] [CrossRef] [PubMed]
  37. Feng, Y.; Liu, Y.; Tong, X. Spatiotemporal variation of landscape patterns and their spatial determinants in Shanghai, China. Ecol. Indic. 2018, 87, 22–32. [Google Scholar] [CrossRef]
  38. Liu, Y.; Peng, J.; Zhang, T.; Zhao, M. Assessing landscape eco-risk associated with hilly construction land exploitation in the southwest of China: Trade-off and adaptation. Ecol. Indic. 2016, 62, 289–297. [Google Scholar] [CrossRef]
  39. Li, Y.; Sun, X.; Zhu, X.; Cao, H. An early warning method of landscape ecological security in rapid urbanizing coastal areas and its application in Xiamen, China. Ecol. Model. 2010, 221, 2251–2260. [Google Scholar] [CrossRef]
  40. Wang, D.; Jiang, D.; Fu, J.; Lin, G.; Zhang, J. Comprehensive Assessment of Production–Living–Ecological Space Based on the Coupling Coordination Degree Model. Sustainability 2020, 12, 2009. [Google Scholar] [CrossRef] [Green Version]
  41. Lin, G.; Jiang, D.; Fu, J.; Cao, C.; Zhang, D. Spatial Conflict of Production–Living–Ecological Space and Sustainable-Development Scenario Simulation in Yangtze River Delta Agglomerations. Sustainability 2020, 12, 2175. [Google Scholar] [CrossRef] [Green Version]
  42. Jin, G.; Deng, X.; Zhao, X.; Guo, B.; Yang, J. Spatiotemporal patterns in urbanization efficiency within the Yangtze River Economic Belt between 2005 and 2014. J. Geogr. Sci. 2018, 28, 1113–1126. [Google Scholar] [CrossRef] [Green Version]
  43. Ma, Q.; He, C.; Wu, J. Behind the rapid expansion of urban impervious surfaces in China: Major influencing factors revealed by a hierarchical multiscale analysis. Land Use Policy 2016, 59, 434–445. [Google Scholar] [CrossRef]
  44. Mantas, V.M.; Marques, J.C.; Pereira, A.J.S.C. A geospatial approach to monitoring impervious surfaces in watersheds using Landsat data (the Mondego Basin, Portugal as a case study). Ecol. Indic. 2016, 71, 449–466. [Google Scholar] [CrossRef]
  45. Tong, L.; Hu, S.; Frazier, A.E. Hierarchically measuring urban expansion in fast urbanizing regions using multi-dimensional metrics: A case of Wuhan metropolis, China. Habitat Int. 2019, 94, 102070. [Google Scholar] [CrossRef]
  46. Huang, X.; Xia, J.; Xiao, R.; He, T. Urban expansion patterns of 291 Chinese cities, 1990–2015. Int. J. Digit. Earth 2017, 12, 62–77. [Google Scholar] [CrossRef]
  47. Mitsova, D. Coupling Land Use Change Modeling with Climate Projections to Estimate Seasonal Variability in Runoff from an Urbanizing Catchment Near Cincinnati, Ohio. ISPRS Int. J. Geo-Inf. 2014, 3, 1256–1277. [Google Scholar] [CrossRef] [Green Version]
  48. Du, N.; Ottens, H.; Sliuzas, R. Spatial impact of urban expansion on surface water bodies—A case study of Wuhan, China. Landsc. Urban Plan. 2010, 94, 175–185. [Google Scholar] [CrossRef]
  49. Yao, X.; Christensen, M.J.; Bao, G.; Zhang, C.; Li, X.; Li, C.; Nan, Z. A toxic endophyte-infected grass helps reverse degradation and loss of biodiversity of over-grazed grasslands in northwest China. Sci. Rep. 2015, 5, 18527. [Google Scholar] [CrossRef]
  50. Montanari, A.; Londei, A.; Staniscia, B. Can we interpret the evolution of coastal land use conflicts? Using Artificial Neural Networks to model the effects of alternative development policies. Ocean Coast. Manag. 2014, 101, 114–122. [Google Scholar] [CrossRef]
  51. Valle Junior, R.F.; Varandas, S.G.P.; Sanches Fernandes, L.F.; Pacheco, F.A.L. Environmental land use conflicts: A threat to soil conservation. Land Use Policy 2014, 41, 172–185. [Google Scholar] [CrossRef]
  52. Liu, J.; Kuang, W.; Zhang, Z.; Xu, X.; Qin, Y.; Ning, J.; Zhou, W.; Zhang, S.; Li, R.; Yan, C.; et al. Spatiotemporal characteristics, patterns, and causes of land-use changes in China since the late 1980s. J. Geogr. Sci. 2014, 24, 195–210. [Google Scholar] [CrossRef]
  53. Liu, J.; Liu, M.; Tian, H.; Zhuang, D.; Zhang, Z.; Zhang, W.; Tang, X.; Deng, X. Spatial and temporal patterns of China’s cropland during 1990–2000: An analysis based on Landsat TM data. Remote Sens. Environ. 2005, 98, 442–456. [Google Scholar] [CrossRef]
  54. Li, D.; Xu, E.; Zhang, H. Influence of ecological land change on wind erosion prevention service in arid area of northwest China from 1990 to 2015. Ecol. Indic. 2020, 117, 106686. [Google Scholar] [CrossRef]
  55. Ning, J.; Liu, J.; Zhao, G. Spatio-temporal characteristics of disturbance of land use change on major ecosystem function zones in China. Chin. Geogr. Sci. 2015, 25, 523–536. [Google Scholar] [CrossRef]
  56. Zhong, Y.; Lin, A.; He, L.; Zhou, Z.; Yuan, M. Spatiotemporal Dynamics and Driving Forces of Urban Land-Use Expansion: A Case Study of the Yangtze River Economic Belt, China. Remote Sens. 2020, 12, 287. [Google Scholar] [CrossRef] [Green Version]
  57. Wang, H.; Meng, X. Siol Map Based Harmonized World Soil Database (v1.2); National Tibetan Plateau Data Center, Institute of Tibetan Plateau Research: Beijing, China, 2018. [Google Scholar]
  58. Wieder, W. Regridded Harmonized World Soil Database v1.2; ORNL Distributed Active Archive Center: Oak Ridge, TN, USA, 2014. [Google Scholar]
  59. Fischer, G.; Nachtergaele, F.; Prieler, S.; van Velthuizen, H.T.; Verelst, L.; Wiberg, D. Global Agro-Ecological Zones Assessment for Agriculture (GAEZ 2008); IIASA: Laxenburg, Austria; FAO: Rome, Italy, 2008. [Google Scholar]
  60. Shen, Y.; Xiong, A. Validation and comparison of a new gauge-based precipitation analysis over mainland China. Int. J. Climatol. 2016, 36, 252–265. [Google Scholar] [CrossRef]
  61. Zhang, Y.; Long, H.; Tu, S.; Ge, D.; Ma, L.; Wang, L. Spatial identification of land use functions and their tradeoffs/synergies in China: Implications for sustainable land management. Ecol. Indic. 2019, 107, 105550. [Google Scholar] [CrossRef]
  62. Liao, G.; He, P.; Gao, X.; Deng, L.; Zhang, H.; Feng, N.; Zhou, W.; Deng, O. The Production–Living–Ecological Land Classification System and Its Characteristics in the Hilly Area of Sichuan Province, Southwest China Based on Identification of the Main Functions. Sustainability 2019, 11, 1600. [Google Scholar] [CrossRef] [Green Version]
  63. Zhao, X.; Li, S.; Pu, J.; Miao, P.; Wang, Q.; Tan, K. Optimization of the National Land Space Based on the Coordination of Urban-Agricultural-Ecological Functions in the Karst Areas of Southwest China. Sustainability 2019, 11, 6752. [Google Scholar] [CrossRef] [Green Version]
  64. Gao, L.; Ma, C.; Wang, Q.; Zhou, A. Sustainable use zoning of land resources considering ecological and geological problems in Pearl River Delta Economic Zone, China. Sci. Rep. 2019, 9, 16052. [Google Scholar] [CrossRef] [Green Version]
  65. Yin, C.; Kong, X.; Liu, Y.; Wang, J.; Wang, Z. Spatiotemporal changes in ecologically functional land in China: A quantity-quality coupled perspective. J. Clean. Prod. 2019, 238, 117917. [Google Scholar] [CrossRef]
  66. Long, H.; Liu, Y.; Hou, X.; Li, T.; Li, Y. Effects of land use transitions due to rapid urbanization on ecosystem services: Implications for urban planning in the new developing area of China. Habitat Int. 2014, 44, 536–544. [Google Scholar] [CrossRef]
  67. Chi, Y.; Shi, H.; Zheng, W.; Sun, J.; Fu, Z. Spatiotemporal characteristics and ecological effects of the human interference index of the Yellow River Delta in the last 30 years. Ecol. Indic. 2018, 89, 880–892. [Google Scholar] [CrossRef]
  68. Valera, C.A.; Valle Junior, R.F.; Varandas, S.G.P.; Sanches Fernandes, L.F.; Pacheco, F.A.L. The role of environmental land use conflicts in soil fertility: A study on the Uberaba River basin, Brazil. Sci. Total Environ. 2016, 562, 463–473. [Google Scholar] [CrossRef]
  69. Li, T.; Long, H.; Zhang, Y.; Tu, S.; Ge, D.; Li, Y.; Hu, B. Analysis of the spatial mismatch of grain production and farmland resources in China based on the potential crop rotation system. Land Use Policy 2017, 60, 26–36. [Google Scholar] [CrossRef]
  70. Ge, D.; Long, H.; Zhang, Y.; Ma, L.; Li, T. Farmland transition and its influences on grain production in China. Land Use Policy 2018, 70, 94–105. [Google Scholar] [CrossRef]
  71. Yang, J.; Yang, J.; Luo, X.; Huang, C. Impacts by expansion of human settlements on nature reserves in China. J. Environ. Manag. 2019, 248, 109233. [Google Scholar] [CrossRef] [PubMed]
  72. Nguyen, T.T.; Verdoodt, A.; Van, Y.T.; Delbecque, N.; Tran, T.C.; Van Ranst, E. Design of a GIS and multi-criteria based land evaluation procedure for sustainable land-use planning at the regional level. Agric. Ecosyst. Environ. 2015, 200, 1–11. [Google Scholar] [CrossRef]
  73. Li, J.; Jiang, H.; Bai, Y.; Alatalo, J.M.; Li, X.; Jiang, H.; Liu, G.; Xu, J. Indicators for spatial–temporal comparisons of ecosystem service status between regions: A case study of the Taihu River Basin, China. Ecol. Indic. 2016, 60, 1008–1016. [Google Scholar] [CrossRef]
  74. Deng, X.; Zhao, C.; Yan, H. Systematic Modeling of Impacts of Land Use and Land Cover Changes on Regional Climate: A Review. Adv. Meteorol. 2013, 2013, 1–11. [Google Scholar] [CrossRef]
  75. Kuang, W.; Liu, J.; Dong, J.; Chi, W.; Zhang, C. The rapid and massive urban and industrial land expansions in China between 1990 and 2010: A CLUD-based analysis of their trajectories, patterns, and drivers. Landsc. Urban Plan. 2016, 145, 21–33. [Google Scholar] [CrossRef]
  76. Viglia, S.; Civitillo, D.F.; Cacciapuoti, G.; Ulgiati, S. Indicators of environmental loading and sustainability of urban systems. An emergy-based environmental footprint. Ecol. Indic. 2018, 94, 82–99. [Google Scholar] [CrossRef]
  77. Jackson, C.R.; Bahn, R.A.; Webster, J.R. Water Quality Signals from Rural Land Use and Exurbanization in a Mountain Landscape: What’s Clear and What’s Confounded? JAWRA J. Am. Water Resour. Assoc. 2017, 53, 1212–1228. [Google Scholar] [CrossRef]
  78. Chen, K.; Wang, X.; Li, D.; Li, Z. Driving force of the morphological change of the urban lake ecosystem: A case study of Wuhan, 1990–2013. Ecol. Model. 2015, 318, 204–209. [Google Scholar] [CrossRef]
  79. Feng, Y.; Yang, Q.; Tong, X.; Chen, L. Evaluating land ecological security and examining its relationships with driving factors using GIS and generalized additive model. Sci. Total Environ. 2018, 633, 1469–1479. [Google Scholar] [CrossRef]
  80. Hu, X.; Wu, Z.; Wu, C.; Ye, L.; Lan, C.; Tang, K.; Xu, L.; Qiu, R. Effects of road network on diversiform forest cover changes in the highest coverage region in China: An analysis of sampling strategies. Sci. Total Environ. 2016, 565, 28–39. [Google Scholar] [CrossRef]
  81. Selva, N.; Kreft, S.; Kati, V.; Schluck, M.; Jonsson, B.-G.; Mihok, B.; Okarma, H.; Ibisch, P.L. Roadless and Low-Traffic Areas as Conservation Targets in Europe. Environ. Manag. 2011, 48, 865–877. [Google Scholar] [CrossRef] [Green Version]
  82. Mo, W.; Wang, Y.; Zhang, Y.; Zhuang, D. Impacts of road network expansion on landscape ecological risk in a megacity, China: A case study of Beijing. Sci. Total Environ. 2017, 574, 1000–1011. [Google Scholar] [CrossRef] [Green Version]
  83. Tan, M.; Li, X.; Xie, H.; Lu, C. Urban land expansion and arable land loss in China—a case study of Beijing–Tianjin–Hebei region. Land Use Policy 2005, 22, 187–196. [Google Scholar] [CrossRef]
  84. Liu, Y.; Long, H.; Li, T.; Tu, S. Land use transitions and their effects on water environment in Huang-Huai-Hai Plain, China. Land Use Policy 2015, 47, 293–301. [Google Scholar] [CrossRef]
  85. Wang, L.; Pan, Y.; Cao, Y.; Li, B.; Wang, Q.; Wang, B.; Pang, W.; Zhang, J.; Zhu, Z.; Deng, G. Detecting early signs of environmental degradation in protected areas: An example of Jiuzhaigou Nature Reserve, China. Ecol. Indic. 2018, 91, 287–298. [Google Scholar] [CrossRef]
Figure 1. Geographical location of the study area.
Land 10 00043 g001
Figure 2. Research framework.
Land 10 00043 g002
Figure 3. Variation of the average conflict indices of YREB.
Land 10 00043 g003
Figure 4. Spatial distribution pattern of land use conflict indicators during 2000–2010 and 2010–2018.
Land 10 00043 g004
Figure 5. Variation and standard deviation ellipse (SDEs) during study periods of land use conflict indicators.
Land 10 00043 g005
Table 1. Data sources and descriptions.
Data NameData TypeTime PeriodResolutionData Source
Land use/land cover dataGrid2000, 2010, 201830 m × 30 mResource and Environment Science and Data Center
DMSP/OLS Night Light DataGrid2000, 2010, 201830 arc-secondsNational Geophysical Data Center
NDVIGrid2000, 2010, 20181000 m × 1000 mResource and Environment Science and Data Center
Meteorological dataVector2000, 2010, 20180.25° × 0.25°China Meteorological Administration
DEMGrid200390 m × 90 mUnited States Geological Survey (USGS)
Soil quality dataGrid200030 arc-secondsHarmonized World Soil Database
National boundary, sea land border, and major riversVector20191:60,000,000Standard Map Service System
Administrative boundary and road mapVector20151:250,000National Catalogue Service for Geographic Information
Socioeconomic dataTxt2018County levelStatistical Yearbook of Chinese Cities
DMSP/OLS: Defense Meteorological Satellite Program/Operational Linescan System; NDVI: normalized difference vegetation index; DEM: Digital Elevation Model.
Table 2. Land use classification system.
ClassesLand Use TypeDescription
Ecological landForest, grasslands, rivers, lakes, shoals, reservoirs, ponds, glaciers, and unutilized landThese land use types provide numerous ecological functions, such as climate regulation, gas regulation, water regulation, soil retention, and biodiversity.
Construction landUrban and rural residential lands; construction land, including industrial, mining, and storage lands and roads. These land use types mainly composed of impervious surface can provide industrial and mineral production as well as living functions, such as residence, shopping, education, and medical treatment.
Agricultural landPaddy fields, irrigated land, and arid land.The primary function of these land use types is agricultural production.
Table 3. Agricultural land suitability evaluation criteria.
CriteriaAptitude, impact, and feasibility class a
S1S2S3N
Length of dry season (months)0–22–33–4>4
Mean annual temperature (°C)>2222–2020–18<18
Mean annual maximum temperature (°C)>2727–2424–22<22
Slope (%)0–88–1616–30>30
DrainageGoodModerateImperfectPoor
Soil texture bC, SC, SCLSLLSS
Soil depth (cm)>100100–7070–50<50
Distance to the road (m)<500500–10001000–2000>2000
a Each factor was expressed using four suitability classes corresponding to a high (S1), moderate (S2), and marginal (S3) suitability, as well as unsuitable (N) conditions. b C: clay; SC: sandy clay; SCL: sandy clay loam; SL: sandy loam; LS loamy sand; S: sand.
Table 4. Socioeconomic variables considered in this study.
VariablesAbbreviationDefinitions
Demographic factorsTPOPTotal population of prefectural city
POPDPopulation density of prefectural city
Economic factorsGDPPCper capita GDP
IFAInvestment in fixed assets
TRSCGTotal retail sales of consumer goods
Life factorsHBNNumber of hospital beds
MPUNNumber of mobile phone users
RDRoad density
Table 5. Area of each land use class in The Yangtze River Economic Belt (YREB) from 2000 to 2018.
Class 200020102018
Ecological landArea (million ha)136.15136.19135.84
Rate (%)66.41%66.43%66.26%
Agricultural landArea (million ha)64.0262.0860.88
Rate (%)31.23%30.28%29.70%
Construction landArea (million ha)4.846.738.28
Rate (%)2.35%3.28%4.04%
Table 6. Average annual change of land use area in YREB during the study periods.
Class 2000–20102010–2018Sum Average
ecological landAnnual variation (thousand ha)3.77−43.84−313.02−17.39
Rate(%)0.02%0.08%0.86%0.05%
agricultural landAnnual variation (thousand ha)−193.9−149.53−3135.24−174.18
Rate(%)−0.30%−0.24%−4.92%−0.27%
construction landAnnual variation (thousand ha)190.13193.373448.26191.57
Rate(%)18.51%13.86%295.98%16.44%
Table 7. Pearson correlation coefficients between the land use conflict indices and socioeconomic factors.
VariablesEACACCECCCLUC
TPOP0.534 **0.800 **0.470 **0.839 **
POPD−0.189 *0.573 **0.217 *
GDPPC0.428 **0.349 **0.244 **
IFA0.438 **0.736 **0.530 **0.775 **
TRSCG0.245 **0.780 **0.471 **0.677 **
HBN0.559 *0.729 **0.505 **0.824 **
MPUN0.389 **0.826 **0.517 **0.790 **
RD0.807 **0.376 **0.419 **0.743 **
Note: * Significant at the 0.05 level, ** Significant at the 0.01 level, and—Not significant.
Table 8. Standardized regression coefficients and coefficients of determination (R2).
VariablesEACACCECCCLUC
Model 1Model 2Model 3Model 3
TPOP0.002 *0.002 **0.005 **
POPD−35.81 *−42.61 **
GDPPC2.214 **0.068 **1.812 **
IFA 0.99 *1.43 **
TRSCG 0.347 **
HBN0.16 *
MPUN0.001 **
RD0.448 **−0.315 **0.512 *
R-squared0.6530.7340.3600.803
Note: * Significant at the 0.05 level, ** Significant at the 0.01 level, and—Not significant. CLUC: comprehensive land use conflict; ecological and agricultural (EAC), agricultural and construction (ACC), and ecological and construction (ECC) land conflicts.
Table 9. Major governmental policies that influence the land use conflict of the territorial space in China from the 1980s to 2010s.
YearPolicy/DecreeMain Contents
1986Farmland protection systemCherish and rationally use every inch of land; effectively protecting farmlands is the basic state policy that our country must adhere to for a long time
1989Basic farmlandThe state established the basic farmland protection system and provided special protection to basic farmlands.
1994Nature reserve regulationThe state formulated regulations to strengthen the construction and management of nature reserves and protect the natural environment and resources.
1997Farmland dynamic balance systemThe state established the farmland dynamic balance system in which farmlands are supplemented with no fewer than the land occupied by construction.
1999Grain for GreenThe state formulated policies to bring forward large-scale efforts to return farmlands to forests and restore livestock pastures to natural grasslands.
2012Ecological red lineAreas with special and important ecological functions all over the country were strictly delineated into the ecological red line policy for special protection.
2019National parkThe state established a system of protected natural areas dominated by national parks.
Publisher’s Note: MDPI stays neutral with regard to jurisdictional claims in published maps and institutional affiliations.

