Article

The Spatiotemporal Evolution and Trend Prediction of Ecological Wellbeing Performance in China

1
College of Economics & Management, Northwest A & F University, Yangling 712100, China
2
School of Social and Public Administration, East China University of Science and Technology, Shanghai 200237, China
3
School of Tourism and Urban Management, Jiangxi University of Finance and Economics, Nanchang 330013, China
*
Author to whom correspondence should be addressed.
Land 2021, 10(1), 12; https://doi.org/10.3390/land10010012
Submission received: 21 November 2020 / Revised: 21 December 2020 / Accepted: 24 December 2020 / Published: 25 December 2020

Abstract

:
Humans currently face a problematic ecological dilemma regarding economic growth. It is difficult to meet human needs by only studying economic growth created by artificial costs, and all countries need to pay attention to the task of improving the level of human welfare under the constraints of an ecological environment from the perspective of sustainable development. The focus of ecological wellbeing performance (EWP) is how to achieve the maximum welfare level output or achieve higher welfare level improvement with the fewest conversions of natural and ecological inputs. In this paper, we use the super-efficiency SBM model to measure the EWP of Chinese provinces and cities, traditional and spatial Markov probability transfer matrices are established based on time series analysis and spatial correlation analysis of the global Moran’s index, and the characteristics of the spatiotemporal variations of EWP are analyzed by comparing the matrices. The evolution trend for a certain future period is predicted, and the influences of geographical spatial patterns on the spatiotemporal evolution of EWP are discussed. On this basis, according to the calculation and analysis of the characteristics of China’s EWP, provinces and cities in China need to focus on improving their own resource utilization efficiency and strengthen environmental supervision to improve EWP. Finally, policy recommendations are put forward. First, special laws and regulations need to be introduced for resource utilization and ecological protection. The second recommendation is to promote and improve the mechanism of public participation in the rational utilization of resources and protection of the ecological environment. The third recommendation is to establish a dynamic monitoring system for resource utilization and ecological environmental protection. The fourth recommendation is to strengthen structural adjustment and accomplish high-quality economic development.

1. Introduction

The experience of world history indicates that economic development and increased social wealth cannot naturally achieve social harmony [1]. From the perspective of welfare threshold, there is not always a positive relationship between economic growth and social welfare, economic growth does not necessarily improve people’s quality of life, on the contrary, it may have an inhibitory effect when economic growth reaches a certain stage [2,3]. Human wellbeing is closely related to environmental quality [4]. Currently, human beings have transitioned from an ‘empty world’ with relatively rich natural capital to a ‘full world’ that falls under the restrictions of the ecological environment due to the deterioration of the ecological environment and depletion of natural resources [5,6]. In a ‘full world’, scarce natural capital has become the limiting factor of welfare promotion [7], and ecological welfare is approaching ecosystem limitations. Therefore, researching only economic growth, which is caused by man-made costs, cannot satisfy the needs of human beings, and we need to focus on how to balance the relationship among the consumption of natural capital, economic growth and improvement of welfare levels under the constraints of the ecological environment from the perspective of sustainable development [8,9]. Furthermore, it is urgent to improve the efficiency of transforming ecological consumption into human welfare under ecological limitations [10,11].
Ecological wellbeing performance (EWP) is an evaluation tool that includes two important dimensions that define the limits of natural capital emphasized by a green economy and social welfare comprising ecological ‘fairness’ [12]. EWP has become an attractive research topic since it was introduced in the 1970s, and its research is of great significance for the sustainable development practices of various countries. EWP can be regarded as a necessary but not sufficient condition for the sustainable development of human beings [13]. EWP is not inherent but it forms in the process of transforming the coordinated relationship among ecology, society, and the economy characterized by a weak sustainable research paradigm [14] into a successively inclusive relationship among ecology, society, and the economy under a strong sustainable research paradigm [15]. There are other phrases that have similar concepts to EWP, such as ecological efficiency, economic performance, and the happy planet index. The main idea of ecological efficiency among these three similar phrases can be summarized as the ‘minimization of environmental impact and the maximization of economic value’, that is, providing maximum value while minimizing consumption and pollution [16]. Economic performance can be defined as a ratio of satisfaction output and environmental input [17], and the happy planet index is represented by the ratio of happy life years and ecological footprint, in which the happy life years is the result of life expectancy and wellbeing [18]. These concepts still involve the concept of a weakly sustainable research paradigm. However, EWP includes two important indicators which is emphasized by sustainable development: one is the input of natural resources and another is the ultimate goal of development, namely, the continuous improvement of human welfare levels [19]. EWP emphasizes the concept of decoupling development between the consumption of ecological resources and social welfare, and establishes a development concept that emphasizes quality [20]. The ultimate goal is to improve the welfare level of the whole society. Under this research paradigm, two concepts of EWP are most widely used: one is similar to the concept of economic performance and the happy planet index, EWP is seen as a ratio. From this perspective, EWP is defined as the ratio between the value of social welfare and the physical quantity of ecological resource consumption, which can reflect the welfare output efficiency of unit ecological consumption [12,21], the denominator is usually expressed by ecological footprint per capita, and in the terms of numerator selection, scholars have different choices include years of life happiness, index of sustainable wellbeing, and human development index [22,23]. The Human Development Index (HDI) and Ecological Footprint (EF) data can be obtained from the Living Planet Report1 and Global Footpring Network2, and we can track county data by the X-Y 2-dimensional coordinate system, where the two indicators are on the two axes. Figure 1 can directly reflect China’s EF and HDI value from 2003 to 2016. Both EF and HDI show an upward trend, however, as the growth rate of EF is greater than that of HDI, the EWP is declining. Another concept is defined from the perspective of input–output, which considers that the essence of EWP is to obtain the maximum welfare level outputs or increase welfare levels with the fewest natural and ecological input [24], which refer to the efficiency of transforming ecological inputs into welfare levels [25], and reflects the sustainable development level of a country, region, or city [26].
In fact, EWP is an extension of sustainable development [27] that in a broader sense reflects the relative change trend of welfare levels and ecological resource consumption [28]. Although there has not yet been established a consistent viewpoint that defines the concept of EWP, experts and scholars have reached a consensus that it is necessary to improve the EWP of the whole society through various efforts. On the basis of this consensus, the development and understanding of its meaning can be achieved around its essence, goal, and path. From the essence of EWP, the degree of sustainable development of a country or region is reflected and can be used as a new research perspective or analysis tool to study global or national sustainable development, and EWP can further explain whether the modes of economic and social development are reasonable [26]. The key goal of EWP is to improve the unit welfare level obtained by a certain region; the path for accomplishing this is mainly by reducing natural or ecological consumption. In other words, the improvement of the unit welfare level should remain within the carrying capacity of the ecological environment.
In recent years, an increasing number of countries have begun to pay attention to EWP research. The research concepts include the establishment of an evaluation index system to measure and compare the EWP of different countries at different scales while analyzing the growth of EWP in a certain period of time from the perspective of green adjustments of industrial institutions [13,29,30,31], the influence factors of EWP were also analyzed [32]. At present, the research on EWP is mainly limited in two aspects. First, the measurement of EWP is mostly expressed by the ratio of HDI and EF. EWP includes a lot of economic, social and ecological information, HDI and EF are the result value of a serious indexes, combining the two is too much of an abstraction, which reduces the understandability of the original indicators. Second, the existing studies mainly focus on the measurement, the evolution of time and space and the influence factors of EWP, whereas few studies have predicted trends in EWP. Prediction of future trends on EWP can help realize a balance between the consumption of resource and environment, and the growth of wellbeing. Therefore, in this study, in order to reflect the connotation of EWP more intuitively, the construction of EWP index system is established from two aspects of input and output. Based on the analysis of time series and spatial correlations, this study also defines a traditional and space Markov probability transfer matrix. By comparing transfer matrices, the spatiotemporal dynamic evolution characteristics of EWP are analyzed, and its evolution trend is predicted to explore the influences of surrounding areas on the development of EWP and provide theoretical support for regional sustainable development.

2. Research Methods and Sources of Data Used

2.1. Research Methods

2.1.1. Super-Efficiency SBM Model

Data envelopment analysis (DEA) is often used to measure efficiency. This technique is an important and effective method for measuring relative efficiency and was proposed by the famous American operational research scientist Charnes et al. [33]. Traditional DEA models include the CCR model and BCC model. The CCR model is proposed by Charnes, Cooper, and Rhodes [33]. This model calculates the scale and technical efficiency of production on the premise of constant returns to scale, that is, the overall efficiency. The BCC model is developed by Banker, Charnes, and Cooper with variable returns to scale [34]. Both the CCR model and BCC model belong to the DEA model. The difference between them is that CCR model does not separate the effect of scale efficiency from technical efficiency, and CCR model assumes that the return to scale is constant and calculates a comprehensive efficiency. BCC model is obtained under the assumption of variable returns to scale, it decomposes the comprehensive efficiency into pure technical efficiency and scale efficiency, which means that the comprehensive efficiency is effective only when pure technical efficiency and scale efficiency are effective at the same time. In practical applications of DEA, there is no need to determine the functional relationships and non-subjective weights or analyze the invalid factors of decision-making units (DMU) in advance. As a result, DEA avoids the influence of subjectively setting the functions and weights and thus causes the measurement results to be more objective. However, its measurement method had defects caused by radial and angle aspects [35]. The SBM model was first proposed by Tone to measure ecological efficiency [36]. This model can effectively solve the "crowding" or "slack" phenomenon of input factors caused by traditional DEA models of radial and angle aspects. With efficiency measurements, it is easy to cause multiple DMUs with complete efficiency, which makes it impossible to evaluate and rank these decision-making units effectively. In this regard, Tone further defined the super-efficiency SBM model on the basis of the SBM model [37]. The super-efficiency SBM model combines super-efficiency DEA model with the SBM model. Compared to common SBM models, the super-efficiency SBM model can further compare and distinguish the effective DMUs at the frontier. The model can be expressed as:
M i n ρ = 1 m i = 1 m ( x ¯ / x i k ) 1 r 1 + r 2 ( s = 1 r 1 y d ¯ / y s k d + q = 1 r 2 y u ¯ / y q k u )
{ x ¯ j = 1 , k n x i j λ j ; y d ¯ j = 1 , k n y s j d λ j ; y d ¯ j = 1 , k n y q j d λ j ; x ¯ x k ; y d ¯ y k d ; y u ¯ y k u ; λ j 0 , i = 1 , 2 , , m ; j = 1 , 2 , , n , j 0 ; s = 1 , 2 , , r 1 ; q = 1 , 2 , , r 2 ;
In the above formulas, suppose that there are n DMUs. Each DMU is composed of the input m, expected output r 1 and unexpected output r 2 ; x, y d and y u are the elements in the corresponding input matrix, expected output matrix and unexpected output matrix, respectively; and ρ is the relative efficiency value.

2.1.2. Analysis of Spatial Correlation Performance

EWP exhibits differences due to different basic conditions such as resource endowments, ecological environment backgrounds and spatial backgrounds among different regions. According to the Tobler’s First Law of Geography, all the objects and phenomena in a spatial unit do not exist in isolation; they are related to each other. The degree of connection between adjacent objects or phenomena is closer than that between distant objects [38], which indicates that the utilization of resources and the ecology in surrounding areas may interact with each other. Spatial autocorrelation can characterize the influence of neighboring areas, while the spatial distribution differences of regions may exhibit spatial correlations. This means that the geographical location of a region will affect its own EWP, and its location may also affect the EWP of its surrounding areas. As a result, it is necessary to measure the spatial autocorrelation of the regional EWP. Spatial autocorrelation includes both the global and the local levels. This research uses spatial autocorrelation at the global level to understand the spatial correlations and spatial differences of EWP. In spatial information statistics, the most representative index of spatial autocorrelation is the Moran’s I index, which can be represented as:
I = n i = 1 n j = 1 n w i j ( x i x ¯ ) ( x j x ¯ ) i = 1 n j = 1 n w i j i = 1 n ( x i x ¯ ) 2
In the above formula, n is the sample size, and x i and x j are the observed quantities of spatial positions i and j, respectively. w i j denotes the proximity relationship between spatial positions i and j: when i and j are adjacent, w i j = 1 . Otherwise, it is 0. The value of the global Moran’s I index is within [−1,1]. If it is greater than 0, the index indicates positive correlation; if it is less than 0, it indicates a negative correlation; if it is equal to 0, it suggests no correlation.

2.1.3. Spatial Markov Chain

The traditional Markov probability transfer matrix, which is based on the theory of stochastic processes, was first proposed by the Russian mathematician Markov and it can represent a system transforming from one state to another during a concerned period [39,40]. This matrix aims to measure the states and future trends of events by constructing a state transition probability matrix. In this process, the past has no influence on predictions of the future of given states of knowledge or information (that is, having "no aftereffect"). The evolution processes of many phenomena also exhibit no aftereffect. Specifically, the evolution process of EWP also has no aftereffect. Assuming that p i j is the transfer probability of EWP in a certain region from state i in year t to state j in year t+1, the state transition probability P i j = n i j / n i can be approximately estimated by the frequency of transition. n i j means that city numbers transform from state i in year t to state j in year t+1 in a sample inspection period and also satisfies j P i j = j p { X n + 1 = j | X n = i } = 1 . If the EWP is divided into N types or N states, it can be defined by an N × N probabilities transition matrix. In addition, the direction of transfer is determined by the improvement in, invariance of and decrease in the EWP performance types.
In the past decade, spatial econometrics has developed rapidly and has been used to study various social spatial phenomena [41,42], and spatial Markov chains is one of the most important methods. The spatial Markov chains evaluates how nearby locations influence each other at a given scale [43]. Research on spatial Markov chains has introduced the concept of spatial lag into the transition probability matrix [44] which based on the fact that regional economic growth and the evolution of other economic phenomena are not isolated and random in geographical space but interact with and are related to neighboring regions. Compared to traditional Markov chains, spatial Markov chains can more effectively show the internal relationships of some economic phenomena under the background of space-time evolution and regional space. For the condition including the spatial lag type of an area in the initial year, the traditional N × N-order state transition probability matrix is further decomposed into N N × N transition conditional probability matrices, which makes it possible to analyze the possibility of improving or decreasing the EWP of a certain place under different geographical background conditions. Taking the Nth conditional matrix as an example, P i j ( N ) represents the one-step spatial transfer probability of a region from state i to state j in t+1 years under the condition of a spatial lag type N of a region in year t. The spatial lag type of a region is obtained by classifying the spatial lag value of its EWP value in the initial year. The spatial lag value is the spatially weighted average of the EWP values of the region’s surrounding areas, which is calculated by the product of the regional EWP value and spatial weight matrix, can be shown as j W i j Y j . Y j represents the EWP of a region, and W i j represents the elements of the spatial weight matrix W. In this article, the spatial boundary principle is used to determine the spatial weight matrix: for the surrounding region, W i j = 1 ; otherwise, W i j = 0 . Due to the special geographical location of Hainan Province, calculations of the weight matrix assume that Hainan Province is adjacent to Guangdong Province.
By comparing the corresponding elements in the traditional and spatial Markov transfer matrices, we can determine the relationship between the transfer probabilities of improving or decreasing the EWP in a certain region and the surrounding neighborhood, and then discuss the spatial spillover effect of different spatial backgrounds on the transfer of EWP.
After a long transfer of a Markov process, if there is a balanced state in the system, there is a possibility that system is in the same state that does not depend on the original state and will not continue to change with the passage of time. The probability distribution at this time is a stationary distribution. Based on the Markov probability transfer matrix, the stationary distribution of the stochastic process can be obtained to predict the dynamic evolution trend of EWP in this article. Assuming that the traditional Markov transfer matrix { X n , n = 0 , 1 , 2 , } is a state space, P i j is the one-step transition probability, and { π i , i S } is the probability distribution of each state. If { π i , i S } satisfies the equation π i = j = 0 π j p i j ( i = 0 , 1 , 2 , ) , the probability distribution { π i , i S } is the stationary distribution of a traditional Markov chain. Based on the similarity principle, the spatial stationary distribution of each spatial lag type is obtained, and the maximum transition probability is taken as the possible evolution trend of the corresponding state.

2.2. Constructing an Index System

The essence of EWP is to obtain maximum welfare level outputs with the fewest ecological input conversions, which can be regarded as the upgrading of ecological efficiency research and meets the requirements of the input and output indicators of DEA. This systematic study follows the principles of scientific nature and data availability to construct an index system from two aspects of input and output.
In the process of improving people’s wellbeing, a country or region must consume a certain amount of natural resources. On the one hand, the ecological inputs include resource inputs, that is, the consumption of resources, including the consumption of energy, land and water. Because the population of each province is different, the average level of each province can be better reflected by the per capita index. In this study, the per capita consumption of standard coal, the per capita construction land resources and the per capita water consumption of each province are measured respectively. On the other hand, the operation of various economic activities will inevitably bring pressure on environment, which is also the cost of human wellbeing and economic activity output, namely environmental pressure cost. We use Reinhard’s method for reference, take the unexpected output as the input of production [45]. This paper regards the environmental pollution caused by human production and living processes as a kind of reverse investment [46,47], including exhaust fumes emission, wastewater discharge and solid waste discharge. The per capita SO2 emission, per capita smoke and dust emission are the indicators of exhaust fumes emission, the per capita chemical oxygen demand emission and per capita ammonia nitrogen emission are the wastewater discharged indicators and the production of general industrial solid waste per capita is take as the solid waste discharge.
In terms of wellbeing used to measure output, wellbeing includes not only economic income, but also the overall development of human beings and can be used to measure human satisfaction of life [48], including material conditions and living conditions [49]. The quantitative evaluation is based on the three-dimensional indicators adopted by the human development index published by the United Nations Development Program in 1990 [50]. Therefore, the welfare level is reflected by economic development, educational development and health care. The level of economic development is used to measure the economic welfare of national income, which is characterized by per capita GDP. The level of education development is measured by the average years of schooling. Taking the current educational system of China, the average years of schooling of illiteracy is 0 years, that of primary school is six years, that of junior high school is nine years, that of senior high school is 12 years and college education or above is calculated by 16 years. The life expectancy is the average years that a person born in the same period is expected to live under the assumption that the current age-specific mortality rate remains unchanged. Although there are great differences in the length of life due to differences physique and genetic factors, medical treatment will also limit life expectancy. With the improvement of health care, the life expectancy will be longer. This article constructs the performance index system of China’s EWP shown in Table 1.

2.3. Data Sources

Accounting for data availability, the study areas were selected from all 30 provinces of China, which do not include Tibet, Taiwan, Hong Kong, Macau. The research period was set from 2003 to 2016. The relevant data used in this research are from China Statistical Yearbook and the statistical yearbooks of various provinces and cities; the average life expectancy data3 of individual years in some regions are from the network. Interpolation methods are used to compensate for missing data caused by the difference of statistical caliber.

3. Analysis of the Results

3.1. Determination and Time Series Analysis of China’s EWP

First, by comparing the ecological input data of different provinces and cities, we can see that in terms of resource consumption, industrial development is inseparable from resource consumption and that the per capita consumption of standard coal is on the rise as a whole due to the continuous promotion of the industrialization process. Although China has been emphasizing the need to save and intensively use land resources, this has caused the overall growth rate of construction land to slow down. However, from 2003 to 2016, the per capita area of construction land in all provinces and cities continued to increase. Due to the limited amount of land, this increase in construction land will inevitably lead to decreases in the area of lands with ecological functions. In addition, the per capita water consumption of various provinces and cities is basically rising. In terms of polluting the environment, the implementation of various environmental protection measures has progressed well in recent years. In total, the per capita emissions of the "three wastes" in the eastern and central regions of China have decreased year by year, but there is still much room for improvement in environmental pollution control in the western region of China. By using DEA-SOLVER Pro 5.0 software, we adopt the super-efficiency SBM model of non-oriented and VRS to measure the EWP of 30 provinces and cities in China from 2003 to 2016 and calculated the average values for each year. Additionally, we use the usual 11:8:12 regional division method for the east: middle: west, and the average EWP of each different region was compared and analyzed. It needs to be noted that the results of DEA calculations are relative values rather than absolute values. The results are not able to show the actual ecological welfare level of a certain region, but horizontal and vertical comparative analyses can be conducted among different provinces. The calculation results show the following. ① By observing the trend shown in Figure 2, the average EWP in each year is mostly below 1, and the EWP of China was not at a high level in the study period. ② By comparing the ecological welfare performance of the three regions in the eastern, middle and western parts of China, the EWP ranking from 2003 to 2016 was eastern > central > western, which shows that in the face of an ecological dilemma, the eastern region depends less on resource consumption and environmental pollution for social and economic development than do the central and western regions. The development of the central and western regions is still highly dependent on resources, which leads to the inefficient promotion of welfare.

3.2. Time Evolution Characteristics of EWP in China

The abovementioned time series analysis of EWP offers only a basic description of the time variation trends and evolution differences of EWP, and it is difficult to reflect the internal temporal and spatial evolution patterns. As a result, we construct a traditional Markov chain transfer matrix of EWP and separate the EWP values of 30 provinces and cities from 2003 to 2016 into different types of state spaces from high to low. Because the various types of provincial and municipal surveys are mostly similar, we use quantiles as boundaries and separate the EWP values into four adjacent but disjoint complete intervals: (0.1024, 0.3894], (0.3894, 0.7497], (0.7497, 1.0409] and (1.0409, 2.3848]. The complete intervals of these four state types are represented by k = 1, 2, 3, and 4. The greater the value of k is, the higher the EWP of the region. According to the division of the above state types, we can obtain a traditional Markov probability transition matrix.
In Table 2, the values on the diagonal represent the probabilities that the state type of regional EWP does not transfer and can represent the stability of regional EWP evolution. Values that are not on the diagonal represent the probabilities of regional EWP transferring among different state types, and the evolution characteristics of EWP without considering geographical spatial patterns are thus obtained. ① The values on the diagonal are much larger than those not on the diagonal. The minimum value on the diagonal line is 0.8333, and the maximum value is 0.9556. This shows that regardless of the period examined, the EWP of a province or city belongs to a certain type in the current year, there is at least an 83% probability that the type will be the same in the next year. In addition, the probability of maintaining type 1 is 0.9556, and the probability of maintaining type 4 is 0.9010, which indicates that the probabilities of maintaining these two state types are the largest, and the EWP has the possibility of converging to a low level or high level. ② For the values not on the diagonal, the maximum value is 0.1471, which indicates that the probability of a leaping transfer of the EWP is relatively small and that, in particular, the maximum probability of a transition from a low state to a high state of ecological welfare is only 0.0444 (i.e., from state 1 to state 2). This indicates that it is difficult for the EWP to achieve a leaping transfer and that the EWP will be in a longer period that maintains a relatively stable state.

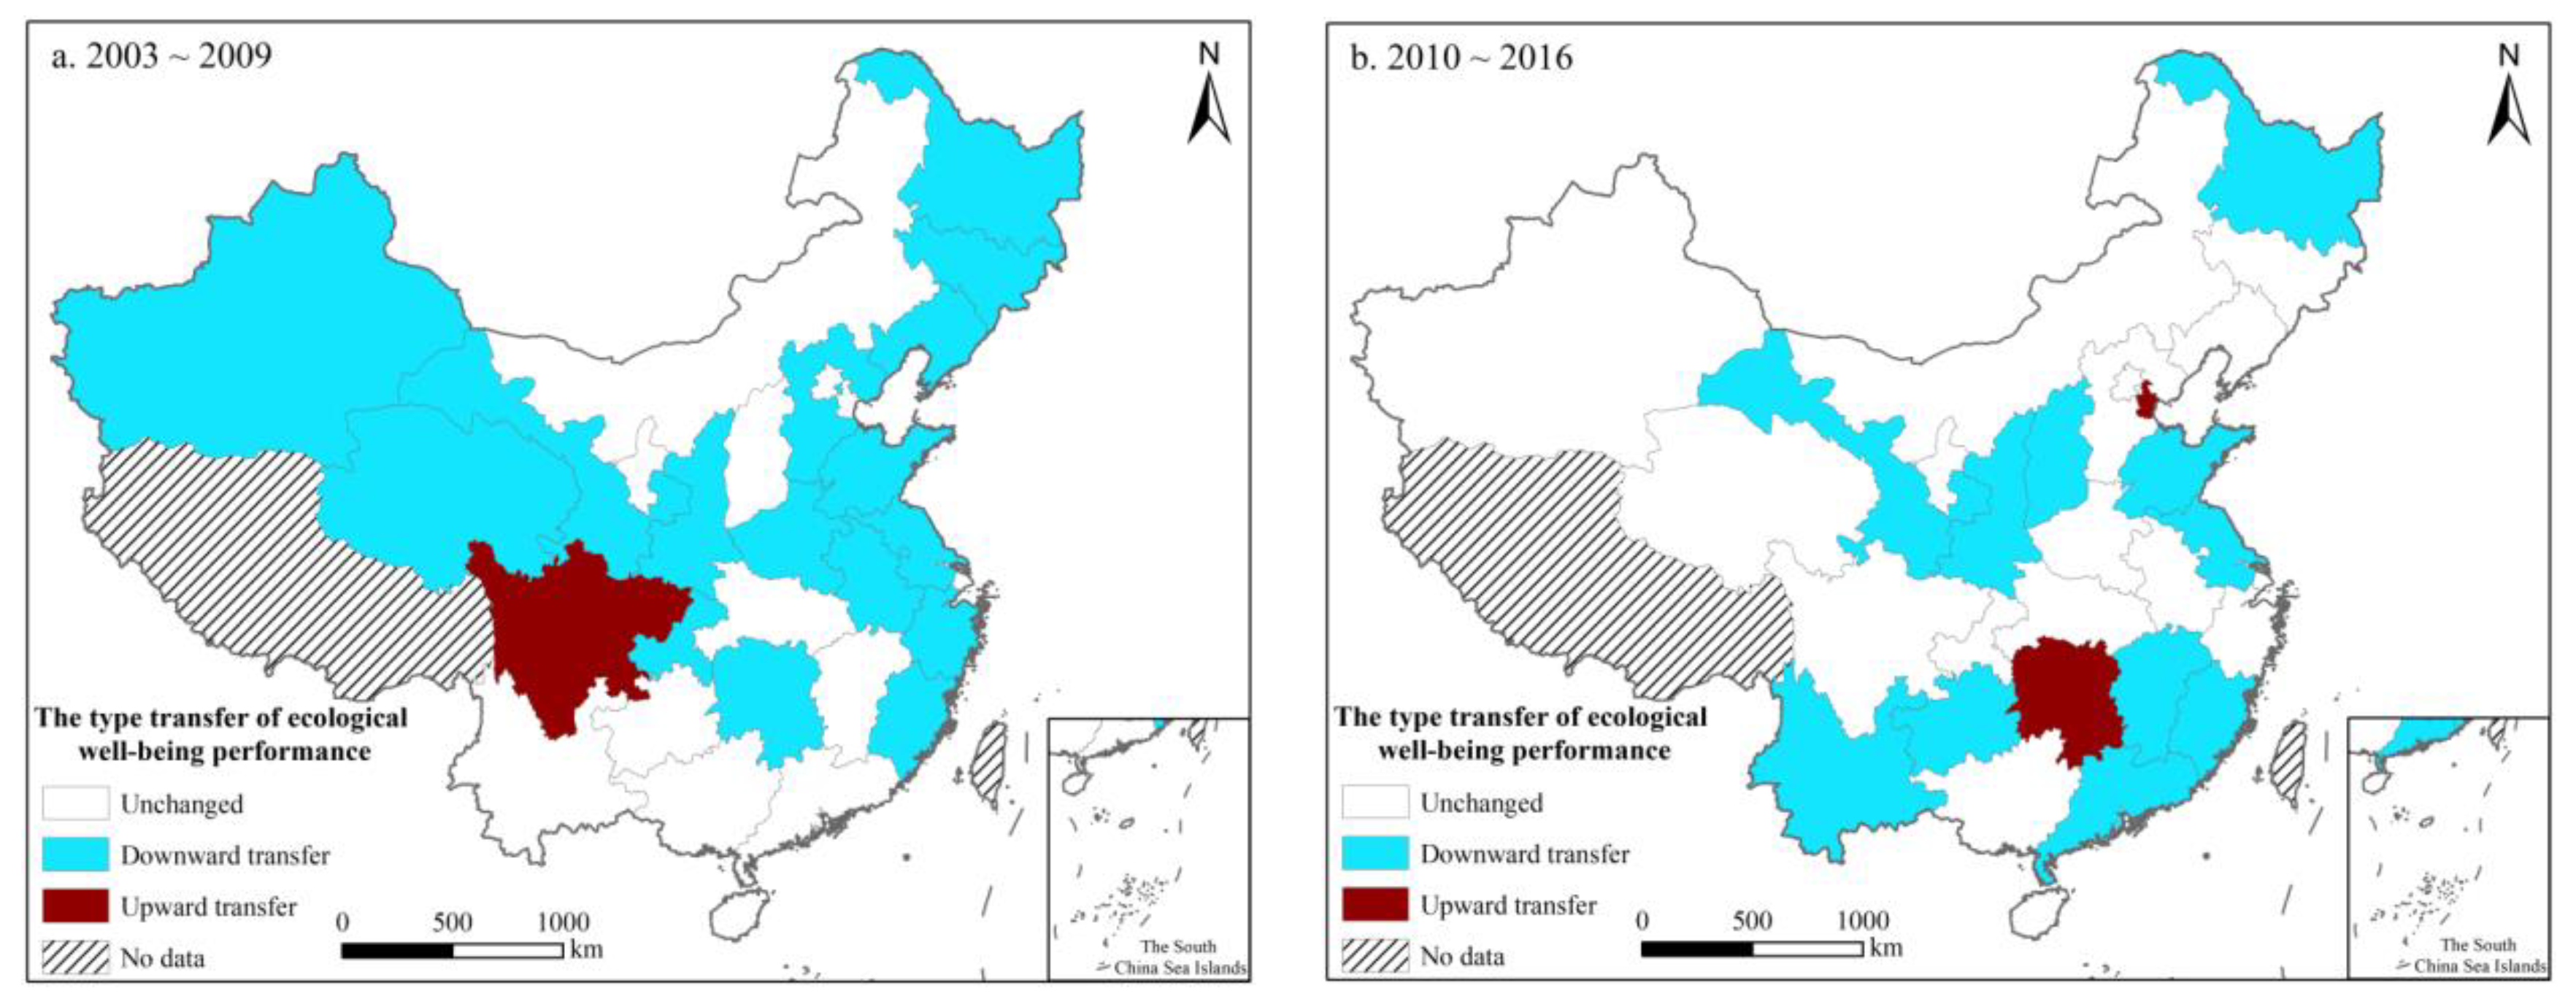
3.3. Spatial Evolution Characteristics of EWP in China

To more completely understand the spatial and temporal evolution differences of ecological welfare performance in different provinces and cities, we construct spatial Markov chain probability transfer matrices. By comparing the corresponding elements of the two matrices, this article explores the relationship between the transfer probability of the EWP type for a province and that for neighboring provinces and cities with or without the influence of the spatial background. First, the global Moran’s I index of EWP from 2003 to 2016 was calculated, and the spatial correlation test was conducted. The Moran’s I index of EWP in each year was positive (0.1978–0.3702) and passed the significance test at a confidence level of 5%. This shows that there is a significant positive correlation in the spatial distribution of China’s EWP and that the geographical spatial pattern is also one of the important factors that affect China’s EWP. By using ArcGIS, a spatial distribution map of the transfers of EWP types in 2003–2009 and 2010–2016 was created. Figure 3 shows the following. ① From 2003 to 2009, only Sichuan Province exhibited upward transfer of EWP, while the EWP remained unchanged in 16 provinces and cities, mainly distributed in the central region of China, and the EWP decreased in 13 provinces and cities located mainly in the eastern region of China. ② From 2010 to 2016, there were 2 provinces and cities with increasing EWP, namely, Hunan Province and Tianjin city. A total of 17 provinces and cities maintained the same ecological welfare performance type, and the EWP in 11 provinces and cities decreased, mainly in the central and western regions. These results indicate that although there was no significant improvement of the EWP in this period, the performance in most regions remained unchanged. Moreover, the downward shift of EWP types in western China was curbed, which had a certain spatial spillover effect.
The traditional Markov probability transfer matrix does not consider the impact of type transfers between adjacent areas. While transitions of EWP states are not isolated in space, they have relationships with surrounding areas. Therefore, on the basis of the traditional Markov probability transfer matrix, the spatial Markov probability transfer matrix is constructed by introducing the geographical space background factors and taking the spatial lag type of the initial years of each province as the condition. In Table 3, the spatial Markov probability transfer matrix is established to investigate the influence of neighboring regions in different provinces and cities on EWP.
By comparing the traditional Markov probability transfer matrix and spatial Markov probability transfer matrix, we find the following. ① The geographical spatial pattern has a certain influence on the dynamic evolution of China’s EWP. For different surrounding backgrounds, the type transfer probability of EWP in different provinces is different, and it is also different from the traditional Markov probability transfer matrix. Otherwise, the influence of spatial lag does not exist. For example, without considering the influence of the geographical spatial patterns, P12 = 0.0444, while when a province is adjacent to a type-2 province, P12/2 = 0.1026. We can see that there is a certain necessity to analyze the evolution and transfer of EWP under the spatial background. ② Considering the influence of geographical spatial patterns, when a province is adjacent to provinces with different EWP types, its own transfer probability of EWP type is also different, for example, P23/2 = 0 < P23/3 = 0.0513 and P21/2 = 0.2917 > P21/3 = 0.1282 > P21/4 = 0.0769. Generally, if a province and its neighboring provinces are in a state of high ecological welfare, the probability of upward transfer of the EWP state of the province will increase, and when the neighboring provinces and cities are at low EWP levels, the probability of downward EWP transfer of the province and city will increase.

3.4. Predicting the Spatiotemporal Evolution Trend of EWP in China

The analysis in the above section describes the evolution characteristics of China’s EWP in the set research period, but what characteristics will appear in the future following its long-term evolution? In the long term, the type transfer of EWP in China’s provinces and cities maintains the stability of the original state, and transformations of state type will still continue before stability is reached. The limiting distribution of a Markov probability transition is the probability distribution when each type of transition reaches its equilibrium state. In practice, for the n-step probability transition matrix of the EWP state type, when n tends to infinity, the limiting distribution of the state probability transition can be obtained, the spatial Markov probability transfer matrix with spatial lag can be used to calculate the limiting distribution of each type of spatial lag, and then the change trend of the performance of China’s EWP in a certain period in the future can be predicted. The limiting distribution under the two background conditions is calculated by using the traditional and spatial Markov probability transfer matrices. The outcomes are shown in Table 4 and are compared with the probability distribution of the initial state.
Without considering spatial lag, the comparison between the calculated limit distribution and the initial state shows that the number of provinces and cities of type 1 is increasing and that the number of provinces and cities in types 2, 3 and 4 is decreasing. This shows that when relying only on the consumption of resources to develop, it is difficult to improve EWP, and most provinces and cities will still be at low EWP levels.
When considering spatial lag, under the background of different geographical spatial patterns, the transfer probability of China’s EWP levels in a certain period in the future has the following characteristics. When a province is close to a province with a low EWP level, its ecological welfare performance level may be in a low state for a long period, and the percentage of provinces at a low level is 73.98%. When a province is close to a province with a higher EWP level, the neighboring provinces and cities will have an impact on the EWP of the provinces and cities. However, this is not the decisive factor for determining the state evolution trend for a certain period in the future. According to the current resource consumption level and welfare output level, the ecological welfare level will still be low when a province is adjacent to either type 3 or type 4 provinces for a certain period in the future.

4. Discussion and Policy Recommendations

4.1. Interpretation of the Results

By measuring China’s EWP and by analyzing time series, we can see that from 2003 to 2016, China’s average EWP declined. The main reason is because in the inputs, although in terms of environmental pollution, pollutant discharges such as wastewater, waste gas and waste residue are generally decreasing year by year, and the consumption of resources is also increasing year by year. At the same time, in the output indicators that represent the level of welfare output, the added value of average life expectancy and average length of education in each year are limited, especially due to changes in the statistical caliber or other reasons, and the average number of years of education in some provinces has decreased. This causes the results of EWP calculations to show a downward trend, which indicates that the degrees of resource consumption and environmental pollution are greater than the pace of welfare level improvement and further shows that the impact of the once-extensive economic growth mode still exists, demonstrating that the level of welfare promoted by unit resource consumption is relatively small. It should be pointed out that the declining trend of the ecological welfare level does not mean that China has not made progress in ecological environmental protection in recent years. On the contrary, China has placed great importance on the protection of the ecological environment and the economical and intensive utilization of resources in recent years, taking low-carbon strategy as an important guiding ideology [51]. The results of this study mainly analyze the efficiency of transforming resource inputs into welfare outputs from the perspective of inputs and outputs and reflect only that the efficiency of transforming resource inputs into welfare outputs is not high enough. In addition, from 2003 to 2016, the EWP rank was East > Central > West China. This is because the eastern region has its own geographical advantages and original foundations, and various new technologies have developed rapidly, so East China has taken the lead in upgrading and transferring industry coincident with a gradual transfer of high energy consumption and high pollution to the central and western regions; at the same time, the economic, educational and medical systems in East China have also improved continuously. The EWP in the eastern region is higher than in the central and western regions.
The results of the time evolution characteristics of China’s EWP show that the EWP of each province has the stability of the original state. In the process of economic development, we could obtain certain levels of output by reducing the inputs of energy consumption. This transformation process cannot be completed in a short duration of time. It relies on the research and development of new technologies and the accumulation of management experience, gradual completion of the transformation and upgrading of industries, and improvements of the systems of resource utilization and environmental protection. This is also the reason why the EWP has difficulty in achieving bursts of improvement.
In the spatial evolution of EWP in China, because the system of natural resources elements is not completely closed, the resource elements among regions can circulate in space, such as China’s West-to-East Gas Transmission Project and the South-to-North Water Transfer Project, which cause the spatial connections between regional resource elements to become increasingly closer and can lead to the location effect of EWP between surrounding provinces and cities. That the global Moran’s index of each year’s ecological welfare performance is positive reflects the spatial dependence of the impact of EWP between neighboring provinces and cities. The EWP of a province not only affect other provinces but also be affected by other surrounding provinces and cities.
In predicting the spatiotemporal evolution trend of China’s EWP, the long-term evolution trend of China’s EWP level is not obviously affected by geographical spatial patterns but is strongly affected by the current state level in a certain period of time, by the long-term increase in resource consumption, and by the increase in welfare level outputs. This requires that in the future development process, every region should focus on improving its own resource utilization efficiency and strengthening environmental supervision and should rely mainly on its own endogenous power to promote EWP improvement. On this basis, neighboring cities should coordinate their economic development effort [52] and further improve EWP by relying on agglomeration advantages.

4.2. Policy Recommendations

To improve EWP, China’s provinces and cities need to focus on improving their own resource utilization efficiencies and strengthening environmental supervision and rely on their own endogenous power to promote EWP improvement. On this basis, this article puts forward the following policy recommendations to provide a reference for China and other countries and regions.

4.2.1. Enact Special Laws and Regulations for Resource Utilization and Ecological Protection

From the experience of environmental management strategy reform in Japan and other countries, it can be found that through the policy and guidance of legislation, advocating the reduction of resources and energy utilization has a positive role in promoting ecological efficiency [53]. Therefore, China could improve the relevant laws and regulations for resource and ecological protection to increase the internal motivations for improving the EWP. Specific implementation measures include the following. The first measure is to introduce special legislation at the national level. For example, ecological protection redline should be given clear legal effects and legal responsibilities and macroscopic provisions and requirements, which will optimize the legal environment for the implementation of relevant ecological protection policies. The second measure is to introduce corresponding regulations and management measures at the local level to assist the legislation at the national level. According to the characteristics and reality of their own resource endowments, each local government formulates regulations and management methods for resources and ecological protection with local characteristics to promote the progress of ecological protection work and lay the foundation for improving the EWP of the whole society.

4.2.2. Promote and Improve the Mechanism of Public Participation in the Rational Utilization of Resources and Ecological Environment Protection

For the policymakers of ecology and environment, they should pay more attention to the public participation evaluation in ecological and environmental decision-making [54], and innovate the methods of public participation in eco-environmental assessment [55]. An important way to improve EWP is to reduce the dependence of economic growth on resources and ecological consumption. The consumption and utilization of resources and ecology involve the interests of the entire public at a certain level. Therefore, we can improve the mechanism of public participation in the rational use of resources and ecological environmental protection to improve EWP. Specific measures include the following. First, we should comprehensively promote the information disclosure system of resource consumption and pollution emissions so that all kinds of production and utilization behaviors that hinder EWP improvement are supervised by the whole public. The second measure to improve the publicity mechanism for public participation in the rational utilization of resources and ecological protection is to accelerate the integration of traditional media and new media and convey comprehensive, timely and accurate ecological protection-related information to the public through the Internet, microblogs, WeChat, and other information platforms so that the public can understand the importance of rational resource utilization and ecological environmental protection. The public can also direct their opinions and suggestions to the relevant resource management departments through these information platforms. The third measure is to make full use of the benefit leverage and provide certain material or spiritual rewards to members of the public who have exhibited outstanding performance in the process of public participation in rational resource utilization and ecological environmental protection, which will increase the enthusiasm for public participation.

4.2.3. Establish a Dynamic Monitoring System for Resource Utilization and Ecological Environmental Protection

In recent years, China has been accelerating its development of the big data industry. Therefore, we can make full use of the advantages of big data to establish a dynamic monitoring system of resource utilization and ecological environmental protection to help improve EWP. Scientific researchers transform professional data and information into a form that is easy for policymakers to understand and use to formulate or adjust relevant policies [56]. Specific measures include the following. The first is to realize the construction of a resource utilization and ecological environment protection information database and implement full coverage of monitoring stations. This will aid in completely understanding the status of resource utilization and the quality of the ecological environment to monitor all kinds of unreasonable resource utilization behaviors. The second measure is to master regional resources, ecological environmental quality and their dynamic changes and formulate plans for resource utilization and ecological environmental protection through real-time monitoring and big data analysis and calculations. The third measure is to strengthen the data sharing of resource utilization and ecological environmental protection among different functional departments and refuse to approve some projects that would excessively consume resources and result in serious ecological environmental pollution.

4.2.4. Strengthen Structural Adjustment, Accomplish High-Quality Economic Development

The traditional development mode has a restrictive effect on improving EWP. This requires that we should appropriately slow down the speed of economic growth, promote economic transformation and gradually achieve high-quality economic development by increasing structural adjustment. The specific measures include: First, each province should take advantage of their location and resource characteristics, fully develop renewable energy resources, such as wind energy and marine energy with less environmental pollution, and increase the proportion of renewable energy consumption in production. Second, increase investment in pollution reduction technology, develop technology-intensive industries [57], avoid inefficient industrial clusters, and achieve the transformation and upgrading of technology industry. Third, formulate regulations for cleaner production and reduce the pollution caused by enterprises’ production [58].

5. Conclusions

Based on panel data of China’s provinces and cities from 2003 to 2016, this article takes EWP as the research object. By constructing an index system, this article uses the superefficient SBM model to measure the EWP of provinces and cities in China. On the basis of time series analysis and spatial correlation analysis of the global Moran’s I index, traditional and spatial Markov probability transfer matrices are established. Through an analysis of the spatial and temporal characteristics of EWP, this article forecasts the evolution trend for a certain period in the future and discusses the influences of geographical spatial patterns on the spatial and temporal evolution of EWP and provides relevant policy suggestions according to the actual situation. We present the following main conclusions below.
From the perspective of time series evolution, the EWP in China declined from 2003 to 2016. In general, the EWP in the east is greater than that in the central region, and the EWP in the central region is greater than that in the west. Taking 2009 as the dividing point, although the EWP of each province and city did not significantly improve, the EWP of most provinces and cities remained unchanged, and the downward transfer trend of EWP types in the western region was restrained with a certain spatial spillover effect.
From the perspective of spatial evolution patterns, the results of the global Moran’s I index show that the EWP in China has a significant positive correlation with the spatial distribution. The traditional Markov probability transfer matrix shows that EWP has the possibility of converging to low and high levels. The EWP is presently difficult to achieve large, abrupt transfers. The spatial Markov probability transfer matrix shows that under different neighborhood backgrounds, the types of EWP transfer probability in each province and city are different. If the provinces and cities surrounding a province are in a state of high ecological welfare, the probability of upward transfer of the EWP state in the province will increase; if the provinces and cities surrounding a province are at a low EWP level, the probability of downward transfer of the EWP state in the province will increase.
From the long-term evolution trend, most provinces and cities will still be in a low EWP level for a certain period in the future. The long-term evolution trend of China’s EWP level is not clearly affected by the geographical spatial pattern but is affected by the current state level over a certain period of time, the level of resource consumption growth, and the level of welfare level output growth for a long period.
In view of the current situation of China’s EWP, the following policy recommendations are put forward to improve China’s EWP and provide a reference for other countries and regions. The first recommendation is to set up special laws and regulations for resource utilization and ecological protection. The second recommendation is to promote and improve the mechanism of public participation in the rational utilization of resources and the protection of the ecological environment. The third recommendation is to establish a dynamic monitoring system for resource utilization and ecological environmental protection. The fourth recommendation is to strengthen structural adjustment and accomplish high-quality economic development.
The EWP plays an important role in the implementation of sustainable development agenda, the improvement of people’s wellbeing and the promotion of high-quality economic development. However, it is necessary to realize that there is still a lot of work to be done to the further study of EWP. This paper established the evaluation index on the basis of quantifiable and available data. For some indicators that are difficult to obtain or cannot be quantified, such as indicators reflecting the input of forest, biological species, mineral resources, etc., have not been included in the index system of this paper. In addition, in terms of output, indicators such as residents’ life satisfaction, which reflect the subjective welfare are difficult to quantify, are not included, either. Therefore, building a more comprehensive and reliable index system is the difficulty and direction of improving EWP study in the future. In addition, this paper uses spatial Markov chain to study the impact of geographical location on the evolution of EWP in the process spatiotemporal evolution. However, limited by the article space, it has not been deeply integrated with GIS analysis method, and has not yet analyzed the impact of spatial factors on the EWP. For further study, we can try to introduce industrial structure, urbanization development and other spatial regression model to solve the problem more effectively.

Author Contributions

Conceptualization, L.Y. and Z.Y.; data curation, M.W.; formal analysis, L.Y.; funding acquisition, L.Y. and T.L.; investigation, T.L.; methodology, Z.Y.; project administration, L.Y.; resources, L.Y. and T.L.; software, J.N.; supervision, Z.Y.; validation, Z.Y.; visualization, M.W. and J.N.; writing—original draft, L.Y.; writing—review & editing, Z.Y. All authors have read and agreed to the published version of the manuscript.

Funding

This study was supported by the National Natural Science Foundation of China (No. 71864016), the Startup Foundation of Northwest A&F University (No.2452019003), the Fundamental Research Funds of Northwest A&F University (No. 2452020092), the Fundamental Research Funds of Northwest A&F University (No. 2017RWYB04).

Institutional Review Board Statement

Not applicable.

Informed Consent Statement

Not applicable.

Data Availability Statement

Data available on request due to restrictions eg privacy or ethical. The data presented in this study are available on request from the corresponding author. The data are not publicly available due to one co-author’s ongoing study using this and related data.

Conflicts of Interest

The authors have no conflict of interest to declare.

References

  1. Lu, X. Research on the Coordinated Development of Economy and Society; Intellectual Property Press: Beijing, China, 2009. [Google Scholar]
  2. Max-Neef, M. Economic growth and quality of life: A threshold hypothesis. Ecol. Econ. 1995, 15, 115–118. [Google Scholar] [CrossRef]
  3. Philip, L.; Matthew, C. The end of economic growth? A contracting threshold hypothesis. Ecol. Econ. 2010, 69, 2213–2223. [Google Scholar]
  4. Yacouba, K.; Halil, A. Human well-being versus ecological footprint in MENA countries: A trade-off? J. Environ. Manag. 2020, 263, 1–16. [Google Scholar]
  5. Toth, G.; Szigeti, C. The historical ecological footprint: From over-population to over-consumption. Ecol. Indic. 2016, 60, 283–291. [Google Scholar] [CrossRef]
  6. Pirgmaier, E. The neoclassical trojan horse of steady-state economics. Ecol. Econ. 2017, 133, 52–61. [Google Scholar] [CrossRef]
  7. Daly, H.E. Economics in a Full World. Sci. Am. 2005, 293, 100–107. [Google Scholar] [CrossRef] [PubMed]
  8. Victor, P. Questioning Economic Growth. Nature 2010, 468, 370–371. [Google Scholar] [CrossRef]
  9. Jorgenson, A.; Alekseyko, A.; Giedraitis, V. Energy consumption, human well-being, and economic development in central and eastern European nations: A cautionary tale of sustainability. Energy Policy 2014, 66, 419–427. [Google Scholar] [CrossRef]
  10. O’Neill, D.W. The proximity of nations to a socially sustainable steady state economy. J. Clean. Prod. 2015, 84, 1213–1231. [Google Scholar] [CrossRef] [Green Version]
  11. Mancini, M.S.; Galli, A.; Niccolucci, V.; David, L.; Bastianoni, S.; Wackernagel, M.; Marchettini, N. Ecological footprint: Refining the carbon footprint calculation. Ecol. Indic. 2016, 61, 390–403. [Google Scholar] [CrossRef]
  12. Zang, M.; Zhu, D.; Liu, G. Ecological well-being performance: Concept, connotation and empirical of G20. China Popul. Resour. Environ. 2013, 5, 118–124. [Google Scholar]
  13. Zhang, S.; Zhu, D.; Shi, Q.; Cheng, M. Which countries are more ecologically efficient in improving human well-being? An application of the index of ecological well-being performance. Resour. Conserv. Recycl. 2018, 129, 112–119. [Google Scholar] [CrossRef]
  14. Zhu, D. Ecological economics: Economics and management of sustainable development. Bull. Chin. Acad. Sci. 2008, 6, 520–530. [Google Scholar]
  15. Long, L. Evaluation of ecological civilization construction performance and its international comparison from the perspective of overall well-being. J. Nat. Resour. 2019, 6, 1259–1272. [Google Scholar]
  16. WBCSD. Eco-Efficiency: Leadership for Improved Economic and Environmental Performance; WBCSD: Geneva, Switzerland, 1996. [Google Scholar]
  17. Common, M. Measuring national economic performance without using price. Ecol. Econ. 2007, 1, 92–102. [Google Scholar] [CrossRef]
  18. Abdallah, S.; Thopson, S.; Michaelson, J.; Marks, N.; Steuer, N. The Happy Planet Index 2.0: Why Good Lives Don’t Have to Cost the Earth; New Economics Foundation: London, UK, 2009. [Google Scholar]
  19. Zhu, D.; Zhang, S. Research on ecological wellbeing performance and its relationship with economic growth. China Popul. Resour. Environ. 2014, 9, 59–67. [Google Scholar]
  20. Daly, H.E. Beyond Growth: The Economics of Sustainable Development; Beacon Press: Boston, MA, USA, 1996. [Google Scholar]
  21. Qi, P.; Xu, Y.; Deng, L. A review of ecological well-being performance study home and abroad. J. Shenyang Univ. Technol. (Soc. Sci. Ed.) 2017, 6, 521–526. [Google Scholar]
  22. Veenhoven, R. World database of happiness. Soc. Indic. Res. 1995, 34, 299–313. [Google Scholar] [CrossRef] [Green Version]
  23. Daly, H.E.; Cobb, J.B. For Common Good: Redirecting the Economy Towards Community, the Environment and a Sustainable Future; Beacon Press: Boston, MA, USA, 1989. [Google Scholar]
  24. Long, L. Evaluation of urban ecological well-being performance of Chinese major cities based on two-stage super-efficiency network SBM model. China Popul. Resour. Environ. 2019, 7, 1–10. [Google Scholar]
  25. Long, L.; Wang, X.; Guo, B. Evaluation of urban ecological well-being performance based on revised DEA model—A case study of 35 major cities in China. J. Nat. Resour. 2017, 4, 595–605. [Google Scholar]
  26. Zhu, D.; Zhang, S. Ecological wellbeing performance and further research on sustainable development. J. Tongji Univ. (Soc. Sci. Sect.) 2014, 5, 106–115. [Google Scholar]
  27. Fang, S.; Xiao, Q. Research on regional ecological well-being performance and spatial effect in China. China Popul. Resour. Environ. 2019, 3, 1–10. [Google Scholar]
  28. Feng, J.; Yuan, J. Ecological welfare performance—A new analysis tool for sustainable development. Sci. Technol. Manag. Res. 2016, 12, 240–244. [Google Scholar]
  29. Feng, Y.; Zhong, S.; Li, Q.; Zhao, X.; Dong, X. Ecological well-being performance growth in China (1994–2014): From perspectives of industrial structure green adjustment and green total factor productivity. J. Clean. Prod. 2019, 236, 1–13. [Google Scholar] [CrossRef]
  30. Bian, J.; Zhang, Y.; Shuai, C.; Shen, L.; Ren, H.; Wang, Y. Have cities effectively improved ecological well-being performance? Empirical analysis of 278 Chinese cities. J. Clean. Prod. 2020, 245, 118913. [Google Scholar] [CrossRef]
  31. Bian, J.; Ren, H.; Liu, P. Evaluation of urban ecological well-being performance in China: A case study of 30 provincial capital cities. J. Clean. Prod. 2020, 254, 120109. [Google Scholar] [CrossRef]
  32. Knight, K.W.; Rosa, E.A. The environmental efficiency of well-being: A cross-national analysis. Soc. Sci. Res. 2011, 40, 931–949. [Google Scholar] [CrossRef]
  33. Charnes, A.; Cooper, W.W.; Rhodes, E. Measuring the efficiency of decision making units. Eur. J. Oper. Res. 1978, 6, 429–444. [Google Scholar] [CrossRef]
  34. Banker, R.D.; Charnes, A.; Copper, W.W. Some models for estimating technical and scale inefficiencies in data envelopment analysis. Manag. Sci. 1984, 30, 1078–1092. [Google Scholar] [CrossRef] [Green Version]
  35. Hu, Z.; Zhao, Z.; Zhang, Y.; Jing, H.; Gao, S.; Fang, J. Does “Forage-Livestock Balance” policy impact ecological efficiency of grasslands in China? J. Clean. Prod. 2019, 207, 343–349. [Google Scholar] [CrossRef]
  36. Tone, K. A slacks-based measure of efficiency in data envelopment analysis. Eur. J. Oper. Res. 2001, 3, 498–509. [Google Scholar] [CrossRef] [Green Version]
  37. Tone, K. A slacks-based measure of super-efficiency in data envelopment analysis. Eur. J. Oper. Res. 2002, 1, 32–41. [Google Scholar] [CrossRef] [Green Version]
  38. Tobler, W.R. A computer movie simulating urban growth in the Detroit region. Econ. Geogr. 1970, 46, 234–240. [Google Scholar] [CrossRef]
  39. Anderson, T.W.; Goodman, L.A. Statistical inference about Markov chains. Ann. Math. Stat. 1957, 28, 89–110. [Google Scholar] [CrossRef]
  40. Balzter, H. Markov chain models for vegetation dynamics. Ecol. Model. 2000, 126, 139–154. [Google Scholar] [CrossRef] [Green Version]
  41. Griffith, D.A.; Paelinck, J.H.P. An equation by any other name is still the same: On spatial econometrics and spatial statistics. Anim. Reg. Sci. 2007, 41, 209–227. [Google Scholar] [CrossRef]
  42. Anselin, L. Thirty years of spatial econometrics. Pap. Reg. Sci. 2010, 89, 3–25. [Google Scholar] [CrossRef]
  43. Agovino, M.; Crociata, A.; Sacco, P.L. Proximity effects in obesity rates in the US: A spatial Markov chains approach. Soc. Sci. Med. 2019, 220, 301–311. [Google Scholar] [CrossRef]
  44. Anselin, L.; Gallo, J.L.; Jayet, H. Spatial Panel Economics; Springer: Berlin/Heidelberg, Germany, 2008. [Google Scholar]
  45. Reinhard, S.; Lovell, C.A.K.; Thijssen, G.J. Environmental efficiency with multiple environmentally detrimental variables: Estimated with SFA and DEA. Eur. J. Oper. Res. 2000, 121, 287–303. [Google Scholar] [CrossRef]
  46. Camarero, M.; Castillo, J.; Picazo-Tadeo, A.J.; Tamarit, C. Eco-efficiency and convergence in OECD Countries. Environ. Resour. Econ. 2013, 55, 87–106. [Google Scholar] [CrossRef] [Green Version]
  47. Kuosmanen, T.; Kortelainen, M. Measuring eco-efficiency of production with data envelopment analysis. J. Ind. Ecol. 2005, 9, 59–72. [Google Scholar] [CrossRef]
  48. Cummins, R.A.; Eckersley, R.; Lo, S.K.; Okerstrom, E. The Australian unity wellbeing index: An overview. Soc. Indic. Network News 2003, 76, 1–4. [Google Scholar]
  49. Hall, J.; Giovannini, E.; Morrone, A.; Ranuzzi, G. A Framework to Measure the Progress of Societies; OECD Statistics Working Paper: Paris, France, 2010. [Google Scholar]
  50. United Nations Development Programme. Human Development Report; Oxford University Press: New York, NY, USA, 1990. [Google Scholar]
  51. Kuang, B.; Lu, X.; Zhou, M.; Chen, D. Provincial cultivated land use efficiency in China: Empirical analysis based on the SBM-DEA model with carbon emissions considered. Technol. Forecast. Soc. Chang. 2020, 151, 119874. [Google Scholar] [CrossRef]
  52. Wang, S.; Gao, S.; Huang, Y.; Shi, C. Spatiotemporal evolution of urban carbon emission performance in China and prediction of future trends. J. Geogr. Sci. 2020, 30, 757–774. [Google Scholar] [CrossRef]
  53. Berkel, R.V.; Fujita, T.; Hashimoto, S.; Yong, G. Industrial and urban symbiosis in Japan: Analysis of the Eco-Town Program 1997–2006. J. Environ. Manag. 2009, 90, 1544–1556. [Google Scholar] [CrossRef] [PubMed]
  54. Charnley, S.; Engelbert, B. Evaluating public participation in environmental decision-making: EPA’s superfund community involvement program. J. Environ. Manag. 2005, 77, 165–182. [Google Scholar] [CrossRef] [PubMed]
  55. Sinclair, A.J.; Diduck, A.P. Reconceptualizing public participation in environmental assessment as EA civics. Environ. Impact Assess. Rev. 2017, 62, 174–182. [Google Scholar] [CrossRef]
  56. Gurney, K.R.; Romero-Lankao, P.; Seto, K.C.; Hutyra, L.R.; Duren, R.; Kennedy, C.; Pincetl, S. Track urban emissions on a human scale. Nature 2015, 525, 179–181. [Google Scholar] [CrossRef] [Green Version]
  57. Zhu, X.; Zhang, P.; Wei, Y.; Li, Y.; Zhao, H. Measuting the efficiency and driving factors of urban land use based on the DEA method and the PLS-SEM model—A case study of 35 large and medium-sized cities in China. Sustain. Cities Soc. 2019, 50, 101646. [Google Scholar] [CrossRef]
  58. Yang, Z.; Wei, X. The measurement and influences of China’s urban total factor energy efficiency under environmental pollution: Based on the game cross-efficiency DEA. J. Clean. Prod. 2019, 209, 439–450. [Google Scholar] [CrossRef]
1
2
3
Figure 1. EF and HDI data of China from 2003–2016.
Land 10 00012 g001
Figure 2. Evolutionary trend of ecological well-being performance in China from 2003–2016.
Land 10 00012 g002
Figure 3. Spatial distribution of ecological well-being performance type transfer in China in different stages.
Land 10 00012 g003
Table 1. Index system of ecological well-being performance in China.
CategoryPrimary IndicatorsSecondary IndicatorsTertiary Indicators
Input indexResource consumptionEnergy consumptionPer capita consumption of standard coal
Land consumptionConstruction land resources per capita
Water consumptionWater consumption per capita
Environmental pollutionExhaust emissionsSO2 emissions per capita
Smoke and dust emission per capita
Wastewater dischargeChemical oxygen demand emissions per capita
Ammonia nitrogen emissions per capita
Solid waste dischargeProduction of general industrial solid waste per capita
Output indicatorsWelfare levelEconomic development levelGDP Per capita
Education development levelAverage year of education
Health care development levelAverage life expectancy
Table 2. Traditional Markov probability transfer matrix of ecological well-being performance in China.
t/t + 1n1234
1900.95560.044400
21020.14710.83330.01960
3970.01030.10310.85570.0309
4101000.09900.9010
Table 3. Spatial Markov probability transfer matrix of ecological well-being performance in China.
Space Lagt/t + 1n1234
1100000
200000
300000
400000
21390.89740.102600
2240.29170.708300
3200.50000.50000
400000
31501.0000000
2390.12820.82050.05130
3620.01610.08060.87100.0323
457000.08770.9123
4111.0000000
2390.07690.923100
33300.12120.84850.0303
444000.11360.8864
Table 4. Evolutionary trend prediction of ecological well-being performance type transfer in China.
Space Lag1234
Initial state 0.06670.23330.33330.3667
Limit distribution without considering spatial lag 0.73190.21850.03790.0118
Limit distribution considering spatial lag1////
20.73980.260200
31.0000000
41.0000000
Publisher’s Note: MDPI stays neutral with regard to jurisdictional claims in published maps and institutional affiliations.

