Spatial Agglomeration Pattern and Driving Factors of Grain Production in China since the Reform and Opening Up


Abstract
:1. Introduction
2. Materials and Methods
2.1. Variable Selection
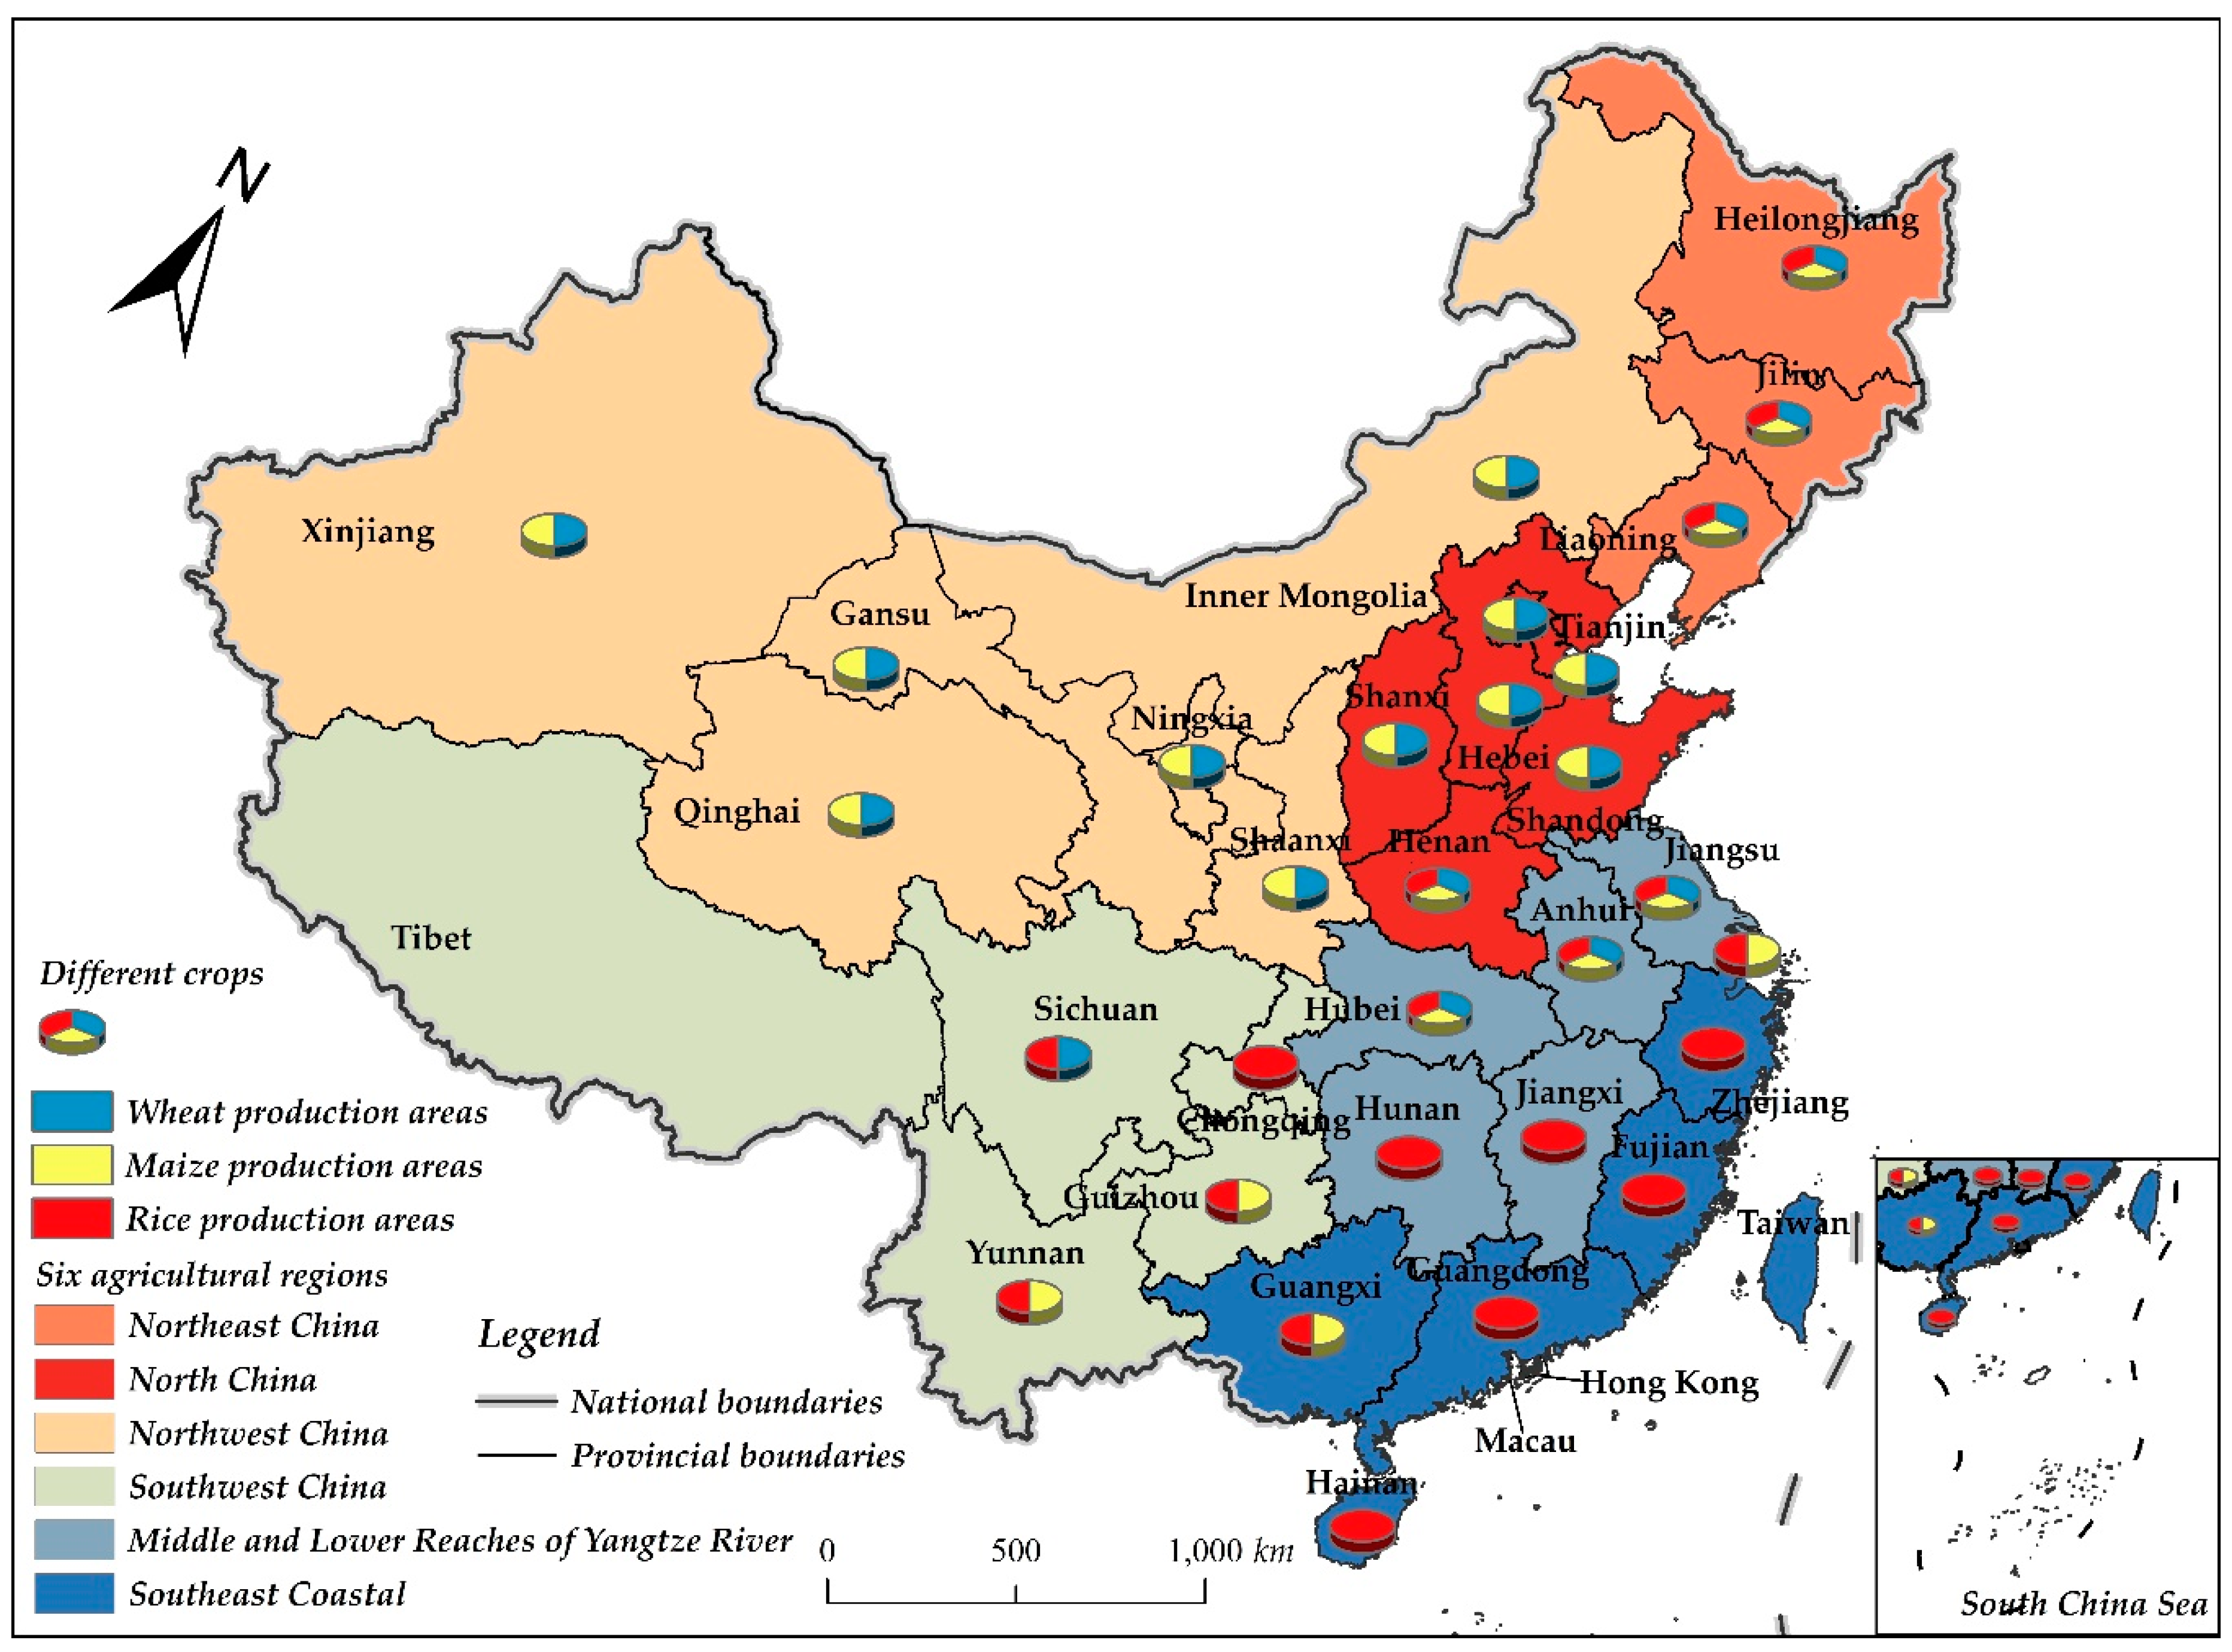
2.2. Data Sources and Regional Distribution
2.3. Model Specification
2.3.1. Standard Deviation Elliptic-Gravity Center Model
2.3.2. Spatial Econometric Models (SEM, SLM)
3. Results
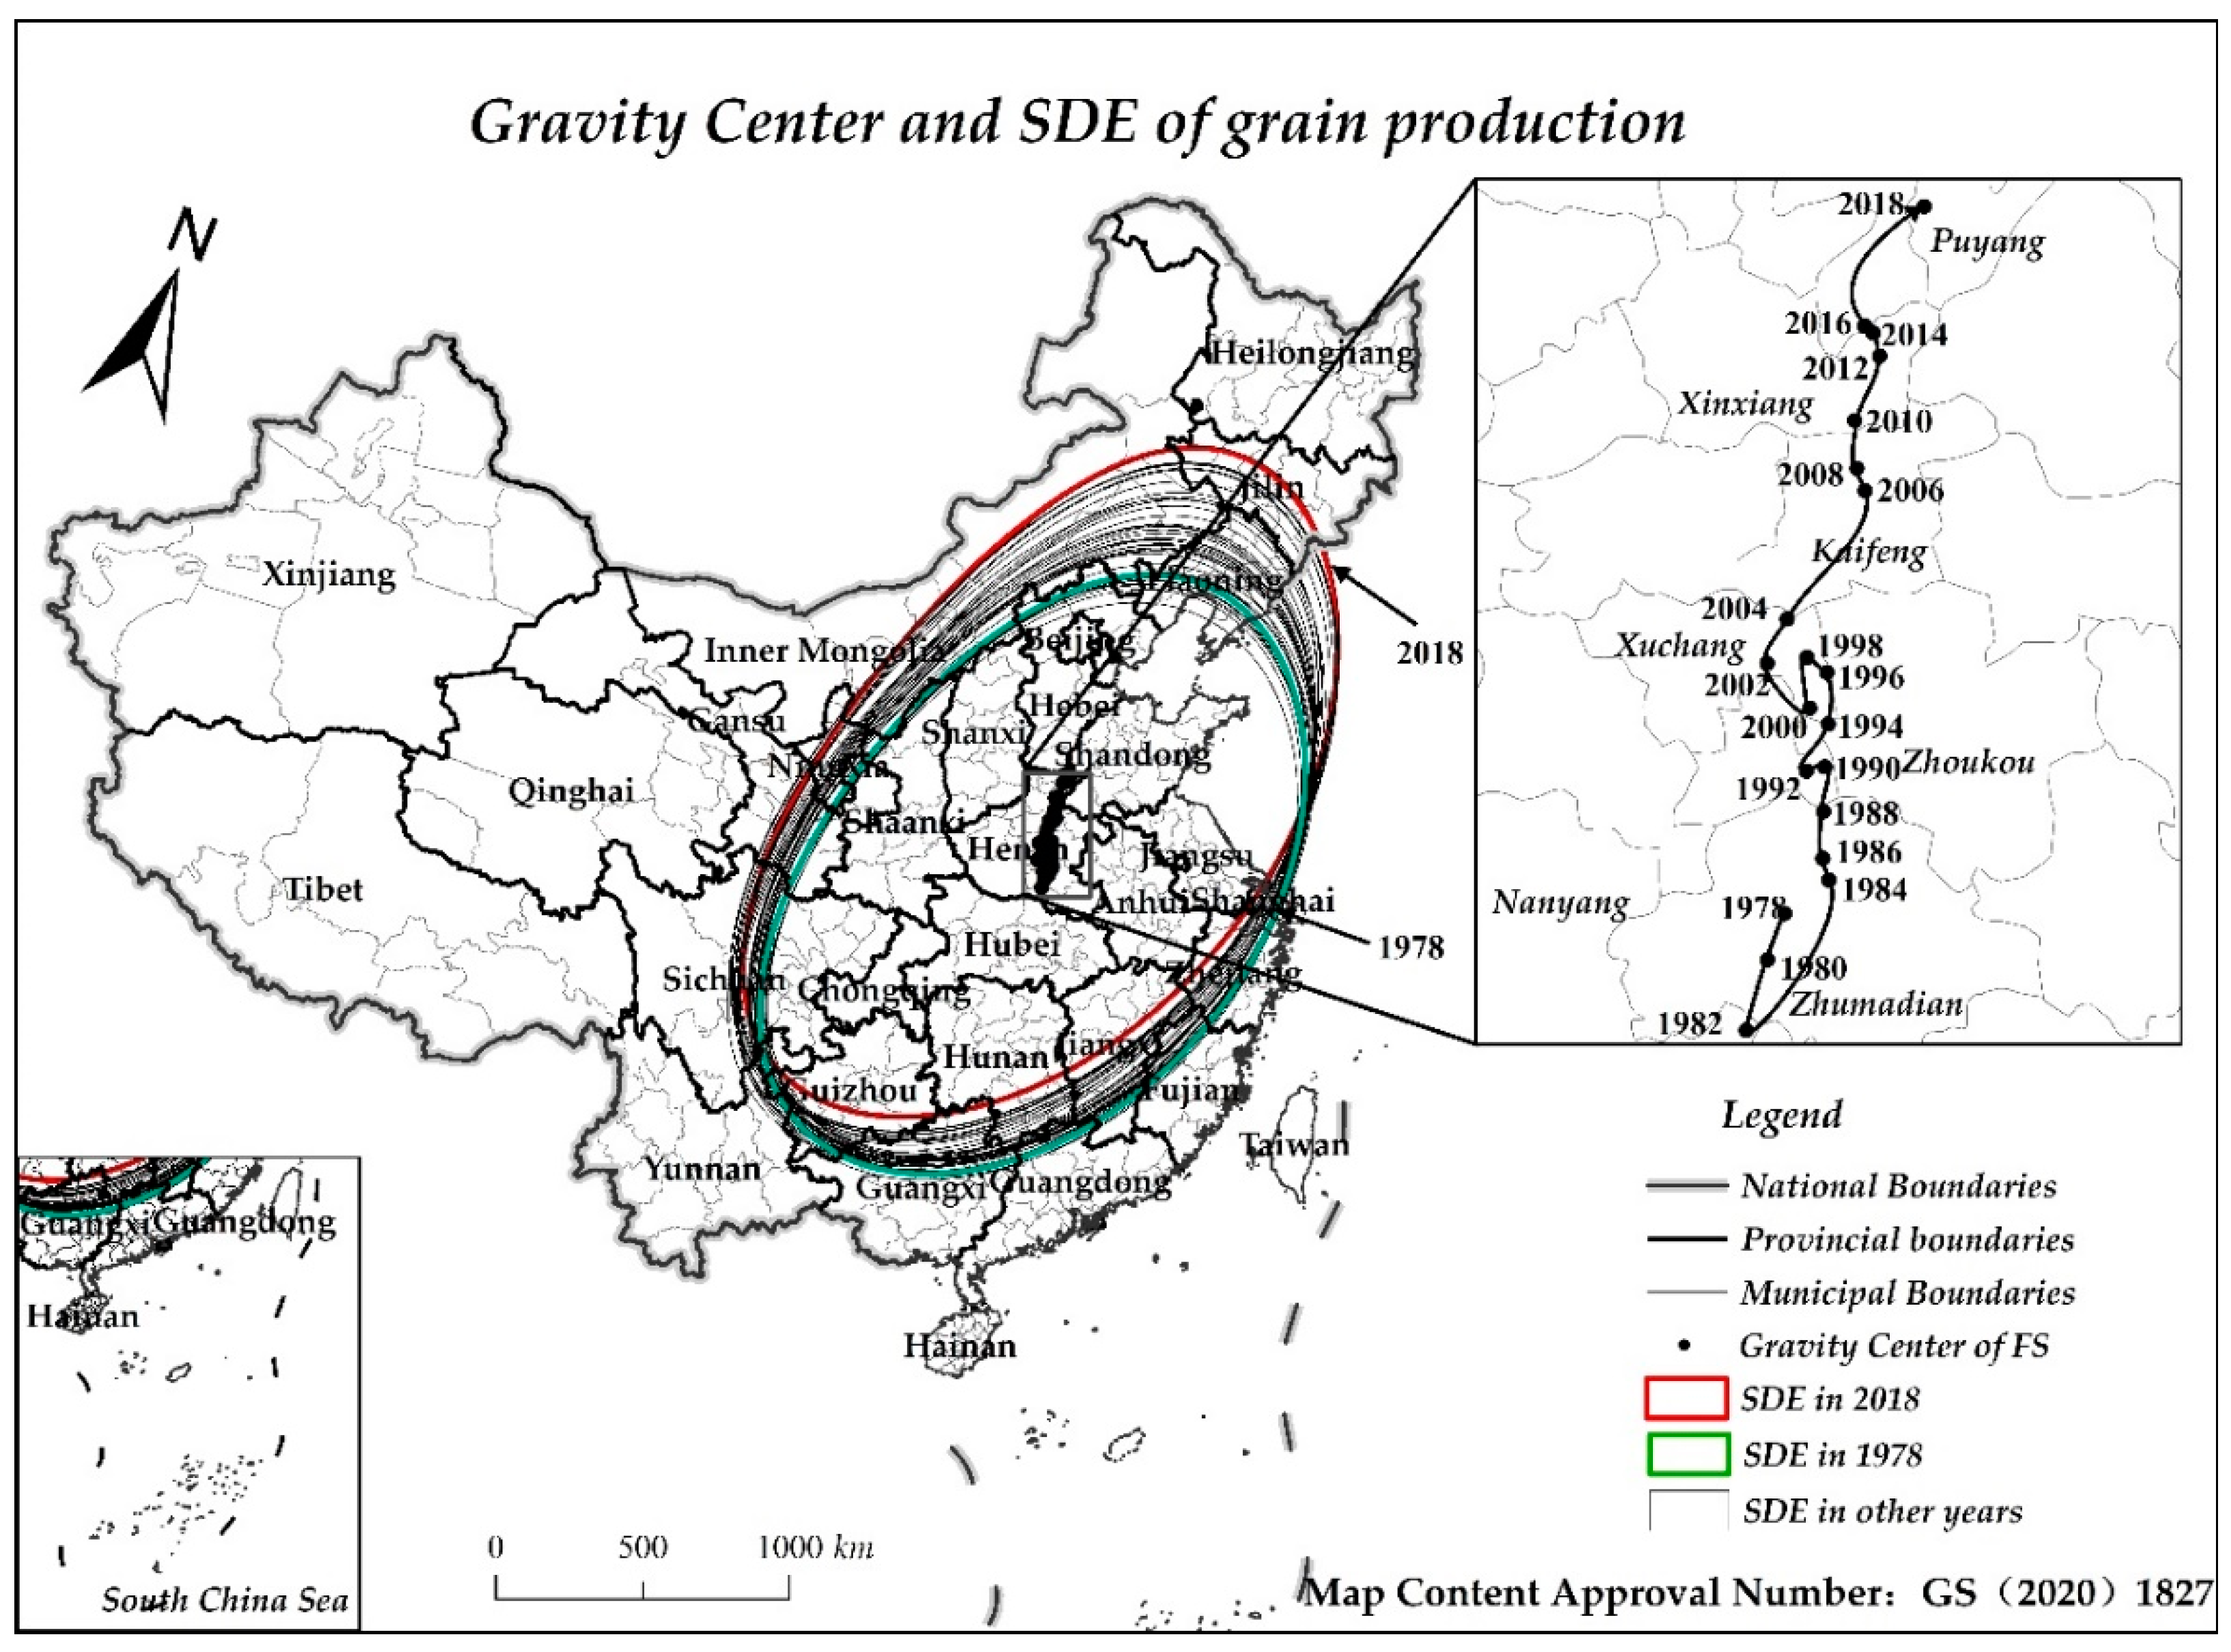
3.1. The Gravity Center and Standard Deviation Ellipses of China’s Grain Production
3.1.1. Overall Grain Production
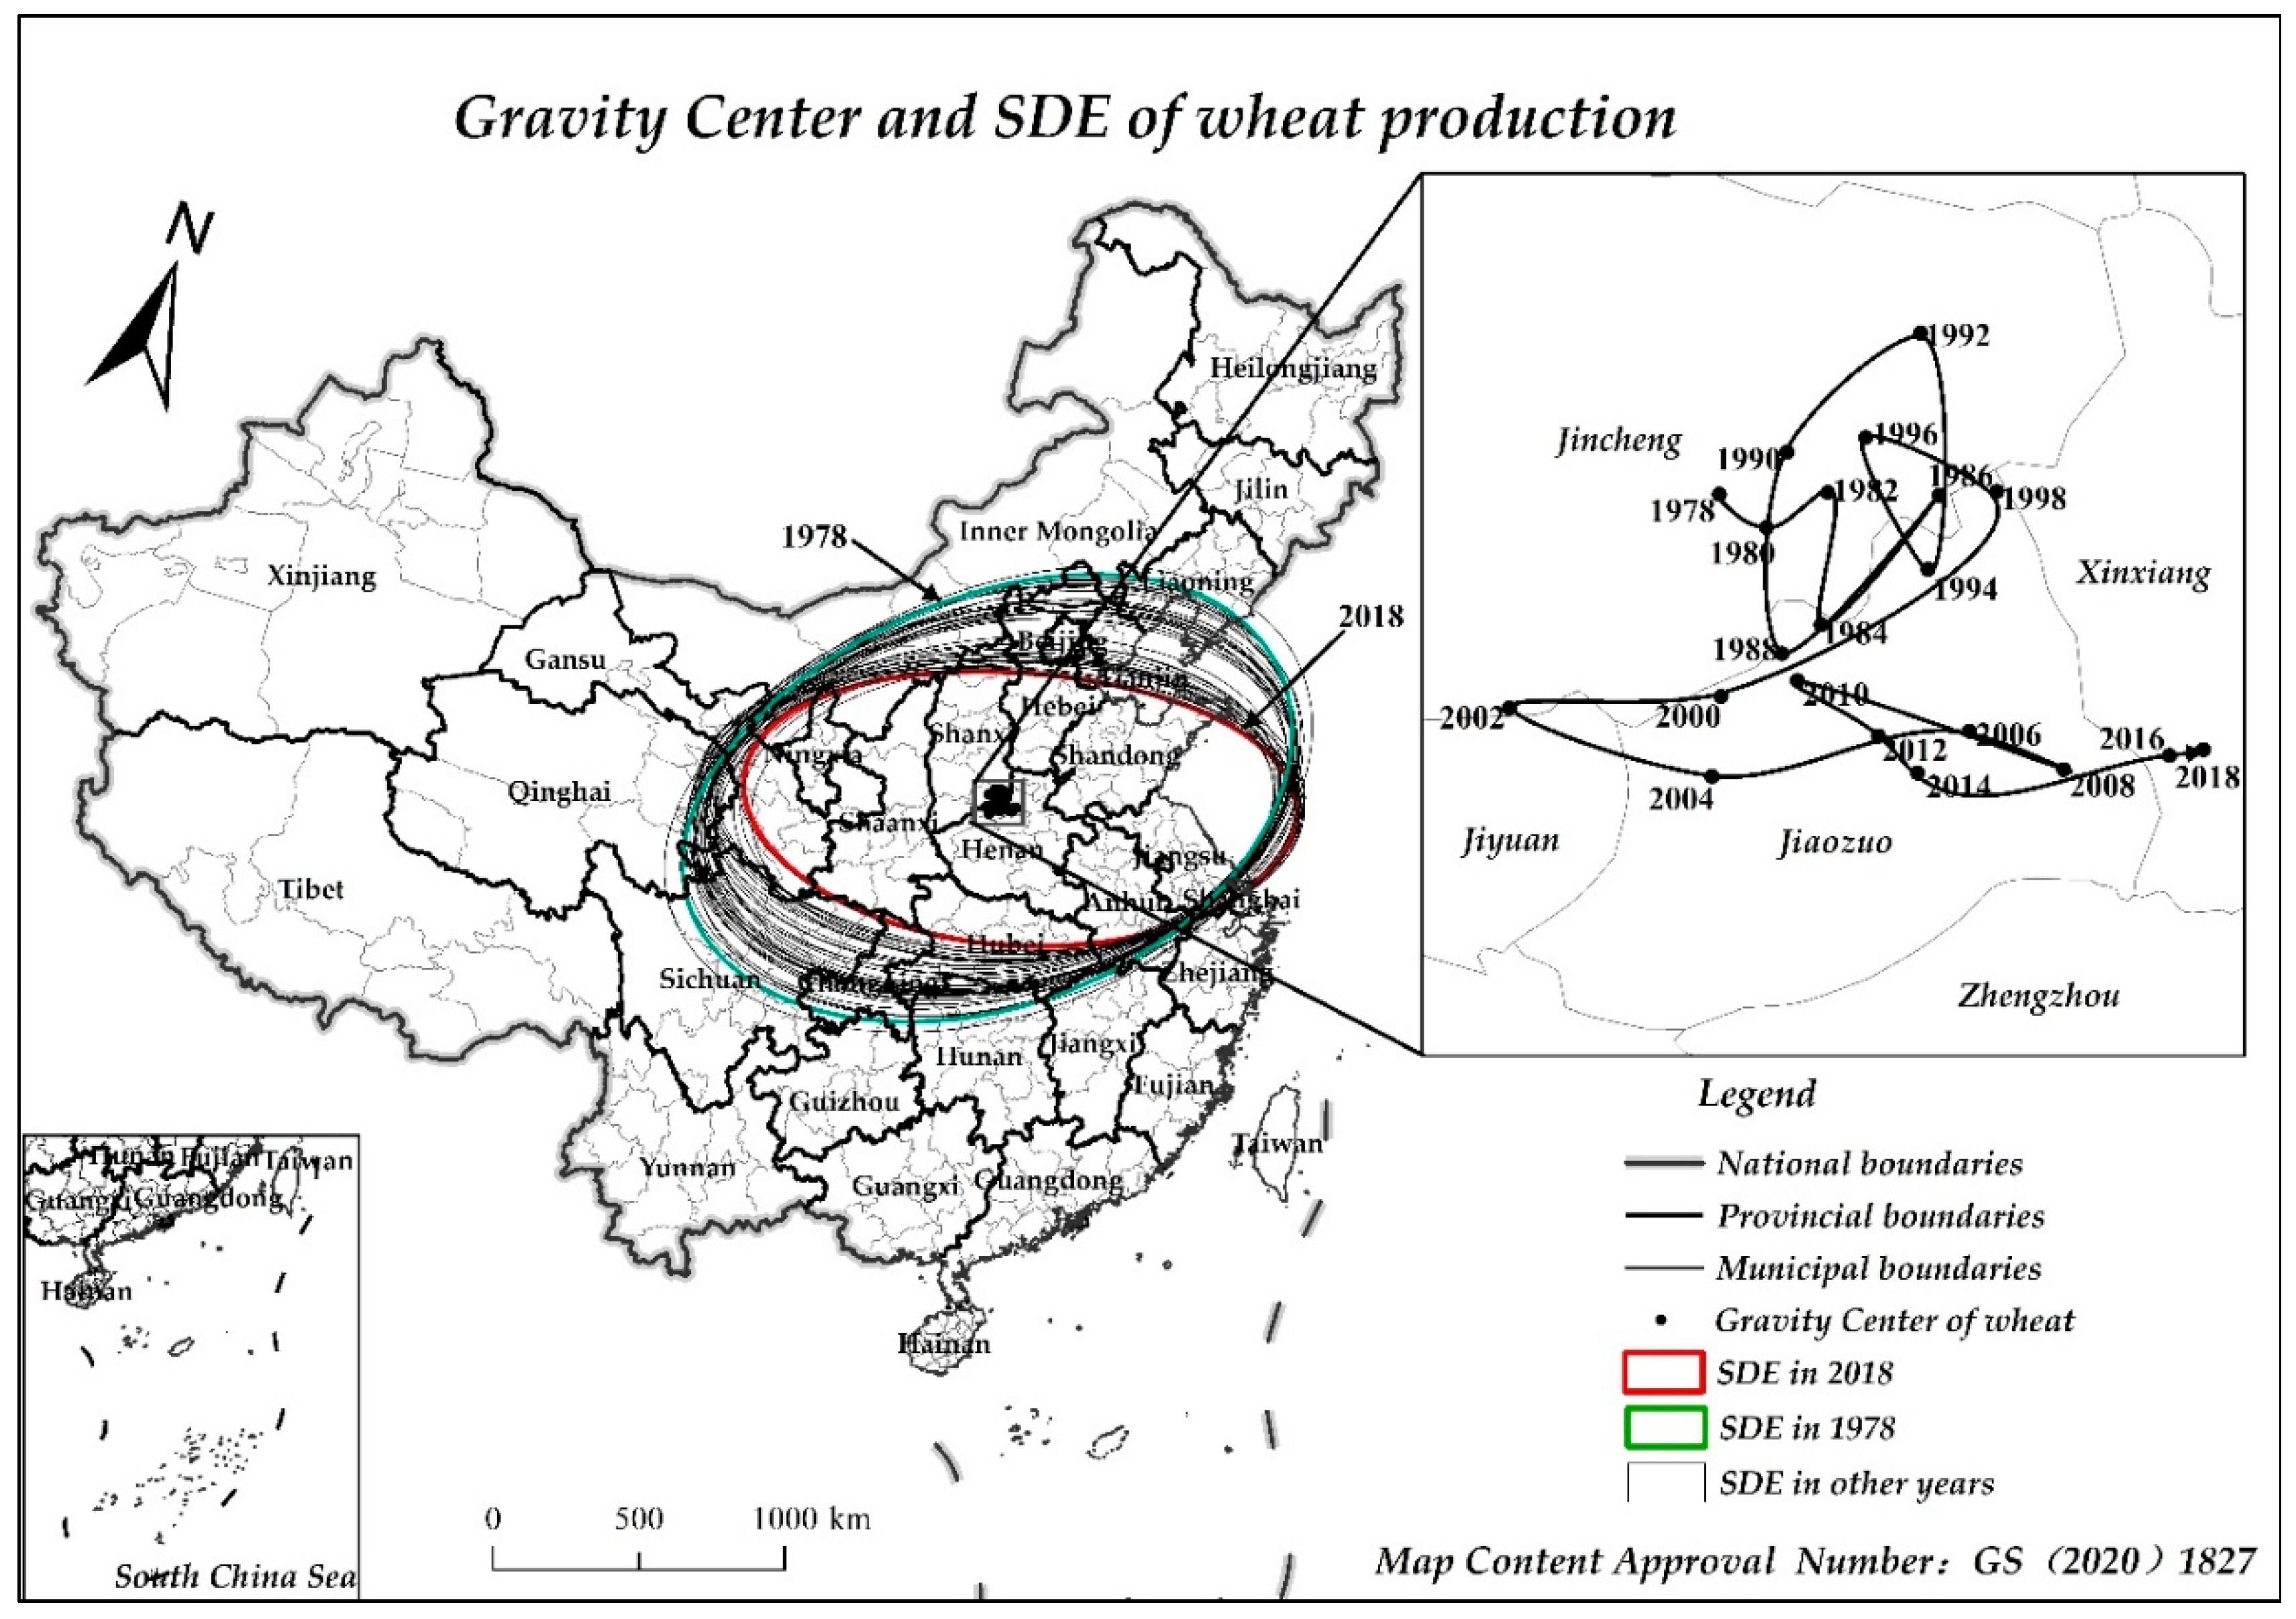
3.1.2. Wheat Production
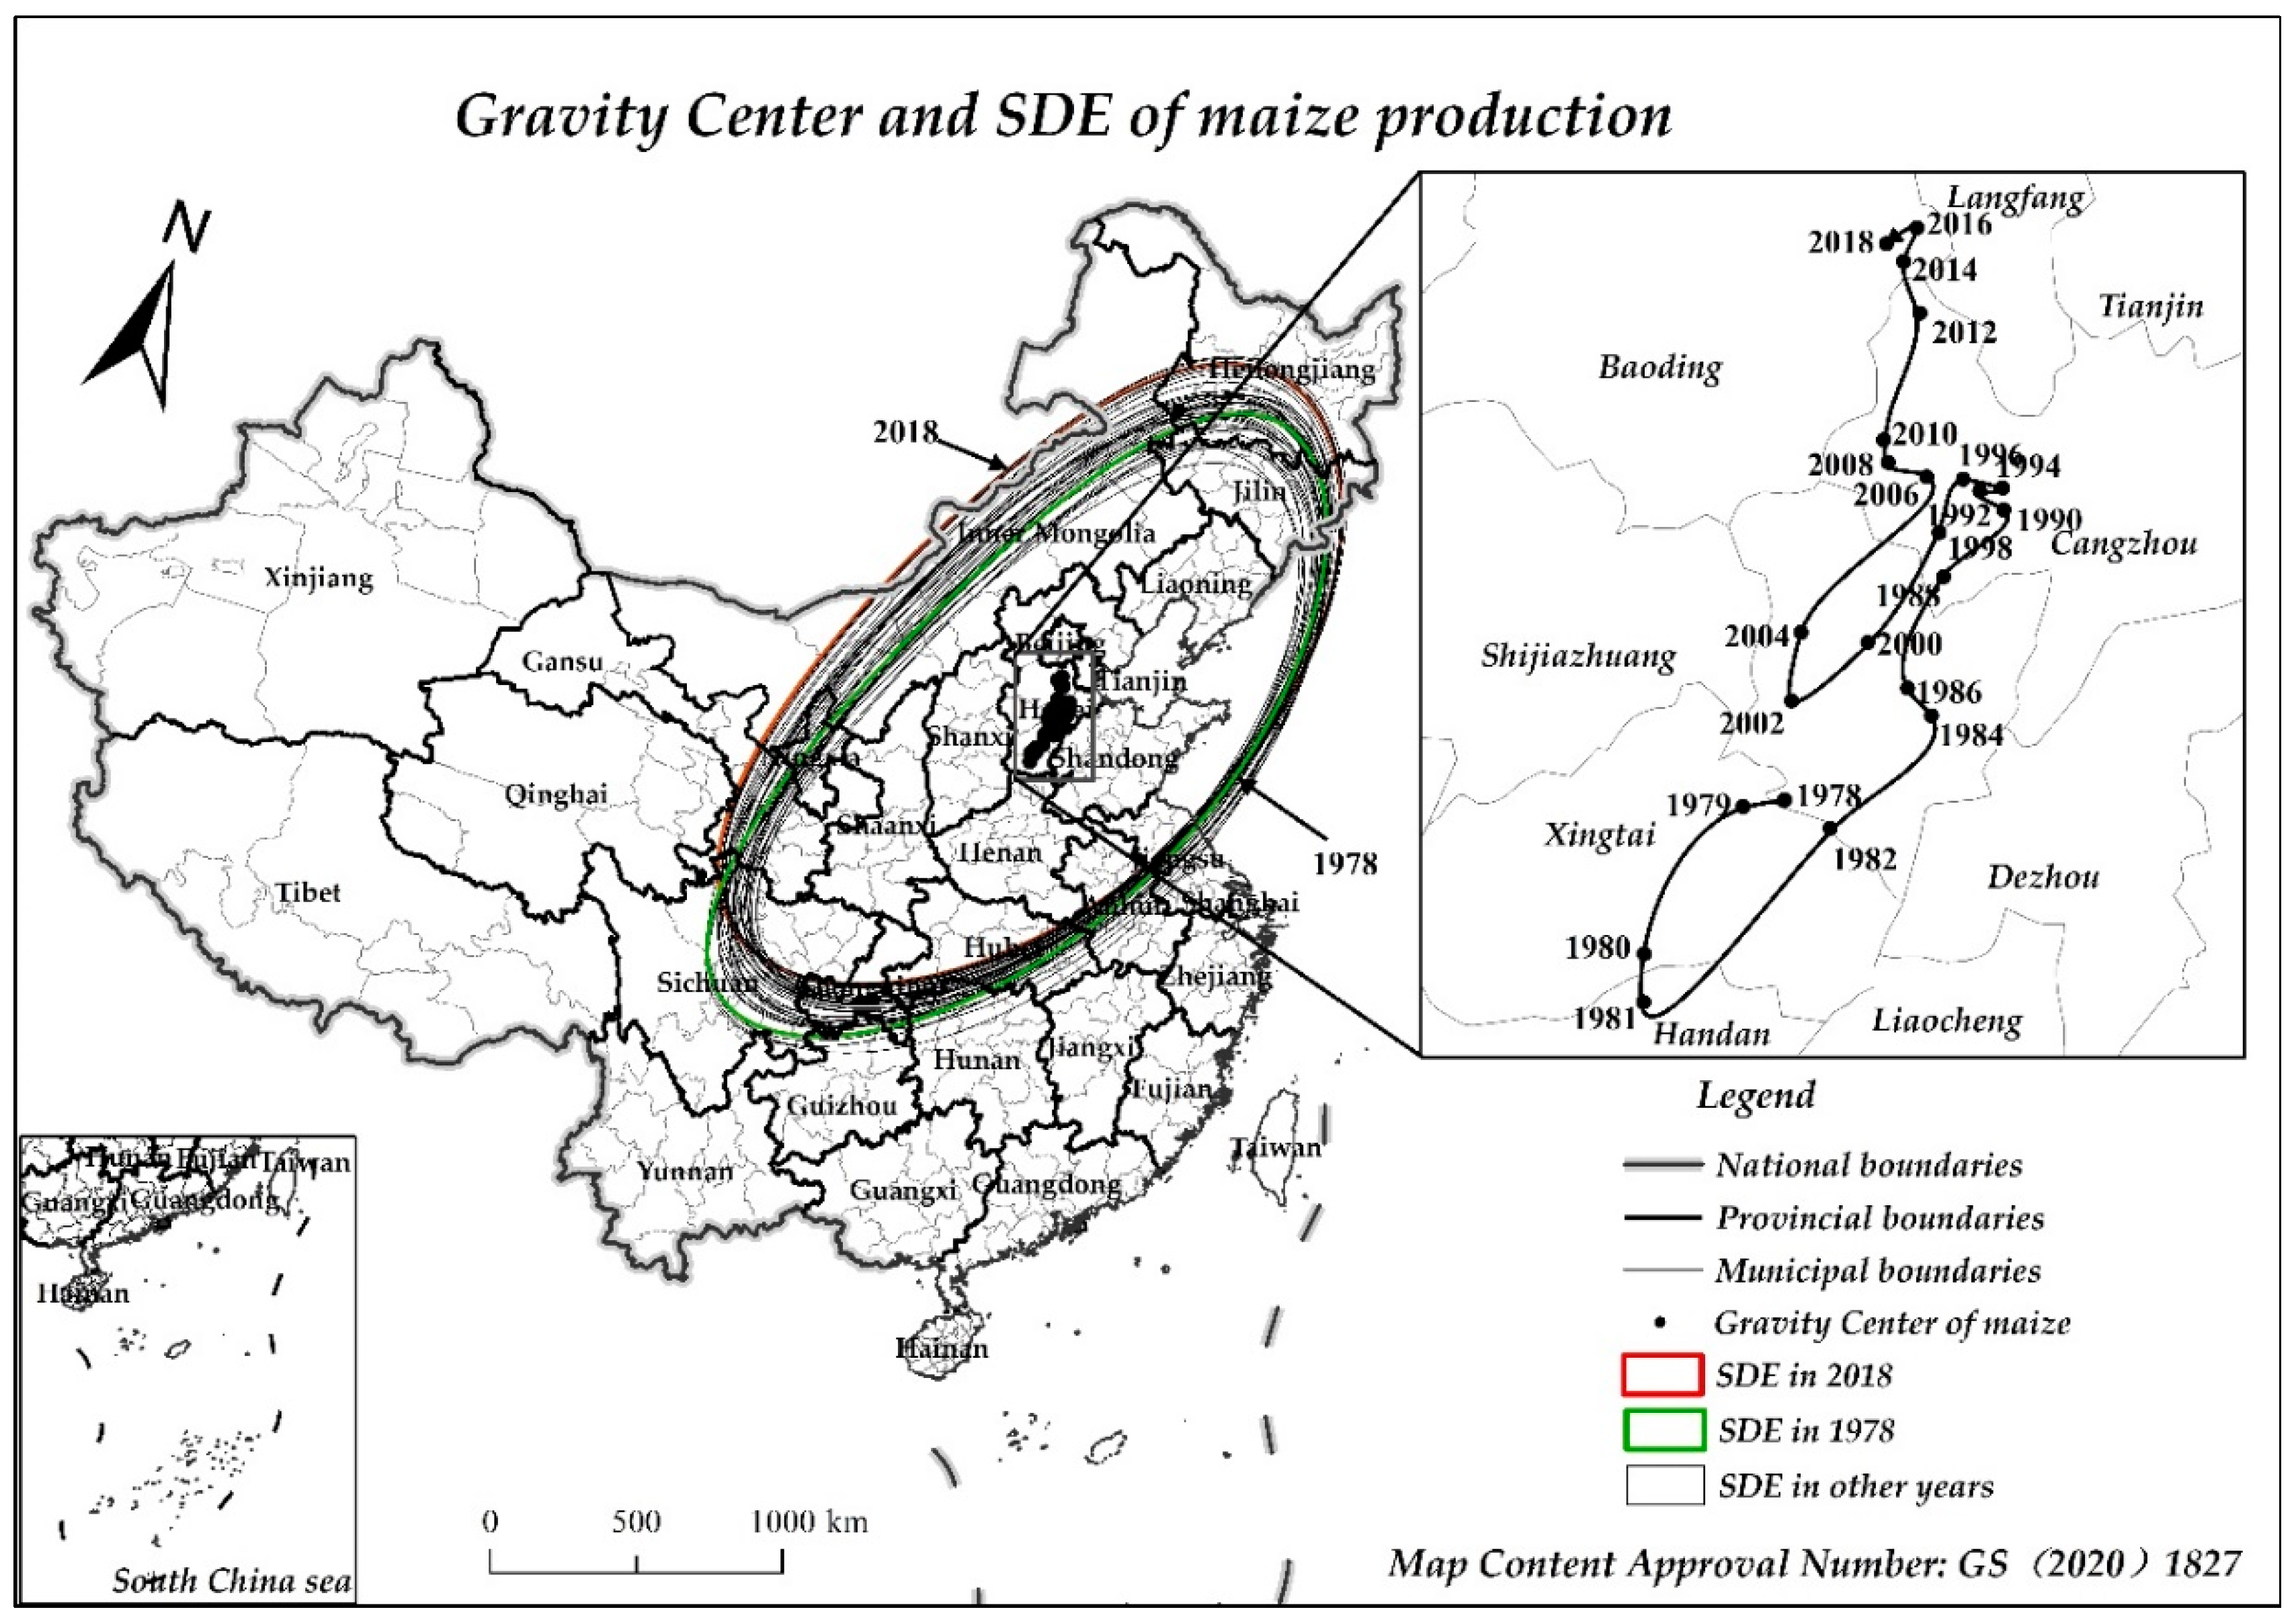
3.1.3. Maize Production
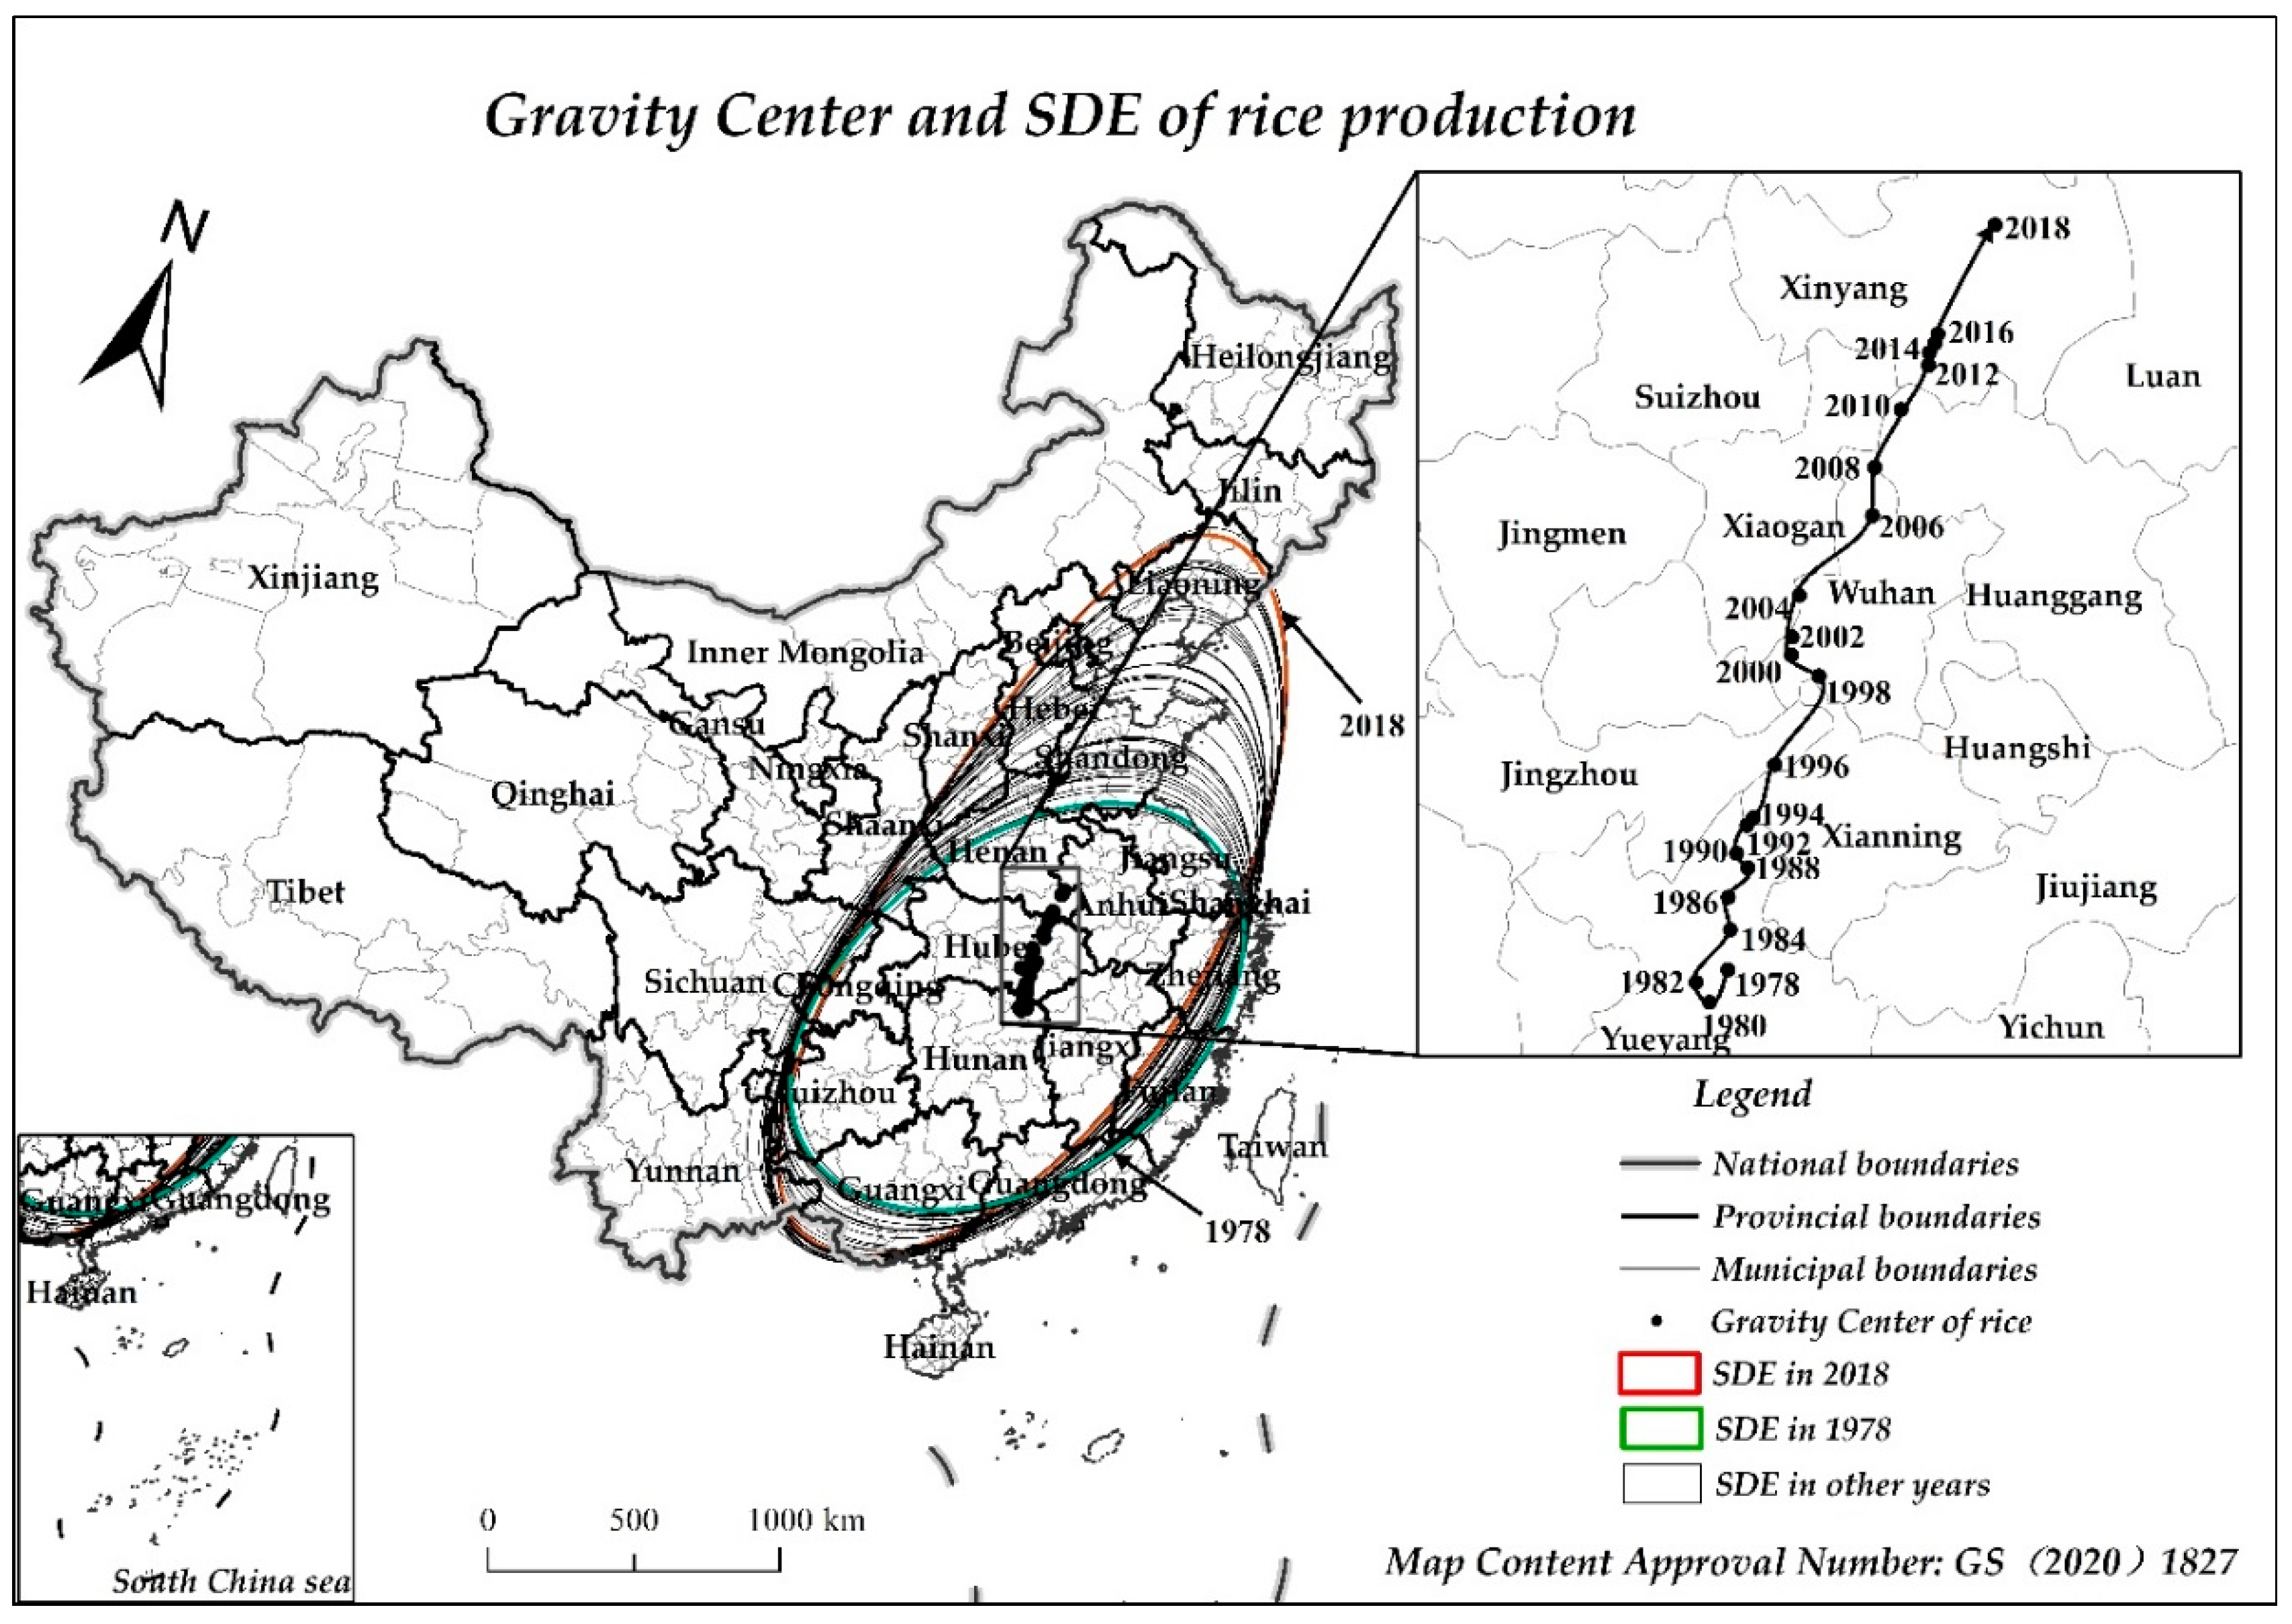
3.1.4. Rice Production
3.2. Analysis of the Driving Factors of Grain Production in China
3.2.1. Spatial Correlation Test and Econometric Model Selection
3.2.2. At the Level of GP and Different Crops
3.2.3. At the Level of Different Regions
4. Discussion and Conclusions
Author Contributions
Funding
Institutional Review Board Statement
Informed Consent Statement
Data Availability Statement
Conflicts of Interest
References
- Pecl, G.T.; Araújo, M.B.; Bell, J.D.; Blanchard, J.; Bonebrake, T.C.; Chen, I.C.; Clark, T.D.; Colwell, R.K.; Danielsen, F.; Evengård, B.; et al. Biodiversity redistribution under climate change: Impacts on ecosystems and human well-being. Science 2017, 355. [Google Scholar] [CrossRef] [PubMed]
- Galanakis, C.M. The Food Systems in the Era of the Coronavirus (COVID-19) Pandemic Crisis. Foods 2020, 9, 523. [Google Scholar] [CrossRef]
- Ministry of Land and Resources, PRC. 2016 China Land Resources Bulletin. 2017. Available online: http://www.mnr.gov.cn/sj/tjgb/ (accessed on 11 December 2020).
- Lu, W.C.; Mei, Y. Empirical studies on the variation and contributing factors of regional grain production structure in China: Based on spatial econometrics models. China Agric. Univ. J. Soc. Sci. Ed. 2007, 140–152. [Google Scholar] [CrossRef]
- Zhiyu, X.; Zhenwei, S.; Aixing, D. Regional changes of production layout of main grain crops and their actuation factors during 1981–2008 in China. J. Nanjing Agric. Univ. 2013, 36, 79–86. [Google Scholar] [CrossRef]
- Zhong, F.N.; Lu, W.Y.; Xu, Z.G. Is it not conducive to grain production for rural labor force to go out go out to work? Analysis on the behavior and constraints of farmers’ element substitution and planting structure adjustment. Chin. Rural Econ. 2016, 7, 36–47. [Google Scholar]
- Huang, A.J. The change law of regional pattern of grain production in China. Chin. Rural Econ. 1995, 2, 31–33. [Google Scholar]
- Ministry of Agriculture and Rural Affairs, PRC. The No. 1 document of the Communist Party of China Central Committee. 2019. Available online: http://www.moa.gov.cn/ztzl/jj2019zyyhwj/2019zyyhwj/ (accessed on 11 December 2020).
- Gao, F. Regional changes of grain production in China: 1978–2003. Manag. World 2005, 70–78, 87. [Google Scholar] [CrossRef]
- Deng, Z.B.; Feng, Y.G.; Zhang, J.L.; Wang, J. Analysis on the characteristics and tendency of grain production’s spatial distribution in China. Econ. Geogr. 2013, 33, 117–123. [Google Scholar] [CrossRef]
- Lu, Q.; Lv, M.L. Trends and basic causes of the regional pattern changes in China’s grain production since 1950’s. Prog. Geogr. 1997, 16, 34–39. [Google Scholar]
- Xu, H.Y.; Zhu, H.Y. Spatial change of China’s grain production based on geographical division of natural factors during 1990–2010. Acta Geogr. Sin. 2015, 70, 582–590. [Google Scholar] [CrossRef]
- Yang, Z.H.; Li, J.K.; Han, C.X.; Liu, H.G. The evolution path of China’s grain production base and the influencing factors. Res. Agric. Mod. 2019, 40, 36–43. [Google Scholar] [CrossRef]
- Li, B.K. Study on regional advantages of grain production in China. Manag. World 1996, 151–160. [Google Scholar] [CrossRef]
- Ji, M.F. Analysis on regional comparative advantage of grain production in China. Issues Agric. Econ. 1996, 5, 19–24. [Google Scholar]
- Zheng, Y.G.; Kuang, C.J.; Jiao, H.P. Discussion on the evolution causes of the South-to-North grain transfer to the North-to-South grain transport. Res. Chin. Econ. Hist. 1999, 1, 99–106, 162. [Google Scholar]
- Lu, W.C.; Huang, Z.H. Prospects of grain supply and demand in China: A regionalized multimarket model simulation. Econ. Res. J. 2004, 8, 94–104. [Google Scholar]
- Lobell, D.B.; Burke, M.B.; Tebaldi, C.; Mastrandrea, M.D.; Falcon, W.P.; Naylor, R.L. Prioritizing Climate Change Adaptation Needs for Food Security in 2030. Science 2008, 319, 607–610. [Google Scholar] [CrossRef]
- Song, X.Q.; Ouyang, Z. Key Influencing Factors of Food Security Guarantee in China during 1999–2007. Acta Geogr. Sin. 2012, 67, 793–803. [Google Scholar]
- Lu, X.H.; Ke, N.; Kuang, B. Regional differences and influencing factors of China’s grain production capacity. China Land Sci. 2020, 34, 53–62. [Google Scholar] [CrossRef]
- Yawson, D.O.; Mulholland, B.J.; Ball, T.; Adu, M.O.; Mohan, S.; White, P.J. Effect of Climate and Agricultural Land Use Changes on UK Feed Barley Production and Food Security to the 2050s. Land 2017, 6, 74. [Google Scholar] [CrossRef] [Green Version]
- Yang, C.; Lu, W.C. Study on regional pattern of county grain production based on spatial metering economic model. J. Agrotech. Econ. 2010, 5, 24–29. [Google Scholar]
- Wu, J.Z.; Zhang, J.H.; Kong, F.T. Spatial pattern evolution of grain production and consumption in China. J. Agrotechn. Econ. 2015, 11, 46–52. [Google Scholar]
- Chen, H.; Wang, Q.Z.; Zhou, H. Empirical analysis of corn spatial distribution variation in China. Econ. Geogr. 2015, 35, 165–171. [Google Scholar] [CrossRef] [Green Version]
- Lobell, D.B.; Field, C.B. Global scale climate–crop yield relationships and the impacts of recent warming. Environ. Res. Lett. 2007, 2, 014002. [Google Scholar] [CrossRef]
- Ip, E.H.; Saldana, S.; Arcury, T.A.; Grzywacz, J.G.; Trejo, G.; Quandt, S.A. Profiles of Food Security for US Farmworker Households and Factors Related to Dynamic of Change. Am. J. Public Health 2015, 105, e42–e47. [Google Scholar] [CrossRef] [PubMed]
- Hu, H.Z.; Wang, J.L.; Wang, Y.; Long, X.Y. Spatial-temporal pattern and influencing factors of grain production and food security at county level in the Yangtze River Basin from 1990 to 2015. Resour. Environ. Yangtze Basin 2019, 28, 359–367. [Google Scholar] [CrossRef]
- Delvina, G.; Bullen, C.R.; Ni, M.C. Environmental influences on food security in high-income countries. Nutr. Rev. 2009, 68, 1–29. [Google Scholar] [CrossRef]
- Deng, Z.; Zhao, Q.; Bao, H.X.H. The Impact of Urbanization on Farmland Productivity: Implications for China’s Requisition–Compensation Balance of Farmland Policy. Land 2020, 9, 311. [Google Scholar] [CrossRef]
- Tobler, W.R. A computer model simulation of urban growth in the Detroit region. Econ. Geogr. 1970, 46 (Suppl. 1), 234–240. [Google Scholar] [CrossRef]
- Wu, Y.M. Estimation of input-output elasticity of regional agricultural production factors in China. Chin. Rural Econ. 2010, 6, 25–37. [Google Scholar]
- Deng, Z.B.; Feng, Y.G.; Zhang, J.L.; Wang, J. Empirical studies on the regional pattern changes of grain production and its main contributing factors in China. Macroeconomics 2014, 3, 94–113. [Google Scholar]
- Chen, X.Y.; Li, R.Y.; Zhao, J.S. Food security policy in China: Evolutionary trajectory, internal logic and strategic direction. Economist 2020, 117–128. [Google Scholar] [CrossRef]
- Lefever, D. Measuring Geographic Concentration by Means of the Standard Deviational Ellipse. Am. J. Sociol. 1926, 32, 88–94. [Google Scholar] [CrossRef]
- Furfey, P. A Note on Lefever’s “Standard Deviational Ellipse”. Am. J. Sociol. 1927, 33, 94–98. [Google Scholar] [CrossRef]
- Zhao, L.; Zhao, Z.Q. Spatial Agglomeration of the manufacturing industry in China. J. Quant. Tech. Econ. 2014, 31, 110–121. [Google Scholar] [CrossRef]
- Zhao, L.; Zhao, Z.Q. Projecting the spatial variation of economic based on the specific ellipses in China. Sci. Geogr. Sin. 2014, 34, 979–986. [Google Scholar] [CrossRef]
- Anselin, L. Spatial econometrics: Methods and models. Stud. Oper. Reg. Sci. 1988, 85, 310–330. [Google Scholar]
- Fan, Q.; Hudson, D. A New Endogenous Spatial Temporal Weight Matrix Based on Ratios of Global Moran’s I. J. Quant. Tech. Econ. 2018, 35, 131–149. [Google Scholar] [CrossRef]
- Yang, M.H.; Zhang, H.X.; Sun, Y.N.; Li, Q.Q. The study of the science and technology innovation ability in eight comprehensive economic areas of China. J. Quant. Tech. Econ. 2018, 35, 3–19. [Google Scholar] [CrossRef]
- Elhorst, J.P. Dynamic spatial panels: Models, methods, and inferences. J. Geogr. Syst. 2012, 14, 5–28. [Google Scholar] [CrossRef]
- Rey, S.J.; Montouri, B.D. US Regional Income Convergence: A Spatial Econometric Perspective. Reg. Stud. 1999, 33, 143–156. [Google Scholar] [CrossRef]
- Hatfield, J.L.; Boote, K.J.; Kimball, B.A.; Ziska, L.H.; Izaurralde, R.C.; Ort, D.; Thomson, A.M.; Wolfe, D. Climate impacts on agriculture: Implications for crop production. Agron. J. 2011, 103, 351. [Google Scholar] [CrossRef] [Green Version]
- Wang, F.; Liu, Y.F.; Kong, X.S.; Chen, Y.; Pan, J. Spatial and temporal variation of grain production and its influencing factors at the county level in China. Econ. Geogr. 2018, 38, 142–151. [Google Scholar] [CrossRef]
- Zhu, Q.R. Analysis of production layout of major cotton producing areas in China. Chin. Rural Econ. 2009, 4, 31–38. [Google Scholar]
- Yuan, F.; Yu, L.; Zhao, Z.J. Influence of climate change on the agricultural productivity and planting structure—Simulation study based on DNDC-CGE model. Guangdong Agric. Sci. 2016, 43, 159–167. [Google Scholar] [CrossRef]
- Cheng, Y.; Zhang, P. Regional patterns change of Chinese grain production and response of commodity grain base in Northeast China. Sci. Geogr. Sin. 2005, 3–10. [Google Scholar] [CrossRef]


| Variable/Unit | Variable Definition | ||
|---|---|---|---|
| Explained variable | grain production (GP)/million tons | Production of food and three crops (wheat, maize, rice) | |
| Explanatory variables | Natural conditions | temperature(TEM)/°C | air temperature measured in the field when the air is circulated without direct sunlight |
| precipitation (PRE)/mm | the depth at which rainfall accumulates on the horizontal plane without evaporation, infiltration and loss | ||
| sunshine hours (SUN)/h | the time of the day when direct sunlight hits the ground | ||
| grain disaster area (GDA)/khm2 | Food sown area × (disaster area of crops/crops total sown area) | ||
| Socio-economic environment | economic growth (pGDP)/yuan RMB | GDP per capita | |
| urbanization (URBAN)/% | Urbanization rate of the resident population | ||
| rural labor transfer (RLT)/ten thousand people | (Rural workers—agriculture, forestry and fishery workers) × (food sown area/crops total sown area) | ||
| non-farm income (NFI)/% | Wage income per capita/net income per capita | ||
| Other conditions | arable land resources (AL)/(Mu/person) | arable land resources per capita = arable land area/rural population | |
| multiple cropping index (MCI)/% | crops total sown area/cultivated area | ||
| agricultural mechanization (MECH)/(kW/person) | Total power of agricultural machinery/agriculture, forestry and fishery workers × (sown area of grain/total sown area of farm) | ||
| transportation conditions (TRANS)/(m/km2) | Mileage of land transport (road + railway)/land area | ||
| agricultural policy adjustment (APA) | Dummy variables: 0 before 1993, 1 after 1993 | ||
| Variables | GP | Wheat | Maize | Rice | Variables | GP | Wheat | Maize | Rice |
|---|---|---|---|---|---|---|---|---|---|
| SEM | SEM | SEM | SLM | SEM | SEM | SEM | SLM | ||
| lnTEM | 0.131 (0.90) | −0.317 (−1.35) | −0.101 (−0.69) | 0.270 *** (4.55) | lnMCI | 0.693 *** (4.73) | 0.843 *** (2.96) | 0.684 *** (4.81) | 0.631 *** (4.09) |
| lnPRE | 0.089 * (1.71) | −0.025 (−0.19) | 0.128 ** (2.21) | −0.009 (−0.33) | lnMECH | 0.258 *** (3.87) | 0.442 (1.32) | 0.209 ** (2.13) | 0.211 *** (3.88) |
| lnSUN | 0.080 (0.59) | 0.526 (0.81) | 0.222 (1.05) | −0.132 (−1.56) | lnTRANS | 0.049 (0.45) | 0.452 (1.56) | 0.093 (0.85) | −0.040 (−0.63) |
| lnGDA | 0.016 (0.83) | 0.059 (0.76) | 0.018 (0.64) | −0.011 (−0.80) | lnAPA | 0.141 * (1.78) | 0.459 (1.23) | 0.142 (1.63) | 0.082 *** (2.74) |
| lnpGDP | −0.192 ** (−2.09) | −0.535 ** (−2.06) | −0.149 (−1.27) | −0.165 *** (−4.05) | ρ/λ | 0.550 *** (7.26) | 0.656 *** (7.48) | 0.467 *** (6.84) | 0.399 *** (4.79) |
| lnURBAN | −0.151 ** (−2.31) | 0.272 (0.43) | −0.261 ** (−2.22) | −0.062 (−0.79) | R2 | 0.643 | 0.415 | 0.648 | 0.636 |
| lnRLT | 0.114 *** (4.30) | −0.466 (−0.90) | 0.115 *** (4.25) | 0.115 *** (3.75) | Sigma2 | 0.017 *** (6.15) | 0.183 ** (2.22) | 0.018 *** (5.69) | 0.014 *** (6.89) |
| lnNFI | −0.004 (−0.09) | 0.092 (0.49) | −0.073 (−1.10) | 0.019 (0.77) | LogL | 580.81 | −427.03 | 414.15 | 468.95 |
| lnAL | 0.382 *** (3.54) | 0.180 (1.62) | 0.437 *** (3.36) | 0.211 ** (2.19) | AIC | −1131.62 | 884.06 | −798.29 | −907.89 |
| Variables | South and North | Six Agricultural Zones | ||||||
|---|---|---|---|---|---|---|---|---|
| North: SEM | South: SLM | NEC: SEM | NC: SEM | NWC: POLS | SWC: SLM | MLY: SLM | SEC: POLS | |
| lnTEM | −0.165 (−1.14) | 0.112 (0.37) | 0.125 (1.30) | 0.055 (0.23) | −0.352 *** (−5.95) | −0.389 *** (−3.01) | 0.169 (1.08) | −0.151 (−0.37) |
| lnPRE | 0.176 *** (3.22) | −0.039 (−1.02) | −0.066 (−0.90) | 0.206 ** (2.34) | 0.130 ** (2.16) | 0.084 *** (2.73) | −0.113 *** (−3.66) | 0.036 (0.54) |
| lnSUN | 0.456 * (1.86) | −0.044 (−0.47) | −0.628 (−1.54) | 0.206 (0.71) | 0.055 (0.19) | −0.006 (−0.03) | −0.115 * (−1.85) | −0.044 (−0.32) |
| lnGDA | 0.013 (0.68) | 0.009 (0.73) | −0.069 ** (−2.24) | −0.008 (−0.60) | 0.059 (1.53) | −0.027 ** (−2.54) | 0.0162 (0.80) | −0.009 (−0.62) |
| lnpGDP | −0.075 (−0.69) | −0.214 *** (−4.40) | −0.068 (−0.59) | −0.148 * (−1.78) | 0.051 (1.13) | 0.070 (1.64) | −0.237 *** (−6.76) | −0.075 ** (−2.05) |
| lnURBAN | −0.369 ** (−2.37) | −0.192 ** (−2.24) | −0.085 (−0.49) | −0.310 ** (−2.32) | −0.706 *** (−9.22) | −0.287 *** (−8.62) | 0.061 (0.34) | −0.153 ** (−2.52) |
| lnRLT | 0.168 ** (2.48) | 0.088 *** (3.25) | 0.082 * (1.78) | 0.274 ** (2.01) | 0.171 *** (3.98) | 0.074 *** (7.66) | 0.126 ** (2.41) | 0.168 *** (3.59) |
| lnNFI | −0.079 (−1.20) | −0.010 (−0.29) | −0.026 (−0.35) | −0.085 (−0.97) | −0.109 ** (−2.22) | 0.126 (1.43) | 0.048 (0.68) | −0.011 (−0.44) |
| lnAL | 0.667 *** (4.74) | 0.155 * (1.83) | 0.719 *** (7.36) | 0.728 *** (5.40) | 0.424 *** (7.30) | 0.170 *** (3.17) | 0.269 (1.42) | 0.077 (1.48) |
| lnMCI | 0.910 *** (5.73) | 0.603 *** (3.51) | 1.071 *** (7.31) | 0.901 *** (5.20) | 0.336 *** (2.65) | 0.291 *** (5.39) | 0.087 (0.65) | 0.607 *** (8.17) |
| lnTECH | 0.177 * (1.69) | 0.296 *** (7.19) | 0.182 *** (9.55) | 0.192 * (1.92) | 0.454 *** (5.58) | −0.248 ** (−2.16) | 0.261 *** (4.32) | −0.065 (−1.02) |
| lnBCT | 0.061 (0.64) | −0.099 (−1.31) | 0.253 *** (2.66) | 0.087 (0.69) | −0.122 ** (−2.39) | −0.009 (−0.02) | −0.140 *** (−3.08) | −0.305 *** (−5.46) |
| lnAPA | 0.119 (1.57) | 0.118 *** (3.09) | 0.116 ** (2.35) | 0.109 ** (2.15) | −0.019 (−0.40) | 0.017 (0.36) | 0.079 ** (2.15) | 0.081 ** (2.05) |
| C | −0.822 (−0.33) | 0.346 (0.19) | ||||||
| ρ/𝜆 | 0.301 *** (4.30) | 0.310 *** (3.99) | 0.284 *** (4.20) | 0.204 *** (3.91) | 0.187 ** (2.41) | 0.274 *** (4.02) | ||
| R2 | 0.714 | 0.758 | 0.833 | 0.932 | 0.661 | 0.705 | 0.749 | 0.897 |
| Sigma2 | 0.016 *** (6.12) | 0.011 *** (5.93) | 0.007 *** (3.93) | 0.014 *** (4.10) | 0.004 *** (6.63) | 0.006 *** (3.68) | ||
| LogL | 333.298 | 434.561 | 105.892 | 167.738 | 182.766 | 235.977 | ||
| AIC | −638.596 | −841.122 | −207.783 | −325.477 | −355.532 | −461.954 | ||
Publisher’s Note: MDPI stays neutral with regard to jurisdictional claims in published maps and institutional affiliations. |
© 2020 by the authors. Licensee MDPI, Basel, Switzerland. This article is an open access article distributed under the terms and conditions of the Creative Commons Attribution (CC BY) license (http://creativecommons.org/licenses/by/4.0/).
Share and Cite
Hou, M.; Deng, Y.; Yao, S. Spatial Agglomeration Pattern and Driving Factors of Grain Production in China since the Reform and Opening Up. Land 2021, 10, 10. https://doi.org/10.3390/land10010010
Hou M, Deng Y, Yao S. Spatial Agglomeration Pattern and Driving Factors of Grain Production in China since the Reform and Opening Up. Land. 2021; 10(1):10. https://doi.org/10.3390/land10010010
Chicago/Turabian StyleHou, Mengyang, Yuanjie Deng, and Shunbo Yao. 2021. "Spatial Agglomeration Pattern and Driving Factors of Grain Production in China since the Reform and Opening Up" Land 10, no. 1: 10. https://doi.org/10.3390/land10010010
APA StyleHou, M., Deng, Y., & Yao, S. (2021). Spatial Agglomeration Pattern and Driving Factors of Grain Production in China since the Reform and Opening Up. Land, 10(1), 10. https://doi.org/10.3390/land10010010