Multi-Layer Assessment of Land Use and Related Changes for Decision Support in a Coastal Zone Watershed

Abstract
:
1. Introduction
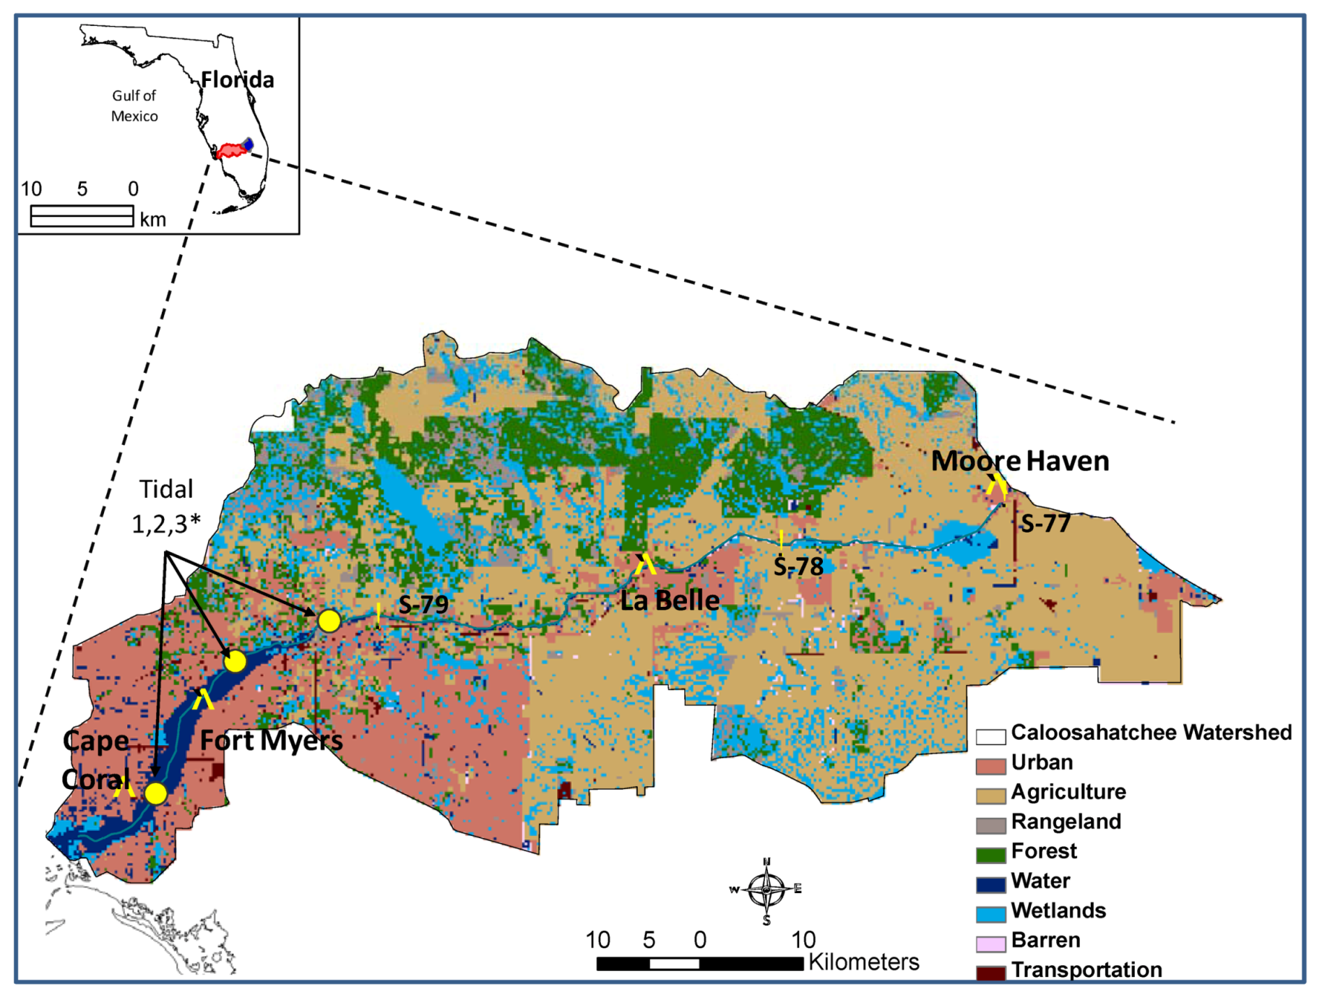
Study Site Description

2. Materials and Methods
2.1. Land Use Data Processing

| Land Use Year | Land Use Codes | Scale | Purpose |
|---|---|---|---|
| 1988 | FLUCCS† (88)‡ | 1:40,000 | Management decision support |
| 1995 | FLUCCS | 1:40,000 | Management decision support |
| 1999 | FLUCCS | 1:40,000 | Land use/land cover mapping project |
| 2004 | FLUCCS | 1:12,000 | Create a more detailed map |
| 2009 | FLUCCS | 1:12,000 | Support various SFWMD missions |
2.2. Land Use Data Analyses
2.3. Census Data
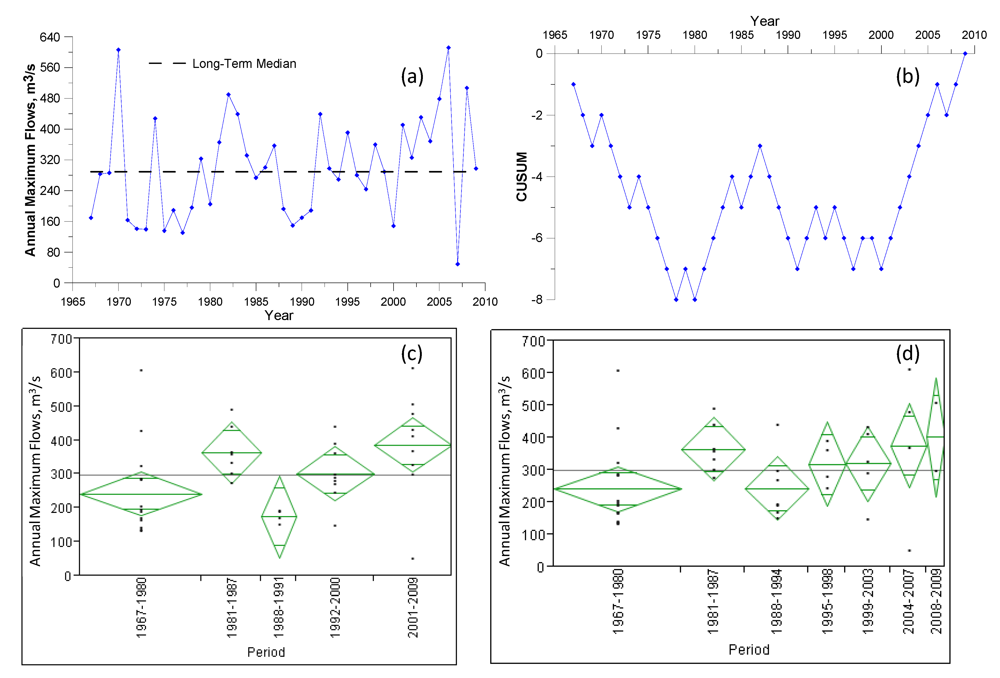
2.4. Hydrologic Trends
2.4.1. Trend Analyses
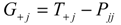
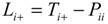
2.4.2. Change Detection
2.4.3. Climate Data
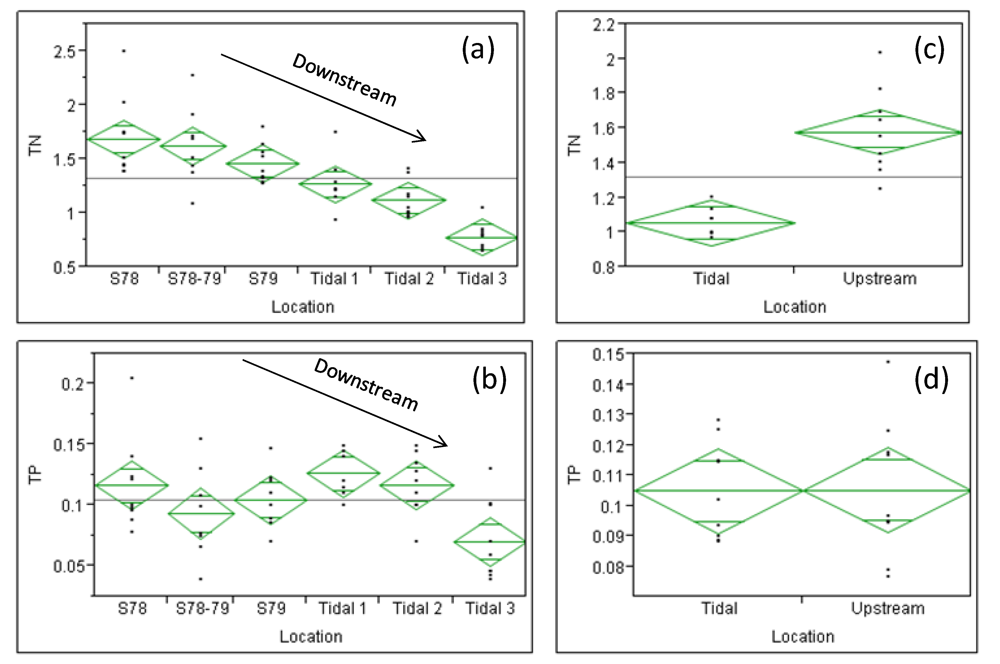
2.5. Water Quality Data
3. Results and Discussion
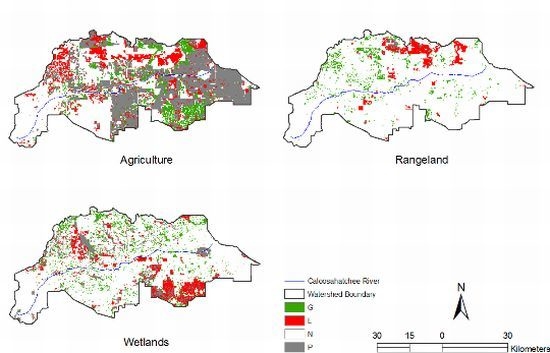
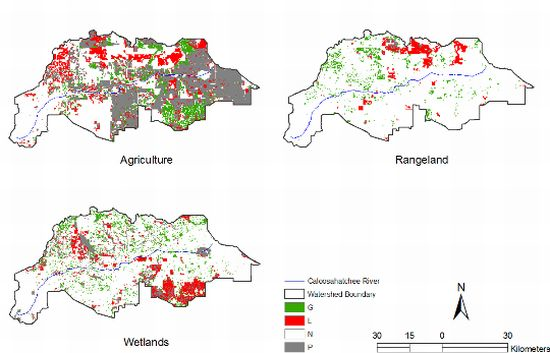
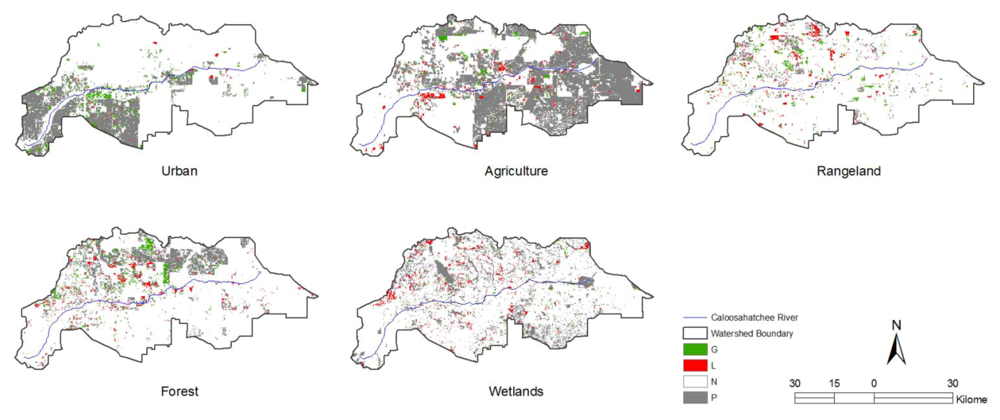
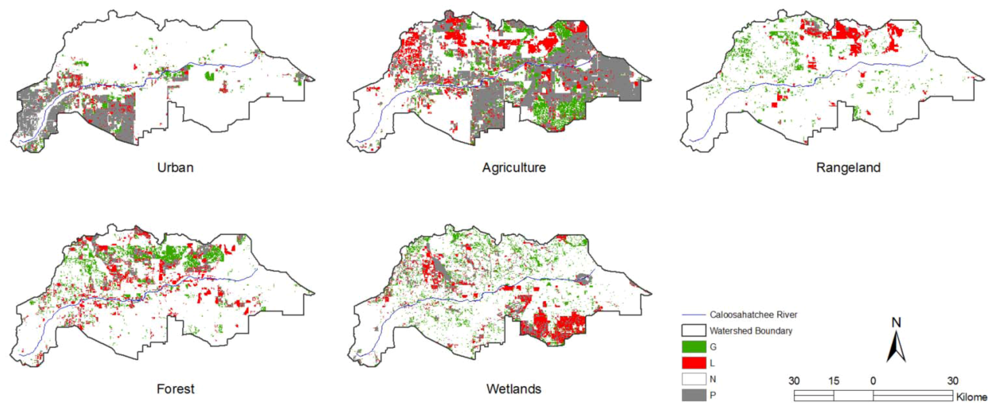
3.1. Quantifying Land Use Changes
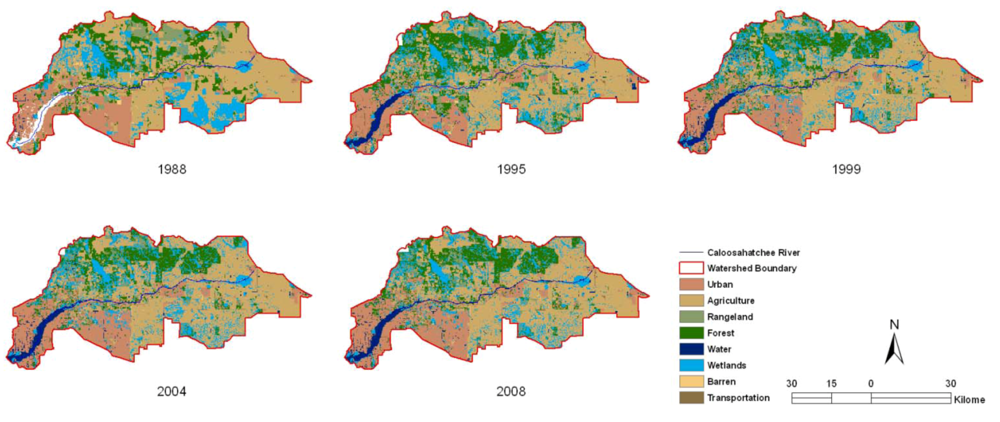
| Land Use | 1988 | 1995 | 1999 | 2004 | 2008 |
|---|---|---|---|---|---|
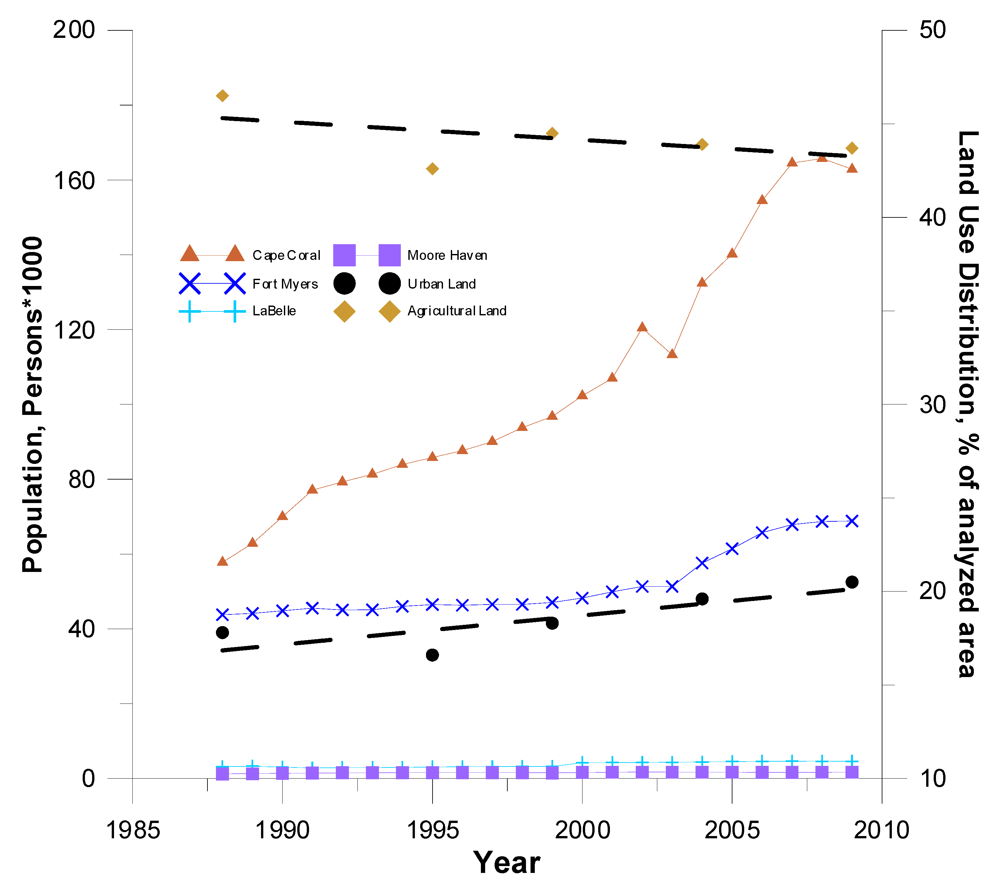
| Agriculture | 46.3 | 42.0 | 44.2 | 43.5 | 43.3 |
| Urban | 17.8 | 16.3 | 18.1 | 19.4 | 20.3 |
| Wetlands | 16.0 | 15.7 | 16.4 | 16.7 | 14.9 |
| Forest | 13.3 | 18.1 | 14.0 | 13.5 | 14.1 |
| Rangeland | 5.5 | 5.5 | 6.0 | 5.5 | 5.9 |
| Barren | 0.7 | 1.0 | 0.6 | 0.6 | 0.5 |
| Transportation* | 0.4 | 1.4 | 0.7 | 0.7 | 0.9 |
| Period | |||||||
|---|---|---|---|---|---|---|---|
| 88–95 | 95–99 | 99–04 | 04–08 | 88–99 | 99–08 | 88–08 | |
| Gains | |||||||
| Urban | 2.8 | 3.2 | 1.6 | 1.3 | 3.2 | 2.6 | 4.8 |
| Agriculture | 8.1 | 5.9 | 1.1 | 1.0 | 10.1 | 1.7 | 10.0 |
| Rangeland | 4.6 | 3.8 | 0.9 | 1.8 | 5.3 | 2.2 | 5.5 |
| Forest | 11.1 | 3.6 | 0.9 | 2.0 | 8.3 | 2.5 | 8.5 |
| Wetlands | 8.1 | 4.7 | 0.8 | 0.5 | 8.5 | 0.9 | 7.3 |
| Barren | 0.7 | 0.3 | 0.2 | 0.1 | 0.4 | 0.2 | 0.4 |
| Losses | |||||||
| Urban | 4.1 | 1.5 | 0.2 | 0.3 | 2.7 | 0.4 | 2.1 |
| Agriculture | 11.9 | 4.1 | 1.6 | 1.1 | 12.2 | 2.3 | 12.7 |
| Rangeland | 4.5 | 3.5 | 1.4 | 1.4 | 4.8 | 2.3 | 5.1 |
| Forest | 6.1 | 8.0 | 1.3 | 1.4 | 7.6 | 2.3 | 7.6 |
| Wetlands | 8.5 | 3.8 | 0.6 | 2.4 | 8.1 | 2.7 | 8.5 |
| Barren | 0.4 | 0.6 | 0.2 | 0.1 | 0.4 | 0.2 | 0.5 |
| Net Change | |||||||
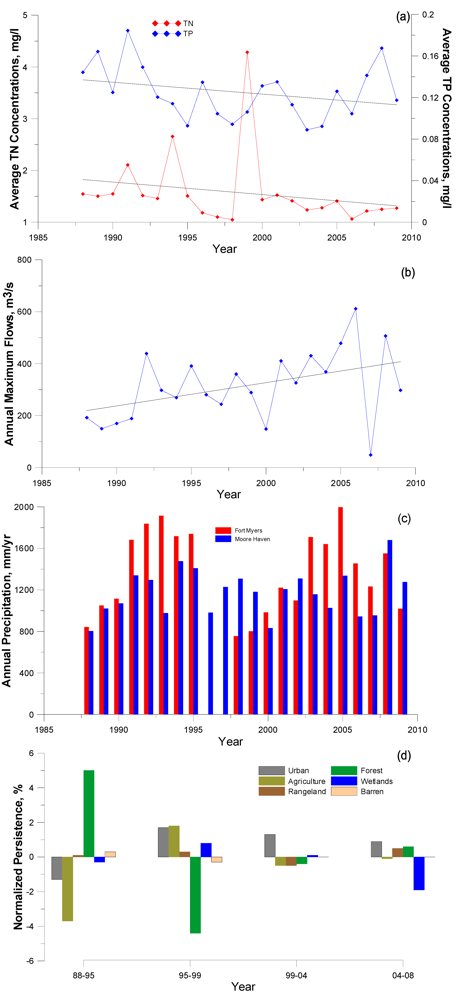
| Urban | −1.3 | 1.7 | 1.3 | 0.9 | 0.5 | 2.3 | 2.7 |
| Agriculture | − 3.7 | 1.8 | −0.5 | −0.1 | −2.1 | −0.6 | − 2.7 |
| Rangeland | 0.1 | 0.3 | −0.5 | 0.5 | 0.5 | −0.1 | 0.4 |
| Forest | 5.0 | − 4.4 | −0.4 | 0.6 | 0.7 | 0.2 | 0.9 |
| Wetlands | −0.3 | 0.8 | 0.1 | −1.9 | 0.4 | −1.8 | −1.2 |
| Barren | 0.3 | −0.3 | 0.0 | 0.0 | 0.0 | 0.0 | −0.1 |
| Normalized Persistence | |||||||
| Urban | 0.77 | 0.91 | 0.99 | 0.98 | 0.85 | 0.98 | 0.88 |
| Agriculture | 0.75 | 0.90 | 0.96 | 0.98 | 0.74 | 0.95 | 0.73 |
| Rangeland | 0.19 | 0.38 | 0.77 | 0.75 | 0.13 | 0.62 | 0.07 |
| Forest | 0.55 | 0.57 | 0.91 | 0.90 | 0.44 | 0.84 | 0.43 |
| Wetlands | 0.48 | 0.75 | 0.96 | 0.86 | 0.50 | 0.84 | 0.48 |
| Barren | 0.42 | 0.32 | 0.74 | 0.76 | 0.30 | 0.64 | 0.20 |

| 1999 | 1 | 2 | 3 | 4 | 5 | 6 | |||
|---|---|---|---|---|---|---|---|---|---|
| Urban | Agric | Range | Forest | Wetlands | Barren | Totals Time 1 | Loss | ||
| 1988 | |||||||||
| 1 | Urban | 14.86 | 0.82 | 0.29 | 0.75 | 0.80 | 0.05 | 17.57 | 2.7 |
| PRij | 14.86 | 3.34 | 0.99 | 1.69 | 1.78 | 0.07 | 22.7 | 7.9 | |
| Dij | 0.00 | −2.52 | −0.70 | −0.94 | −0.97 | −0.01 | −5.2 | −5.2 | |
| Bij | 0.00 | −0.76 | −0.71 | −0.56 | −0.55 | −0.20 | −0.2 | −0.7 | |
| 2 | Agric | 1.49 | 34.63 | 2.62 | 3.81 | 4.12 | 0.19 | 46.86 | 12.2 |
| 1.81 | 34.63 | 2.65 | 4.50 | 4.74 | 0.18 | 48.5 | 13.9 | ||
| −0.32 | 0.00 | −0.03 | −0.69 | −0.63 | 0.01 | −1.7 | −1.7 | ||
| −0.18 | 0.00 | −0.01 | −0.15 | −0.13 | 0.07 | 0.0 | −0.1 | ||
| 3 | Range | 0.27 | 1.99 | 0.73 | 1.54 | 1.03 | 0.00 | 5.56 | 4.8 |
| 0.21 | 1.06 | 0.73 | 0.53 | 0.56 | 0.02 | 3.1 | 2.4 | ||
| 0.05 | 0.93 | 0.00 | 1.01 | 0.46 | −0.02 | 2.4 | 2.4 | ||
| 0.25 | 0.88 | 0.00 | 1.89 | 0.83 | −0.83 | 0.8 | 1.0 | ||
| 4 | Forest | 0.90 | 2.78 | 1.37 | 5.83 | 2.47 | 0.05 | 13.40 | 7.6 |
| 0.52 | 2.55 | 0.76 | 5.83 | 1.36 | 0.05 | 11.1 | 5.2 | ||
| 0.38 | 0.23 | 0.61 | 0.00 | 1.11 | 0.00 | 2.3 | 2.3 | ||
| 0.73 | 0.09 | 0.81 | 0.00 | 0.82 | 0.01 | 0.2 | 0.4 | ||
| 5 | Wetlands | 0.41 | 4.38 | 1.02 | 2.18 | 7.95 | 0.08 | 16.02 | 8.1 |
| 0.62 | 3.05 | 0.90 | 1.54 | 7.95 | 0.06 | 14.1 | 6.2 | ||
| −0.21 | 1.34 | 0.12 | 0.64 | 0.00 | 0.02 | 1.9 | 1.9 | ||
| −0.34 | 0.44 | 0.13 | 0.42 | 0.00 | 0.30 | 0.1 | 0.3 | ||
| 6 | Barren | 0.12 | 0.13 | 0.03 | 0.04 | 0.08 | 0.18 | 0.59 | 0.4 |
| 0.02 | 0.11 | 0.03 | 0.06 | 0.06 | 0.18 | 0.5 | 0.3 | ||
| 0.10 | 0.02 | 0.00 | −0.02 | 0.02 | 0.00 | 0.1 | 0.1 | ||
| 4.30 | 0.19 | −0.09 | −0.27 | 0.42 | 0.00 | 0.3 | 0.4 | ||
| Totals Time 2 | 18.04 | 44.74 | 6.06 | 14.15 | 16.45 | 0.56 | 100.0 | ||
| Gain | 3.18 | 10.11 | 5.33 | 8.31 | 8.50 | 0.39 | |||
| 1999 | 1 | 2 | 3 | 4 | 5 | 6 | Totals Time 1 | ||
|---|---|---|---|---|---|---|---|---|---|
| Urban | Agric | Range | Forest | Wetlands | Barren | Loss | |||
| 1988 | |||||||||
| 1 | Urban | 14.86 | 0.82 | 0.29 | 0.75 | 0.80 | 0.05 | 17.57 | 2.72 |
| PRij | 14.86 | 1.48 | 0.20 | 0.47 | 0.55 | 0.02 | 17.57 | ||
| Dij | 0.00 | −0.67 | 0.09 | 0.28 | 0.26 | 0.04 | 0.00 | ||
| Bij | 0.00 | −0.45 | 0.46 | 0.60 | 0.48 | 1.91 | 0.00 | ||
| 2 | Agric | 1.49 | 34.63 | 2.62 | 3.81 | 4.12 | 0.19 | 46.86 | 12.2 |
| 3.99 | 34.63 | 1.34 | 3.13 | 3.64 | 0.12 | 46.86 | |||
| −2.50 | 0.00 | 1.28 | 0.68 | 0.48 | 0.07 | 0.00 | |||
| −0.63 | 0.00 | 0.95 | 0.22 | 0.13 | 0.56 | 0.00 | |||
| 3 | Range | 0.27 | 1.99 | 0.73 | 1.54 | 1.03 | 0.00 | 5.56 | 4.8 |
| 0.93 | 2.30 | 0.73 | 0.73 | 0.85 | 0.03 | 5.56 | |||
| −0.66 | −0.31 | 0.00 | 0.81 | 0.18 | −0.03 | 0.00 | |||
| −0.71 | −0.13 | 0.00 | 1.12 | 0.21 | −0.87 | 0.00 | |||
| 4 | Forest | 0.90 | 2.78 | 1.37 | 5.83 | 2.47 | 0.05 | 13.40 | 7.6 |
| 1.59 | 3.94 | 0.53 | 5.83 | 1.45 | 0.05 | 13.40 | |||
| −0.69 | −1.16 | 0.83 | 0.00 | 1.02 | 0.00 | 0.00 | |||
| −0.44 | −0.29 | 1.56 | 0.00 | 0.70 | 0.06 | 0.00 | |||
| 5 | Wetlands | 0.41 | 4.38 | 1.02 | 2.18 | 7.95 | 0.08 | 16.02 | 8.1 |
| 1.74 | 4.32 | 0.59 | 1.37 | 7.95 | 0.05 | 16.02 | |||
| −1.34 | 0.06 | 0.44 | 0.81 | 0.00 | 0.03 | 0.00 | |||
| −0.77 | 0.01 | 0.75 | 0.59 | 0.00 | 0.48 | 0.00 | |||
| 6 | Barren | 0.12 | 0.13 | 0.03 | 0.04 | 0.08 | 0.18 | 0.59 | 0.4 |
| 0.07 | 0.18 | 0.02 | 0.06 | 0.07 | 0.18 | 0.59 | |||
| 0.05 | −0.05 | 0.01 | −0.02 | 0.02 | 0.00 | 0.00 | |||
| 0.62 | −0.28 | 0.20 | −0.29 | 0.25 | 0.00 | 0.00 | |||
| Totals Time 2 | 18.04 | 44.74 | 6.06 | 14.15 | 16.45 | 0.56 | 100.0 | ||
| 23.18 | 46.86 | 3.42 | 11.59 | 14.50 | 0.45 | ||||
| −5.14 | −2.13 | 2.65 | 2.56 | 1.95 | 0.11 | ||||
| −0.22 | −0.05 | 0.77 | 0.22 | 0.13 | 0.24 | ||||
3.2. Census Data
3.3. Hydrologic Trends
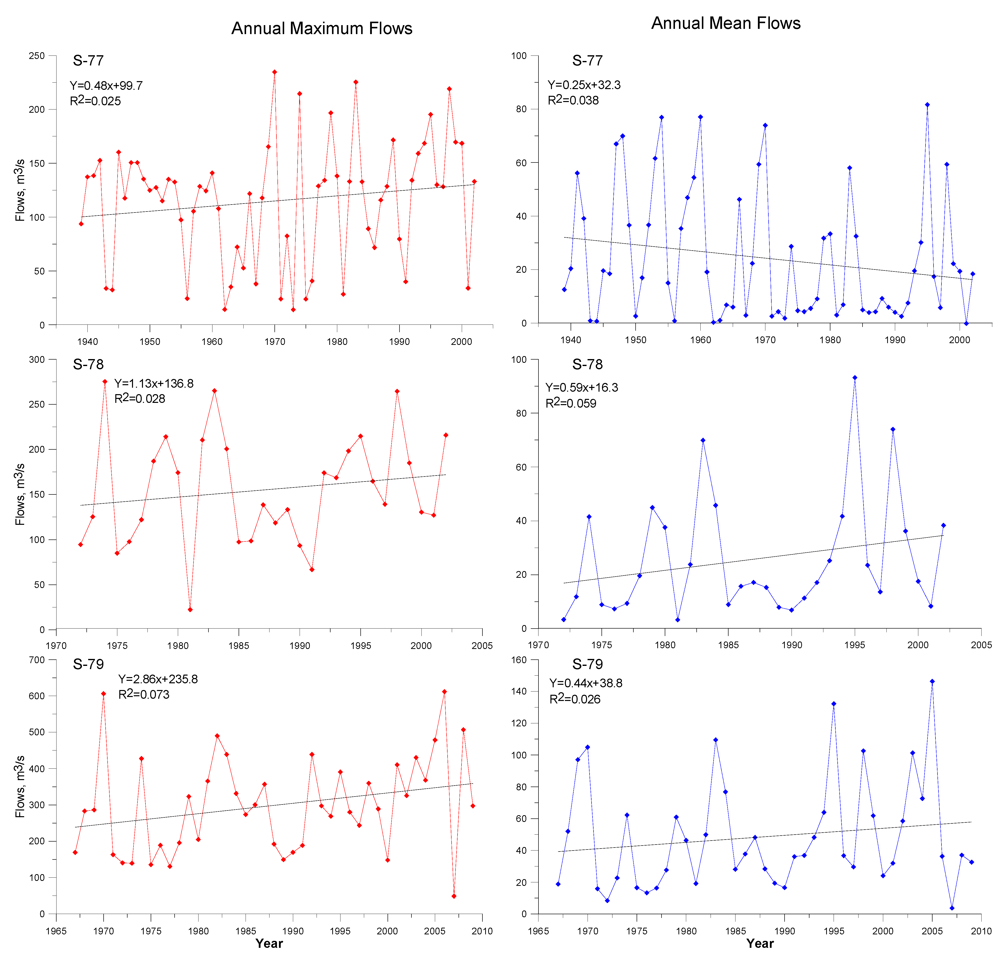
3.3.1. Trend Analyses
| Statistic | S-77 | S-78 | S-79 | |||
|---|---|---|---|---|---|---|
| Max | Mean | Max | Mean | Max | Mean | |
| Spearman’s Rho | 0.1640 | −0.1590 | 0.2194 | 0.2625 | 0.3192 | 0.2025 |
| p0.05 | 0.1955 | 0.2096 | 0.2358 | 0.1537 | 0.0370* | 0.1928 |
| Kendalls Tau | 0.0879 | −0.0863 | 0.1398 | 0.1871 | 0.2317 | 0.1561 |
| p0.05 | 0.3051 | 0.3134 | 0.2693 | 0.1392 | 0.0287* | 0.1400 |
| Regression Slope | 0.4772 | 1.1309 | 2.8563 | |||
| Slope/RMSE | 0.0086 | 0,0184 | 0.0220 | |||
3.3.2. Change Detection

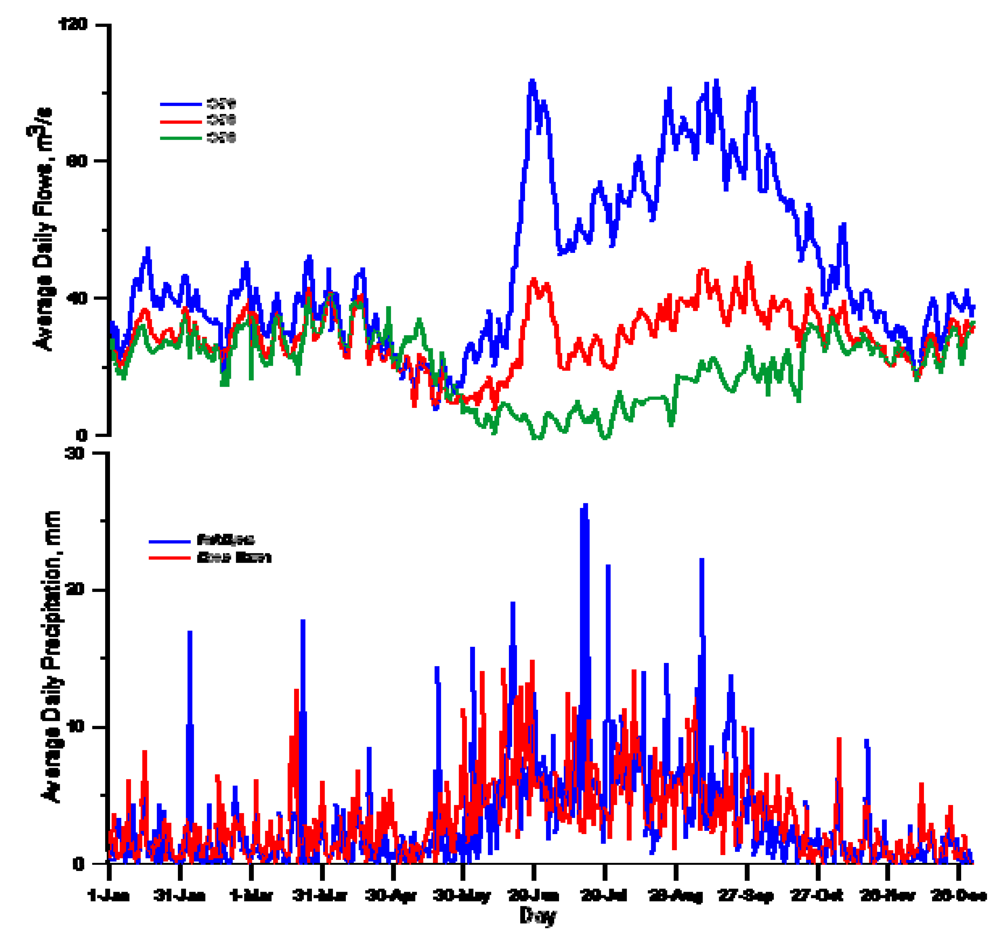
3.3.3. Climate Trends
3.4. Water Quality Trends

3.5. General Discussion
4. Conclusions
Acknowledgments
References and Notes
- USCOP, An Ocean Blueprint for the 21st Century. Final Report; US Commission on Ocean Policy: Washington, DC, USA, 2004; p. 676.
- NAP, Priorities for Coastal Ecosystem Science; The National Academy of Sciences, National Academy Press: Washington, D.C. USA, 1995.
- Kennish, M.J. Environmental threats and environmental future of estuaries. Environ. Conserv. 2002, 29, 78–107. [Google Scholar]
- Burke, L.; Kura, Y.; Kassem, K.; Revenga, C.; Spalding, M.; McAllister, D. Pilot Analysis of Global Ecosystems: Coastal Ecosystems; World Resources Institute: Washington, DC, USA, 2000; p. 93. Available online: http://www.wri.org/publication/pilot-analysis-global-ecosystems-coastal-ecosystems (accessed on 12 November 2012).
- UNDSD. Chapter 17: Protection of the Oceans, all Kinds of Seas, Including Enclosed and Semi-Enclosed Seas, and Coastal Areas and the Protection, Rational Use and Development of Their Living Resources. In Proceedings of United Nations Conference on Environment and Development, Rio de Janerio, Brazil, 3–14 June 1992; p. 351.
- Clark, G.E.; Moser, S.C.; Ratick, S.J.; Dow, K.; Meyer, W.B.; Emani, S.; Jin, W.; Kasperson, J.X.; Kasperson, R.E.; Schwarz, H.E. Assessing the vulnerability of coastal communities to extreme storms: The case of Revere, MA., USA. Mitig. Adapt. Strategies Global Change 1998, 3, 59–82. [Google Scholar]
- Gitau, M.W.; Chaubey, I.; Gbur, E.; Pennington, J.H.; Gorham, B. Impacts of land-use change and best management practice implementation in a Conservation Effects Assessment Project watershed: Northwest Arkansas. J. Soil Water Conserv. 2010, 65, 353–368. [Google Scholar] [CrossRef]
- Deroin, J.P.; Téreygeol, F.; Heckes, J. Evaluation of very high to medium resolution multispectral satellite imagery for geoarchaeology in arid regions—Case study from Jabali, Yemen. J. Archaeol. Sci. 2011, 38, 101–114. [Google Scholar] [CrossRef]
- Wang, J.; Cheng, Q.; Chen, J. A GIS and remote sensing-based analysis of land use change using the asymmetric relation analysis method: A case study from the City of Hangzhou, China. Math. Geosci. 2011, 43, 435–453. [Google Scholar]
- Antrop, M.; Eetvelde, V.V. Holistic aspects of suburban landscapes: Visual image interpretation and landscape metrics. Landsc. Urban Plan. 2000, 50, 43–58. [Google Scholar] [CrossRef]
- Laliberte, A.S.; Rango, A.; Havstad, K.M.; Paris, J.F.; Beck, R.F.; McNeely, R.; Gonzalez, A.L. Object-oriented image analysis for mapping shrub encroachment from 1937 to 2003 in southern New Mexico. Remote Sens. Environ. 2004, 93, 198–210. [Google Scholar] [CrossRef]
- Rindfuss, R.R.; Walsh, S.J.; Turner, B.L., II; Fox, J.; Mishra, V. Developing a science of land change: Challenges and methodological issues. Proc. Natl. Acad. Sci. USA 2004, 101, 13976–13981. [Google Scholar]
- Zhou, W.; Troy, A.; Grove, M. Object-based land cover classification and change analysis in the Baltimore Metropolitan area using multitemporal high resolution remote sensing data. Sensors 2008, 8, 1613–1636. [Google Scholar]
- Morgan, J.L.; Gergel, S.E. Quantifying historic landscape heterogeneity from aerial photographs using object-based analysis. Landscape Ecol. 2010, 25, 985–998. [Google Scholar] [CrossRef]
- Spaulding, B.; Stanwicks, S. Developing a Geographic Information System Index for Historical Aerial Photographs; UCCGIA Papers and Proceedings; Paper 3; Unversity of Connecticut: Storrs, CT, USA, 2007. Available online: http://digitalcommons.uconn.edu/uccgia_papers/3 (accessed on 12 November 2012).
- Pontius, R.G.J.; Shusas, E.; McEachem, M. Detecting important categorical land changes while accounting for persistence. Agric. Ecosyst. Environ. 2004, 101, 251–268. [Google Scholar] [CrossRef]
- Paegelow, M.; Olmedo, M.T.C. Possibilities and limits of prospective GIS land cover modelling-a compared case study: Garrotxes (France) and Alta Alpujarra Granadina (Spain). Int. J. Geogr. Inf. Sci. 2005, 19, 697–722. [Google Scholar] [CrossRef]
- Pontius, R.G.J.; Lippitt, C.D. Can error explain map differences over time? Cartogr. Geogr. Inf. Sci. 2006, 33, 159–171. [Google Scholar] [CrossRef]
- Veldkamp, A. Investigating land dynamics: future research perspectives. J. Land Use Sci. 2009, 4, 5–14. [Google Scholar] [CrossRef]
- FDEP, Water Quality Assessment Report: Caloosahatchee; Florida Department of Environmental Protection: Tallahassee, FL, USA, 2005; p. 223.
- Bailey, N.; Magley, W.; Mandrup-Poulsen, J.; O’Donnell, K.; Peets, R. Nutrient TMDL for the Caloosahatchee Estuary (WBIDs 3240A, 3240B, and 3240C). Final TMDL Report; Florida Department of Environmental Protection: Tallahassee, FL, USA, 2009. [Google Scholar]
- SFWMDFDEPFDACSCaloosahatchee River Wateshed Protection Plan; South Florida Water Management District, Florida Department of Environmental Protection, Florida Department of Agriculture and Consumer Services: Tallahassee, FL, USA, 2009; p. 730.
- FDEP. Caloosahatchee River Watershed, Ft. Myers, Cape Coral, Clewiston- Florida’s Water, Ours to Protect; Florida Department of Environmental Protection: Tallahassee, FL, USA, 2010. Available online: http://www.protectingourwater.org/watersheds/map/caloosahatchee (last accessed 12/11/2012).
- FGDL, Statewide Water Management District Land Use; Florida Geographic Data Library: Gainesville, FL, USA, 2007.
- Xiong, L.H.; Guo, S.L. Trend test and change-point detection for the annual discharge series of the Yangtze River at the Yichang hydrological station. Hydrol. Sci. 2004, 49, 99–112. [Google Scholar] [CrossRef]
- Konrad, C.P.; Booth, D.B. Hydrologic Trends Associated with Urban Development for Selected Streams in the Puget Sound Basin, Western Washington; Water-Resources Investigations Report 02-4040; US Geological Survey: Tacoma, WA, USA, 2002; p. 48. [Google Scholar]
- Kundzewicz, Z.W.; Robson, A.J. Change detection in hydrological records—A review of the methodology. Hydrol. Sci. 2004, 49, 7–19. [Google Scholar] [CrossRef]
- Yue, S.; Pilon, P.; Cavadias, G. Power of the Mann–Kendall and Spearman’s rho tests for detecting monotonic trends in hydrological series. J. Hydrol. 2002, 259, 254–271. [Google Scholar] [CrossRef]
- Karpouzos, D.K.; Kavalieratou, S.; Babajimopoulos, C. Trend analysis of precipitation data in Pierra Region (Greece). European Water 2010, 30, 31–40. [Google Scholar]
- McGilchrist, C.A.; Woodyer, K.D. Note on a Distribution-free CUSUM Techniq. Technometrics 1975, 17, 321–325. [Google Scholar] [CrossRef]
- SAS Institute Inc. JMP Statistics and Graphics Guide; SAS Institute Inc.: Cary, NC, USA, 2007.
- FDEP. Rule Chapter: 62-303- Identification of impaired surface waters; Florida Department of Environmental Protection: Tallahassee, FL, USA, 2010. Available online: http://www.dep.state.fl.us/water/watersheds/assessment/index.htm (last acessed 12 November 2012).
- FGDL, Water Body Identification Numbers (WBID) for the State of Florida; Florida Geographic Data Library Documentation; FGDL: Gainesville, FL, USA, April 2010.
- Flaig, E.G.; Capece, J. Water Use and Runoff in the Caloosahatchee Watershed. In Proceedings of The Charlotte Harbor Public Conference and Technical Symposium, Punta Gorda, FL, USA, 15–16 March 1997; Treat, S.F., Ed.; South Floiida Water Management District: West Palm Beach, FL, USA, 1998; pp. 73–80, Charlotte Harbor National Estuary Program Technical Report No. 98-02. [Google Scholar]
- Lang, M.; Awl, J.; Wilen, B.; McCarty, G.; Galbraith, J. Improved wetland mapping through the use of advanced geospatial technologies. National Wetlands Newsl. 2009, 31, 6–9, 30–31. [Google Scholar]
- SFWMD, 2009 SFWMD Photointerpretation Key; South Florida Water Management District: West Palm Beach, FL, USA, 2009; p. 730.
- Doering, P.H.; Chamberlain, R.H. Water quality and source of freshwater discharge to the Caloosahatchee Estuary, Florida. J. Am. Water Resour. Assoc. 1999, 35, 793–806. [Google Scholar] [CrossRef]
- Pijanowski, B.C.; Brown, D.G.; Shellito, B.A.; Manik, G.A. Using neural networks and GIS to forecast land use changes: a Land Transformation Model. Comput. Environ. Urban Syst. 2002, 26, 553–575. [Google Scholar] [CrossRef]
- Li, X.; Yeh, A.G.-O. Neural-network-based cellular automata for simulating multiple land use changes using GIS. Int. J. Geogr. Inf. Sci. 2010, 16, 323–343. [Google Scholar]
- Pontius, R.G.; Boersma, W.; Castella, J.-C.; Clarke, K.; Nijs, T.; Dietzel, C.; Duan, Z.; Fotsing, E.; Goldstein, N.; Kok, K.; et al. Comparing the input, output, and validation maps for several models of land change. Ann. Regional Sci. 2008, 42, 11–37. [Google Scholar] [CrossRef]
© 2012 by the authors; licensee MDPI, Basel, Switzerland. This article is an open-access article distributed under the terms and conditions of the Creative Commons Attribution license (http://creativecommons.org/licenses/by/3.0/).
Share and Cite
Gitau, M.; Bailey, N. Multi-Layer Assessment of Land Use and Related Changes for Decision Support in a Coastal Zone Watershed. Land 2012, 1, 5-31. https://doi.org/10.3390/land1010005
Gitau M, Bailey N. Multi-Layer Assessment of Land Use and Related Changes for Decision Support in a Coastal Zone Watershed. Land. 2012; 1(1):5-31. https://doi.org/10.3390/land1010005
Chicago/Turabian StyleGitau, Margaret, and Nathaniel Bailey. 2012. "Multi-Layer Assessment of Land Use and Related Changes for Decision Support in a Coastal Zone Watershed" Land 1, no. 1: 5-31. https://doi.org/10.3390/land1010005
APA StyleGitau, M., & Bailey, N. (2012). Multi-Layer Assessment of Land Use and Related Changes for Decision Support in a Coastal Zone Watershed. Land, 1(1), 5-31. https://doi.org/10.3390/land1010005