Article

Combined Coagulation and Ultrafiltration Process to Counteract Increasing NOM in Brown Surface Water

by
Alexander Keucken
1,2,*,
Gerald Heinicke
3,
Kenneth M. Persson
2,4 and
Stephan J. Köhler
5
1
Vatten & Miljö i Väst AB (VIVAB), 311 22 Falkenberg, Sweden
2
Water Resources Engineering, Faculty of Engineering, Lund Technical University, 221 00 Lund, Sweden
3
DHI, Agern Allé 5, 2970 Hørsholm, Denmark
4
Sweden Water Research AB, Ideon Science Park, 223 60 Lund, Sweden
5
Department of Aquatic Sciences and Assessment, Swedish University of Agriculture Sciences, 750 07 Uppsala, Sweden
*
Author to whom correspondence should be addressed.
Water 2017, 9(9), 697; https://doi.org/10.3390/w9090697
Submission received: 14 August 2017 / Revised: 6 September 2017 / Accepted: 7 September 2017 / Published: 13 September 2017

Abstract

:
Membrane hybrid processes—coagulation coupled with ultrafiltration (UF)—have become a common method to comply with the legal, chemical, and microbiological requirements for drinking water. The main advantages of integrating coagulation with membrane filtration are the enhanced removal of natural organic matter (NOM) and reduced membrane fouling. With in-line coagulation, coagulants are patched into the feed stream directly prior to the membrane process, without removing the coagulated solids. Compared with conventional coagulation/sedimentation, in-line coagulation/membrane reduces the treatment time and footprint. Coagulant dosing could be challenging in raw water of varying quality; however, with relatively stable specific ultraviolet absorbance (SUVA), dosing can be controlled. Recent studies indicate that UV absorbance correlates well with humic substances (HS), the major fraction to be removed during coagulation. This paper describes and evaluates a 30-month UF pilot trial on the surface water of Lake Neden (Sweden), providing drinking water to 60,000 residents. In this study, automatic coagulant dosing based on online measurement was successfully applied. Online sensor data were used to identify the current optimal aluminium coagulation conditions (0.5–0.7 mg L−1) and the potential boundaries (0.9–1.2 mg L−1) for efficient future (2040) NOM removal. The potential increase in NOM could affect the Al dose and drinking water quality significantly within 20 years, should the current trends in dissolved organic carbon (DOC) prevail. UV absorbance, the freshness index, and liquid chromatography-organic carbon detection (LC-OCD) measurements were used to optimise the process. Careful cross-calibration of raw and filtered samples is recommended when using online sensor data for process optimisation, even in low-turbidity water (formazin nephelometric unit (FNU) < 5).

1. Introduction

In the late 1980s, an increase of natural organic matter (NOM) concentration was first reported in Swedish surface waters as a link between increased amount of humic substances (HS) and the darkening of Swedish lakes [1]. Over the last few decades, several other reports have confirmed that the occurrence of NOM in water (browning of surface waters) was a worldwide phenomenon [2,3,4]. Changes in the climate (temperature, quality, and amount of precipitation) [5] and the decline in acid deposition are reasonable explanations for the increasing NOM concentrations [6]. NOM is a complex mixture of organic compounds present in all fresh water, particularly surface water [7].
The presence of NOM could have severe effects on drinking water quality and its treatment processes. These problems include (i) negative effects on water quality relevant to colour, taste, and odour; (ii) increased disinfectant dose requirements, which in turn result in potential harmful disinfection by-product (DBP) production [8]; (iii) promoted biological growth in the distribution system; and (iv) increased levels of complex heavy metals and adsorbed organic pollutants [9].
Among the available technologies to remove NOM, the most common and economically feasible method is coagulation and flocculation, followed by sedimentation/flotation and filtration. Other treatment options for NOM removal include the magnetic ion exchange resin (MIEX®) technique, activated carbon filtration, advanced oxidation processes, and membrane filtration [10,11,12,13,14,15].
Early studies of filtration processes showed that membranes were effective in removing dissolved organic matter (DOM)—including precursors of trihalomethane (THM)—from surface- and groundwater sources [16]. Over the last decade, the combination of membrane processes with other unit processes has become a common way to achieve the removal of NOM and function as a barrier against microorganisms.
Recently, several studies have focused on evaluating NOM removal by capillary nanofiltration (NF) in Swedish surface water sources. These studies indicate that a process combining coagulation and NF could remove more than 90% of the dissolved organic carbon (DOC), and 96% of the UV absorbance at 254 nm from lake water [17]. Using direct NF resulted in 93% removal of UV-absorbance (UVabs), and 88% total organic carbon (TOC) [18].
Membrane processes need pre-treatment for enhanced NOM removal and decreased membrane fouling. Hybrid processes may therefore be superior to the individual processes. The integration of coagulation with membrane filtration has two main advantages: enhanced removal of NOM molecules and reduction of membrane fouling. The most recent mode of combining coagulant with microfiltration (MF) or ultrafiltration (UF) is to add coagulant into the feed stream immediately prior to the membrane process, without removal of the coagulated solids (in-line coagulation). The advantages of in-line coagulation are the reduced footprint and lower coagulant dose, as settleable flocs are not needed [19]. Coagulant selection and dosing can be optimised specifically for NOM removal, as particle removal is assured by the membrane [20]. Careful dosing is required to produce large enough flocs to avoid pore blocking, while avoiding increased fouling [21].
Coagulant dosing can be challenging in raw water, with large variations in water quality. In raw water sources with relatively stable specific ultraviolet absorbance (SUVA), dosing can be controlled with the UV signal in the incoming raw water. UV has been shown to correlate well with the presence of HS [17], which compose the major fraction removed during coagulation. In this instance, the use of optical sensors for dose control could be a viable method of process control. In this study, a combination of sensor-based in-line coagulation was investigated for the removal of NOM by UF. A 30-month pilot test was carried out on surface water from Lake Neden, a drinking water source for more than 60,000 residents on the west coast of Sweden.
This study aims to evaluate a combined coagulation/UF process, with respect to
  • Its sensitivity and the limits of the coagulant dose for NOM removal
  • The use of optical sensors for online dosing of coagulants
  • Its vulnerability to a further decrease in raw water quality.
The merit of this research is to advance our operational understanding of the effect of membrane hybrid processes, combining UF and in-line coagulation for efficient NOM removal. Particular focus was on dosing control by optical sensors.

2. Material and Methods

2.1. Raw Water Source Quality

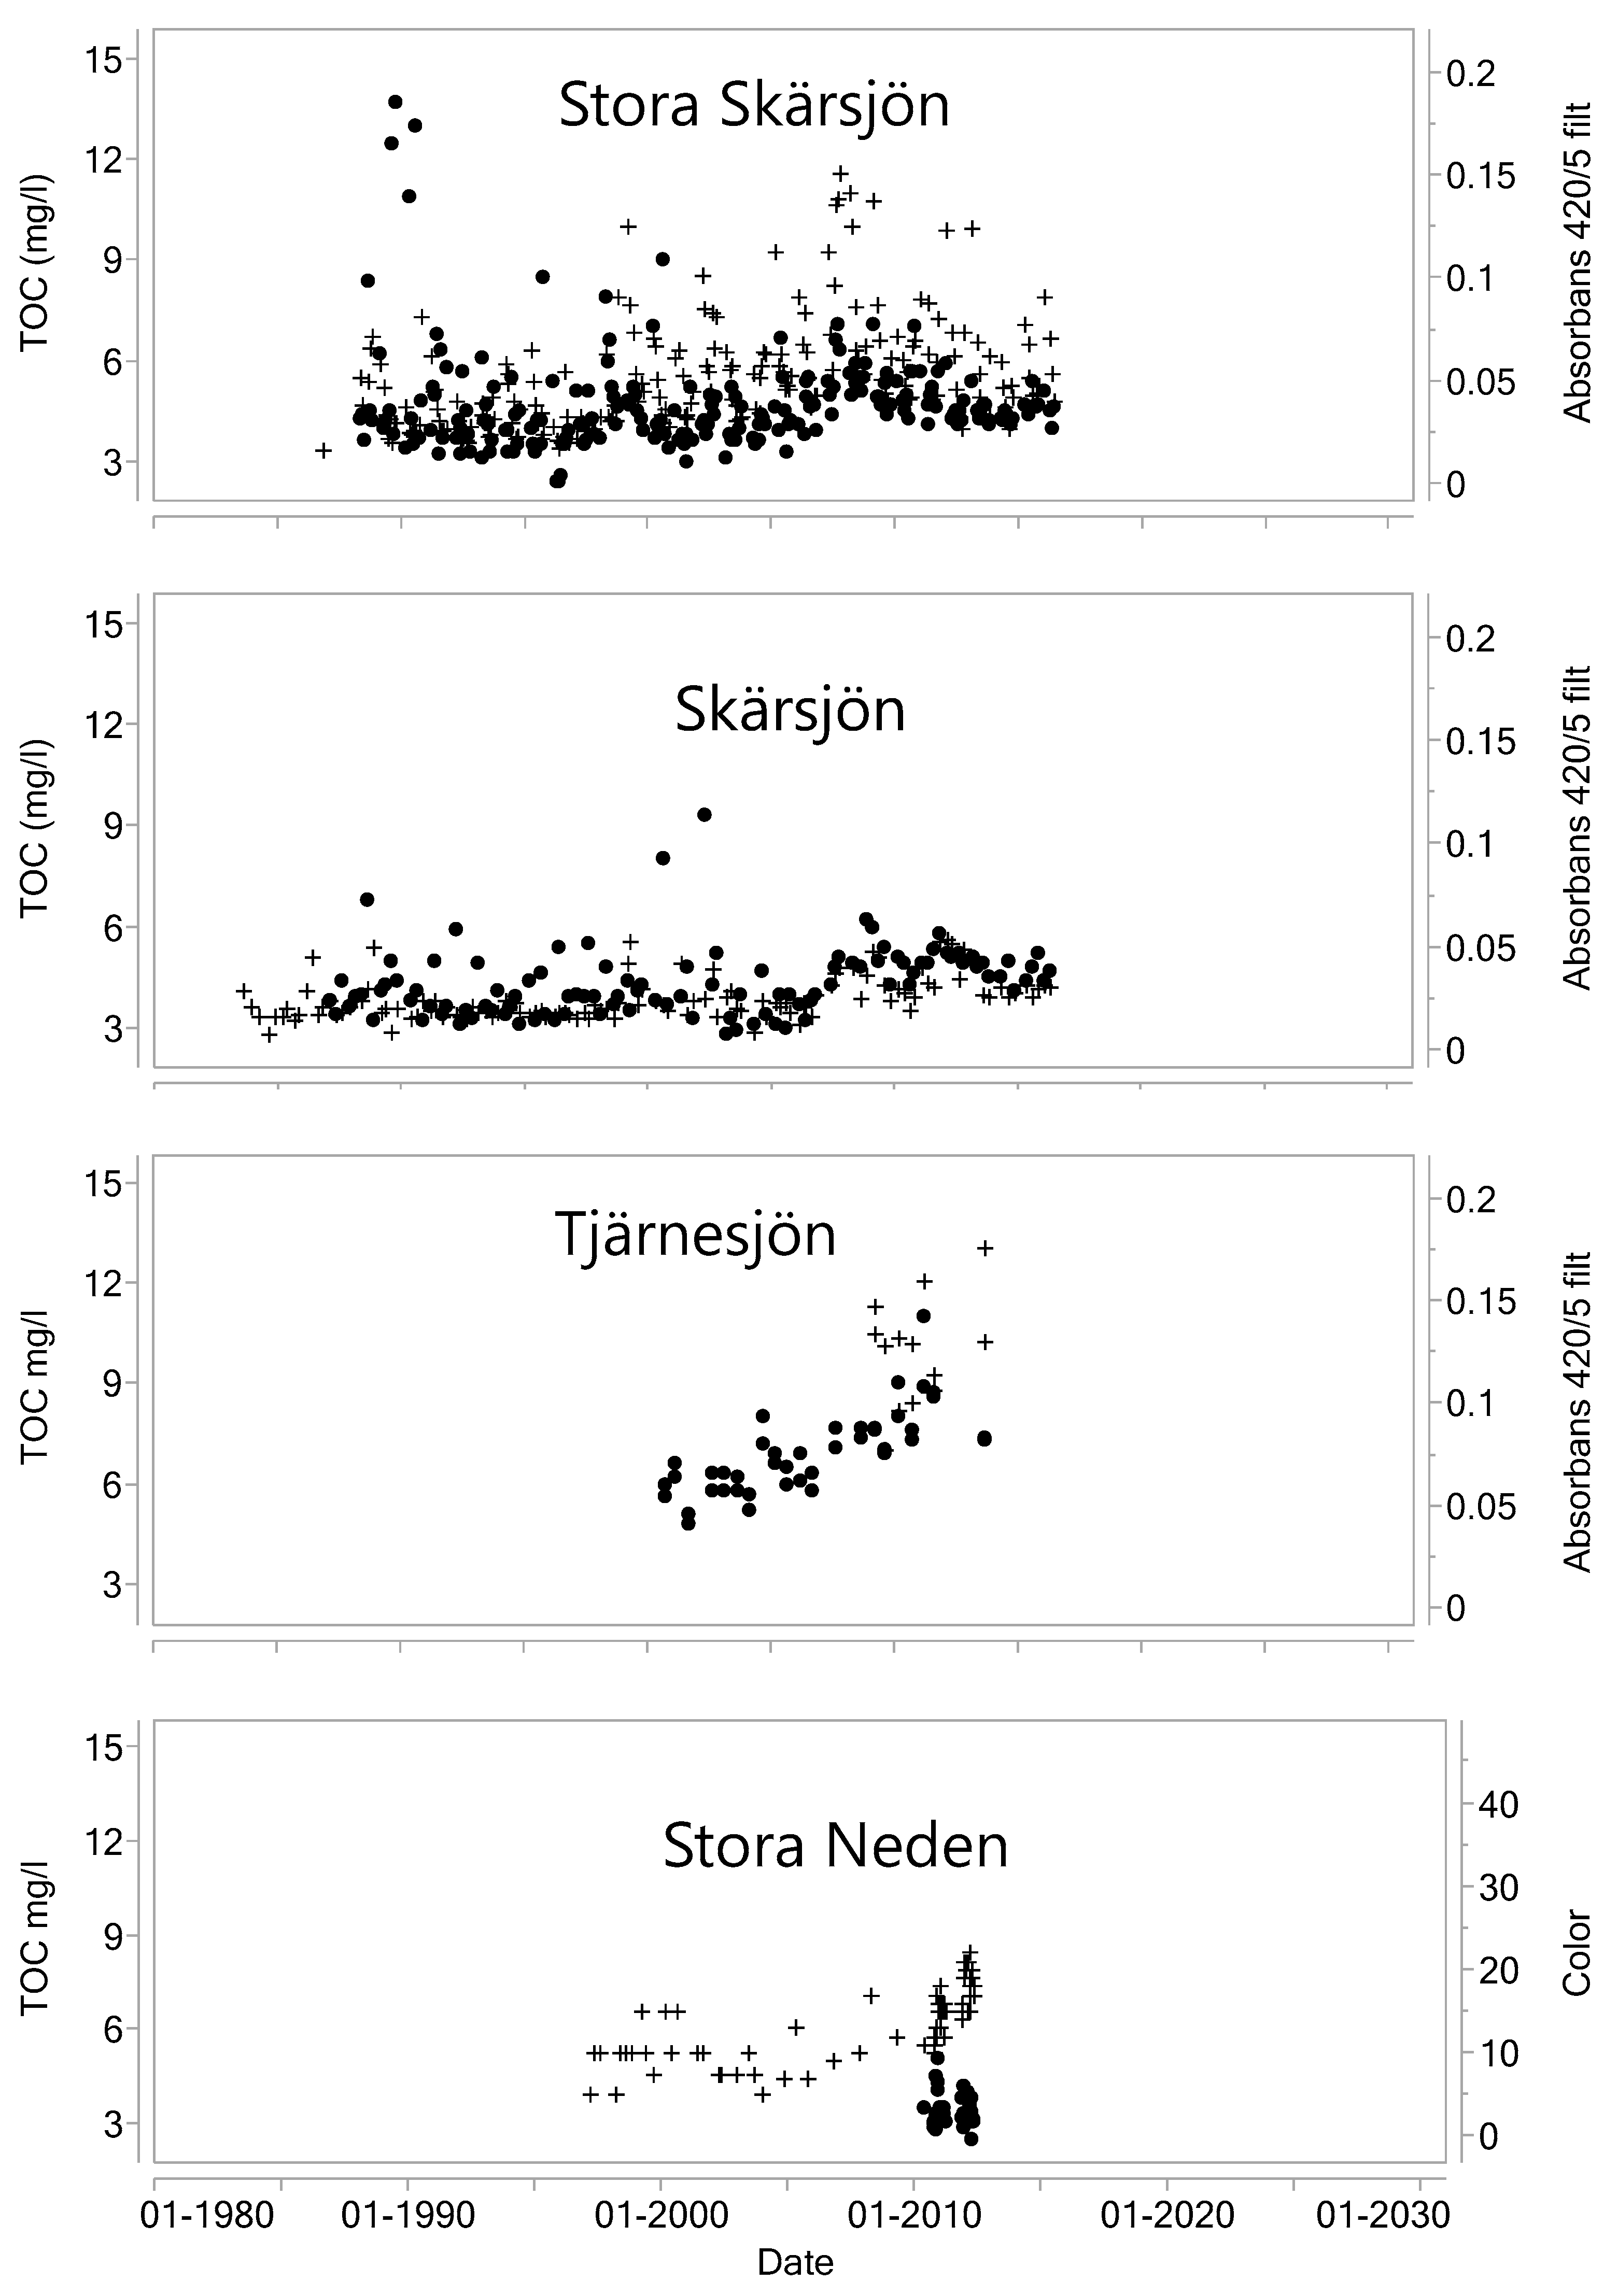
The raw water source used in this study was a mixture (20%/80%) of water from a nearby alkaline groundwater well (pH 8, TOC = 0.6 mg L−1, σ = 380 µS cm−1) and a slightly acidic clear-water lake (pH = 6.7, TOC = 3.4 mg L−1, and σ = 60 µS cm−1). The surface water source was an oligotrophic lake, surrounded by mixed woodland. The average feed water quality of the various pilot trials is described in Table A1. Lake Neden was heavily contaminated by acid rain during the 1980s and 1990s, and was subsequently treated with lime, as were most of the lakes in that area of southwestern Sweden. As a result, the organic matter concentration was suppressed temporarily but is currently recovering to its natural values, similar to many other lakes in the area [22]. In this area, it was observed that the water colour more than doubled during 2007–2012 [23]. The time series of colour (Abs_420) and TOC indicated an increase in colour and carbon content during 1995–2010 in several lakes in the area (Figure A1 and Figure A2). In addition, it is assumed that prolonged vegetation periods will cause higher concentrations of organic matter in the future [24]. Compared with the other lakes in the area, the water of Lake Neden is clear, low in TOC (3.4 ± 0.4 mg L−1), and has a comparatively low SUVA value (3.2 ± 0.4). The removal of organic matter by flocculation is limited by the amount of HS in the water. This characteristic can be determined by using either the SUVA value or by using more advanced DOC characterisation techniques [7]. In all of our experiments, conventional NOM analyses (TOC, DOC, and UV absorbance) and fluorescence excitation emission matrices (EEMs) [7] were combined with liquid chromatography-organic carbon detection (LC-OCD) analysis for feed water, concentrate, and permeate. This was done to elucidate the retention of specific NOM fractions as a function of varying operating conditions.
Consistent with the continuing browning of lakes and rivers in large parts of Scandinavia, a rising trend in colour and chemical oxygen demand (COD) has been observed in the surface water abstracted by the Kvarnagården water treatment plant (WTP). No significant reduction in HS was achieved with the old full-scale treatment process, consisting of rapid sand filtration, pH-adjustment, and UV irradiation.

2.2. UF Full-Scale Design and Pilot Studies

2.2.1. Retrofit of Full-Scale Plant and Pilot Trials

Preliminary pilot trials with one-stage UF (UF-HF-P1) and hollow-fibre NF (NF-HF-P) were performed from June 2010 to May 2012 [25,26]. More extensive field testing with a two-stage UF pilot plant has been carried out since January 2015. An overview of the pilot studies is given in Table 1.
In November 2016, the WTP was upgraded with a UF facility (capacity of 1080 m3 h−1 net permeate flow rate). In brief, the full-scale plant consists of a two-stage UF membrane filtration process, with in-line coagulation of a primary UF membrane stage that provides NOM retention and a barrier function against microorganisms (Figure 1). Because of coagulant residues in the backwash water and the limited sewer capacity of the site, a second-stage UF membrane system was installed to increase the recovery of the plant to >99%.

2.2.2. Control Philosophy of Pin-Floc Coagulation for Full-Scale UF Plant

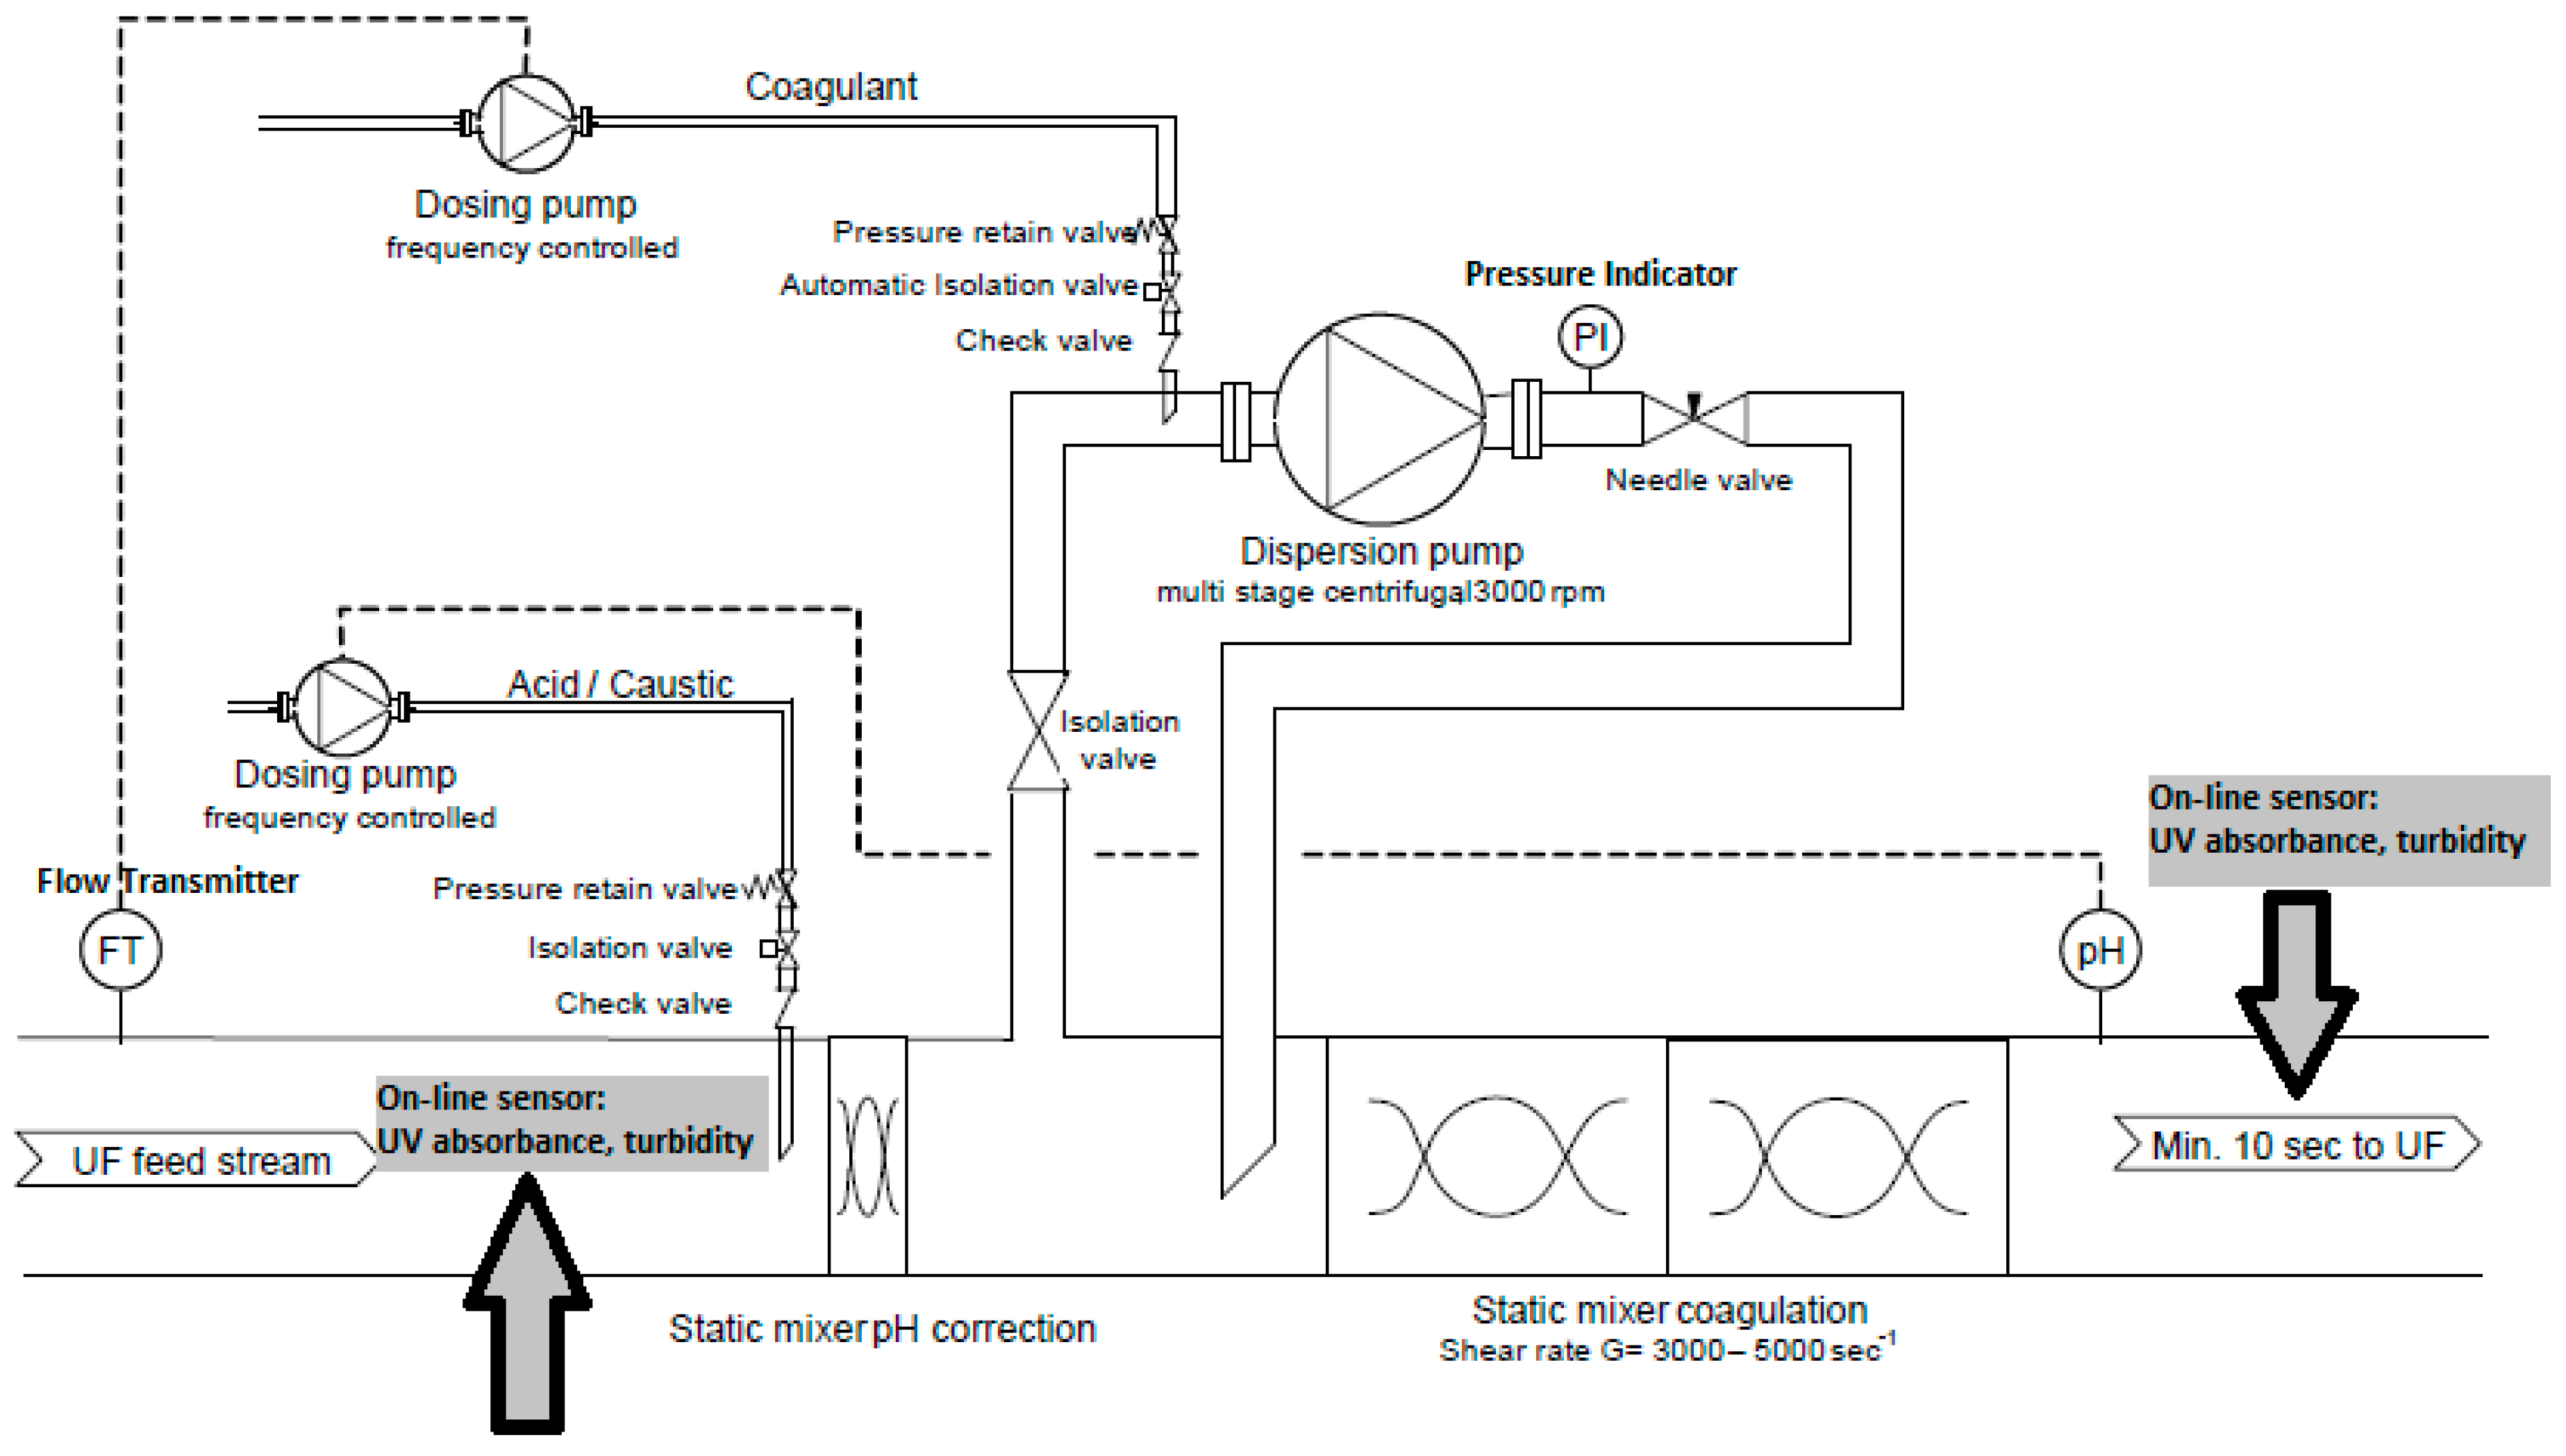
For the full-scale plant, the coagulation philosophy was to create “pin flocs” (i.e., flocs of limited size) for the operation of the UF hybrid process. On the one hand, these pin flocs are of sufficient size to be retained by the UF membranes and to create a relatively open cake structure on the membrane surface. On the other hand, the floc size required could be limited because the removal of solids is determined by the size difference between the flocs and the membrane pores, and does not depend on gravitational separation. The critical parameters for optimum pin-floc coagulation are proper distribution of the coagulant into the UF feed stream, a sufficiently high mixing energy at the coagulant dosing point during a minimum contact time, and an optimum pH depending on the coagulant selected. The specific coagulation dosing conditions for the UF full-scale plant in the present study are shown in Figure 2. A similar but more simplified set-up was applied for the UF pilot studies.
Based on extended UF-trials [25] (year 2011), the effective coagulant concentration required to improve UF operation was found to be in the range 0.4–1.5 mg Al L−1. As the efficiency of pin-floc coagulation strongly depends on the absolute number of collisions at the dosing point, the proper distribution of these relatively low coagulant concentrations and UF feed water is vital. For this reason, a maximum dilution factor of 500 was applied in the present study. This means that direct dosing of the coagulant stock concentration into the UF feed stream was avoided. Instead, a small separate dispersion pump was installed to create a carrier water supply, which obtained water from the UF feed line. The coagulant stock concentration was dosed into the suction line of the dispersion pump. For operational flexibility, the coagulant dosing pump was frequency controlled to enable flow-ratio dosing control based on the actual UF feed flow.
At the coagulant dosing point, the mixing energy should be sufficiently high to maximize the absolute number of collisions and consequent pin flocs. This was achieved by installing a static in-line mixer, providing a plug-flow contacting environment. A residence time of 10 s between the coagulant dosing point and the first UF unit was sufficient to allow for a limited flocculation period.
If pH correction of the UF feed stream was required, a frequency-controlled dosing pump for acid/caustic chemicals would be necessary to achieve stable pH control, based on pH and flow fluctuations of the UF feed stream. Since coagulant dosing influenced the pH of the UF feed, pH was measured downstream of the static mixer. For proper mixing of the acid/caustic chemicals into the UF feed stream, a low-pressure drop static in-line mixer was installed upstream of the coagulant dosing point.

2.2.3. Two-Stage UF Test Facility (UF-HF-P2)

During the construction period of the membrane plant, an extensive test facility was established for various long-term trials to verify the membrane performance of the full-scale design (Figure 3).
A 40 foot (12 m)-long container pilot plant (designed as a stand-alone unit to mimic the full-scale UF plant) has been in operation since January 2015, with a treatment capacity of 170 m3/day (150 m3/day permeate production). The pilot plant consists of the following main sections:
  • Feed section, including dosing equipment for coagulant and chemicals for pH correction,
  • Membrane system (two-stage UF), including air integrity testing,
  • Permeate and backwash section, including chemical dosing for membrane cleaning.
The pilot plant was equipped with a computer for systems control and automatic operation. All the necessary process parameters were logged and trended on the computer. The plant allowed remote access, providing the same functionality as local access.
The two-stage membrane system comprised (a) a primary UF unit (horizontal dead-end filtration), with two membrane modules (Pentair X-Flow XIGA, 55 m2); and (b) a secondary UF unit (vertical dead-end filtration), with one membrane module (Pentair X-Flow AQUAFLEX, 55 m2). The raw water was supplied from the intake of the WTP to the primary feed tank by a pressurised line. The feed pump obtained water from the primary feed tank during the filtration of the primary UF unit. If pH correction of feed water was required, both H2SO4 and NaOH were added in front of the feed pump to obtain an optimal pH window for coagulants. During filtration, the UF permeate was directed to the permeate tank and discharged by overflow to the recipient. Permeate water from the permeate tank was used during backwashing of the UF units. The backwash waste from the primary UF unit was directed to the secondary feed tank. Chemical waste from the chemically-enhanced backwashing (CEB) programme at the primary UF unit was directed to the chemical waste discharge. During the backwash of the primary UF unit, the secondary feed tank was filled. When the primary UF unit finished a filtration cycle and the secondary feed tank reached a specific level, the primary UF unit stopped after a final backwash. Subsequently, the secondary UF unit was activated and started production. During filtration of the secondary UF unit, the feed pump obtained water from the secondary feed tank. The secondary permeate was directed to the permeate tank. During the hydraulic cleaning (feed water plus permeate) of the secondary UF unit, the waste water was directed to the non-chemical waste discharge facility. The waste water of the CEB for the secondary unit was directed to the chemical waste discharge facility. One feed pump was available for both the primary and the secondary units. In addition, one backwash pump was available for both the primary and secondary UF units. For the CEBs, dosing systems for H2SO4, NaOH, and NaOCl were available. The dosing points were placed in the backwash inlet line, and were used by both the primary and secondary units.
In addition to the hydraulic cleaning of the membranes with a combined backwash and forward flush, several automatic cleaning sequences were pre-programmed for specific cleaning protocols. In general, cleaning took place on an elapsed-time interval. A cleaning cycle consisted of flushing with clean water (permeate), followed by soaking with a maximum of two cleaning agents (acidic and caustic). The average feed water quality, cleaning protocols, and operational conditions during long-term test runs are summarised in Table A2 and Table A3, whereas the membrane key performance parameters and manufacturer-reported properties of the hollow fibre membranes are listed in Table A4.

2.2.4. Coagulant Dosing System for UF Test Facility

The online measurements of turbidity and UV absorbance (254 nm) in feed water (UVRaw) were used to control the coagulation dosing rate in the feed line in order to meet the target values for NOM removal and permeate quality. The dosing rate of coagulants could be adjusted depending on current feed water quality and flow rates, according to Equation (1). The dependence was derived based on empirical evaluations of laboratory experiments and pilot studies, as part of the current study and previous studies by the authors [25].
D o s C o a g = A + B ( T U R B ) + C ( U V   a b s )
where
  • D o s Coag is the coagulant dosing concentration (mg Metal L−1)
  • B is the conversion factor for turbidity [-] (was set to zero during the pilot trials)
  • C is the conversion factor for UV absorbance [-] (range: 0.005–0.035)
  • T U R B is the feed water turbidity (FTU)
  • U V   a b s is the feed water UV absorbance (m−1)
  • A is a set point for the base coagulant dosage (range: 0.2–2.0).

2.2.5. Evaluation of Coagulation Efficiency

The variation of and differences in UV signals between the raw (UVRaw) and permeate (UVPerm) is the most efficient way to evaluate the removal efficiency of the UF flocculation process. The removal efficiency of UV absorbance at different coagulant dosing situations was evaluated by comparing the absolute change in UV absorbance (Equations (2)–(4)).
Δ   U V = U V R a w U V P e r m .
The observed values for UV were subsequently plotted as a function of the aluminium dose and fitted to a power relationship of the form:
Δ   U V = a +   b A l D O S + c A l D O S   2
With a, b, and c used as empirical fitting factors to describe the observed curvature. In addition, a change in the UV removal efficiency that is normalised to the target coagulant dose (AlDOS*) under regular operational conditions of 0.6 mg L−1 was calculated as:
U V n o r m = Δ U V A l D O S ( t ) A l D O S
After initial separate treatment of the data from experiments UF-HF-P1 and UF-HF-P2 (Table 1), the datasets were combined, as the resulting curvature from the experiments was not different.

2.3. Characterisation of Organic Fractions in Feed Water and Treated Water

2.3.1. Determination of UV, TOC, and DOC

The following three measurements were done by a commercial laboratory. The UV absorbance at 254 nm was measured with a 5-cm cuvette (UVLab2 unfilt) using a Hach DR 5000 UV-Vis spectrophotometer (Loveland, CO, USA). The TOC and dissolved organic carbon (DOC) were determined using an Elementar Vario TOC Cube analyser (Langenselbold, Germany), with precision of 0.2 mg L−1.

2.3.2. Evaluation of NOM Retention by LC-OCD

The composition of the organics that were present in the water samples of this study were characterised by using UV absorbance at 254 nm and DOC-LABOR liquid chromatography-organic carbon detection (LC-OCD). The LC-OCD technique is based on a polymethacrylate size-exclusion column (Toso, Japan), coupled with three detectors (organic carbon, organic nitrogen, and UV-absorbance). This technique facilitates the subdivision of organic matter into six major subfractions: biopolymers, HS, building blocks, low-molecular-weight acids, low-molecular-weight neutrals, and hydrophobic organic carbon. Detailed information on the LC-OCD technique is available from the following studies [17,27,28].

2.3.3. Absorbance and Fluorescence Characterisation and Additional DOC and TOC

The presence of organic carbon was determined on unfiltered (TOC) and filtered samples (DOC) by using pre-combusted (4 h at 450 °C) GF/F filters (effective pore size of 0.7 μm) and acidified to pH 2 by using 37% HCl on a Shimadzu TOC-VCPH (Kyoto, Japan). The TOC and DOC were within the analytical precision parameters of the measurements (0.3 mg L−1). Fluorescence excitation emission matrices (EEMs) were collected by using an Aqualog (Horiba, Edison, NJ, USA) spectrofluorometer [7]. Previously established indices were calculated from the corrected EEMs—namely humification index (HIX), fluorescence index (FI), and freshness index (β:α) according to Cory and McKnight [29]; Ohno [30]; and Parlanti et al. [31]. The freshness index (β:α) has been shown to be particularly valuable for the characterisation of coagulation [7,17].

2.4. Optical Sensors for Online Process Control and Dosing

Two online instruments (i::scan™; s::can Messtechnik GmbH, Vienna, Austria) were installed to detect the changes in the UV absorbance, colour, and turbidity in the feed water after the groundwater and lake water had been mixed (UFFeed), and alternatively, in the permeate from both UF stages (UFPerm). In addition to the UV absorbance probes, pH-sensors, pressure transmitters, flow meters, and temperature sensors were used for online monitoring of membrane performance and water quality. The absorbance spectra in the wavelength range 230–350 nm were acquired, with the online sensor using a flow-cell with a path length of 35 mm. The empirical relationships from particle-rich waters were used to calibrate the absorbance measurements against both TOC and turbidity, with algorithms developed by the probe manufacturer (so-called global calibration).
The correctness of the absorbance values of the online sensors were monitored by using three other independent UV absorbance measurements. On a biweekly basis, the UV was measured directly in unfiltered water samples by the operators at the WTP, using a 4-cm cuvette (UVLab1 unfilt) and at a commercial laboratory (UVLab2 unfilt; see Section 2.3.1). Furthermore, the filtered water samples were sent to an external research laboratory and measured by using a 1-cm flow-through cuvette (UVLab3 filt) in combination with a high-precision combined fluorescence/absorbance spectrophotometer (Aqualog Horiba Jobin Yvon). During the second year of the study, an internal standard (60 ppm K-phthalate, with approximately A = 0.7 @ 254 nm) was added to all the sample runs to determine whether UV lamp drift had occurred.
The correctness of the calculated turbidity values of the online sensors were monitored with regular laboratory measurements of turbidity, using a HACH Model 2100N IS® Turbidimeter (Loveland, CO, USA), designed for turbidity measurement in accordance with ISO 7027.
The presence of particles probably led to deposition on the sensor, particularly on the raw water side. To prevent the degradation of the online signals, both probes were cleaned at regular intervals by following the procedures suggested by the manufacturer. For automatic cleaning, a rotating brush was mounted inside the flow cell in such way that the brush fibres reached the measuring windows on both sides of the measurement path of the spectrometer probes. The optimal autobrush cleaning settings were defined to 10 brush rotations every 20 min for the permeate and 10 brush rotations every 5 min for the feed water. Manual cleaning of the probes was carried out preventively once a month by using a mild alkaline cleaning agent provided by the manufacture and cleaning tissue. In the event of persistent fouling, pure alcohol (ethanol) and 3% hydrochloric acid (to prevent a mineral film/residue forming on the measuring windows) were used as cleaning liquids. The observed changes in UV absorbance and the calculated turbidity before and after manual cleaning typically ranged between 0.2 and 0.3 m−1 and 0.1 and 0.2 FTU, respectively.

3. Results and Discussion

3.1. Preliminary Membrane Trials Using NF (NF-HF-P) and UF (UF-HF-P1)

Preliminary feasibility tests were carried out between 2010 and 2012 with several membrane processes to reduce the NOM concentration in the drinking water. Ultrafiltration with and without coagulant dosage was compared with hollow-fibre NF. The results from these test runs are summarised in Table 2.
Whereas UF alone did not remove NOM sufficiently, UF with in-line coagulation and hollow-fibre NF produced permeate that complied with the regulatory requirements for colour and COD.
Three operational modes of the UF pilot plant (UF-HF-P1) were investigated during the feasibility tests, namely: (1) dead-end filtration; (2) cross-flow with continuous bleed; and (3) cross-flow with intermittent flush. Dead-end filtration with raw water resulted in rapid increase of trans-membrane pressure (TMP). Cross-flow with continuous bleed produced approximately 20% of the feed flow as concentrate, requiring further treatment or having to be discarded. The operational mode that facilitated constant, high flux, and high recovery was cross-flow with intermittent flush. The UF was run with a polyaluminium coagulant dose of 1 mg/L Al per cubic metre of raw water [25].
UF with in-line coagulation could be run at a flux of approximately 60 L/m2/h (LMH), which was four times the flux for capillary NF. This has major implications related to investment costs and the footprint of the plant. Accordingly, it was decided to continue the investigation focusing on a retrofit of the old full-scale plant with a UF hybrid process, with the aim of achieving NOM removal (as UVabs) of at least 50% and feed water recovery of at least 99%.

3.2. Pilot Trials Using the Two-Stage UF Pilot Plant Test Facility (UF-HF-P2)

The pilot trials with primary and secondary UF were used to identify the optimal operating conditions for the full-scale plant. At the design flux of 65 LMH and with a CEB interval after 20 filtration cycles, the primary UF stage showed stable operational conditions at permeability of approximately 400 LMH/bar over a period of 30 months. In this context, three episodes were analysed further, as they related to the robustness of the process. These are:
  • Impact of in-line coagulation on NOM removal and membrane performance
  • Effect of operation at high flux (maxflux and subsequent regaining of permeability)
  • Varying feed water quality (e.g., surface water only or variation in surface water NOM content).

3.2.1. Pilot Trials (UF-HF-P2): Episode 1—Effect of in-Line Coagulation

Initial trials with various coagulants (PAX XL 100 and PLUSPAC 1465) and varying doses resulted in long-term settings for coagulant dosing, Doscoag = 0.6 mg Al L−1 (base coagulants dosage, A = 0.25; and a correction factor for UV absorbance, C = 0.035).
Over a period of four days (7–11 December 2015), the pilot plant was operated without coagulant dosing, at a flux of 65 LMH. During that time, the permeability before the daily CEB quickly decreased from approximately 400 to below 250 L m−2 h−1 bar−1 @ 20 °C. After two extended CEBs, the permeability prior to the daily CEB started increasing slowly again. However, the initial permeability of 400 L m−2 h−1 bar−1 @ 20 °C could not be restored completely within a week after the incident (Figure 4).
The simulated shutdown of coagulant dosing caused an instant decrease in the permeability of the primary UF, which could not be recovered fully by subsequent CEBs. The membrane obviously had lower “critical flux” without the coagulant. The critical flux of the membrane should be quantified for relevant feed water quality and coagulant dosing conditions in order to avoid irreversible loss of permeability. Investigation should be conducted to determine whether the permeability lost during such incidents could be recovered by a cleaning-in-place (CIP). Moreover, process strategies should be formulated on whether to reduce the flux automatically when a sudden loss of coagulant dosage occurs.
Once the full-scale plant is in stable operation, the pilot plant could be used to adjust the CEB and CIP conditions to ensure effective yet mild cleaning of the membranes. Furthermore, there should be a balance between the level of NOM removal and effective cleaning protocols, as well as the mechanical and chemical long-term stability of the membrane [26].

3.2.2. Pilot Trials (UF-HF-P2): Episode 2—High-Flux Testing

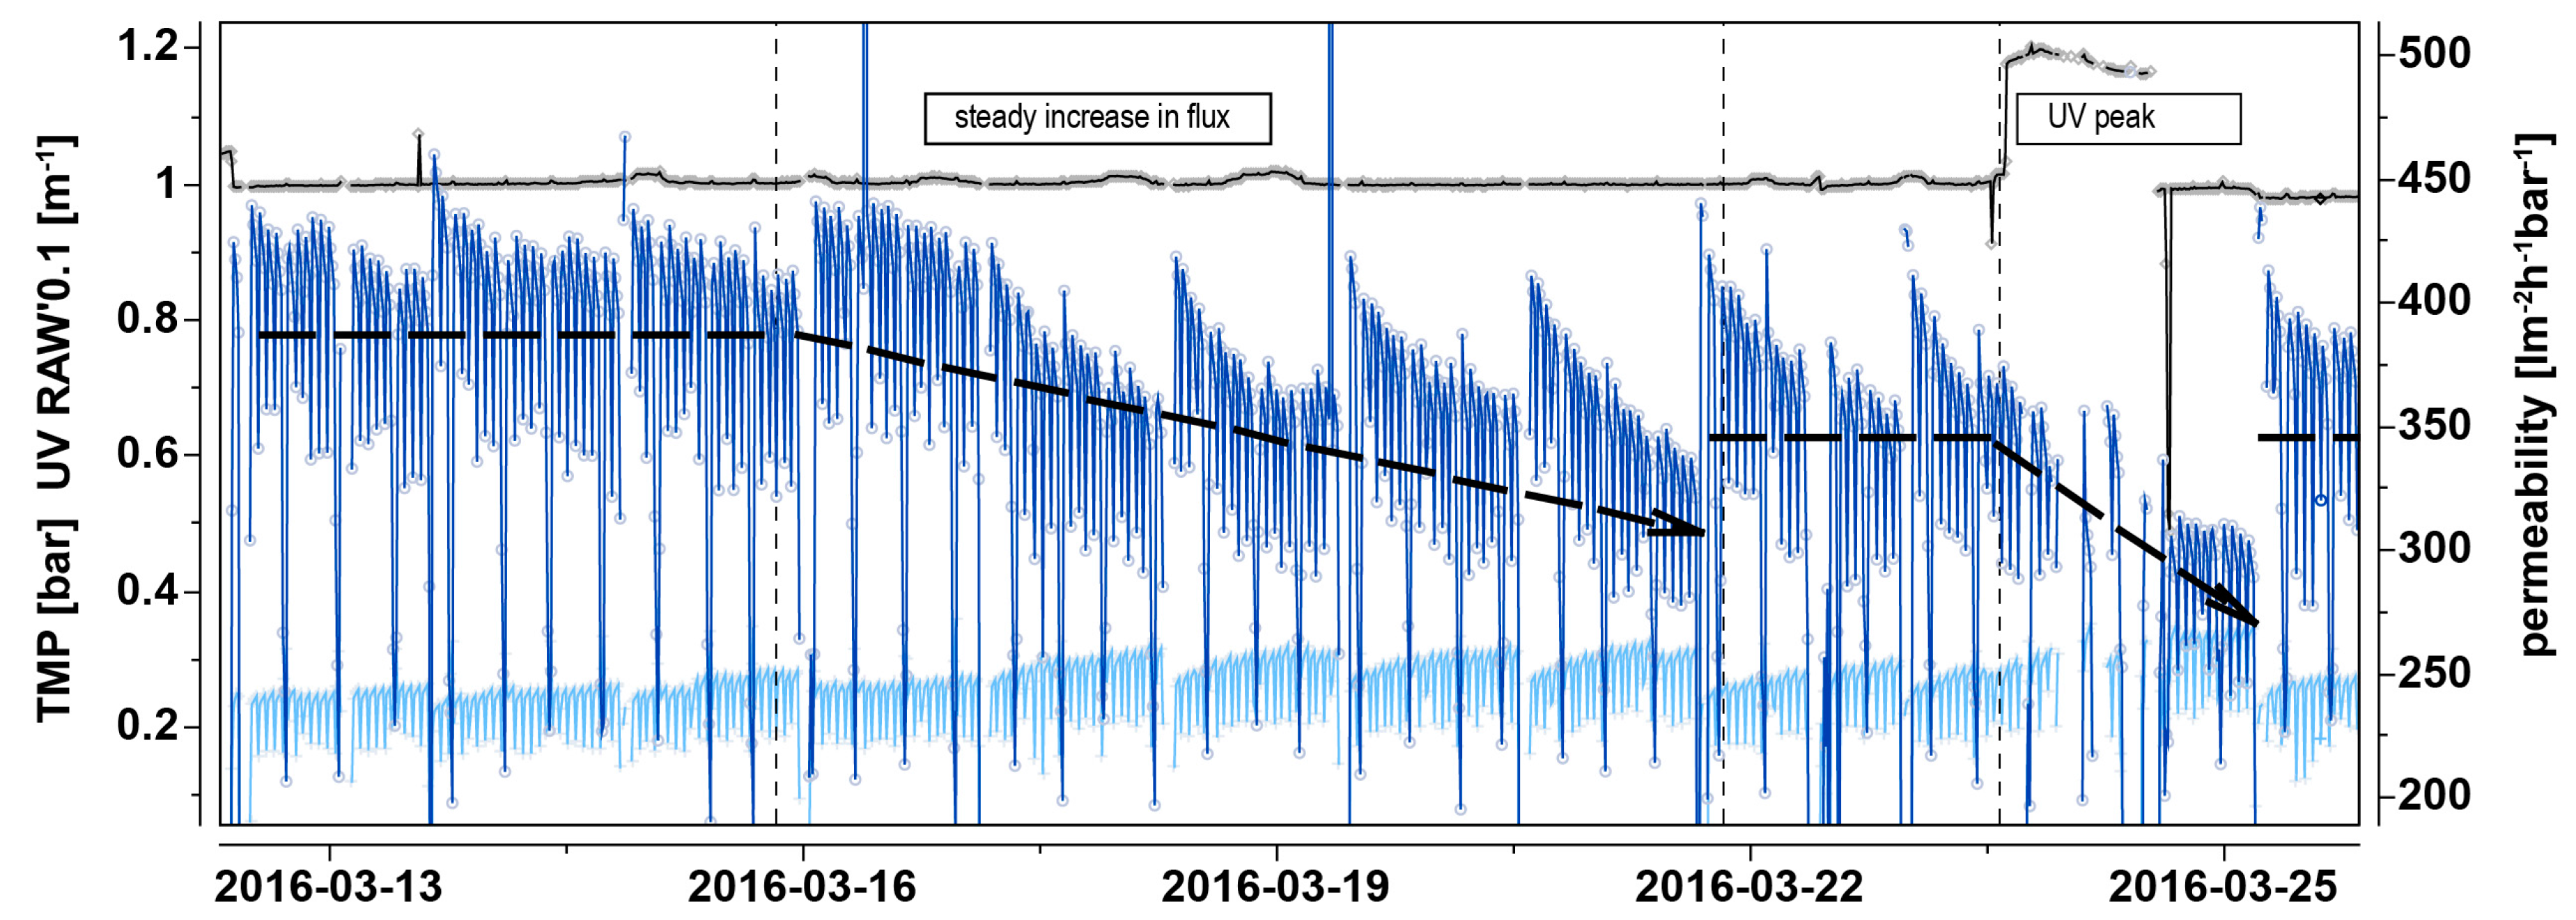
Over a period of six days (15–21 March 2016), the flux over UF stage-1 was increased from 65 to 70 LMH (i.e., by 7.7%), with a coagulation dosing concentration of 0.6 mg Al L−1 (Figure 5). Before this specific episode, the permeability was stable at approximately 400 L m−2 h−1 bar−1 @ 20 °C, with only minor reduction during a filter run, and 80 L m−2 h−1 bar−1 @ 20 °C between daily CEBs. In addition, the permeability was restored by the CEB and was maintained in the long term. At 70 LMH, the permeability drop during a filter run was more rapid (40 L m−2 h−1 bar−1 @ 20 °C), and there was a tendency toward decreasing permeability with every passing day (120 L m−2 h−1 bar−1 @ 20 °C between daily CEBs). There was a strong indication that a certain maximum flux should not be exceeded in the long-term operation. These boundaries should be quantified by using the pilot plant for varying raw water qualities and temperatures. At the end of the high-flux testing period, a change in the raw water quality occurred (increase of UV absorbance from 10 to 11.5 m−1), which resulted in a further decrease in permeability (below 300 L m−2 h−1 bar−1 @ 20 °C), although the coagulant dose was automatically adapted to 0.7 mg Al L−1 in accordance with the current UV correction factor and ordinary flux settings (65 LMH). The membrane system recovered first, after a further two days of normal operation, regaining levels of permeability and TMP comparable with the operational conditions prior to the testing period.

3.2.3. Pilot Trials (UF-HF-P2): Episode 3—Varying Feed Water Quality

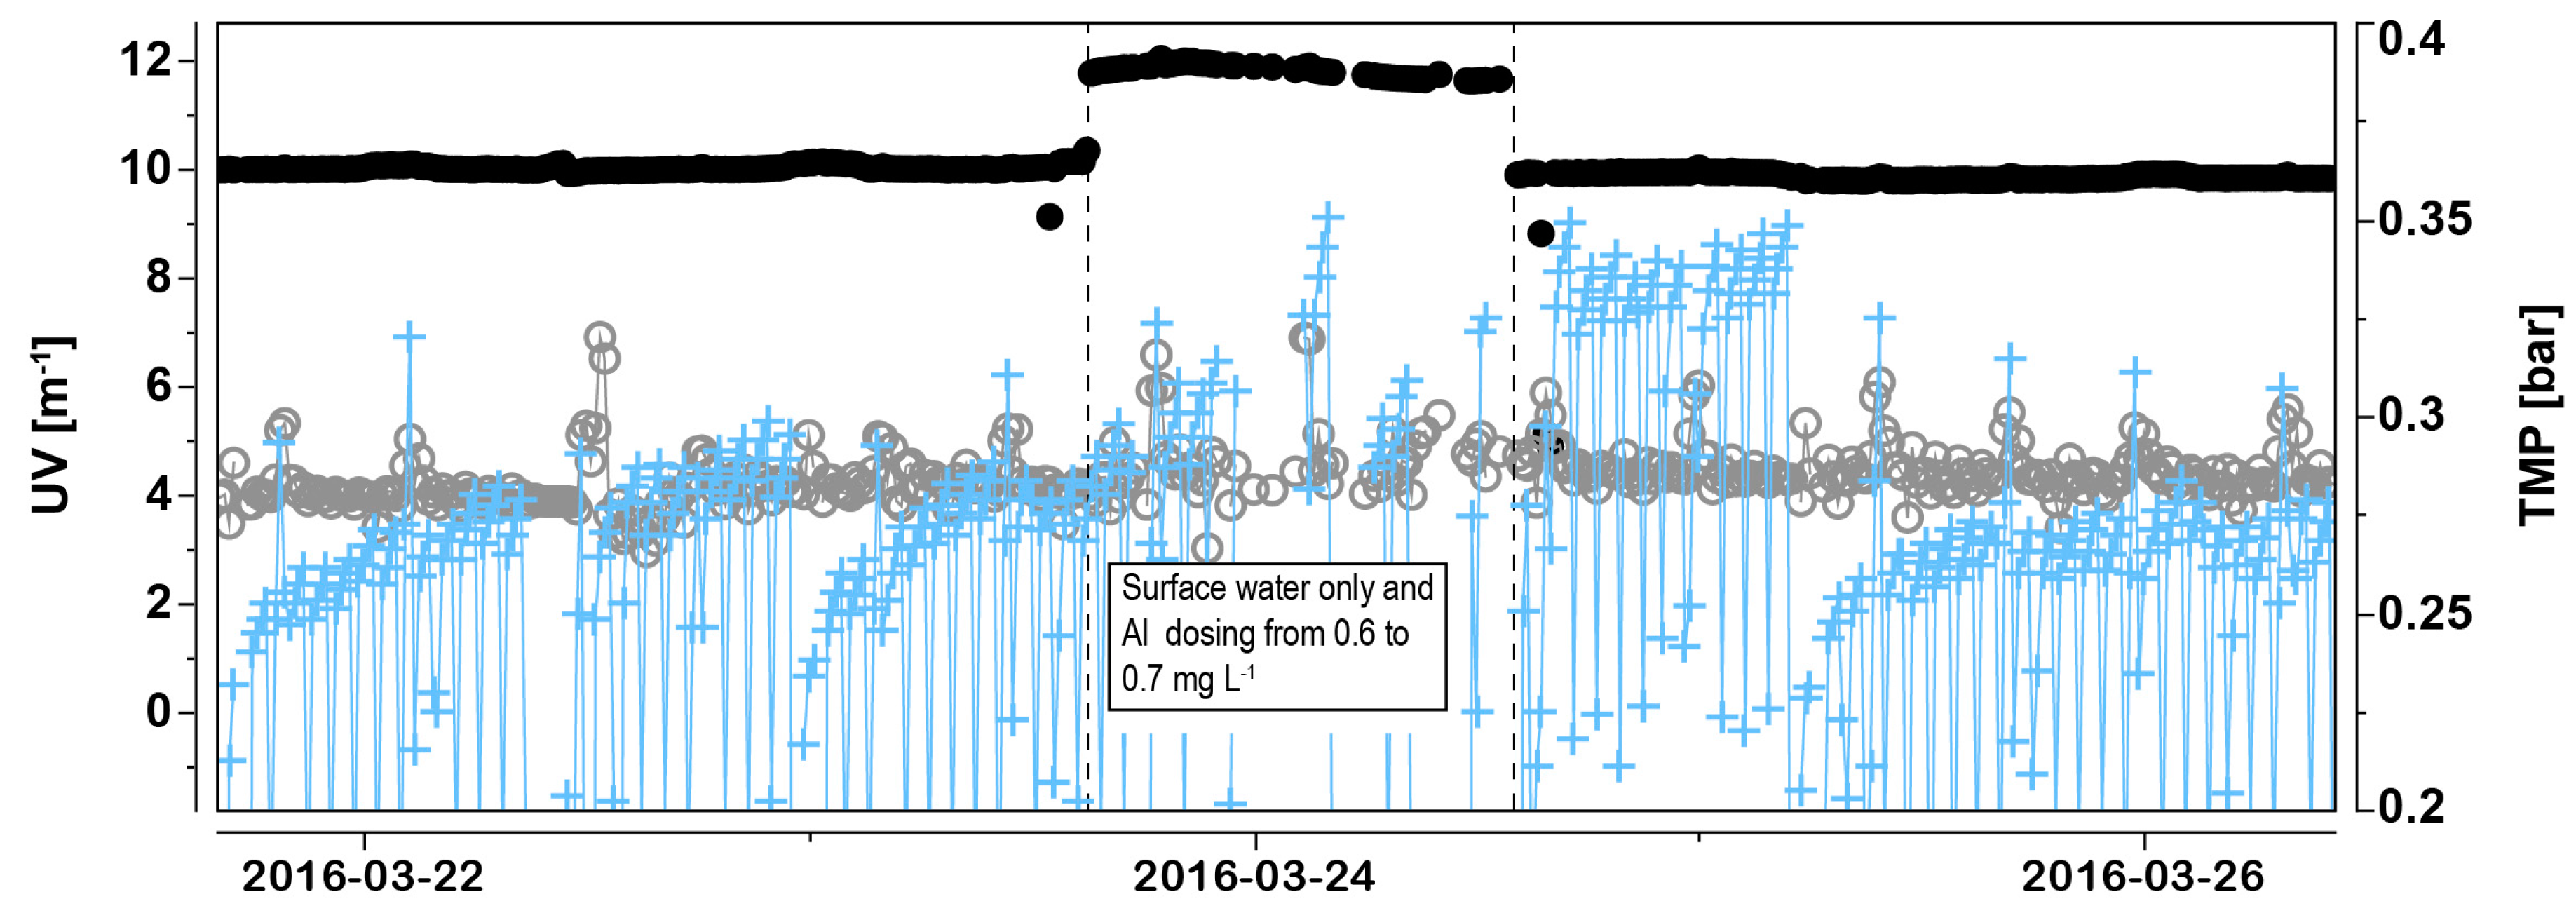
During a period of 21 h (23–24 March 2016), the feed water consisted of surface water only (no addition of alkaline groundwater). As shown in Figure 6, the change in the quality of the raw water resulted in an increase in TMP from 0.18 to 0.35 at a flux of 65 LMH. Despite recurring backwashing and one CEB during this period, the TMP could not be stabilised and the high levels could not be brought down, even after the addition of mixed raw water. The change in the feed water had no further effect on the removal efficiency of NOM, but the filtration behaviour indicated a tendency towards membrane fouling. Therefore, the cleaning protocols had to be adapted with regard to frequency and choice of cleaning chemicals.

3.3. Characterisation of Organic Matter in the Raw and Permeated Water

3.3.1. Absorbance and Fluorescence Data Evaluation

The temporal changes in the organic matter concentration and character of the raw water source of Lake Neden were minor compared with other surface-water drinking-water plants in Sweden (e.g., Görväln WTP, Råberga WTP, and Ringsjö WTP) [18,32]. The turnover time of close to five years probably allowed for substantial removal of terrestrial-derived carbon, similar to the process observed in a larger Swedish lake, Lake Mälaren [33]. The comparatively low SUVA (2.97 ± 0.05) and high freshness (0.63 ± 0.01) in the raw water (Table 3) were indicative of mixing both with groundwater with low SUVA (2.0 ± 0.18, Table 4) and with lake water containing internally produced carbon. This source water was more difficult to flocculate compared with many other boreal lakes, with shorter turnover times and a higher proportion of forest cover on the catchment. This notion is corroborated by the observation of a comparably high fraction (3%) of biopolymers in the lake water (Table 4).
The UV absorbance at 254 nm was measured with four different devices: online (UVSensor), in the laboratory of the WTP (UVLab1 unfilt.), in a commercial laboratory (UVLab2 unfilt.), and on filtered samples in a research laboratory (UVLab3 filt.). Because of differences during the trials, the data were evaluated for the entire period and for each year (Table 3). The results are discussed in more detail in Section 3.4.
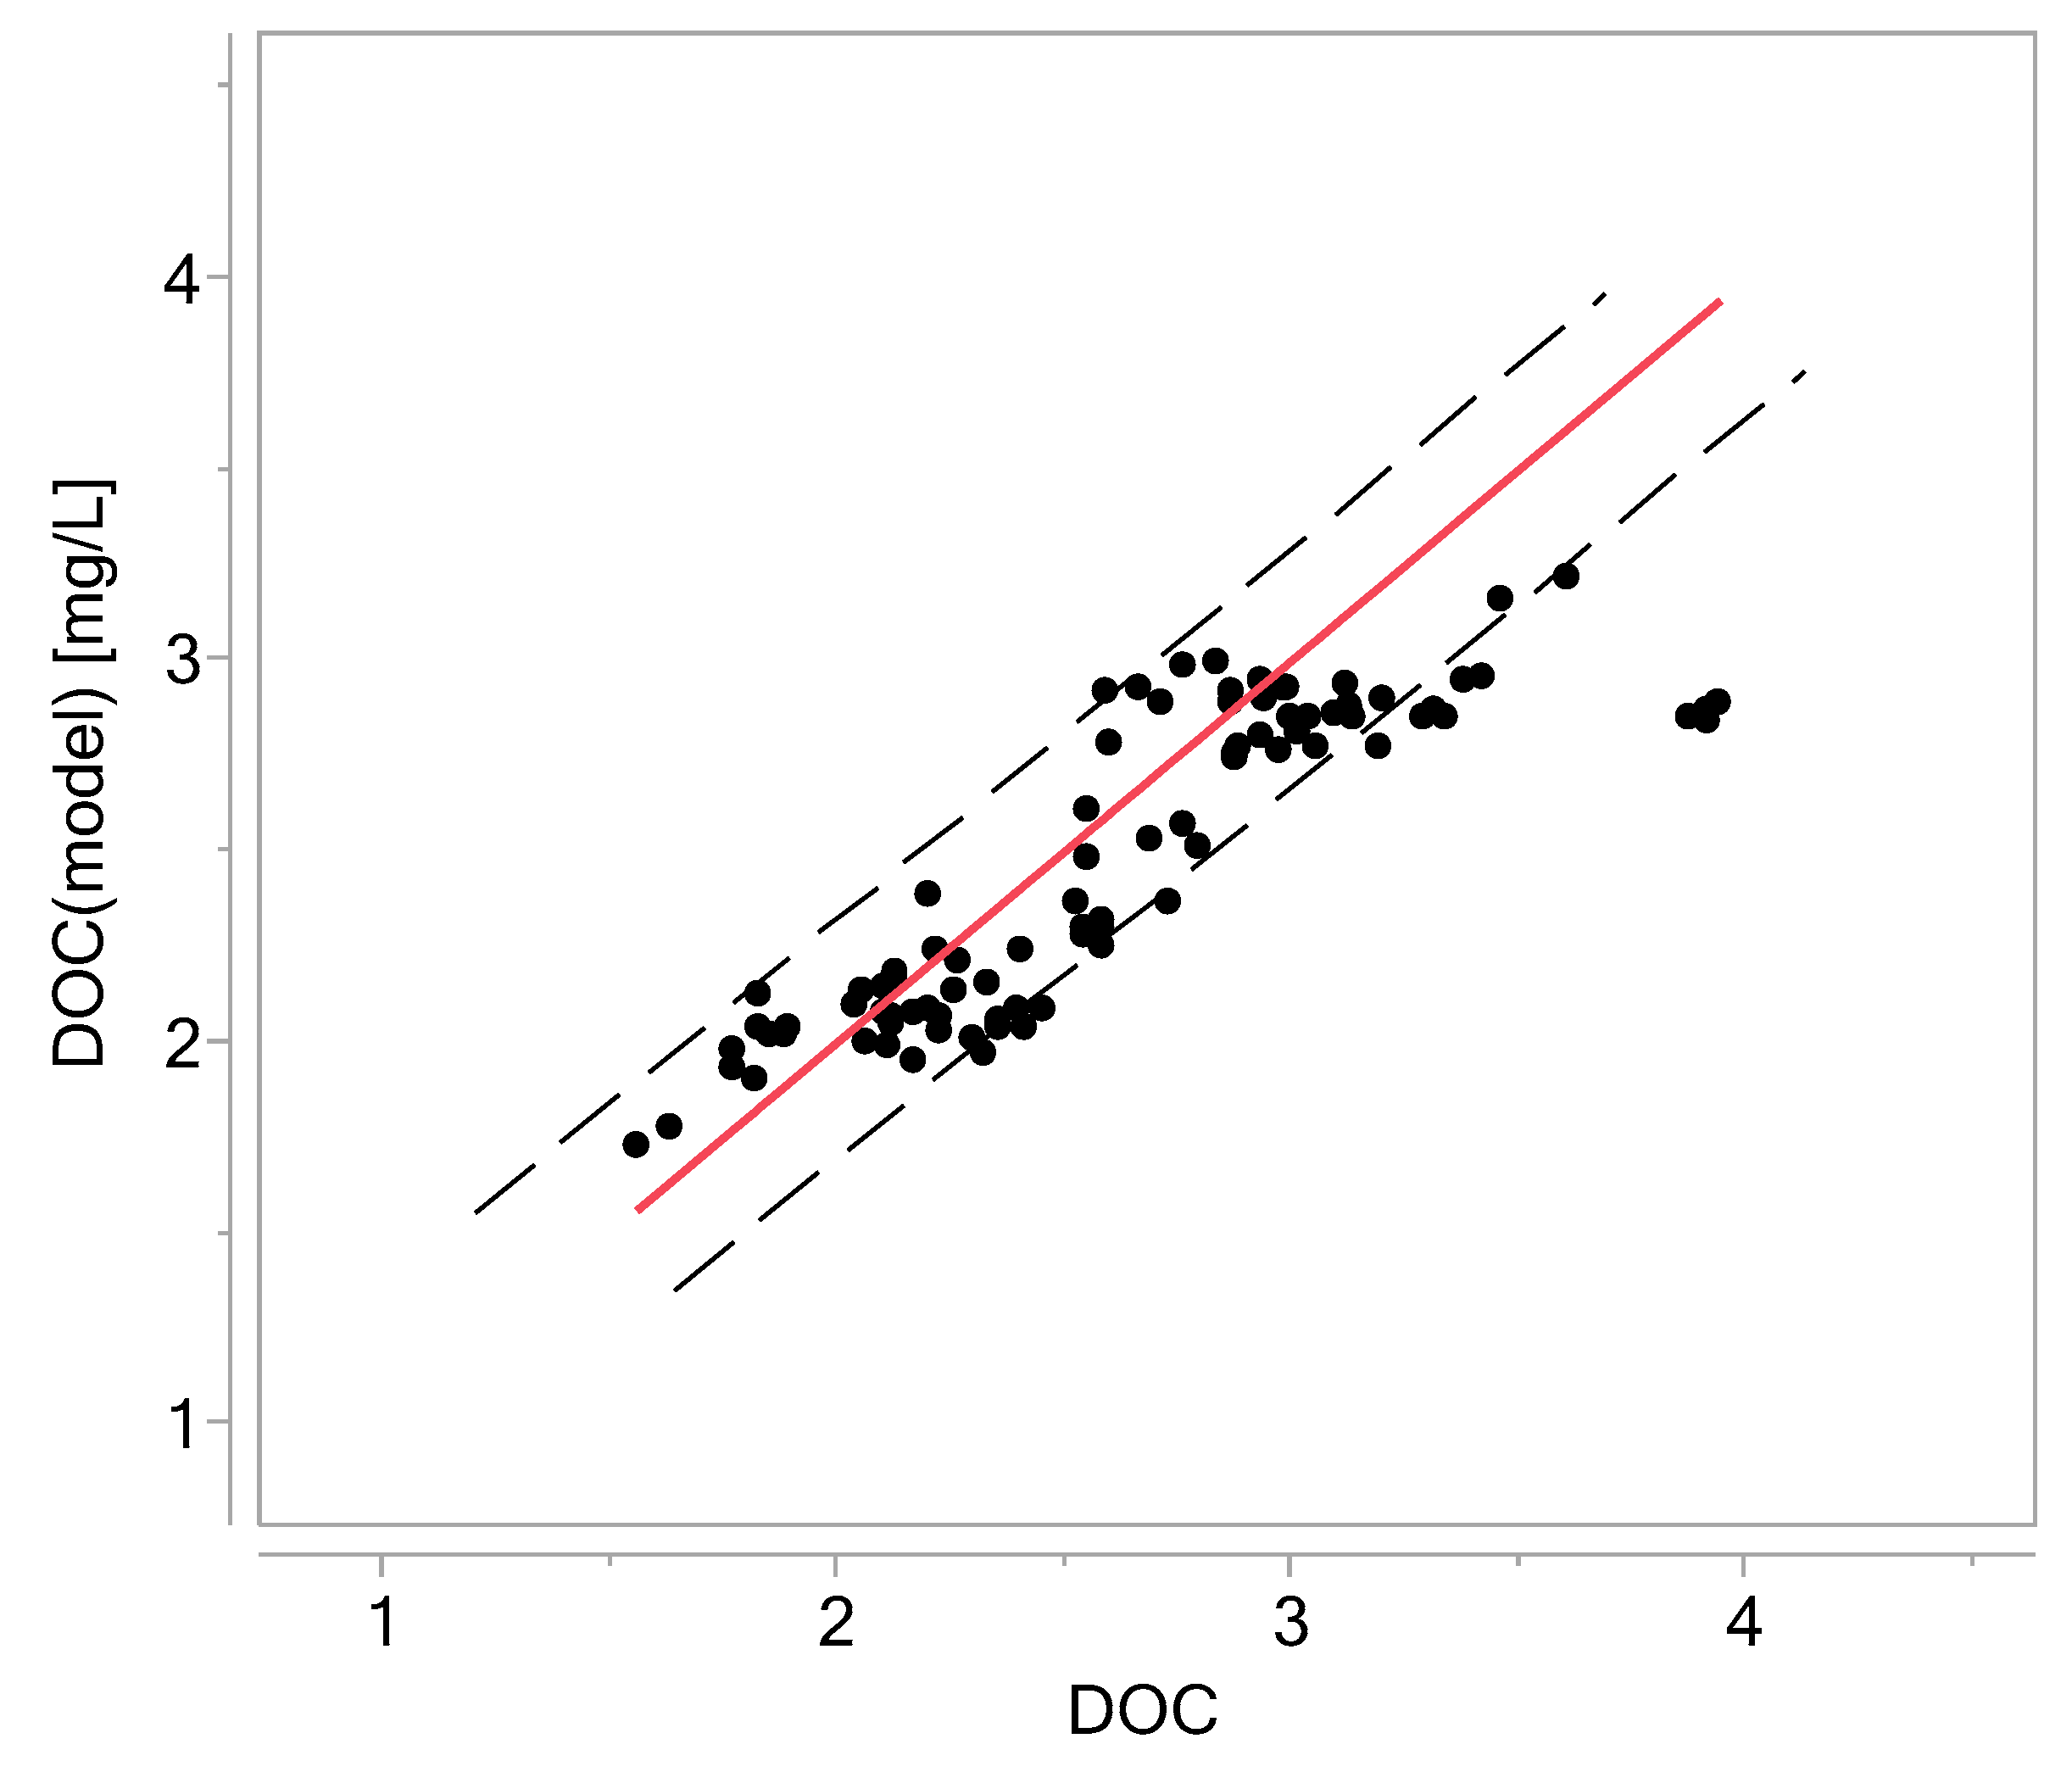
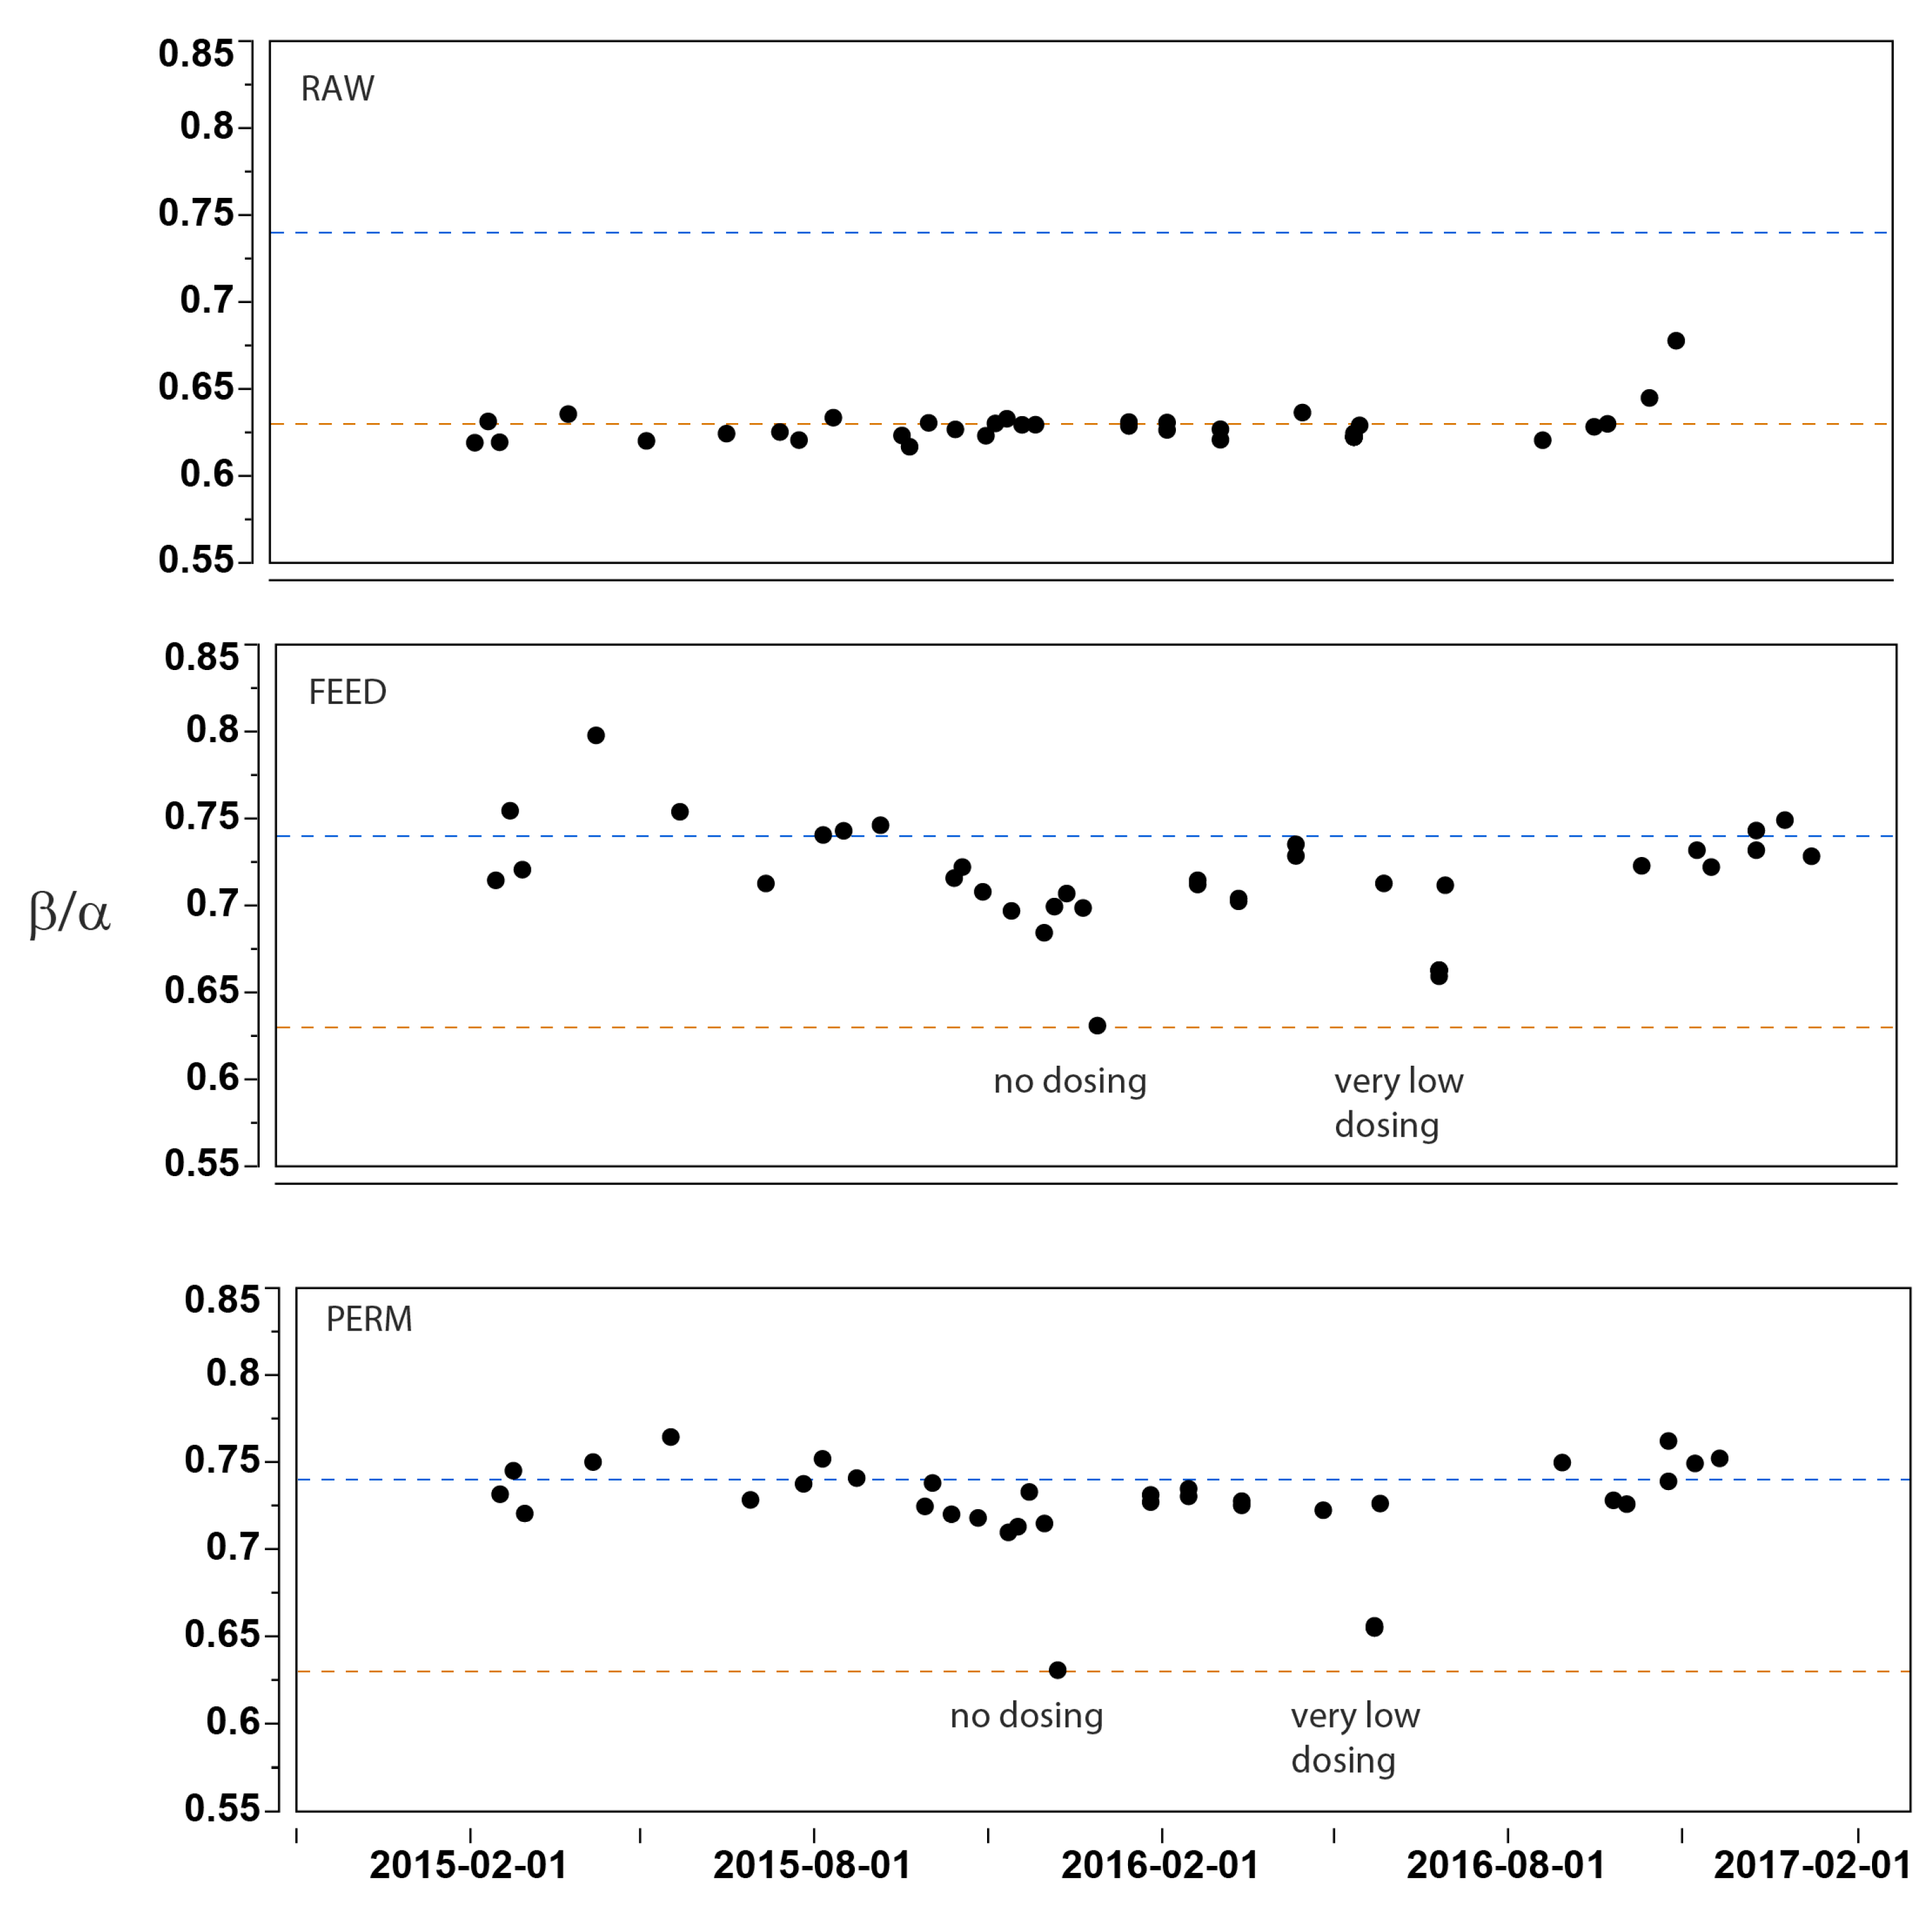
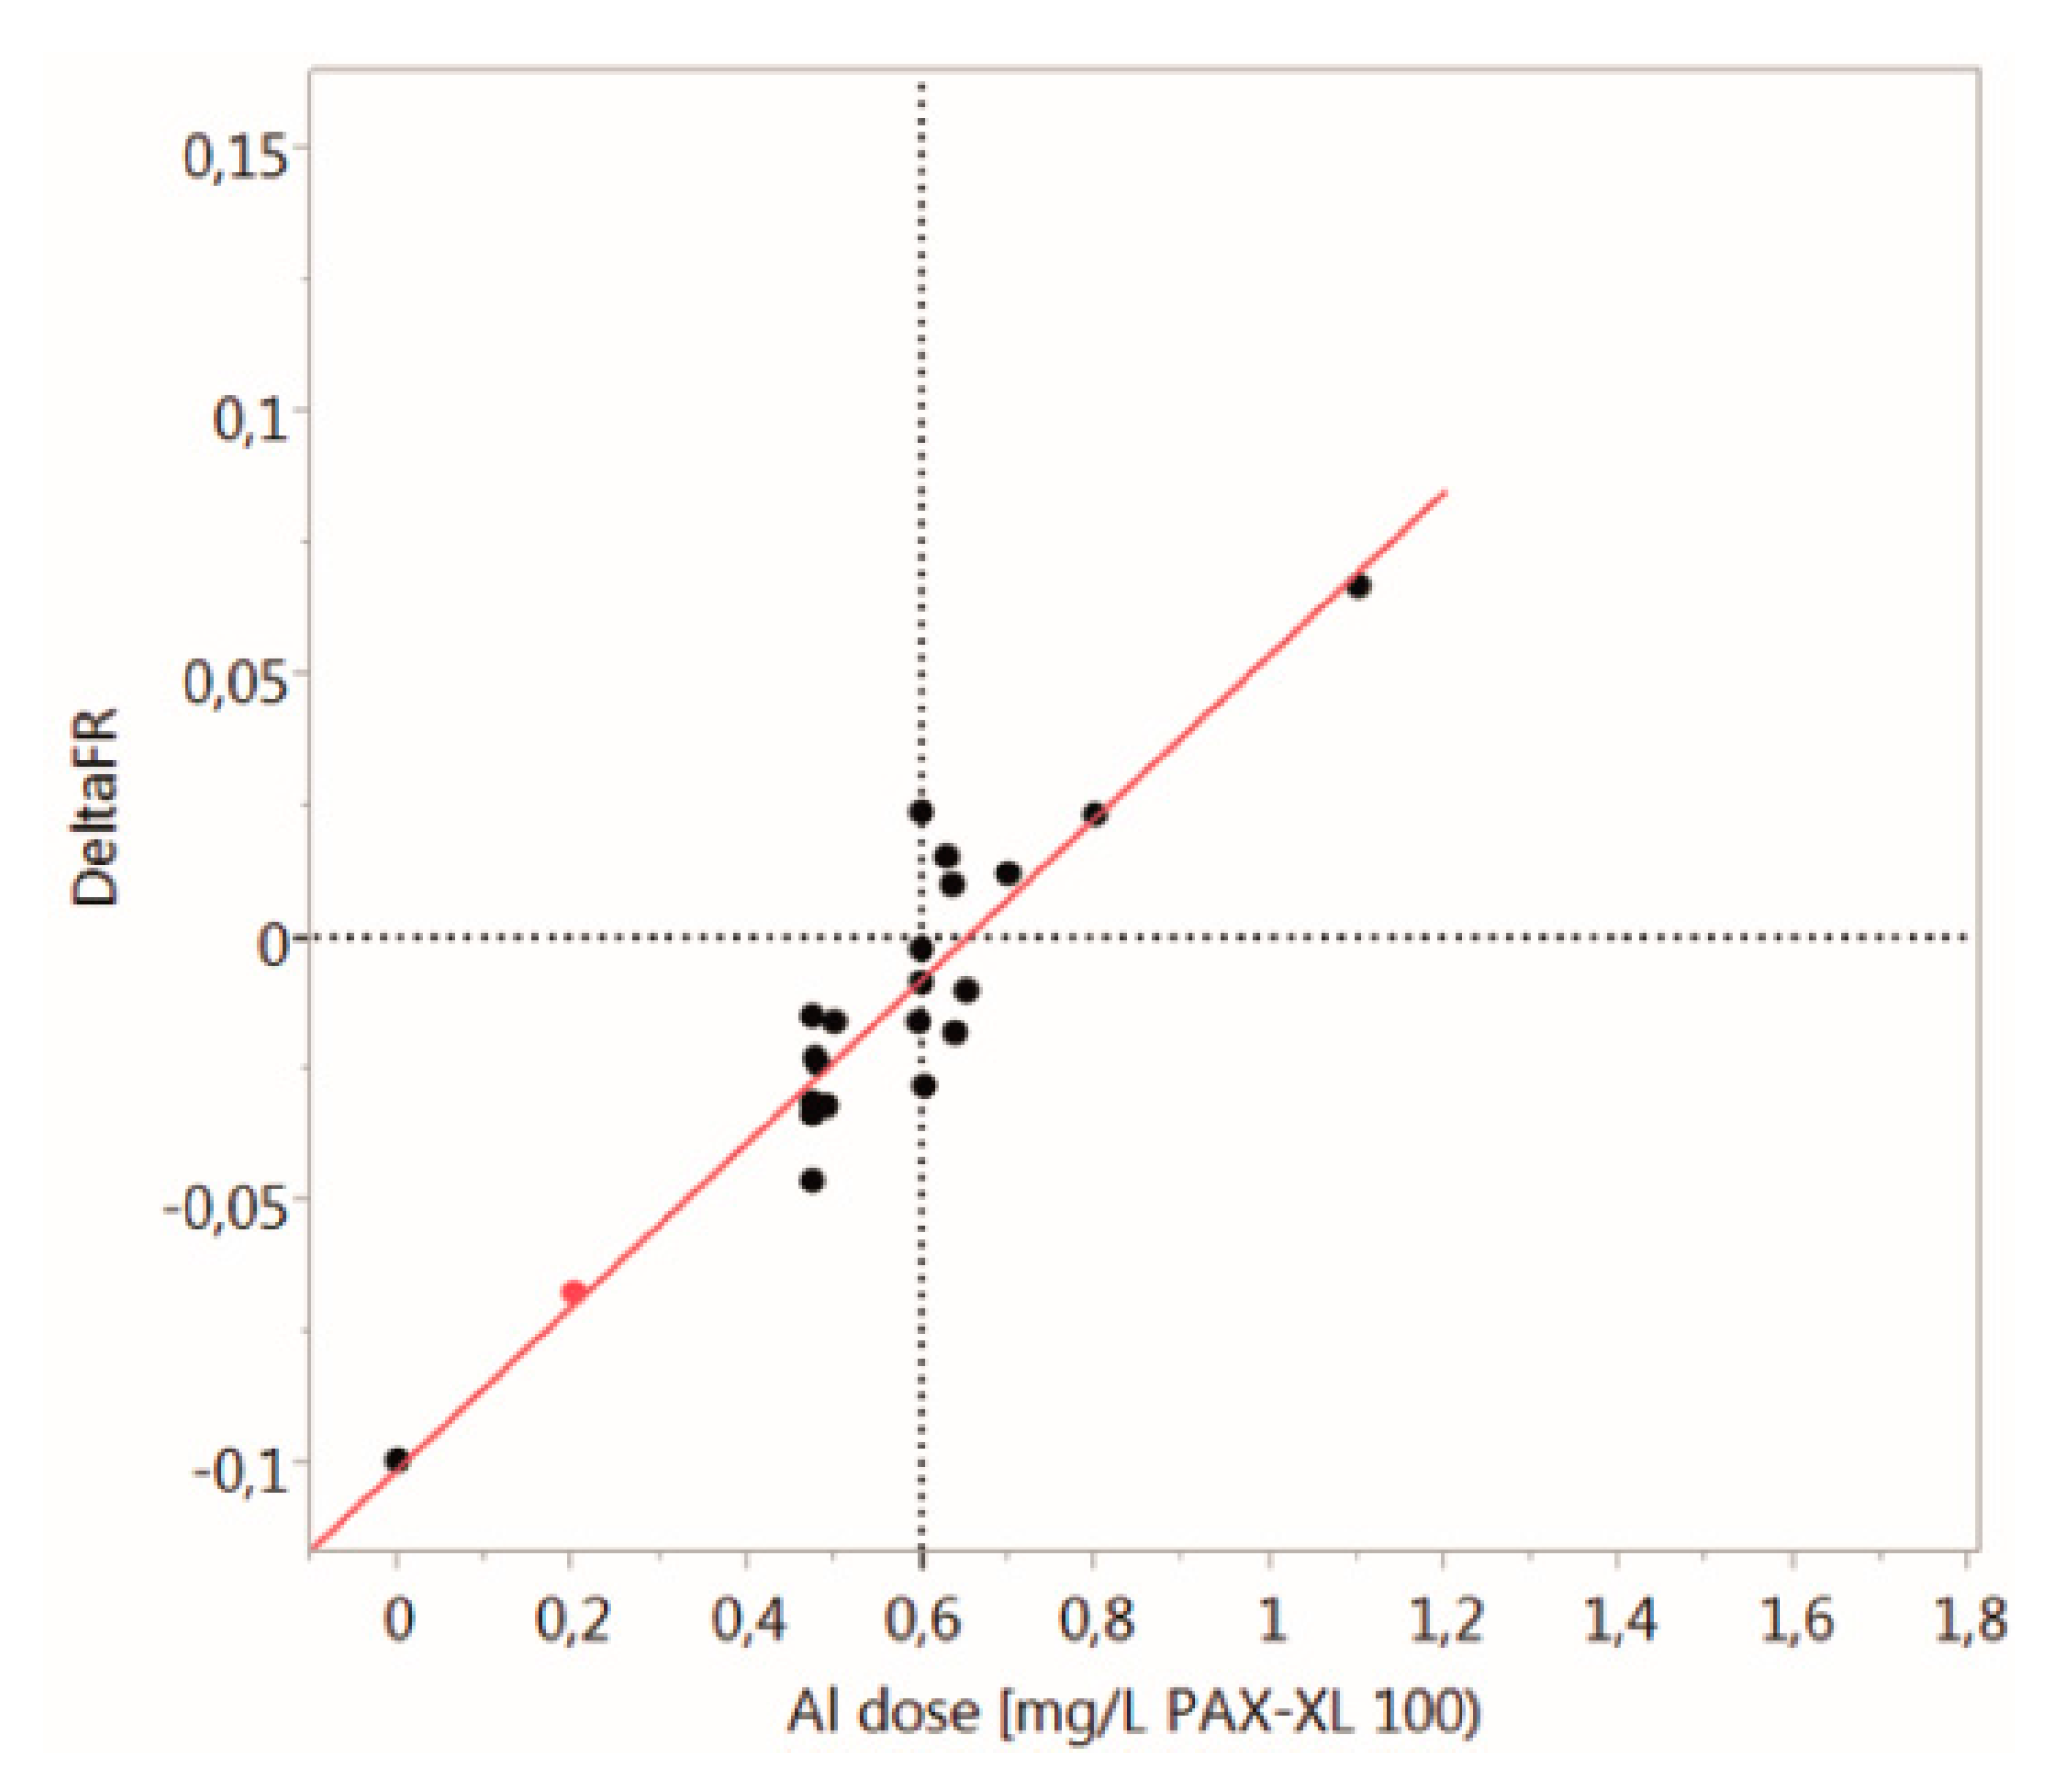
On average, less than 30% of the DOC and slightly more than 50% of the UV absorbance (UVRaw) were removed during the coagulation UF process (Table 3). The SUVA decreased from approximately 3 to close to 2. Owing to a potential analytical error in the DOC (±0.2 mg L−1) and the filtered absorbance determined in a 1-cm cuvette (±0.5 m−1), the estimated error in SUVA for laboratory 3 was on the order of 0.3. The stability of the SUVA values over the entire period is shown in a DOC–SUVA plot in Figure A3. Of the three derived fluorescence indices, the freshness index (β:α) was found to be an extremely valuable tool for evaluating removal as a function of the Al dose. The time series of freshness for both the raw water and the permeate indicated stable and reproducible time series (Figure A4). In addition, the excellent correlation of the Al dose and the freshness index facilitated the use of the freshness index as a superior indicator of the coagulation efficiency (Figure A5). This indicator is superior to SUVA, as it has higher precision and requires only one measurement compared with the two parameters for SUVA. This finding confirmed the results obtained by Köhler et al. [17] on the use of the freshness index.

3.3.2. LC-OCD Data Evaluation

Most of the LC-OCD measurements conducted over the last five years indicated quite stable conditions for both ground- and lake water (Table 4). On average, the raw water consisted of approximately 60% humic acids, only half of which could be removed by the current process.
The DOC removal percentage and the stable conditions were in accordance with the minor changes in the inflowing raw water observed during the two-year trial period. The measured variation in DOC was in accordance with the two-year data time series presented above. The LC-OCD analysis indicated a lower DOC in the permeate (1.7 mg L−1) compared with that of the classical DOC analysis (2.1 mg L−1), but a higher DOC in the feed (2.5 mg L−1) compared with that of the classical DOC analysis (2.3 mg L−1). According to the LC-OCD, the combined coagulation/ultrafiltration processes removed approximately 30% of the DOC and 50% of the HS. However, all the other compounds (building blocks and low-molecular-weight (LMW) acids) remained unchanged compared with the feed and permeate composition. The removal of HS resulted in a decrease of SUVA from 3.4–3.7 to 2.3–2.6 compared with the LC-OCD, as well as a decrease from 3 to 2 compared with the classical DOC analysis. These differences fall just outside the analytical error of the classical method, and we are currently unable to explain why the LC-OCD-derived SUVA was higher throughout. In addition, the LC-OCD results indicated that both the biopolymers and the low molecular-weight neutrals (LMWneutrals) originated from the lake water. Half of the biopolymers but none of the LMW acids were removed in the treatment process. These carbon fractions have the potential to cause regrowth in the distribution system, which in view of climate change, could probably have implications for the future adaptation of the process (see Section 3.6.2).
All the results from the pilot-scale trial (UF-HF-P1) conducted in 2011 agreed with the data obtained from the most recent (2017) full-scale process (UF-HF-F). This is a most satisfactory result, as it indicates that (a) the full-scale plant was successfully implemented and trimmed to resemble the pilot-scale plant closely and (b) the LC-OCD results were reproducible over time.

3.4. UV Sensor Data Evaluation

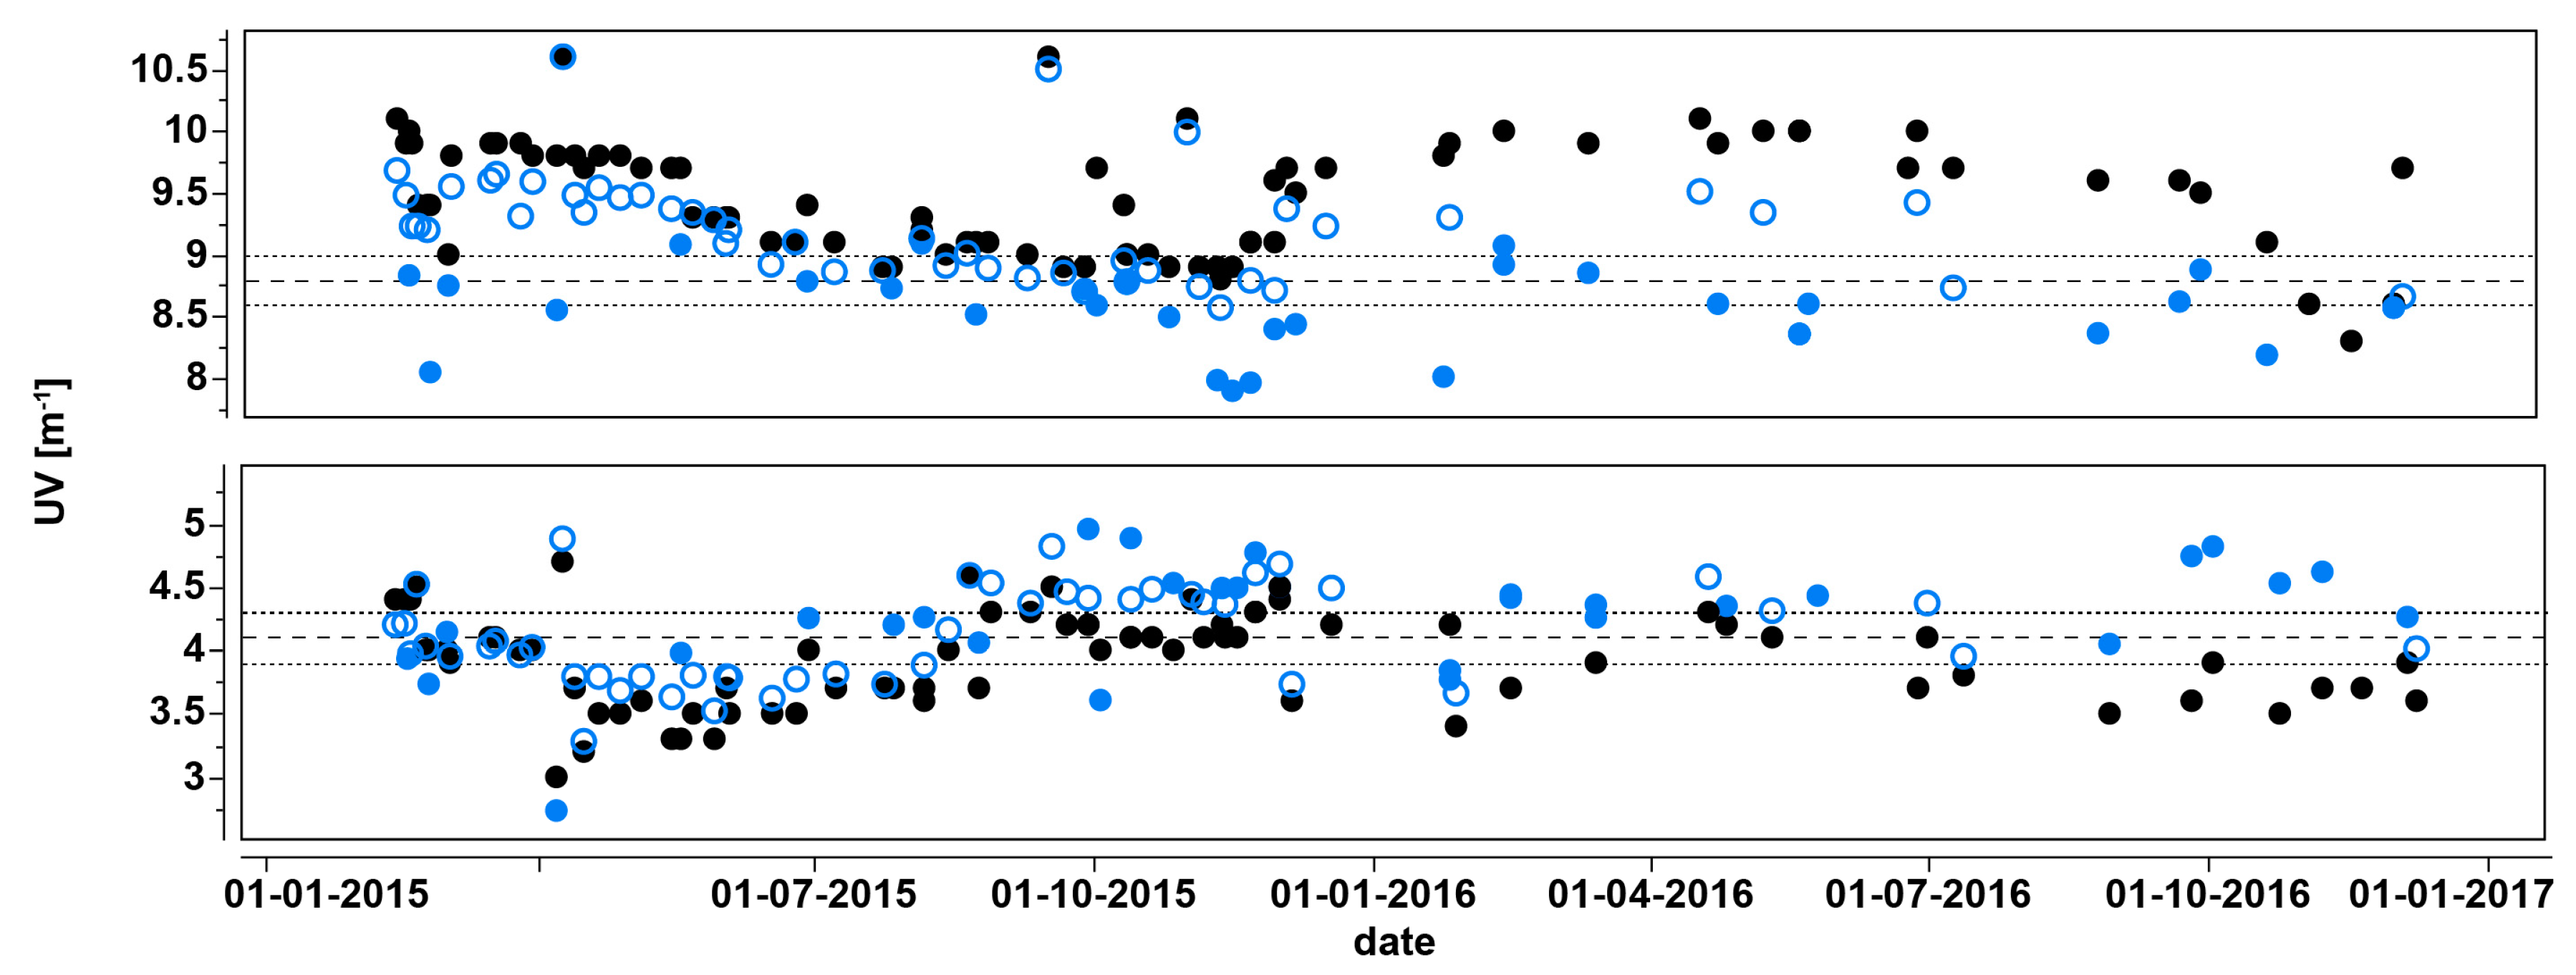
The removal of organic matter is controlled by the addition of aluminium salts, of which the dosage is a function of the variation of the incoming UV absorbance in the raw water. The differences in the UV absorbance in the raw water and the permeate can subsequently be used to assess the efficiency of the removal over time. As the online UV sensor signal in the raw water (UVRaw) could be affected by the presence of particles and changes in the optical behaviour owing to fouling, several control measurements were implemented to follow the UV signal over time (Table 3). Two of the additional laboratory determinations (Lab 2 and Lab 3, also displayed in Table 3) of the UV absorbance are compared with the online data in Figure 7.
The four UV measurement methods differed significantly—especially with respect to the raw water (Table 3). The UVLab2 unfilt (9.1) and UVLab3 filt (8.6) had lower values for the feed water compared with both the UVLab1 unfilt (9.3) and the sensor UVRaw (9.9). From the above time series, it is concluded that a systematic deviation between the different signals was obtained, especially in the later period (Figure 7). All three laboratories found systematically lower UV values in the raw water compared with the sensor (UVRaw). Regarding the permeate, the differences in UV absorbance were still systematic, with a lower UV signal for the sensor compared with that of the laboratory analysis, but they were much less pronounced. The time series of measured differences between the sensor (UVRaw) and UVLab3 filt are shown in Figure A6, which confirm these systematic differences over time. These differences highlight the importance of cross-calibration. In particular, the significant difference in the measured values between the sensor (UVRaw) and the filtered samples from Lab 3 (UVLab3 filt, 1.2 m−1 in Table 3) in relation to the raw water was considered unusual. This is because the difference in the TOC and DOC was below 0.05 mg L−1 on average (i.e., within the error of the method). Absolute and systematic differences in the different laboratory photometer signals should be excluded, as the filtered samples were not systematically lower for Lab 3 (UVLab3 filt 4.4 > 4.0 m−1 UVRaw). As the data from Lab 3 were obtained with a 1-cm cuvette, error margins of 0.4 m−1 could be avoided only with extreme precaution. In the instance of higher precision being required, a 5-cm cuvette had to be used in a separate measurement of the filtered samples. However, currently, no commercial 5-cm cuvette is available for coupled fluorescence–absorbance measurements similar to those performed in our study. The internal quality control in Lab 3 using K-phthalate standards revealed absolute differences in the monthly samples, which were below 3% on average (Figure A7). Furthermore, we could not exclude the possibility of some smaller fraction of the UV absorbance being lost between the time of sampling and the time of analysis (within a few days for most of the samples). The values of both Lab 2 and Lab 3 were lower than were those of Lab 1 measured onsite.
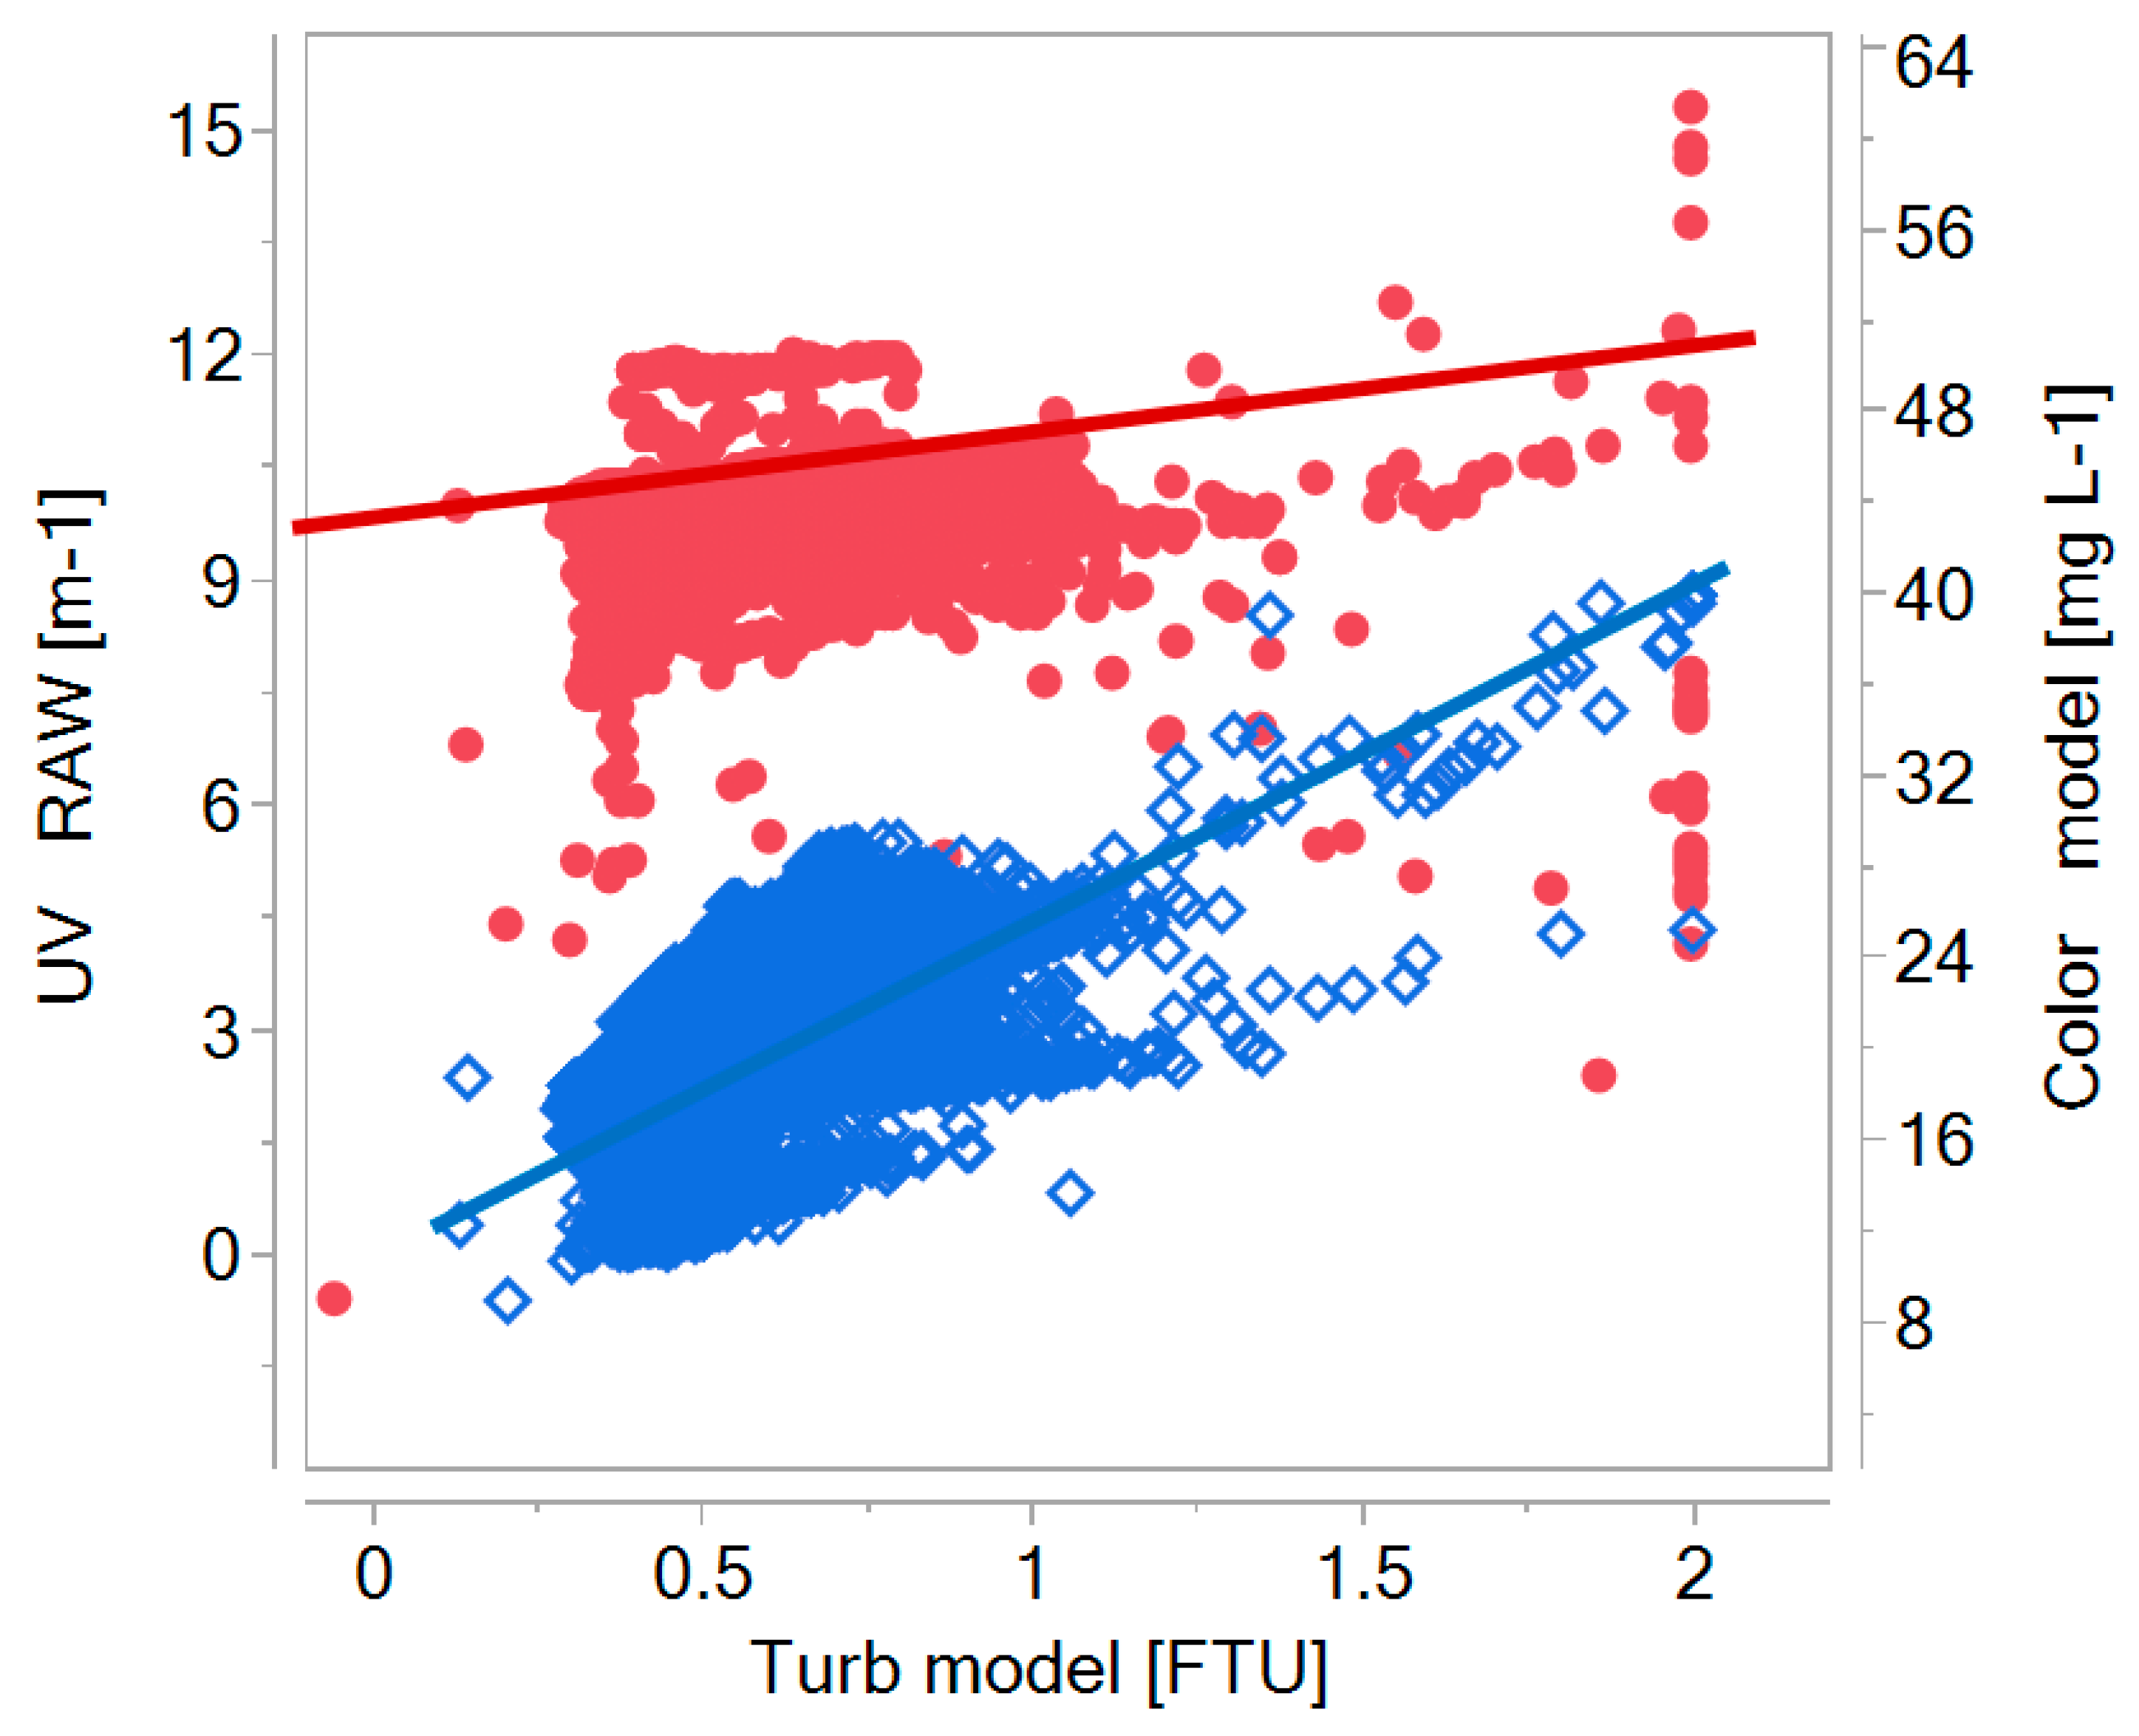
The presence of turbidity in the raw water (on average 0.6 FTU), in addition to the fouling on the sensor (UVLab2 unfilt < UVRaw)—particularly later (from the spring of 2016, Figure 7)—could be the origin of the observed differences between the sensor, laboratory, and filtered data. Turbidity affected both the calculated UV signal and the modelled colour (Figure A8 of the Appendix A). Based on the average measured turbidity in the raw water (0.6 FTU), it was possible to estimate a systematically higher UV value of 0.3 m−1 (0.6 × 0.523 = 0.34) in the unfiltered samples by using the established equation between turbidity and measured UV (Figure A8). The remaining difference in the UV absorbance between the raw water (0.9 m−1) and the filtered sample could be ascribed to smaller but reasonably systematic differences (up to 0.4 m−1). This could be related to fouling and the removal of some of the extremely dark hydrophobic fractions during filtration (TOC − DOC = 0.15 mg L−1 in Table 4), requiring the removal of approximately 0.5 m−1. This latter observation was corroborated by our own observations on the removal of UV when no Al dosage was applied. The observed difference (UVRawUVLab3 filt) of 1.2 m−1 was therefore split into three fractions, which were 0.3 m−1 caused by turbidity, 0.4 m−1 potentially caused by a systematic error between the sensors, and 0.5 m−1 caused by filtration or fouling.
This evaluation revealed that the sensor data alone were not enough to track the performance of this UF process (DELTA in Table 3 varies between 48% and 59%) and that the use of both filtered and unfiltered control samples was required to support and calibrate the sensor data. At WTPs with higher turbidity and a higher fraction of particulate organic carbon, measurements that are even more precise would be required.

3.5. DOC Removal Efficiency

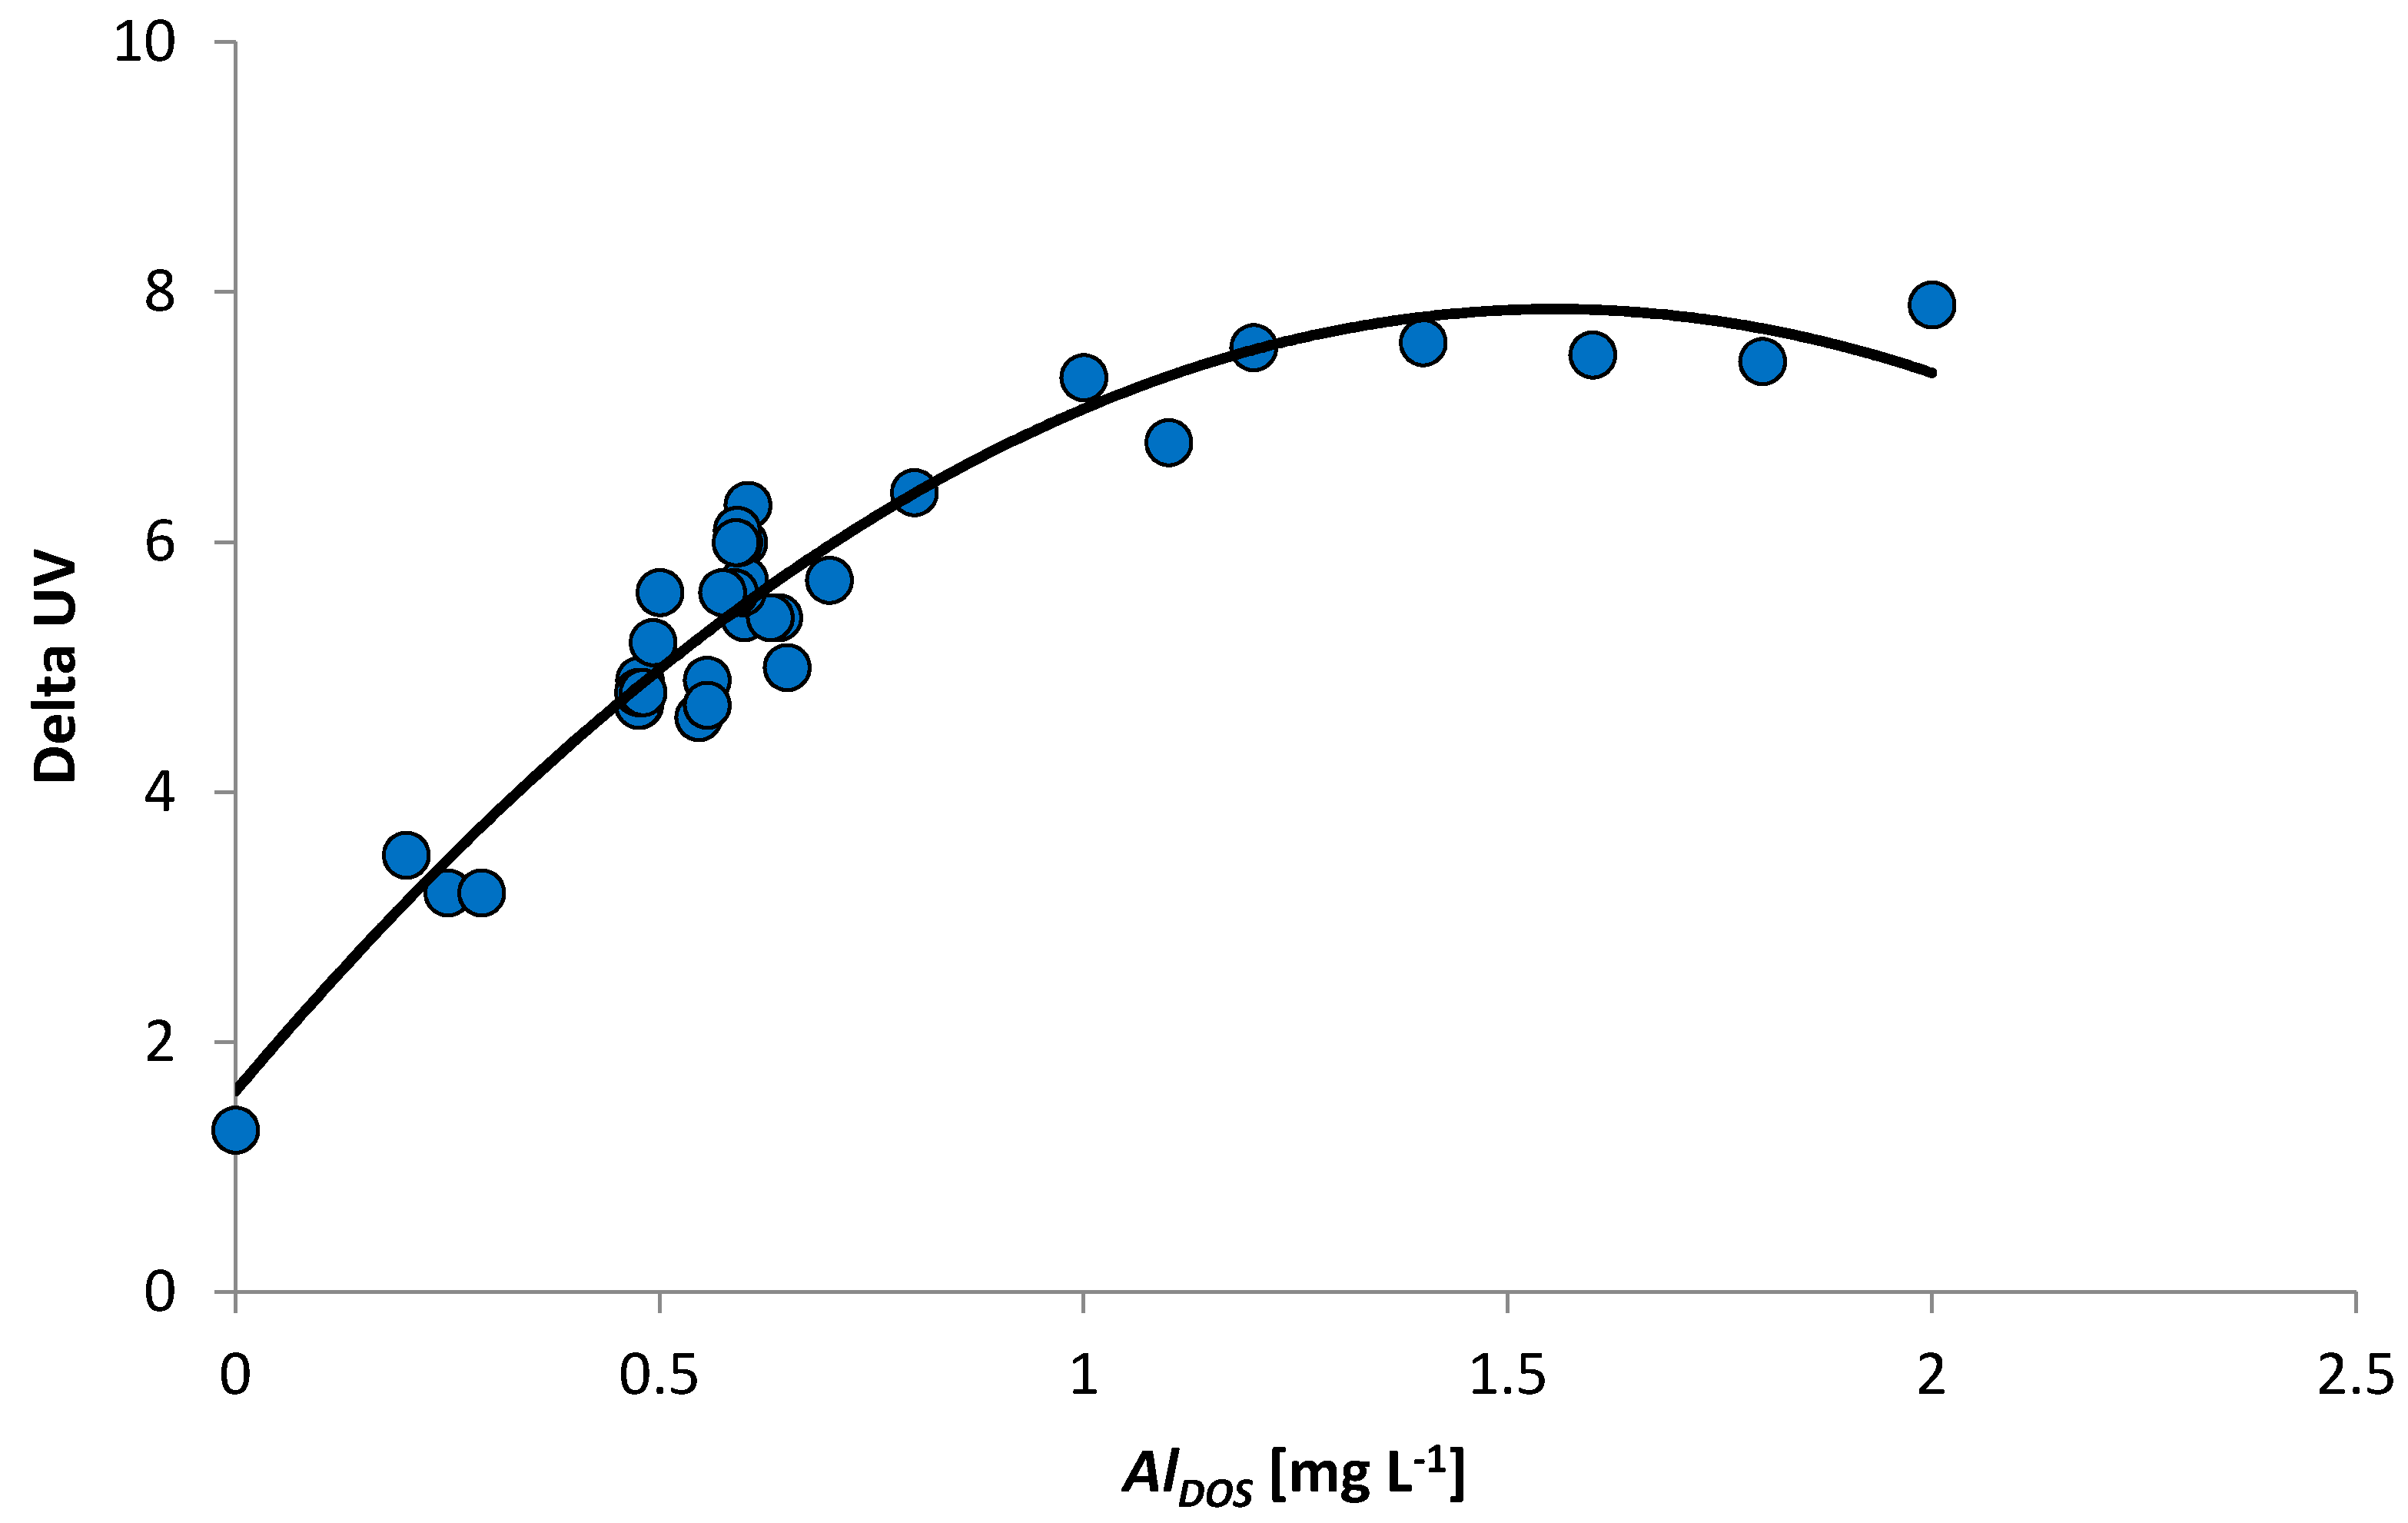
The sensor data and coagulant dosing were used to identify the optimal coagulation conditions over the entire pilot period. For this purpose, the variation in the observed UV signals between the feed and permeate was plotted against the utilised coagulant dose. The observed relationship was nonlinear, with decreasing efficiency of UV removal when the Al dose was increased. This behaviour could be mimicked with a second-degree curve, as shown in Figure 8.
Based on this relationship, all the results related to dosing could be benchmarked. Occurrences of removal (ΔUV) at least 25% below the optimum removal (according to the fitted equation) are coloured red, whereas those at least 10% lower (but within 25% of the optimal performance) are marked black (Figure A9). Most such data points occurred in the initial trimming phase of the pilot experiment, during the first three months. The increasing coagulation efficiency as a function of time is evident. During the first three months, a larger number of data points had a coagulation efficiency below 75%, whereas almost all the data points were above 90% after the nine-month trial.
The available sensor data and those obtained from the extra trials could be used to identify the potential limits of the coagulation dosing beyond 0.6 mg Al L−1 currently applied. While there was a somewhat linear relationship between the dose and change in UV (Delta UV) in the range 0 to 0.7 mg Al L−1, the relationship flattened out at higher doses. Dosing above 1.2–1.4 mg Al L−1 did not bring about further reductions in UV (Figure 8). This limit was related to the raw water content in the HS and the low SUVA, as was described earlier (Table 4).
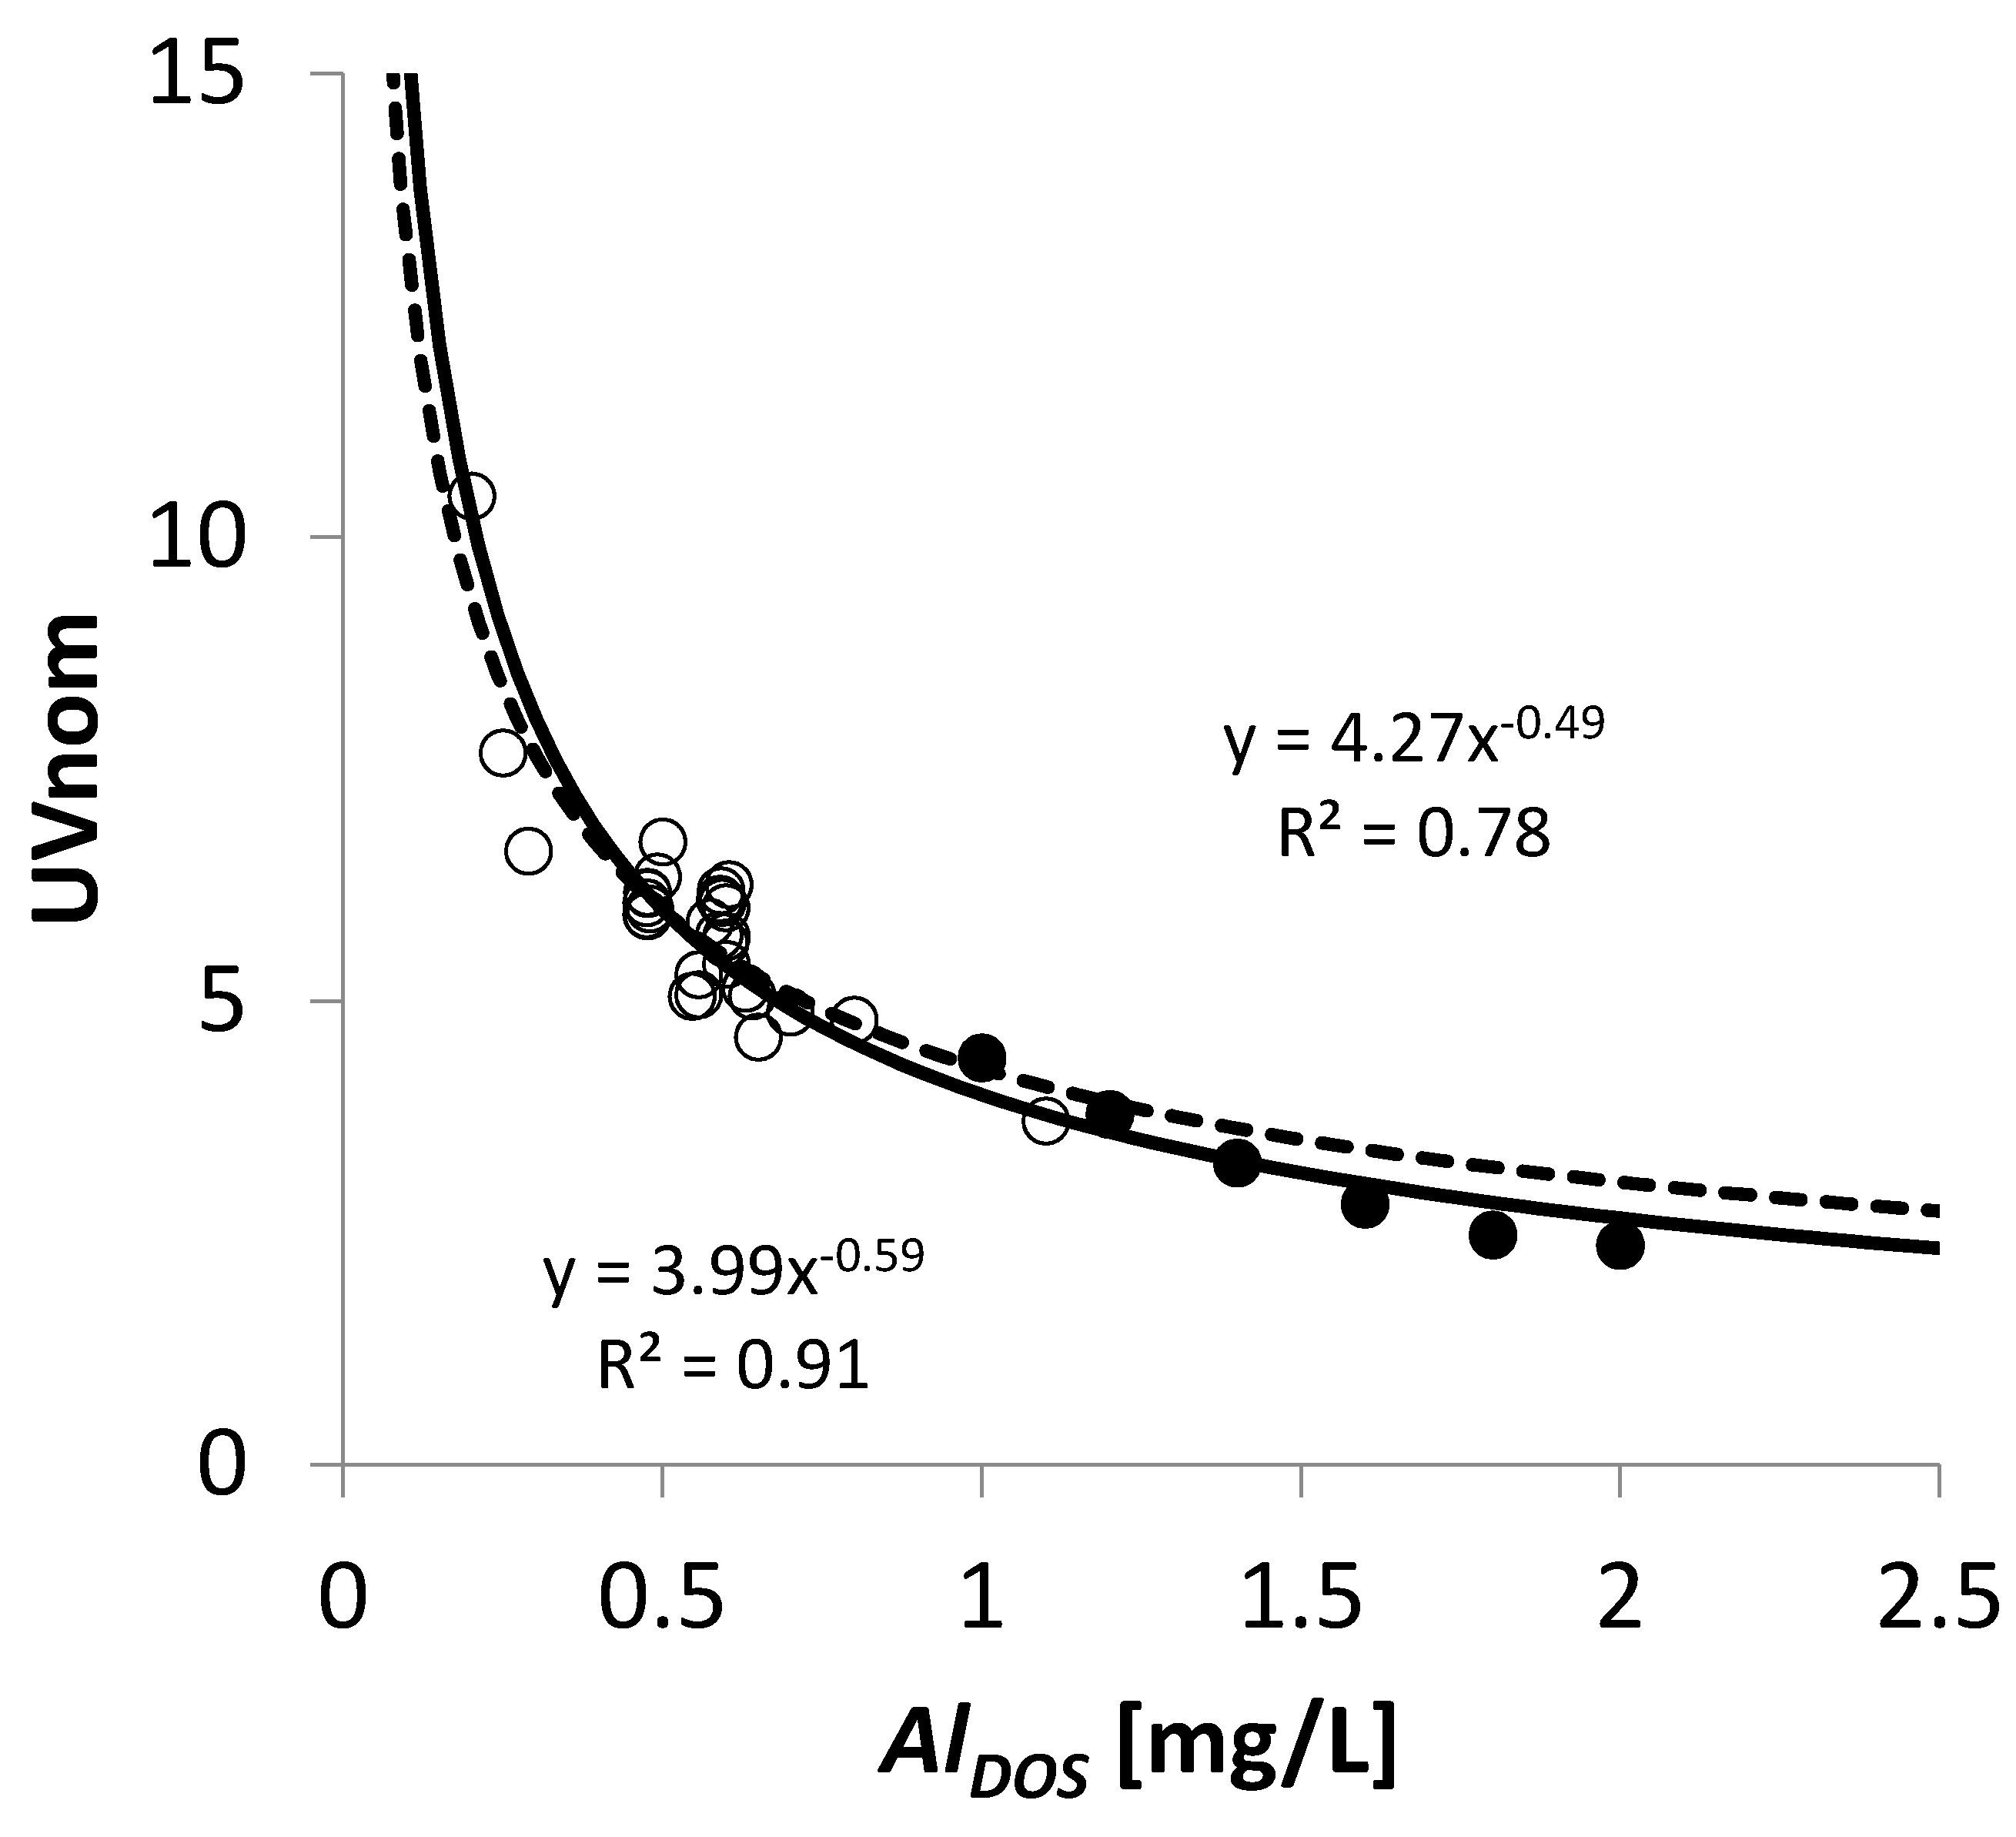
The evaluation of normalised coagulation efficiency (Equation 4) could help to determine the efficiency of increasing the dosage compared with the current dose of 0.6 mg Al L−1. These data revealed the sharply decreasing efficiency of Al addition (Figure A10), and in accordance with Figure 8, the curve flattened out at higher doses. It could be calculated how much UV was removed with an increase in the dose (ΔUV/ΔAl). Dosing at 0.95 mg L−1 (1.4 mg L−1) achieved only 80% (respectively 66%) of the UV removal per dose achieved with the current dose (0.6 mg L−1). Furthermore, higher doses produced more sludge, which from both an environmental and economical viewpoint was not a desired result. Based on the other limitations of the process (e.g., changes in TMP and flux), it was concluded that the current process with the current raw water probably had an optimal technical and economic dosing limit of close to 0.95 mg L−1. This value was used in the scenario below for assessing the potential deterioration in water quality (see Section 3.6.2).

3.6. Adaptation and Resilience of the UF Process (UF-HF-P2)

3.6.1. Determination of Maximum Coagulation Dosage

The critical operational conditions were evaluated during a one-week stress testing period (25 June 2017 to 4 July 2017). This was done to define the maximum coagulation dosage for enhanced NOM removal, in consideration of the overall membrane performance (Table 5). Whereas the membrane performance at the primary UF stage was stable regardless of the incremental increase in the coagulant dosage, the secondary UF stage reached a critical level at 2.0 mg Al L−1. This resulted in a distinct decrease in the permeability during a single filtration cycle (from 740 to 150 L m−2 h−1 bar−1 @ 20 °C). Furthermore, doubling of the coagulant dosage (1 to 2 mg Al L−1) resulted in a limited decrease in UV absorbance in the permeate with (0.55 m−1), raising concerns about the economic and operational aspects of process strategies for higher NOM removal.

3.6.2. Scenario Analysis and Evaluation of UF Performance during Constant Rise of DOC

The DOC concentrations have been rising in large parts of the boreal zone, with trends reported to be in the range 0.1 to 0.2 mg L−1 per year, and significant changes in the water colour over time.
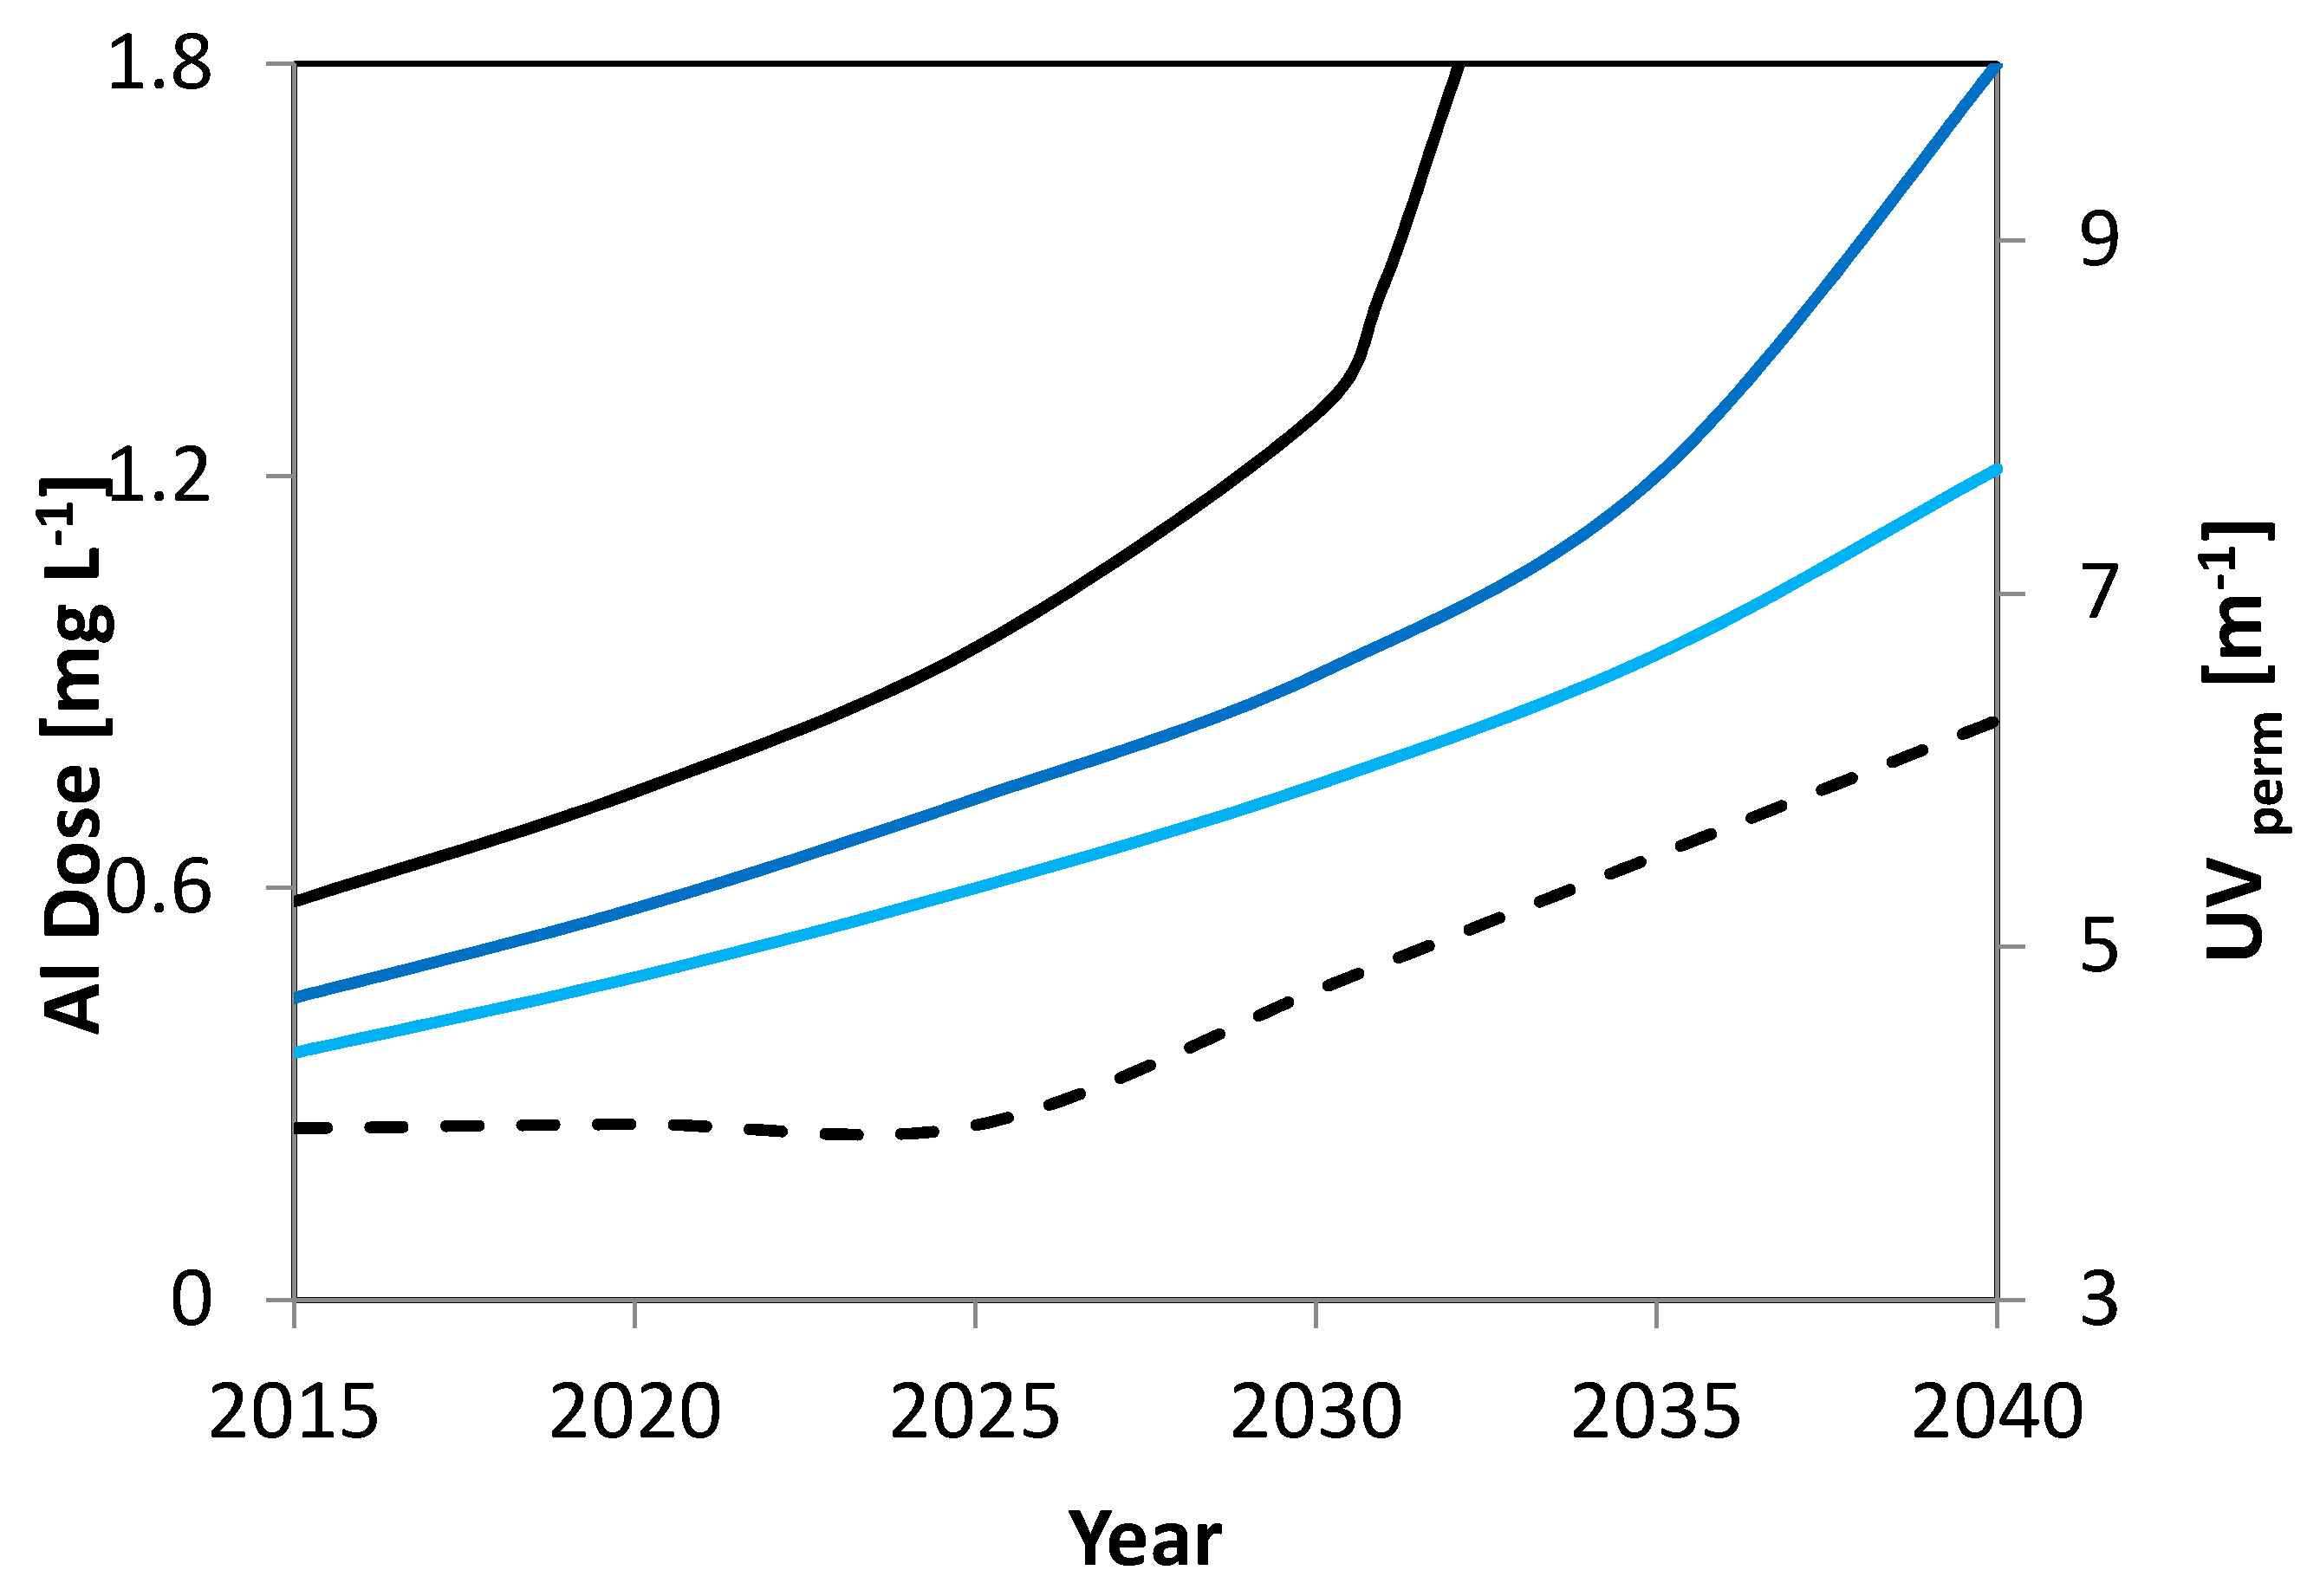
The following scenario was based on the UV data obtained from Lab 1 (UVLab1 unfilt), assuming an initial UV value of 9.4 m−1 and a removal level down to approximately 4 m−1 using a dose of 0.6 mg L−1. In this projection, it is assumed that the current character of DOC in the raw water sources from Lake Neden and the current groundwater well (i.e., SUVA) would not change over time, while a steady increase for DOC is defined with 0.05 mg L−1 per year in the surface water from Lake Neden. This low annual increase, in comparison with the other sites in the area [22], was chosen to account for the potential breakdown of terrestrial TOC during the five-year turnover time. In addition to this change in DOC, the effect of increasing the fraction of groundwater to raw water (i.e., 20% and 25%, instead of the current 15% contribution) was studied. The exact assumptions for the values of DOC and SUVA are shown in Table A5. These three scenarios gave rise to a change in Al dosing that are shown below. A constant rise in DOC over time from the current DOC of 3 mg L−1 (2015) to 4.25 (2040) would imply a sharp rise in the required Al dose over time, if the quality of the drinking water (UF permeate) was to remain the same (Figure 9). In 2031, as Al dosing would reach its maximum removal capacity (1.6 mg L−1), the model predicted a decrease in the drinking water quality, as the rising DOC could not be removed any further. Increasing the fraction of GW from 15% to 20% would postpone this eventuality to 2040 and even beyond 2040, if 25% of the raw water could be obtained from the groundwater source. The fourth scenario assumed that the economic limit of Al dosing would be reached at a dose of approximately 0.95 mg L−1. In this scenario, the Al dose would rise until the maximum dose was reached, leading to a deterioration of the UV absorbance in the drinking water from the current 4 m−1 to approximately 6.3 m−1 in 2040.
This analysis (Figure 9) clearly reveals that comparatively minor but reasonable changes in DOC over time owing to climate change or continuing recovery from acid rain would require adaptations to the process. Therefore, careful monitoring of changes in the raw water sources in future is recommended, similar to that currently being conducted by the regular Swedish lake-monitoring programme that is coordinated by the Swedish EPA.

4. Conclusions

Long-term pilot studies are valuable to determine the optimal conditions for ultrafiltration of mixed raw water rich in organic material, with minor seasonal variations. The NOM removal based on in-line coagulation combined with UF membranes from modified polyethersulfone (PES) proved to be suitable for direct ultrafiltration of surface water from Lake Neden, with high removal of NOM and minimal membrane-fouling potential. The major findings of the study are:
  • The in-line coagulation/UF process produced stable water quality and facilitated the calculation of a dose–response curve for optimal dosing conditions (0.5–0.7 mg Al L−1) and potential boundaries (0.9–1.2 mg Al L−1).
  • The secondary UF stage reached a critical level at 2.0 mg Al L−1, resulting in a distinct decrease in permeability during a single filtration cycle (from 740 to 150 L m−2 h−1 bar−1 @ 20 °C).
  • Doubling the coagulant dosage (1.0 to 2.0 mg Al L−1) resulted in a limited decrease in UV absorbance in the permeate (0.55 m−1), raising concerns about the economic and operational aspects of process strategies to facilitate higher NOM removal.
  • Systematic differences in the sensor and laboratory data must be taken into account for the different procedures to allow for the correct calculation of removal efficiency (quality control).
  • The surface-water quality scenarios (up to the year 2040) indicated a potential increase in NOM, with significant effects on the coagulant dose and the quality of drinking water.

Acknowledgments

The financial support of the GenoMembran-project, funded by the Swedish Water and Wastewater Association (Swedish Water Development, SVU) is gratefully acknowledged. The financial support for S.J. Köhler for the duration of this study was assured through DRICKS (Framework programme for drinking water research at Chalmers University in Gothenburg, Sweden). Pentair X-Flow (The Netherlands) is acknowledged for the provision of various test modules. The authors would also like to acknowledge Jennie Lindgren for her contribution of reagents, materials, and analytical tools, as well as Erik Scharenborg for advice on data analysis.

Author Contributions

Alexander Keucken and Gerald Heinicke designed and planned the experiments; Alexander Keucken performed the experiments; Stephan J. Köhler, Kenneth M. Persson, and Alexander Keucken contributed the analysis tools. All the authors analysed the data and contributed to writing the paper.

Conflicts of Interest

The authors declare no conflict of interest. The funding sponsors had no role in the design of the study; in the collection, analyses, or interpretation of the data; in the writing of the manuscript; or in the decision to publish the results.

Glossary

TermDefinition
BBBuilding Blocks
CEBChemical Enhanced Backwashing
CEEFChemical Enhanced Forward Flushing
CIPCleaning-in-Place
CODChemical Oxygen Demand
DaDalton
DBPDisinfection By-Product
DOCDissolved Organic Carbon
FNUFormazin Nephelometric Unit
GWGroundwater
HSHumic Substances
LC-OCDLiquid Chromatography–Organic Carbon Detection
LMWneutralsLow Molecular Weight Neutrals
MWMolecular Weight
MWCOMolecular Weight Cut-Off
NFNanofiltration
NOMNatural Organic Matter
PESPolyethersulfone
SUVASpecific Ultraviolet Absorbance
TMPTransmembrane Pressure
TOCTotal Organic Carbon
UVabsAbsorption of UV light at 254 nm
UFUltrafiltration
WTPWater Treatment Plant

Appendix A

Table A1. Feed water quality (median and standard deviations) of primary and secondary UF stages (UF-HF-P2).
ParametersUnitRange (UF-Stage 1)Range (UF-Stage 2)
Temperature°C4.5 ± 0.74.6 ± 0.5
pH(-)7.4 ± 0.17.1 ± 0.2
Turbidity(FTU)0.6 ± 0.220.0 ± 2.9
HardnessºdH1.5 ± 0.101.6 ± 0.15
Alkalinity(mg/L HCO3)19.0 ± 2.118.0 ± 3.0
COD(mg/L O2)2.0 ± 0.125.0 ± 7,5
TOC(mg C/L)2.9 ± 0.0627.0 ± 3.2
DOC(mg C/L)2.6 ± 0.14.4 ± 0.45
UV254(/5 cm)0.380 ± 0.223.955 ± 3.3
Pt-Co(mg Pt/L)13 ± 1.015.0 ± 5.8
Conductivity(μS/cm)110 ± 6.9110 ± 5.7
Iron(mg/L Fe)0.026 ± 0.020.57 ± 0.1
Manganese(mg/L Mn)0.035 ± 0.010.044 ± 0.01
Table A2. Operating conditions and process parameters during long-term pilot trials (UF-HF-P2).
ParametersUnitUF PrimaryUF Secondary
Max. filtration time (tF)(min)9060
Max. filtration volume(m3)8.41.65
Filtration flux (JF)(L m−2 h−1)65–7045
VCF (cross flow velocity)(m s−1)-0.5
R (recovery during filtration)(%)100100
tBW (backwash time)(s)3030
JBW (backwash flux)(L m−2 h−1)250250
tCEFF (CEB interval)(days)1.55
CEB1 dosing solution (caustic)(-)250–300 ppm NaOCl @ pH 12.2 with NaOH250–300 ppm NaOCl @ pH 12.2 with NaOH
CEB2 dosing solution (acidic)(-)475 mg/L H2SO4 @ pH 2.4475 mg/L H2SO4 @ pH 2.4
tSOAK (Soak time CEB)(min)1010
Table A3. Membrane key performance parameters during pilot trials.
ParametersUnitUF PrimaryUF Secondary
Permeability(L m−2 h−1 bar−1 @ 20 °C)350–380600–220
Transmembrane pressure(bar)0.18–0.280.12–0.25
Total number of CEBs(-)26737
Module age before replacement(months)1214
Total amount of filtration volume (feed water)m357.150 12.155 2
Notes: 1 150 m3/day × 381 days, 2 4.8 m3/day × 449 days.
Table A4. Manufacturer-reported properties of the hollow fibre membranes.
ParameterUnitKey Performance Values
Membrane MaterialSulfonated Polyethersulfone (PES)
Max. backflush pressurekPa300
MWCO based on PEG 1kDa100
Diameter (internal)mm0.80
Nominal pore sizenm20
Membrane aream255
Number of fibres ~15,000
Reduction of bacterialog6 (Pseudomonas diminuta)
Reduction of viruslog4 (MS2 coliphages)
Module hydraulic diametermm220.0
Module lengthmm1537.5
Notes: 1 PEG = Polyethylene glycol unit of molecular weight approximately 1000 dalton. MWCO: molecular weight cut-off.
Table A5. Scenario analysis (year 2040): Assumptions for source water values regarding DOC and SUVA (DELTA [DOC] 0.05 mg DOC/year).
YearGW DOC (mg L−1)GW SUVA (L/mg*m)GW UV abs (m−1)Neden DOC (mg L−1)Neden SUVA (L mg−1 m−1)Neden UV (m−1)GW Fraction (%)UVabs MIX (m−1)DOC MIX (mg L−1)AlDOS S1 (mg L−1)AlDOS S2 (mg L−1)AlDOS S3 (mg L−1)Delta UV 1Delta UV 1Uvabs Permeate (m−1)Al DOS Max Dose (mg L−1)
20150.6521.333.610.80.159.3752.64750.58 5.405.403.970.58
20200.6521.33.253.611.70.1510.142.860.74 6.146.143.990.74
20250.6521.33.53.612.60.1510.9053.07250.95 6.926.913.980.95
20300.6521.33.753.613.50.1511.673.2851.29 6.927.683.980.95
20310.6521.33.83.613.680.1511.8233.32751.48 6.927.843.970.95
20330.6521.33.93.614.040.1512.1293.4125>2 6.92<8>40.95
20350.6521.343.614.40.1512.4353.4975>2 6.92<8>40.95
20400.6521.34.253.615.30.1513.23.71>2 6.92<8>40.95
20150.6521.32.93.610.440.28.6122.45 0.44 4.643.96
20200.6521.33.153.611.340.29.3322.65 0.57 5.353.98
20250.6521.33.43.612.240.210.0522.85 0.73 6.103.95
20300.6521.33.653.613.140.210.7723.05 0.91 6.783.98
20350.6521.33.93.614.040.211.4923.25 1.2 7.533.95
20400.6521.34.153.614.940.212.2123.45 >2 <8>4
20150.6521.32.93.610.440.258.1552.3375 0.36 4.163.98
20200.6521.33.153.611.340.258.832.525 0.47 4.814.01
20250.6521.33.43.612.240.259.5052.7125 0.6 5.504.00
20300.6521.33.653.613.140.2510.182.9 0.75 6.183.99
20350.6521.33.93.614.040.2510.8553.0875 0.94 6.883.97
20400.6521.34.153.614.940.2511.533.275 1.21 7.553.97
Note: 1 Delta UV = −2.5864*AlDOS2 + 8.0452* AlDOS + 1.6065.
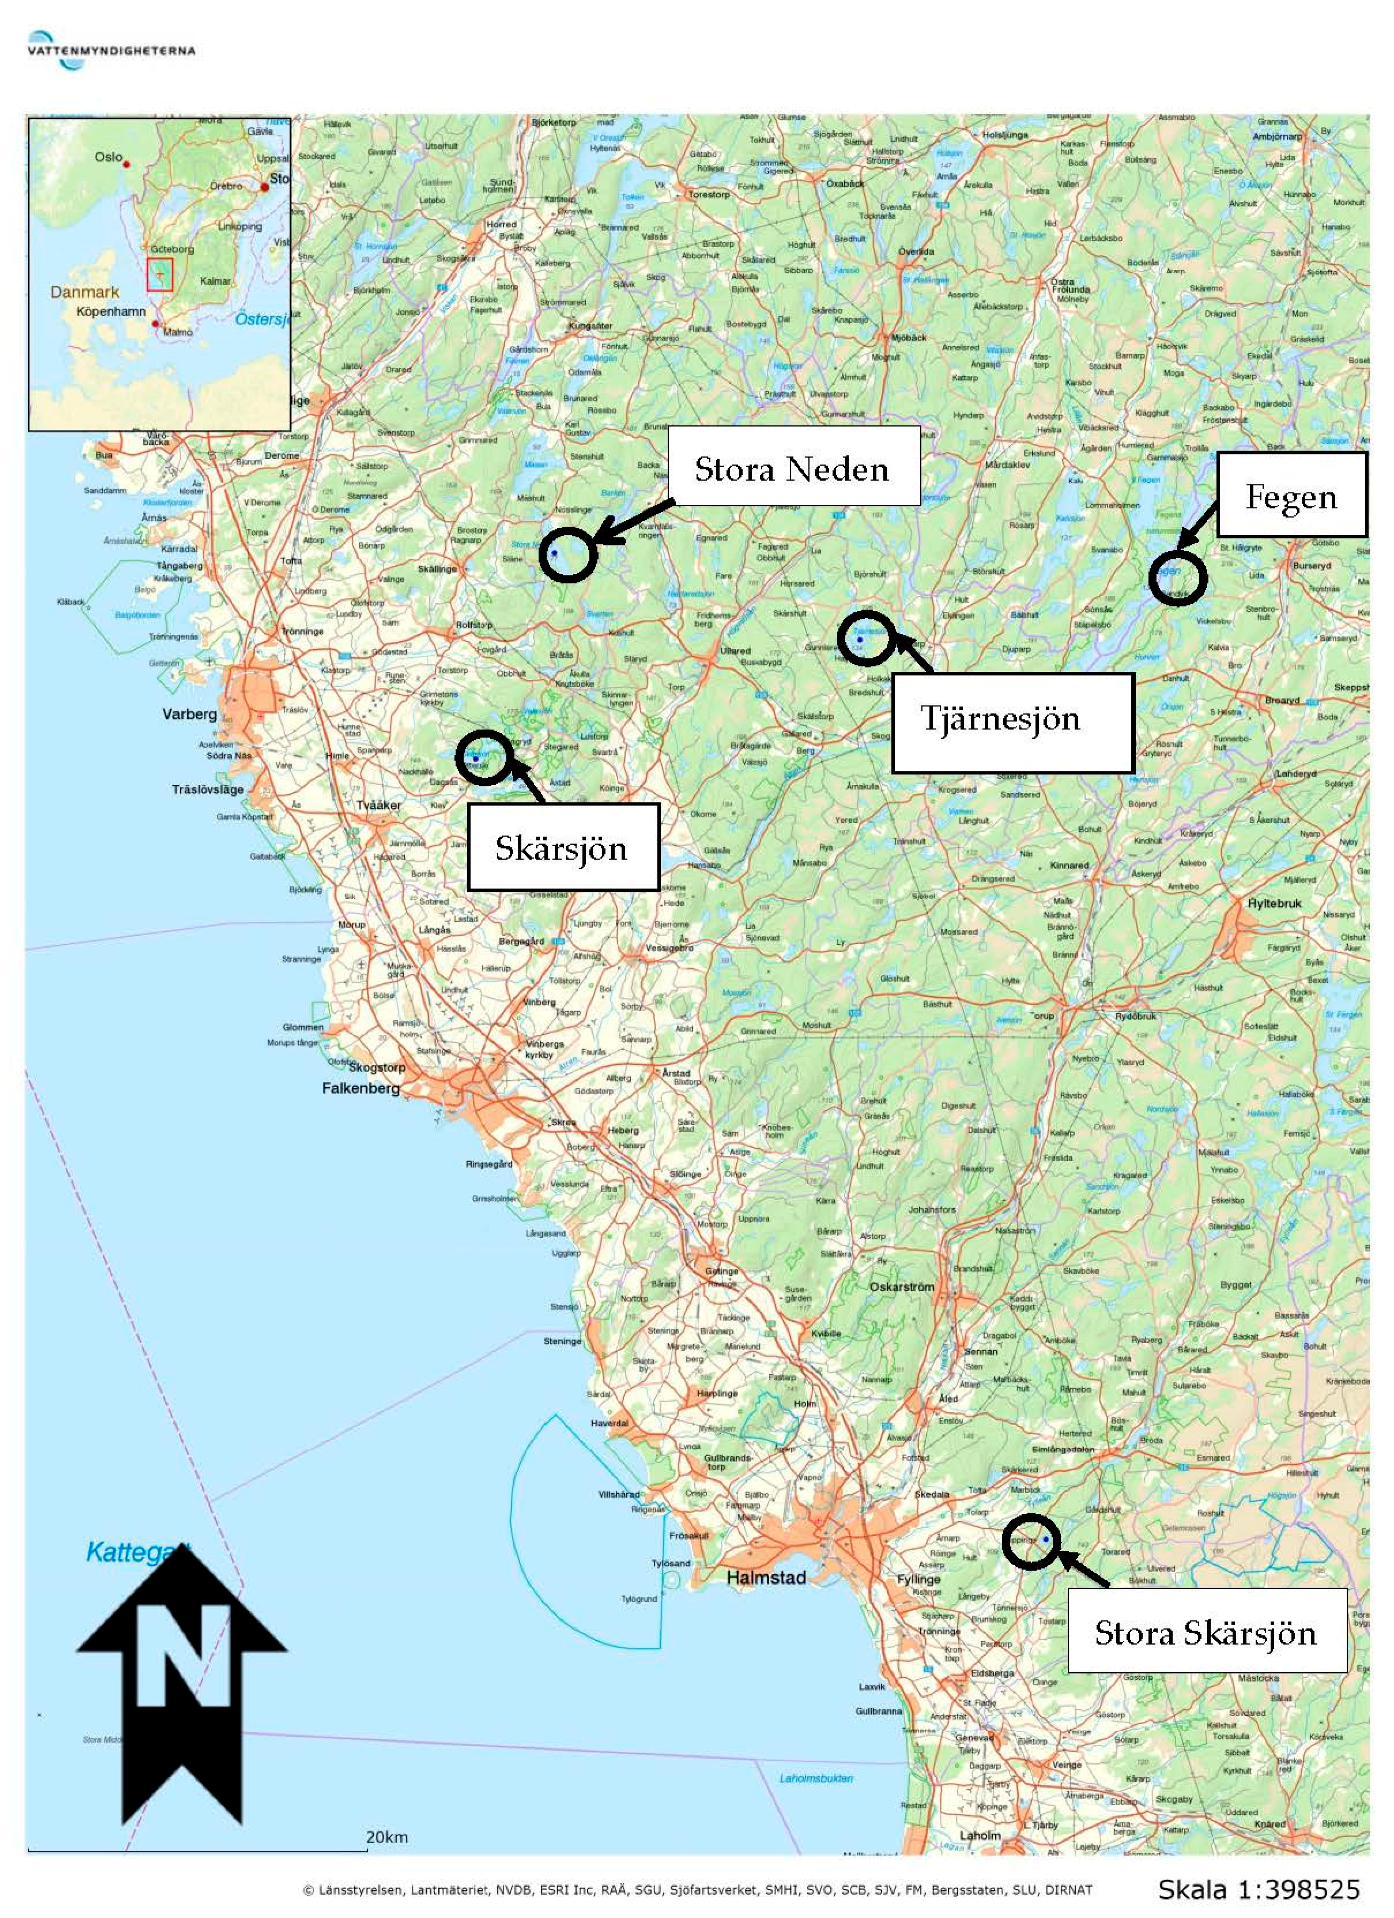
Figure A1. Geographical location of lakes in the region for which long-term monitoring data from the Swedish monitoring programme are available.
Water 09 00697 g010
Figure A2. Time series of trends in TOC (+, left scale, mg L−1) and colour measured as Abs_420 (●, right scale) or, as in the instance of Lake Stora Neden, in Pt colour that were acquired by the Swedish lake monitoring programme.
Water 09 00697 g011aWater 09 00697 g011b
Figure A3. Measured DOC (mg L−1) against predicted DOC (DOC (model) = a + b * UVLab3 filt). The close linear relationship is proof of extremely stable SUVA over time.
Water 09 00697 g012
Figure A4. Time series of the freshness index of raw water (above), feed water (middle), and permeate (below) for 2015–2016.
Water 09 00697 g013
Figure A5. Change in the freshness index (DeltaFR) when comparing higher and lower doses than the current optimal dose of 0.6 mg L−1. DeltaFR = −0.100117 + 0.154*Al DOS (mg L−1 PAX-XL 100); R2 = 0.872, RMSE = 0.012.
Water 09 00697 g014
Figure A6. Comparison of UV signal from the sensor (UVRaw, ●) Lab 2 (UVLab2 unfilt, ◯), and from Lab 3 (UVLab3 filt, ) over time.
Water 09 00697 g015
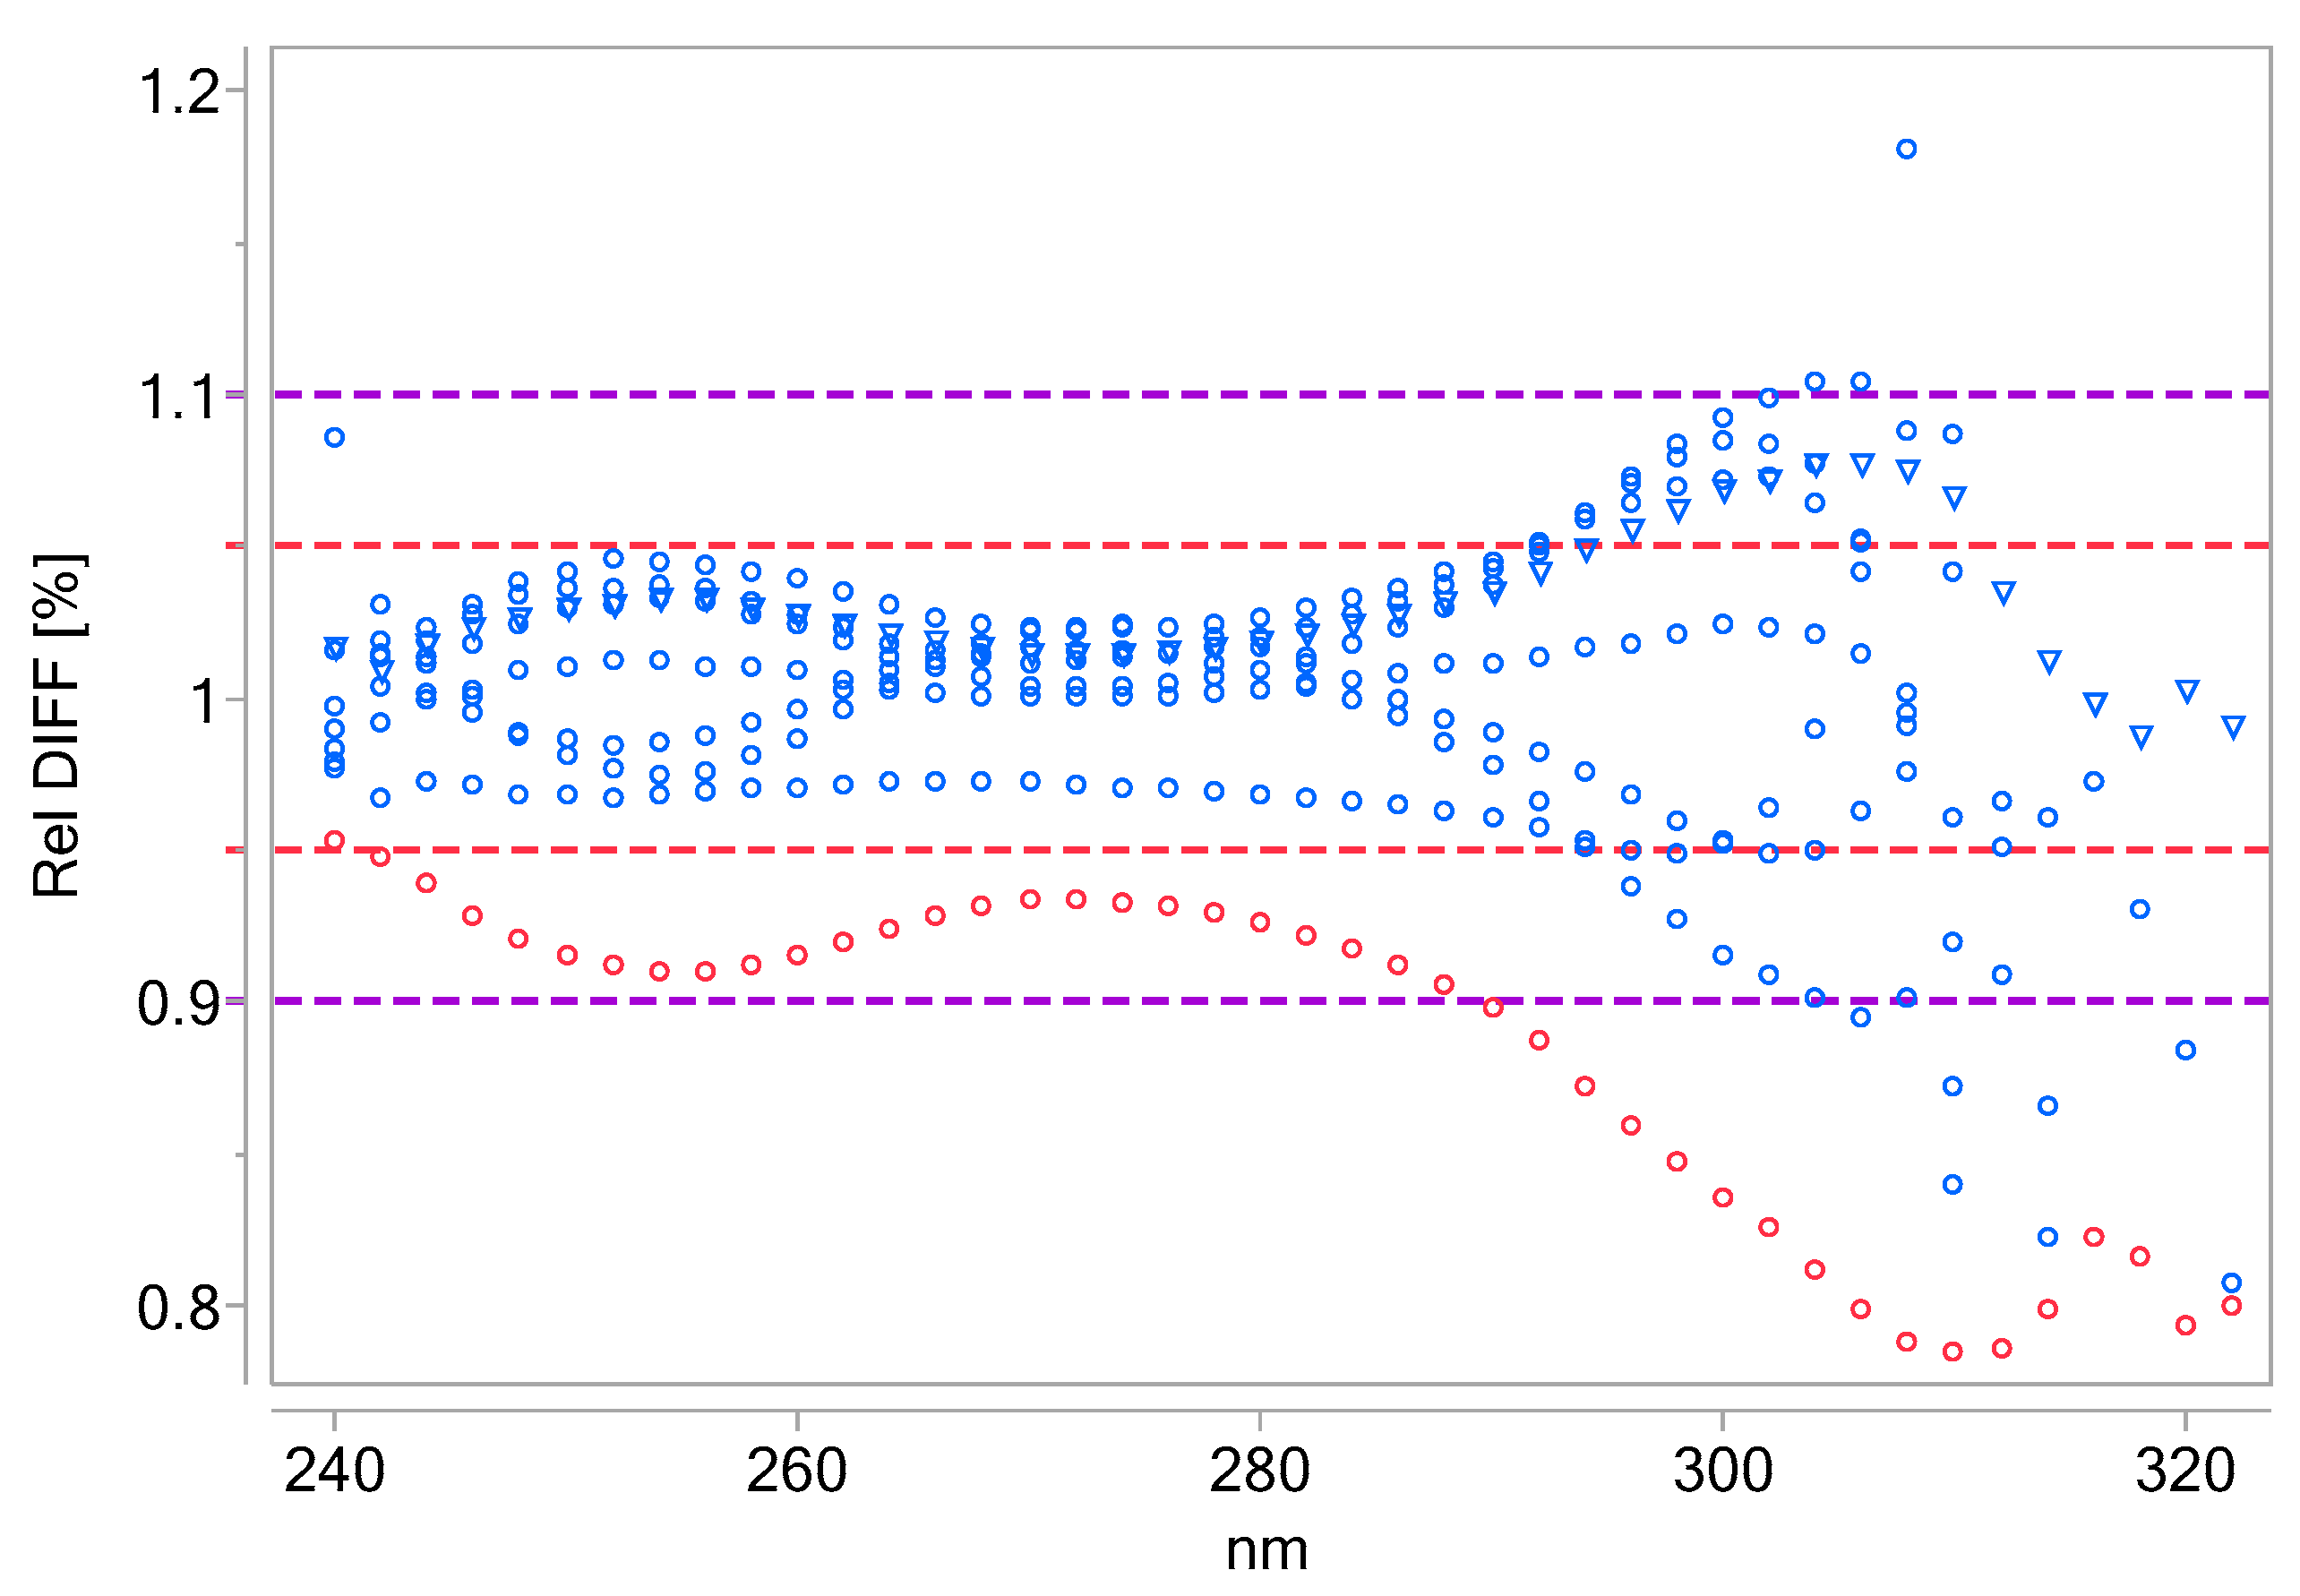
Figure A7. Differences in spectra normalised to average spectra of the K-phthalate internal standard solutions (60 ppm), as a function of wavelength that were measured monthly during 2016 for quality control purposes. On average, the relative deviation is below 3% in the UV range 240–290 nm. Different blue markers indicate the different sample months. One extreme sample is marked in red.
Water 09 00697 g016
Figure A8. Estimation of effects of sensor-modelled turbidity (FTU) on sensor-modelled colour (), and sensor-measured UV (). UV = 9.30 + 0.523 * Turbmodel. Per one unit of modelled turbidity, approximately half a unit of UV is added, which is in accordance with unpublished stream data from the Fyris River (Uppsala, Sweden). At turbidity of 2, an additional UV signal of 1 is captured that is not related to the DOC. The offset 9.3 is extremely close to the average raw water UV. Regarding the colour, this effect is more pronounced, such that a turbidity of 2 could give rise to additional colour of 36 mg L−1, therefore dominating the signal. Color = 11.6 + 18.4 * Turbmodel.
Water 09 00697 g017
Figure A9. Change in coagulation efficiency (● coagEFF [%]) and dosing ( Al Dosing INT [L/h]) signal as a function of time for the two-year study period. The black and red horizontal lines highlight 90% and 75% coagEFF.
Water 09 00697 g018
Figure A10. Estimation of normalised UV removal as a function of Al dose based on Equation (4). Black circles (●) are additional high-dose experiments, while white circles (◯) are those from the optimization period. Two regression lines including (below) or excluding the additional points are displayed (above).
Water 09 00697 g019

References

  1. Forsberg, C.; Petersen, R., Jr. A darkening of Swedish lakes due to increased humus inputs during the last 15 years. Verhandlungen des Internationalen Verein Limnologie 1990, 24, 289–292. [Google Scholar]
  2. Eikebrokk, B.; Vogt, R.; Liltved, H. NOM increase in Northern European source waters: Discussion of possible causes and impacts on coagulation/contact filtration processes. Water Sci. Technol. Water Supply 2004, 4, 47–54. [Google Scholar]
  3. Worrall, F.; Burt, T. Trends in DOC concentration in Great Britain. J. Hydrol. 2007, 346, 81–92. [Google Scholar] [CrossRef]
  4. Evans, C.D.; Monteith, D.T.; Cooper, D.M. Long-term increases in surface water dissolved organic carbon: Observations, possible causes and environmental impacts. Environ. Pollut. 2005, 137, 55–71. [Google Scholar] [CrossRef] [PubMed]
  5. Köhler, S.J.; Buffam, I.; Seibert, J.; Bishop, K.H.; Laudon, H. Dynamics of stream water TOC concentrations in a boreal headwater catchment: Controlling factors and implications for climate scenarios. J. Hydrol. 2009, 373, 44–56. [Google Scholar] [CrossRef]
  6. Delpla, I.; Jung, A.-V.; Baures, E.; Clement, M.; Thomas, O. Impacts of climate change on surface water quality in relation to drinking water production. Environ. Int. 2009, 35, 1225–1233. [Google Scholar] [CrossRef] [PubMed]
  7. Lavonen, E.E.; Kothawala, D.N.; Tranvik, L.J.; Gonsior, M.; Schmitt-Kopplin, P.; Köhler, S.J. Tracking changes in the optical properties and molecular composition of dissolved organic matter during drinking water production. Water Res. 2015, 85, 286–294. [Google Scholar] [CrossRef] [PubMed]
  8. Lavonen, E.E.; Gonsior, M.; Tranvik, L.J.; Schmitt-Kopplin, P.; Köhler, S.J. Selective Chlorination of Natural Organic Matter: Identification of Previously Unknown Disinfection Byproducts. Environ. Sci. Technol. 2013, 47, 2264–2271. [Google Scholar] [CrossRef] [PubMed]
  9. Jacangelo, J.; DeMarco, J.; Owen, D.; Randtke, S. Selected processes for removing NOM: An overview. J. Am. Water Works Assoc. 1995, 87, 64–77. [Google Scholar]
  10. Jacangelo, J.G.; Rhodes Trussell, R.; Watson, M. Role of membrane technology in drinking water treatment in the United States. Desalination 1997, 113, 119–127. [Google Scholar] [CrossRef]
  11. Singer, P.; Bilyk, K. Enhanced coagulation using a magnetic ion exchange resin. Water Res. 2002, 36, 4009–4022. [Google Scholar] [CrossRef]
  12. Matilainen, A.; Iivari, P.; Sallanko, J.; Heiska, E.; Tuhkanen, T. The role of ozonation and activated carbon filtration in the natural organic matter removal from drinking water. Environ. Technol. 2006, 27, 1171–1180. [Google Scholar] [CrossRef] [PubMed]
  13. Zularisam, A.; Ismail, A.; Salim, R. Behaviours of natural organic matter in membrane filtration for surface water treatment—A review. Desalination 2006, 194, 211–231. [Google Scholar] [CrossRef] [Green Version]
  14. Toor, R.; Mohseni, M. UV-H2O2 based AOP and its integration with biological activated carbon treatment for DBP reduction in drinking water. Chemosphere 2007, 66, 2087–2095. [Google Scholar] [CrossRef] [PubMed]
  15. Matilainen, A.; Sillanpää, M. Removal of organic matter from drinking water by advanced oxidation processes: A review. Chemosphere 2010, 80, 351–365. [Google Scholar] [CrossRef] [PubMed]
  16. Amy, G.L.; Alleman, B.C.; Cluff, C.B. Removal of dissolved organic matter by nanofiltration. J. Environ. Eng. 1990, 116, 200–205. [Google Scholar] [CrossRef]
  17. Köhler, S.J.; Lavonen, E.E.; Keucken, A.; Schmitt-Kopplin, P.; Spanjer, T.; Persson, K.M. Upgrading coagulation with hollow-fibre nanofiltration for improved organic matter removal during surface water treatment. Water Res. 2016, 89, 232–240. [Google Scholar] [CrossRef] [PubMed]
  18. Lidén, A.; Persson, K.M. Comparison between ultrafiltration and nanofiltration hollow-fiber membranes for removal of natural organic matter—A pilot study. J. Water Supply Res. Technol. AQUA 2015, 65. [Google Scholar] [CrossRef]
  19. Jung, C.-W.; Kang, L.-S. Application of combined coagulation-ultrafiltration membrane process for water treatment. Korean J. Chem. Eng. 2003, 20, 855–861. [Google Scholar] [CrossRef]
  20. Vickers, J.; Thompson, M.; Kelkar, U. The use of membrane filtration in conjunction with coagulation processes for improved NOM removal. Desalination 1995, 102, 57–61. [Google Scholar] [CrossRef]
  21. Tran, T.; Gray, S.; Naughton, R.; Bolto, B. Polysilicato-iron for improved NOM removal and membrane performance. J. Membr. Sci. 2006, 280, 560–571. [Google Scholar] [CrossRef]
  22. Valinia, S.; Futter, M.; Fölster, J.; Cosby, B.; Rosén, P. Simple models to estimate historical and recent changes of total organic carbon concentrations in lakes. Environ. Sci. Technol. 2015, 49, 386–394. [Google Scholar] [CrossRef] [PubMed]
  23. Vattenkvalitet i Hallands Sjöar 2012. Resultat Från Omdrevsprogrammet 2007–2012 Länsstyrelsen i Hallands län Enheten för Naturvård & Miljöövervakning Meddelande; Vattenkvalitet i Hallands Sjöar: Hallands Sjöar, Swedish, 2013; ISSN 1101-1084. [Google Scholar]
  24. Finstad, A.; Blumentrath, S.; Tømmervik, H.; Andersen, T.; Larsen, S.; Tominaga, K.; Hessen, D.; De Wit, H. From greening to browning: Catchment vegetation development and reduced S-deposition promote organic carbon load on decadal time scales in Nordic lakes. Sci. Rep. 2016, 6, 31944. [Google Scholar] [CrossRef] [PubMed]
  25. Keucken, A.; Heinicke, H. NOM characterization and removal by water treatment processes for drinking water and ultra pure process water. In Proceedings of the 4th IWA Speciality Conference on Natural Organic Matter, Costa Mesa, CA, USA, 27–29 July 2011. [Google Scholar]
  26. Keucken, A.; Donose, B.-C.; Persson, K.-M. Membrane fouling revealed by advanced autopsy. In Proceedings of the 8th Nordic Drinking Water Conference, Stockholm, Sweden, 18–20 June 2012. [Google Scholar]
  27. Keucken, A.; Wang, Y.; Tng, K.H.; Leslie, G.L.; Spanjer, T.; Köhler, S.J. Optimizing hollow fibre nanofiltration for organic matter rich lake water. Water 2016, 8, 430. [Google Scholar] [CrossRef]
  28. Huber, S.A.; Balz, A.; Abert, M.; Pronk, W. Characterisation of aquatic humic and non-humic matter with size-exclusion chromatography–organic carbon detection–organic nitrogen detection (LC-OCD-OND). Water Res. 2011, 45, 879–885. [Google Scholar] [CrossRef] [PubMed]
  29. Cory, R.; McKnight, D. Fluorescence spectroscopy reveals ubiquitous presence of oxidized and reduced quinones in dissolved organic matter. Environ. Sci. Technol. 2005, 39, 8142–8149. [Google Scholar] [CrossRef] [PubMed]
  30. Ohno, T.; Bro, R. Dissolved organic matter characterization using multiway spectral decomposition of fluorescence landscapes. Soil Sci. Soc. Am. J. 2006, 70, 2028–2037. [Google Scholar] [CrossRef]
  31. Parlanti, E.; Woerz, K.; Geoffroy, L.; Lamotte, M. Dissolved organic matter fluorescence spectroscopy as a tool to estimate biological activity in a coastal zone submitted to anthropogenic inputs. Org. Geochem. 2000, 31, 1765–1781. [Google Scholar] [CrossRef]
  32. Lidén, A.; Keucken, A.; Persson, K.M. Uses of fluorescence excitation-emissions indices in predicting water efficiency. J. Water Proc. Eng. 2017, 16, 249–257. [Google Scholar] [CrossRef]
  33. Köhler, S.J.; Kothawala, D.; Futter, M.N.; Liungman, O.; Tranvik, L. In-Lake Processes Offset Increased Terrestrial Inputs of Dissolved Organic Carbon and Color to Lakes. PLoS ONE 2013, 8, e70598. [Google Scholar] [CrossRef] [PubMed]
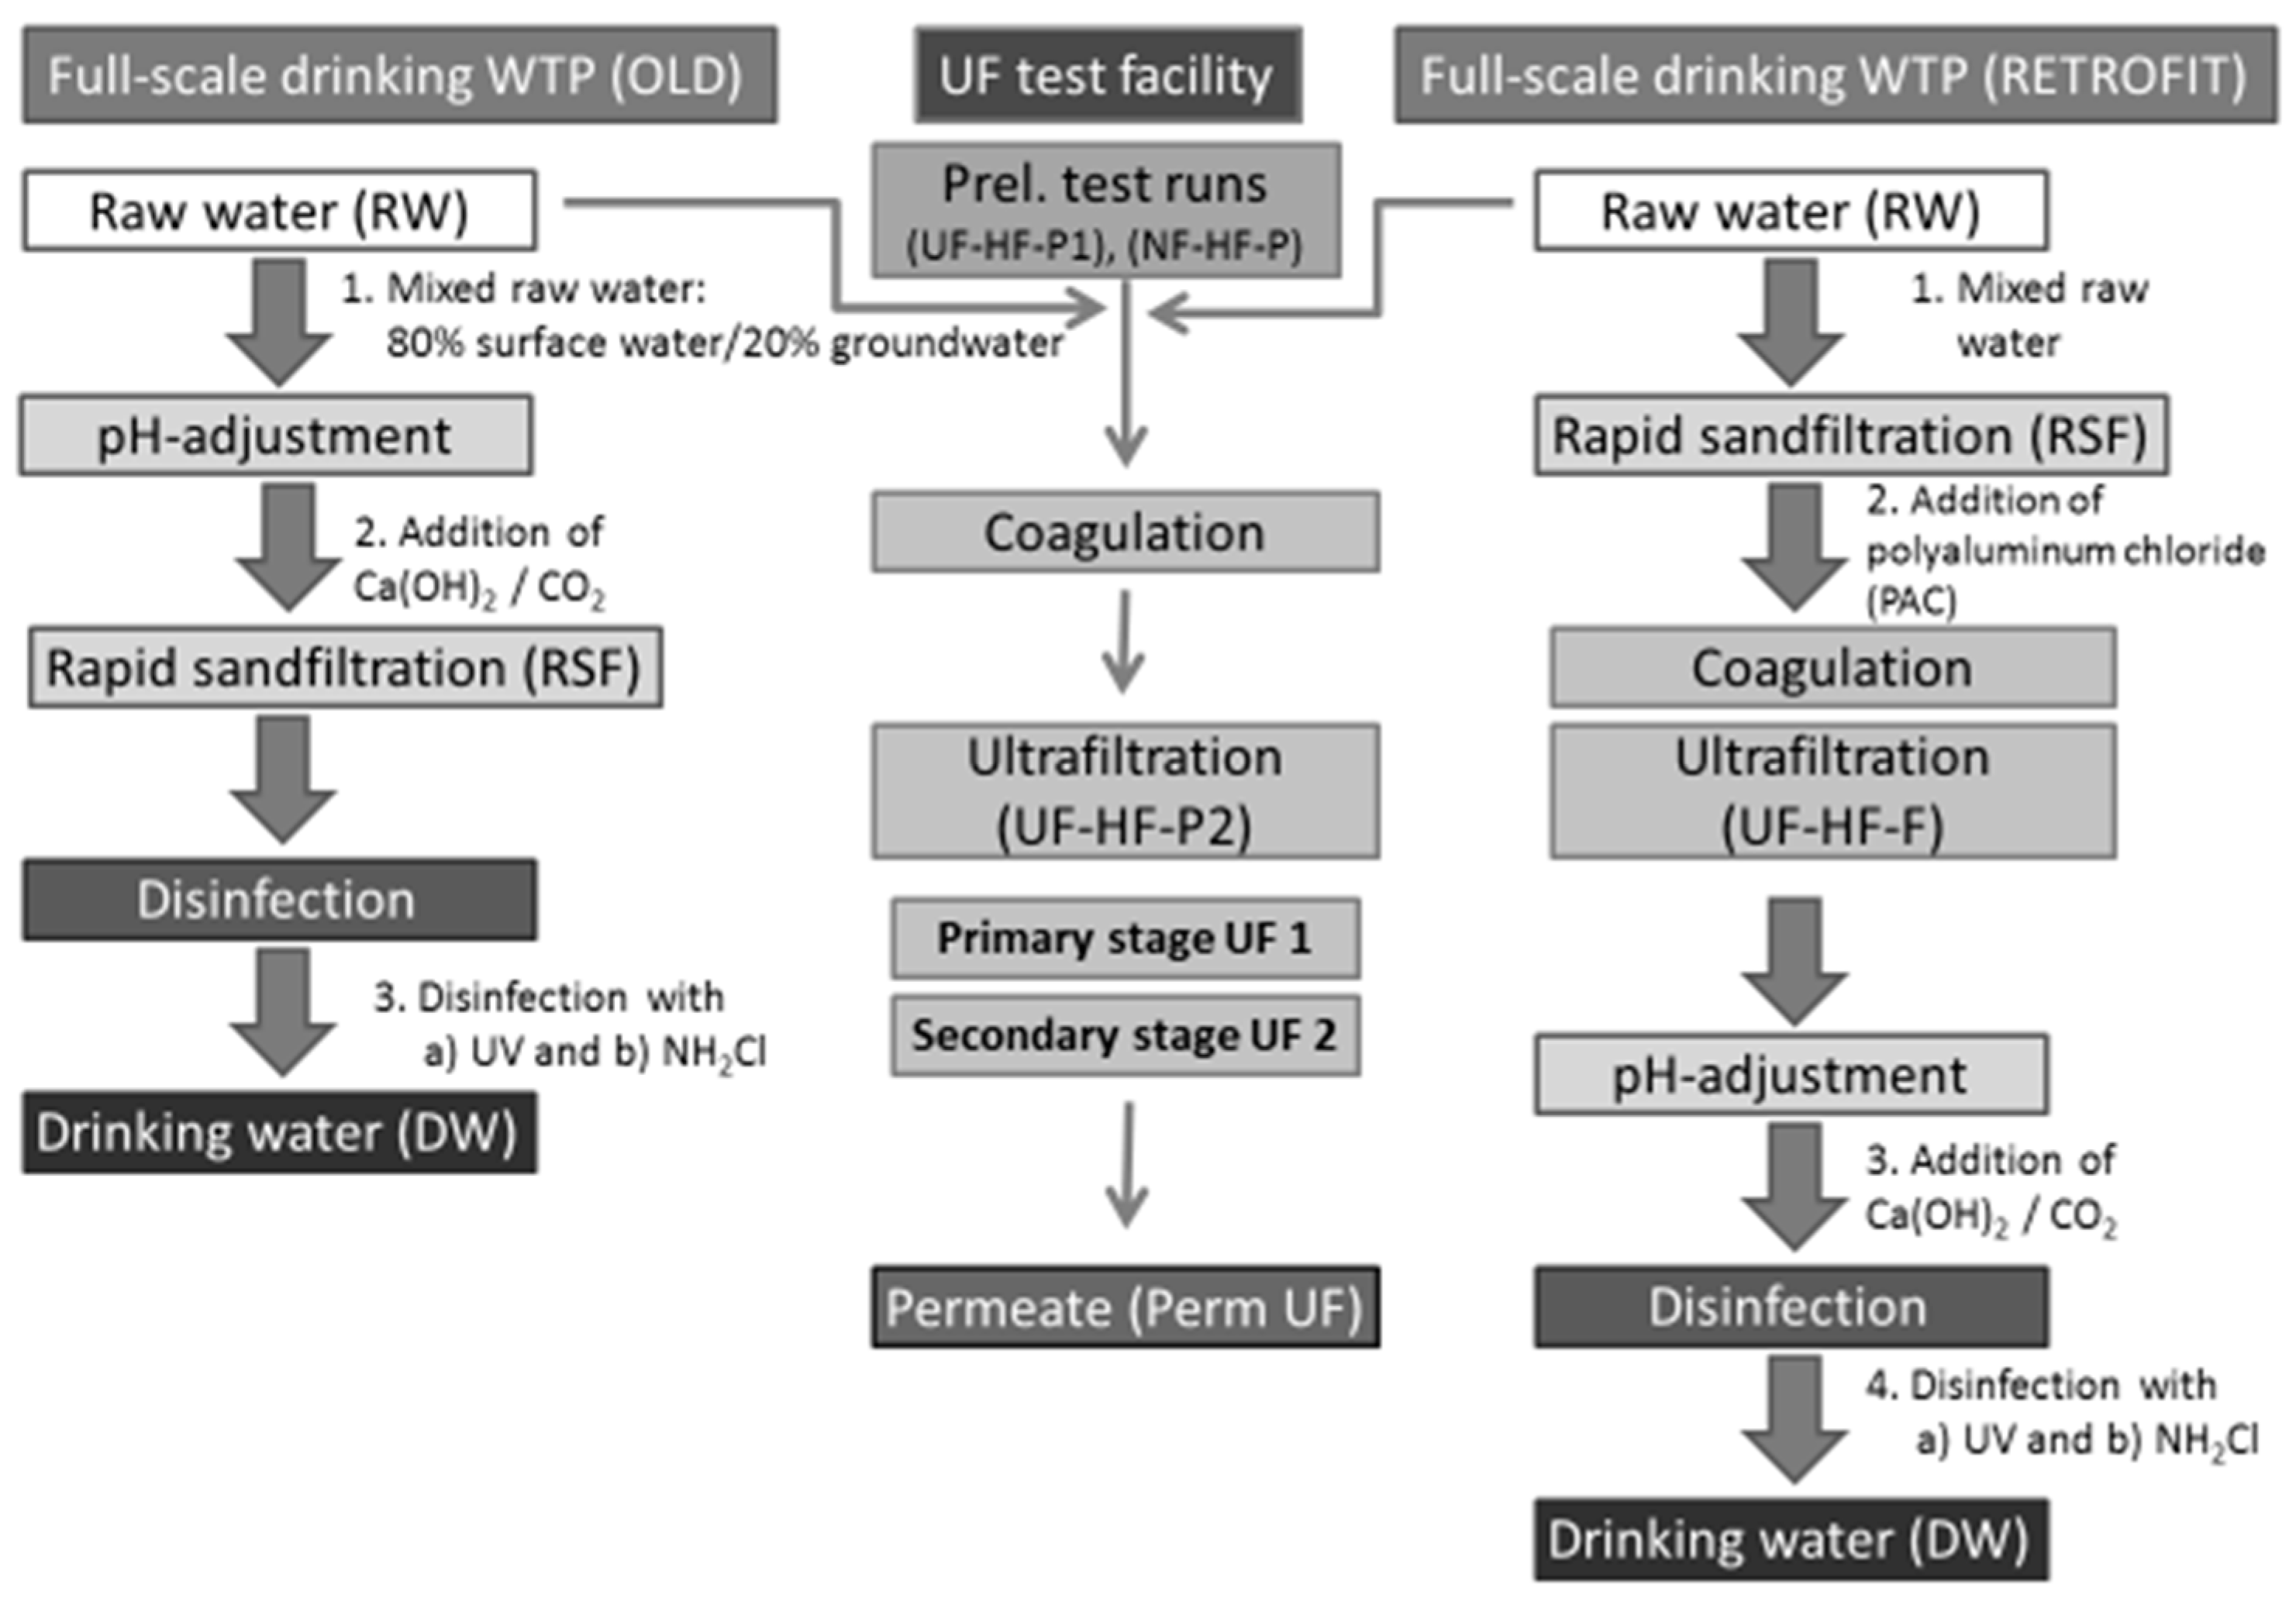
Figure 1. Treatment train for full-scale process and test facility at Kvarnagården WTP.
Water 09 00697 g001
Figure 2. Design for in-line coagulation of full-scale process at Kvarnagården WTP.
Water 09 00697 g002
Figure 3. Schematic overview of the pilot plant process for the two-stage UF test facility (UF-HF-P2).
Water 09 00697 g003
Figure 4. Hydraulic performance of the UF stage-1 container test modules at Kvarnagården WTP for the period 7–19 December 2015. Periods with an increase in transmembrane pressure (TMP; bar) (light blue on left y-axis) and a decrease in permeability (L m−2 h−1 bar−1 @ 20 °C) (dark blue on right y-axis) are shown in relation to in-line coagulation (before, during, and after a stop in coagulant dosing, as displayed with vertical lines) and chemically-enhanced backwashing (CEB) cycles.
Water 09 00697 g004
Figure 5. Hydraulic performance of the UF stage-1 container test modules at Kvarnagården WTP for the period 13 to 25 March 2016. The increase in flux was 65 to 70 L/m2/h (LMH) during the period 15 to 21 March 2016. The TMP and permeability before, during, and after the increase in flux and UV absorbance are indicated with vertical lines. The TMP (bar) on the left-hand scale is indicated with light-blue lines, and permeability (L m−2 h−1 bar−1 @ 20 °C) on the right-hand scale with dark-blue lines. UV absorbance (0.1*m−1) on the left-hand scale is indicated with black lines.
Water 09 00697 g005
Figure 6. Membrane performance and natural organic matter (NOM) removal efficiency of the UF stage-1 container test modules at Kvarnagården WTP for the period 23 to 26 March 2016. A change occurred in the feed water quality for a period of 21 h. TMP (bar) is indicated on the right-hand scale (+), and UV absorbance (m−1) on the left-hand scale: () UVRaw, () UVPerm.
Water 09 00697 g006
Figure 7. Time series of UV (m−1) measured over time using the UV sensor (UVRaw, ●), the unfiltered data of Lab 2 (UVLab2 unfilt, ), and the filtered data of Lab 3 (UVLab3 filt, ) for the raw water (above) and the permeate (below).
Water 09 00697 g007
Figure 8. Sensor-based change in UV signal between the feed and permeate, as a function of added Al. ΔUV = 2.63 + 5.15*Al dose − 4.30*(dose − 0.529)2.
Water 09 00697 g008
Figure 9. Predicted Al dose as a function of time for current mixing conditions (15% groundwater (GW), 85% surface water, black line), optional (20% GW and 80% surface water, dark-blue line), and increased (25% GW and 75% surface water, light-blue line), assuming constant SUVA in both sources over time, but an increase of 0.05 mg DOC L−1 per year in the surface water (Lake Neden) over time. The black stippled line shows the predicted UV absorbance in the permeate (UF perm) from the retrofitted UF full-scale water treatment plant, if current mixing conditions were maintained and the maximum economically feasible dosing was assumed to be 0.95 mg Al L−1.
Water 09 00697 g009
Table 1. Summary of different pilot studies at Kvarnagården water treatment plant (WTP). HF: hollow fibre; NF: nanofiltration; PES: polyethersulfone; UF: ultrafiltration.
Pilot Plant Type (Module Type)CodeScaleStartEndMembrane Type
UF HF one-stage (KOCH, HF 10-48 35)UF-HF-P1Pilot1 June 201015 August 2011PES
UF-HF two-stage (Pentair, XIGA/AquaFlex)UF-HF-P2Pilot1 January 2015RunningPES
NF (Pentair, HFW 1000)NF-HF-PPilot2 November 20114 May 2012PES
UF-HF two-stage HF (Pentair, XIGA/AquaFlex)UF-HF-FFull15 February 2017RunningPES
Table 2. Comparison of water quality parameters in raw water, current drinking water, and after membrane treatment (median and standard deviations) during the feasibility tests year 2010–2012. The NF was run as one stage, with a recovery rate of 50%. During the early UF and NF trials, most turbidity values in permeate were below the detection limit. For the NF, most total organic carbon (TOC) and dissolved organic carbon (DOC) values were below the detection limit (affected values in italics). Values below the detection limit were reported as half the detection limit. COD: chemical oxygen demand; SUVA: specific ultraviolet absorbance.
ParameterRaw WaterDrinking Water (Full-Scale WTP OLD)UF without CoagulantUF with CoagulantNF50%Target Value
CodeRAWDWUF-HF-P1UF-HF-P1NF-HF-P
COD (mg/L)2.2 ± 0.22.1 ± 0.22.1 ±0.11.3 ± 0.20.9 ± 0.5<4 limit
TOC (mg/L)2.6 ± 0.22.7 ± 0.22.5 ± 0.22.1 ± 0.31.0
DOC (mg/L)2.5 ± 0.22.4 ± 0.22.3 ± 0.12.0 ± 0.21.0
UV254 (L/m)8.7 ± 0.58.1 ± 0.57.3 ± 0.23.7 ± 0.52.8 ± 0.1
SUVA (L/mg, m)3.6 ± 0.43.3 ± 0.43.3 ± 0.11.8 ± 0.32.8
Colour405nm (mg Pt/L)14.0 ± 1.213.0 ± 1.310.0 ± 0.72.5 ± 1.32.0 ± 0.8<15 limit <5 rec.
Turbidity (FNU)0.21 ± 0.060.22 ± 0.050.050.050.04<0.5 limit <0.1 rec.
pH7.6 ± 0.18.1 ± 0.1 7.4 ± 0.17.5–9 limit
Table 3. Median and standard deviation for UV absorbance @254 nm (m−1), DOC (mg L−1), fluorescence index (FI), freshness index (β:α), and SUVA (L/mg*m) for the period 2015–2016. Regarding the UV absorbance, four different measurements are available, namely those of three laboratories (UVLab1–3) and the sensor data (UVRaw). The samples for laboratory 3 are all filtered (0.7 µm glass fibre filters, GFF) samples. Missing results are marked n.d., and DELTA (%) is the percentage of removal of UV calculated as ΔUV/UV.
SampleUVRawUVLab1 unfilt. $UVLab2 unfilt. $UVLab3 filt. #DOCLab3FILab3β/αLab3SUVALab3
Raw 20159.40 ± 0.469.23 ± 0.449.30 ± 0.388.57 ± 0.36n.d.n.d.n.d.n.d.
Raw 20169.90 ± 0.179.30 ± 0.379.04 ± 0.488.60 ± 0.39n.d.n.d.n.d.n.d.
Raw9.80 ± 0.239.40 ± 0.459.11 ± 0.418.59 ± 0.372.89 ± 0.071.47 ± 0.020.63 ± 0.012.97 ± 0.05
Feedn.d.n.d.n.d.5.93 ± 1.482.26 ± 0.301.58 ± 0.050.71 ± 0.032.51 ± 0.32
Perm4.00 ± 0.784.00 ± 1.004.53 ± 1.024.41 ± 1.052.05 ± 0.221.61 ± 0.050.73 ± 0.032.12 ± 0.25
DELTA59%57%50%48%
Perm 20154.10 ± 0.744.03 ± 0.764.50 ± 1.094.23 ± 1.07n.d.n.d.n.d.n.d.
Perm 20163.80 ± 0.344.01 ± 0.334.62 ± 0.954.43 ± 1.57n.d.n.d.n.d.n.d.
Notes: $ Measured in a 4-cm cuvette. # Measured in a 1-cm cuvette.
Table 4. Average and standard deviation of liquid chromatography-organic carbon detection (LC-OCD) analysis for (n) samples of the groundwater well (Well), the lake (Neden), the feed (Feed, values in bold for comparison), and the UF and NF permeate (Perm), NF concentrate (Conc), and the drinking water from the retrofitted UF full-scale water treatment plant (DV). Missing results are marked as n.d. LMW: low molecular weight.
CodeSamplenTOC (ppb-C)DOC (ppb-C)Biopolymers (ppb-C)HS (ppb-C)Building Blocks (ppb-C)LMWneutrals (ppb-C)LMWacids (ppb-C)SUVA (L mg−1 m−1)
NF-HF-PLake3n.d.3235 ± 81121 ± 82034 ± 54568 ± 67398 ± 339 ± 93.92 ± 0.03
UF-HF-P1Lake43126 ± 2023021 ± 204100 ± 231919 ± 119558 ± 49401 ± 2020 ± 93.82 ± 0.24
UF-HF-P1GW2600 ± 73546 ± 2135 ± 26260 ± 850 ± 70 ± 20 ± 02.02 ± 0.18
UF-HF-P1Feed42578 ± 4022423 ± 34372 ± 371603 ± 273444 ± 57344 ± 3323 ± 113.65 ± 0.8
UF-HF-P1Perm31655 ± 851714 ± 11135 ± 10855 ± 140418 ± 28315 ± 385 ± 72.62 ± 0.18
UF-HF-FFeed22541 ± 772337 ± 1672 ± 101513 ± 10409 ± 3302 ± 542 ± 43.43 ± 0.22
UF-HF-FPerm21679 ± 341496 ± 2427 ± 4756 ± 53424 ± 68281 ± 117 ± 92.31 ± 0.26
NF-HF-PFeed3n.d.2593 ± 16793 ± 21638 ± 55508 ± 13334 ± 190 ± 33.83 ± 0.04
NF-HF-PPerm3n.d.1158 ± 2687 ± 3592 ± 185244 ± 56210 ± 490 ± 33.09 ± 0.18
NF-HF-PConc3n.d.4502 ± 1317162 ± 992940 ± 980804 ± 171476 ± 1231 ± 04.09 ± 0.16
UF-HF-FDV21742 ± 1941473 ± 731 ± 1754 ± 66411 ± 70272 ± 411 ± 51.88 ± 0.41
Table 5. The effect of incremental increase of the coagulant dose on UV absorbance and membrane performance. Data for TMP and permeability relate to an ordinary filtration cycle for UF stage-1 and UF stage-2 of the UF test facility (UF-HF-P2) at Kvarnagården WTP.
Dose (mg Al L−1)1.001.401.601.802.00
UF stageUF1UF2UF1UF2UF1UF2UF1UF2UF1UF2
Flux (LMH)49334933493349334933
TMP (bar)0.16–0.190.05–0.140.17–0.190.06–0.170.16–0.180.06–0.220.16–0.180.06–0.240.16–0.190.06–0.25
Permeability (L m−2 h−1 bar−1 @ 20 °C)420–360760–320420–360760–240420–370740–200420–360740–170420–360740–150
Feed water, UV254 (m−1)10.02n.a.9.9n.a.9.8n.a.9.7n.a.10.05n.a.
Permeate, UV254 (m−1)2.704.12.33.22.32.82.252.72.152.8