On the Influence of Input Data Quality to Flood Damage Estimation: The Performance of the INSYDE Model


Abstract
1. Introduction
2. Materials and Methods
2.1. The INSYDE Model
- (i)
- default values are automatically supplied by the model for unknown input data. Default values may also be modified by the user according to their specific knowledge of the study area; and,
- (ii)
- some of the variables listed in Table 1 may be expressed as a function of other variables, thus decreasing the number of inputs: for instance, both the distribution of the heating system (PD) and its type (PT) may be expressed as a function of the year of construction of the building (YY).
2.2. Data
- external water depth (he) and flow velocity (v) at buildings’ location, resulting from a (5 × 5 m resolution) 1D–2D hydraulic modelling of the flood event;
- number of floors (NF), year of construction (YY), structural type (BS), building type (BT) and quality (i.e., finishing level, FL), as acquired by means of direct surveys on the single buildings;
- footprint area (IA), as derived by the local cadastral map (Regione Veneto, 2004); and,
- loss data consisting of actual restoration costs, certified by original receipts and invoices.
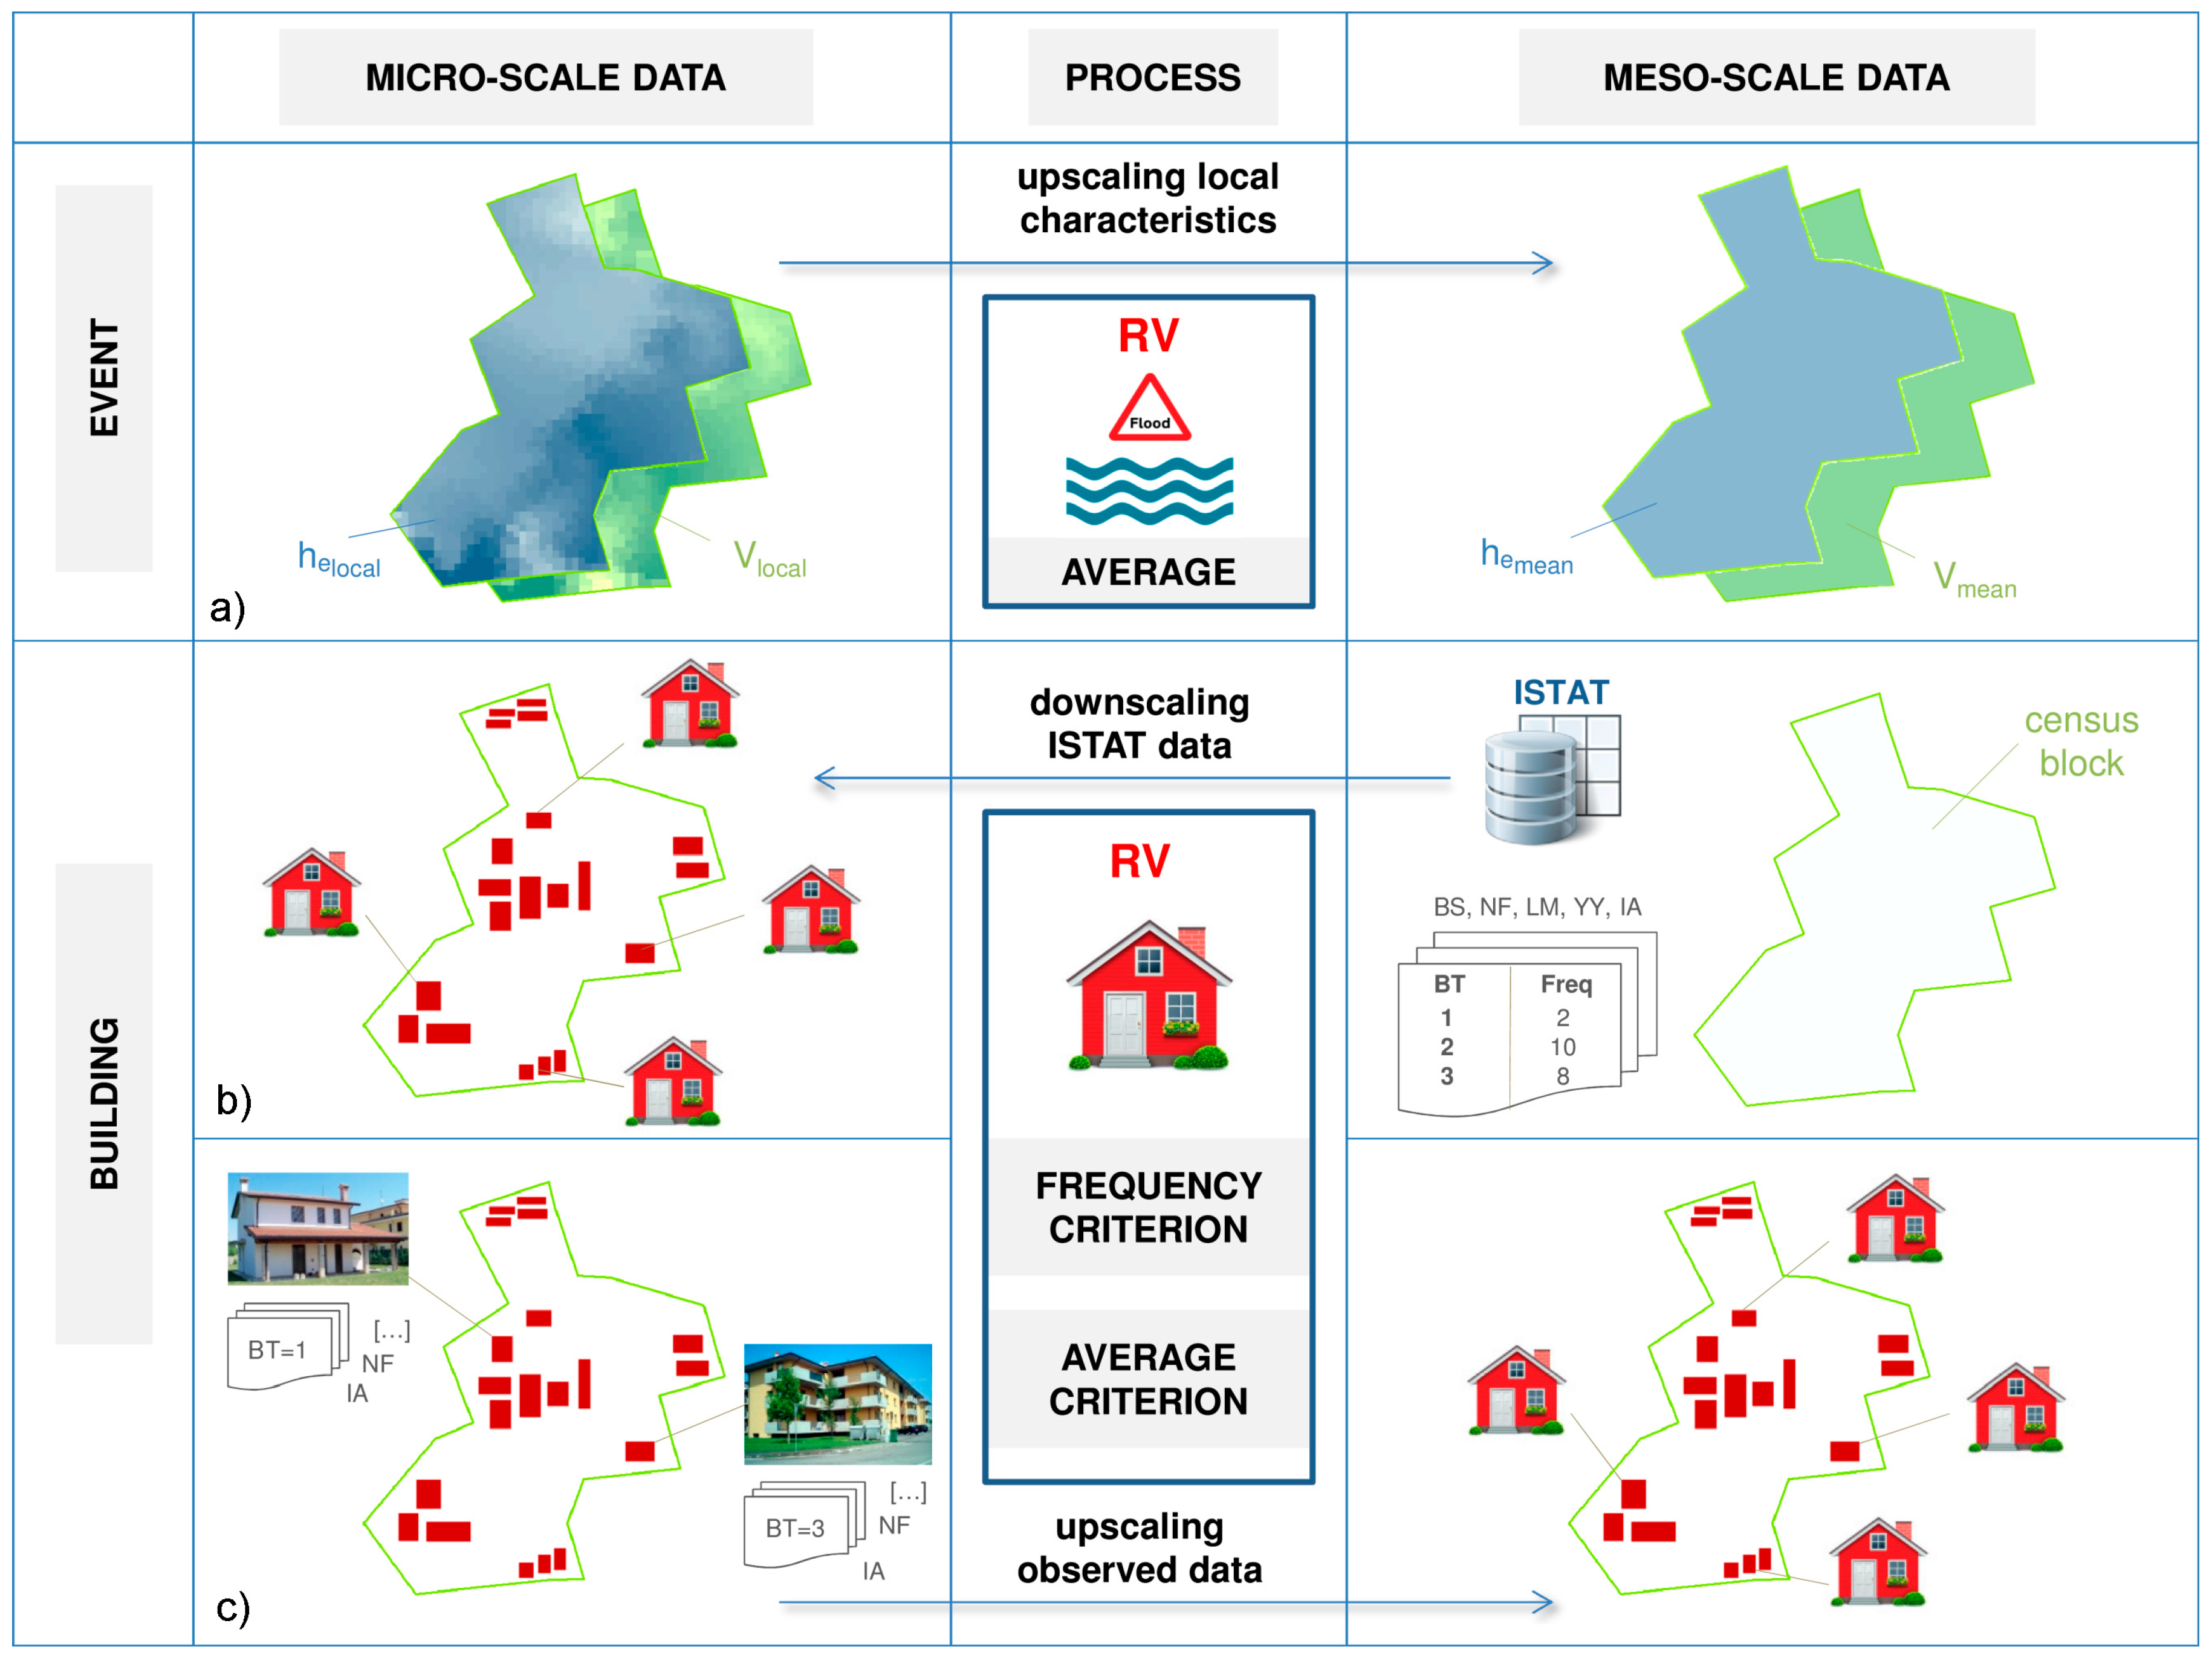
2.3. Methods
- Scenario 1: information related to the flood event and the footprint area (IA) is available at the micro-scale, while building characteristics are available only at the census block scale; RVs are identified using the frequency criterion;
- Scenario 2: equivalent to Scenario 1, but RVs are identified using the average criterion;
- Scenario 3: only information related to the footprint area (IA) is available at level of single buildings, while both flood event and other building features are available at the census block scale; building RVs are identified using the frequency criterion;
- Scenario 4: flood event and building features, including the footprint area (IA), are available at the census block scale; building RVs are identified using the frequency criterion;
- Scenario 5: equivalent to Scenario 3, but building RVs are identified using the average criterion; and,
- Scenario 6: equivalent to Scenario 4, but building RVs are identified using the average criterion.
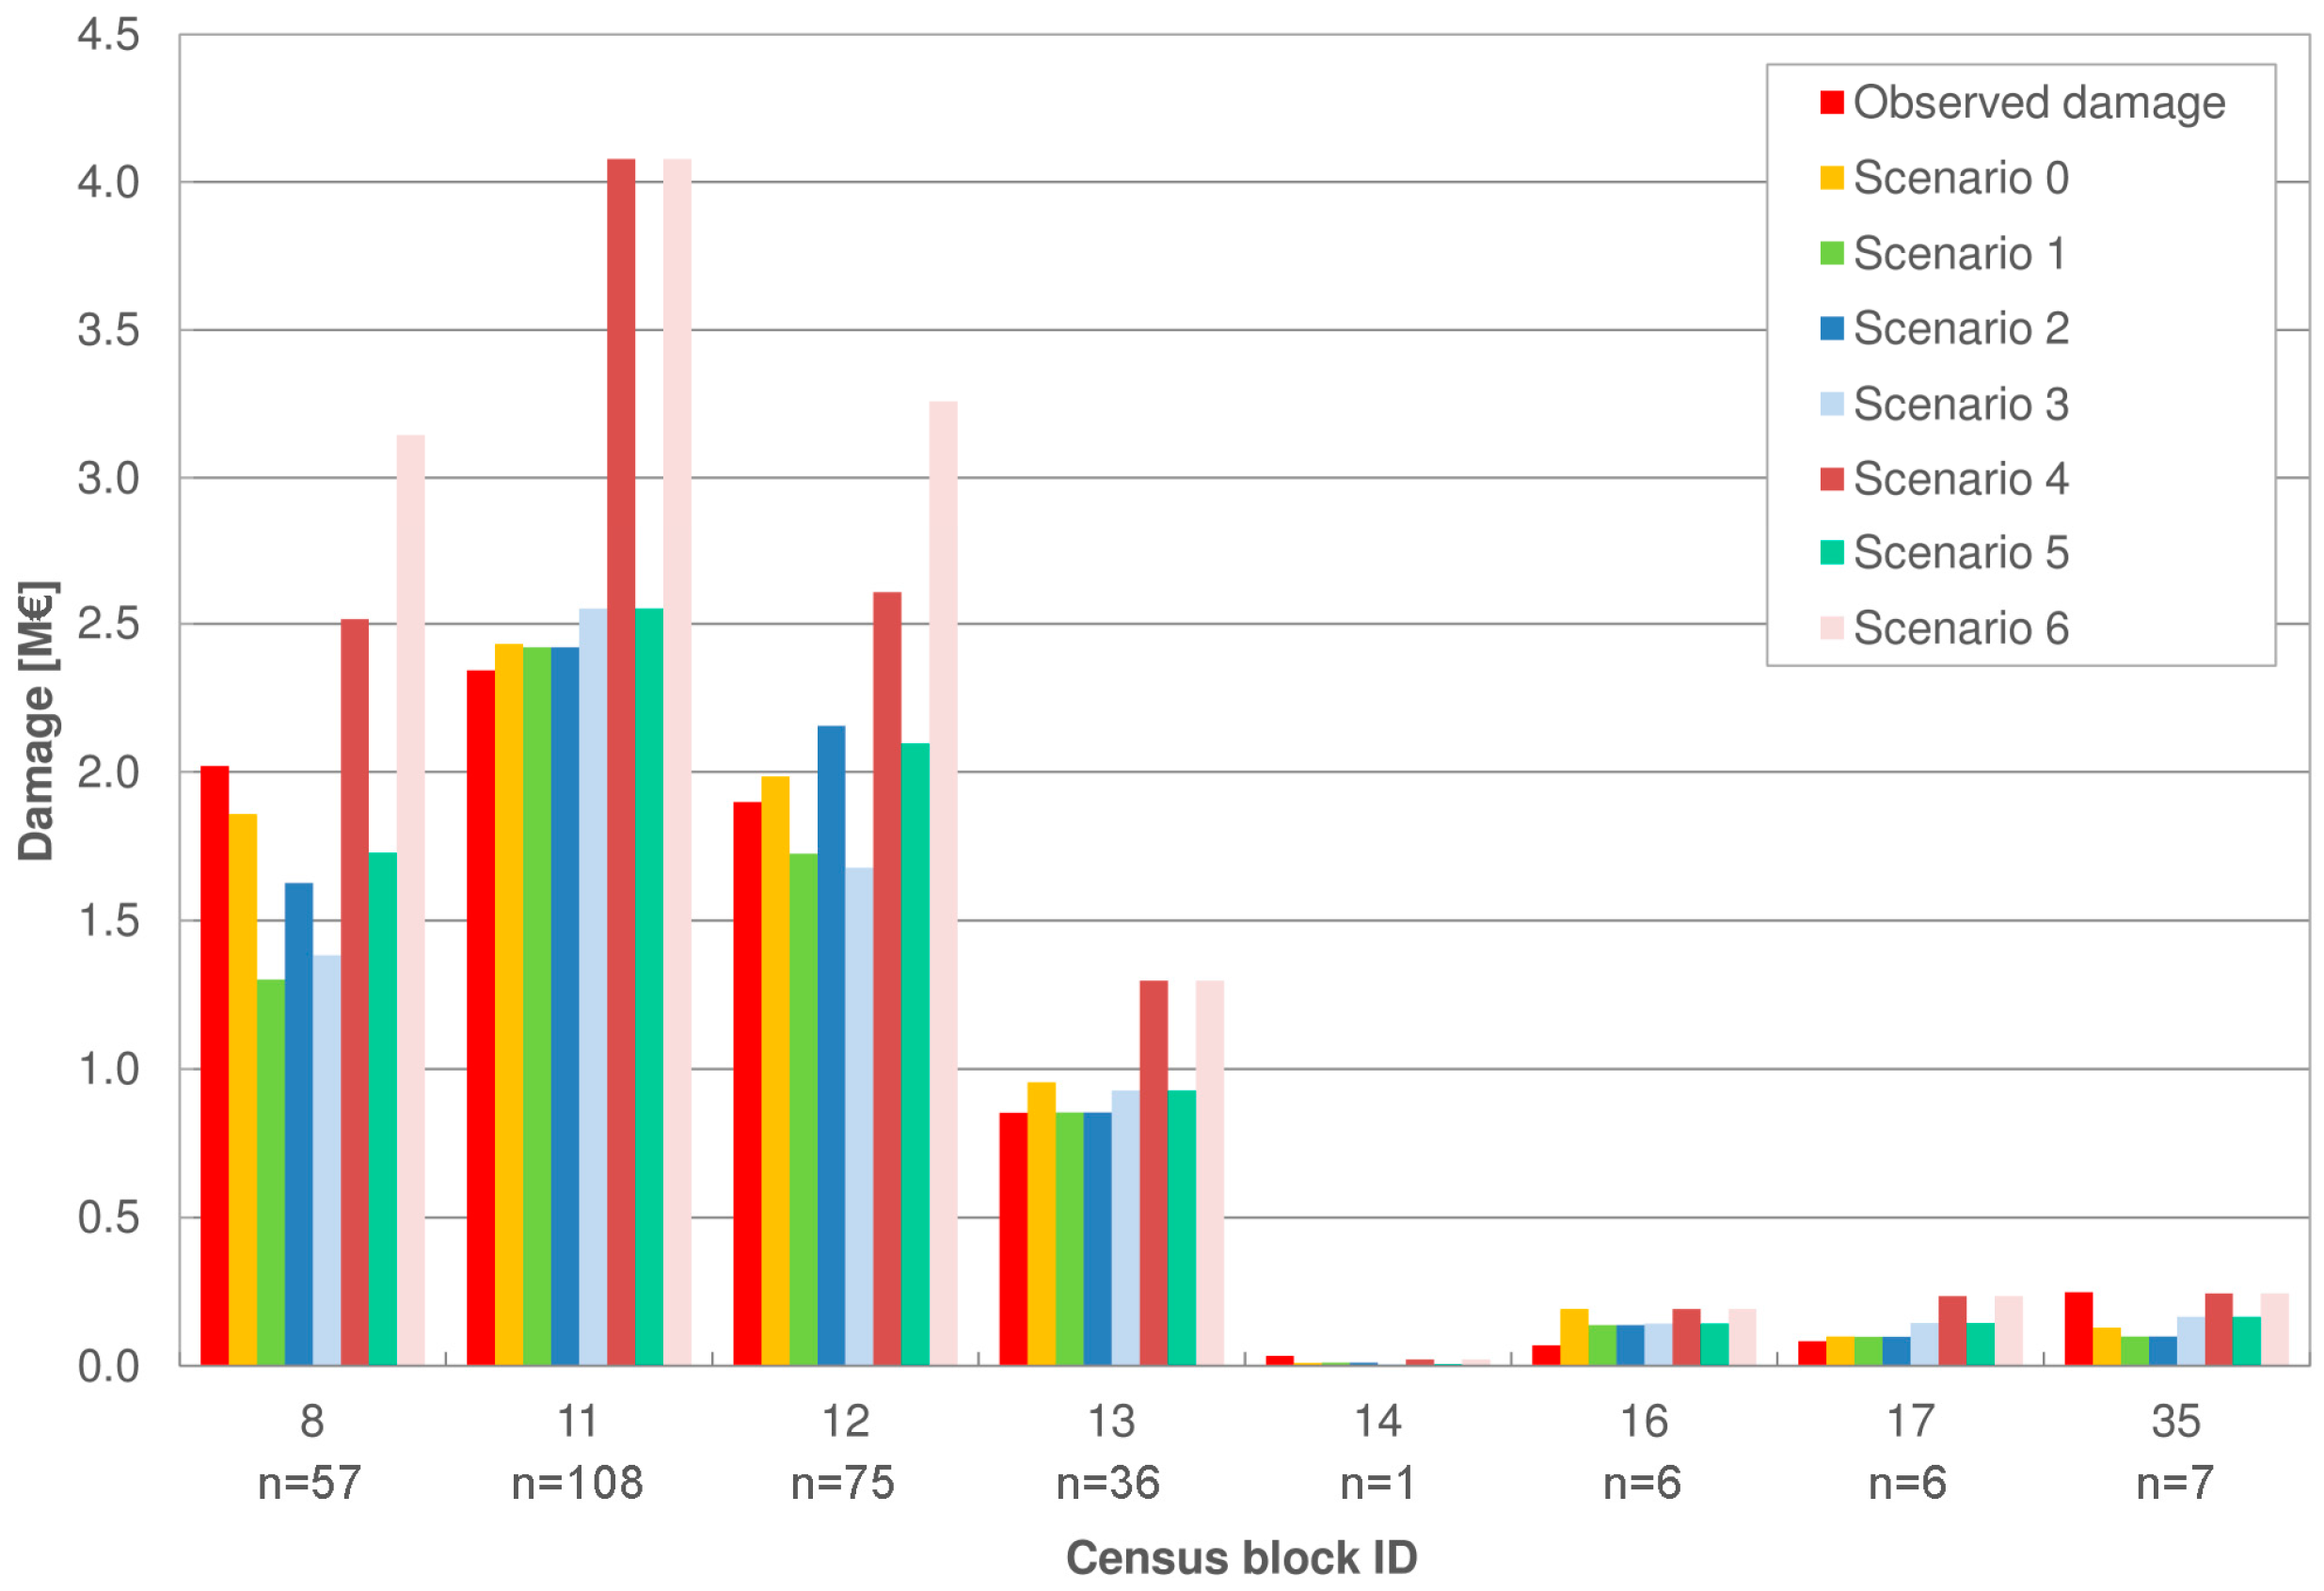
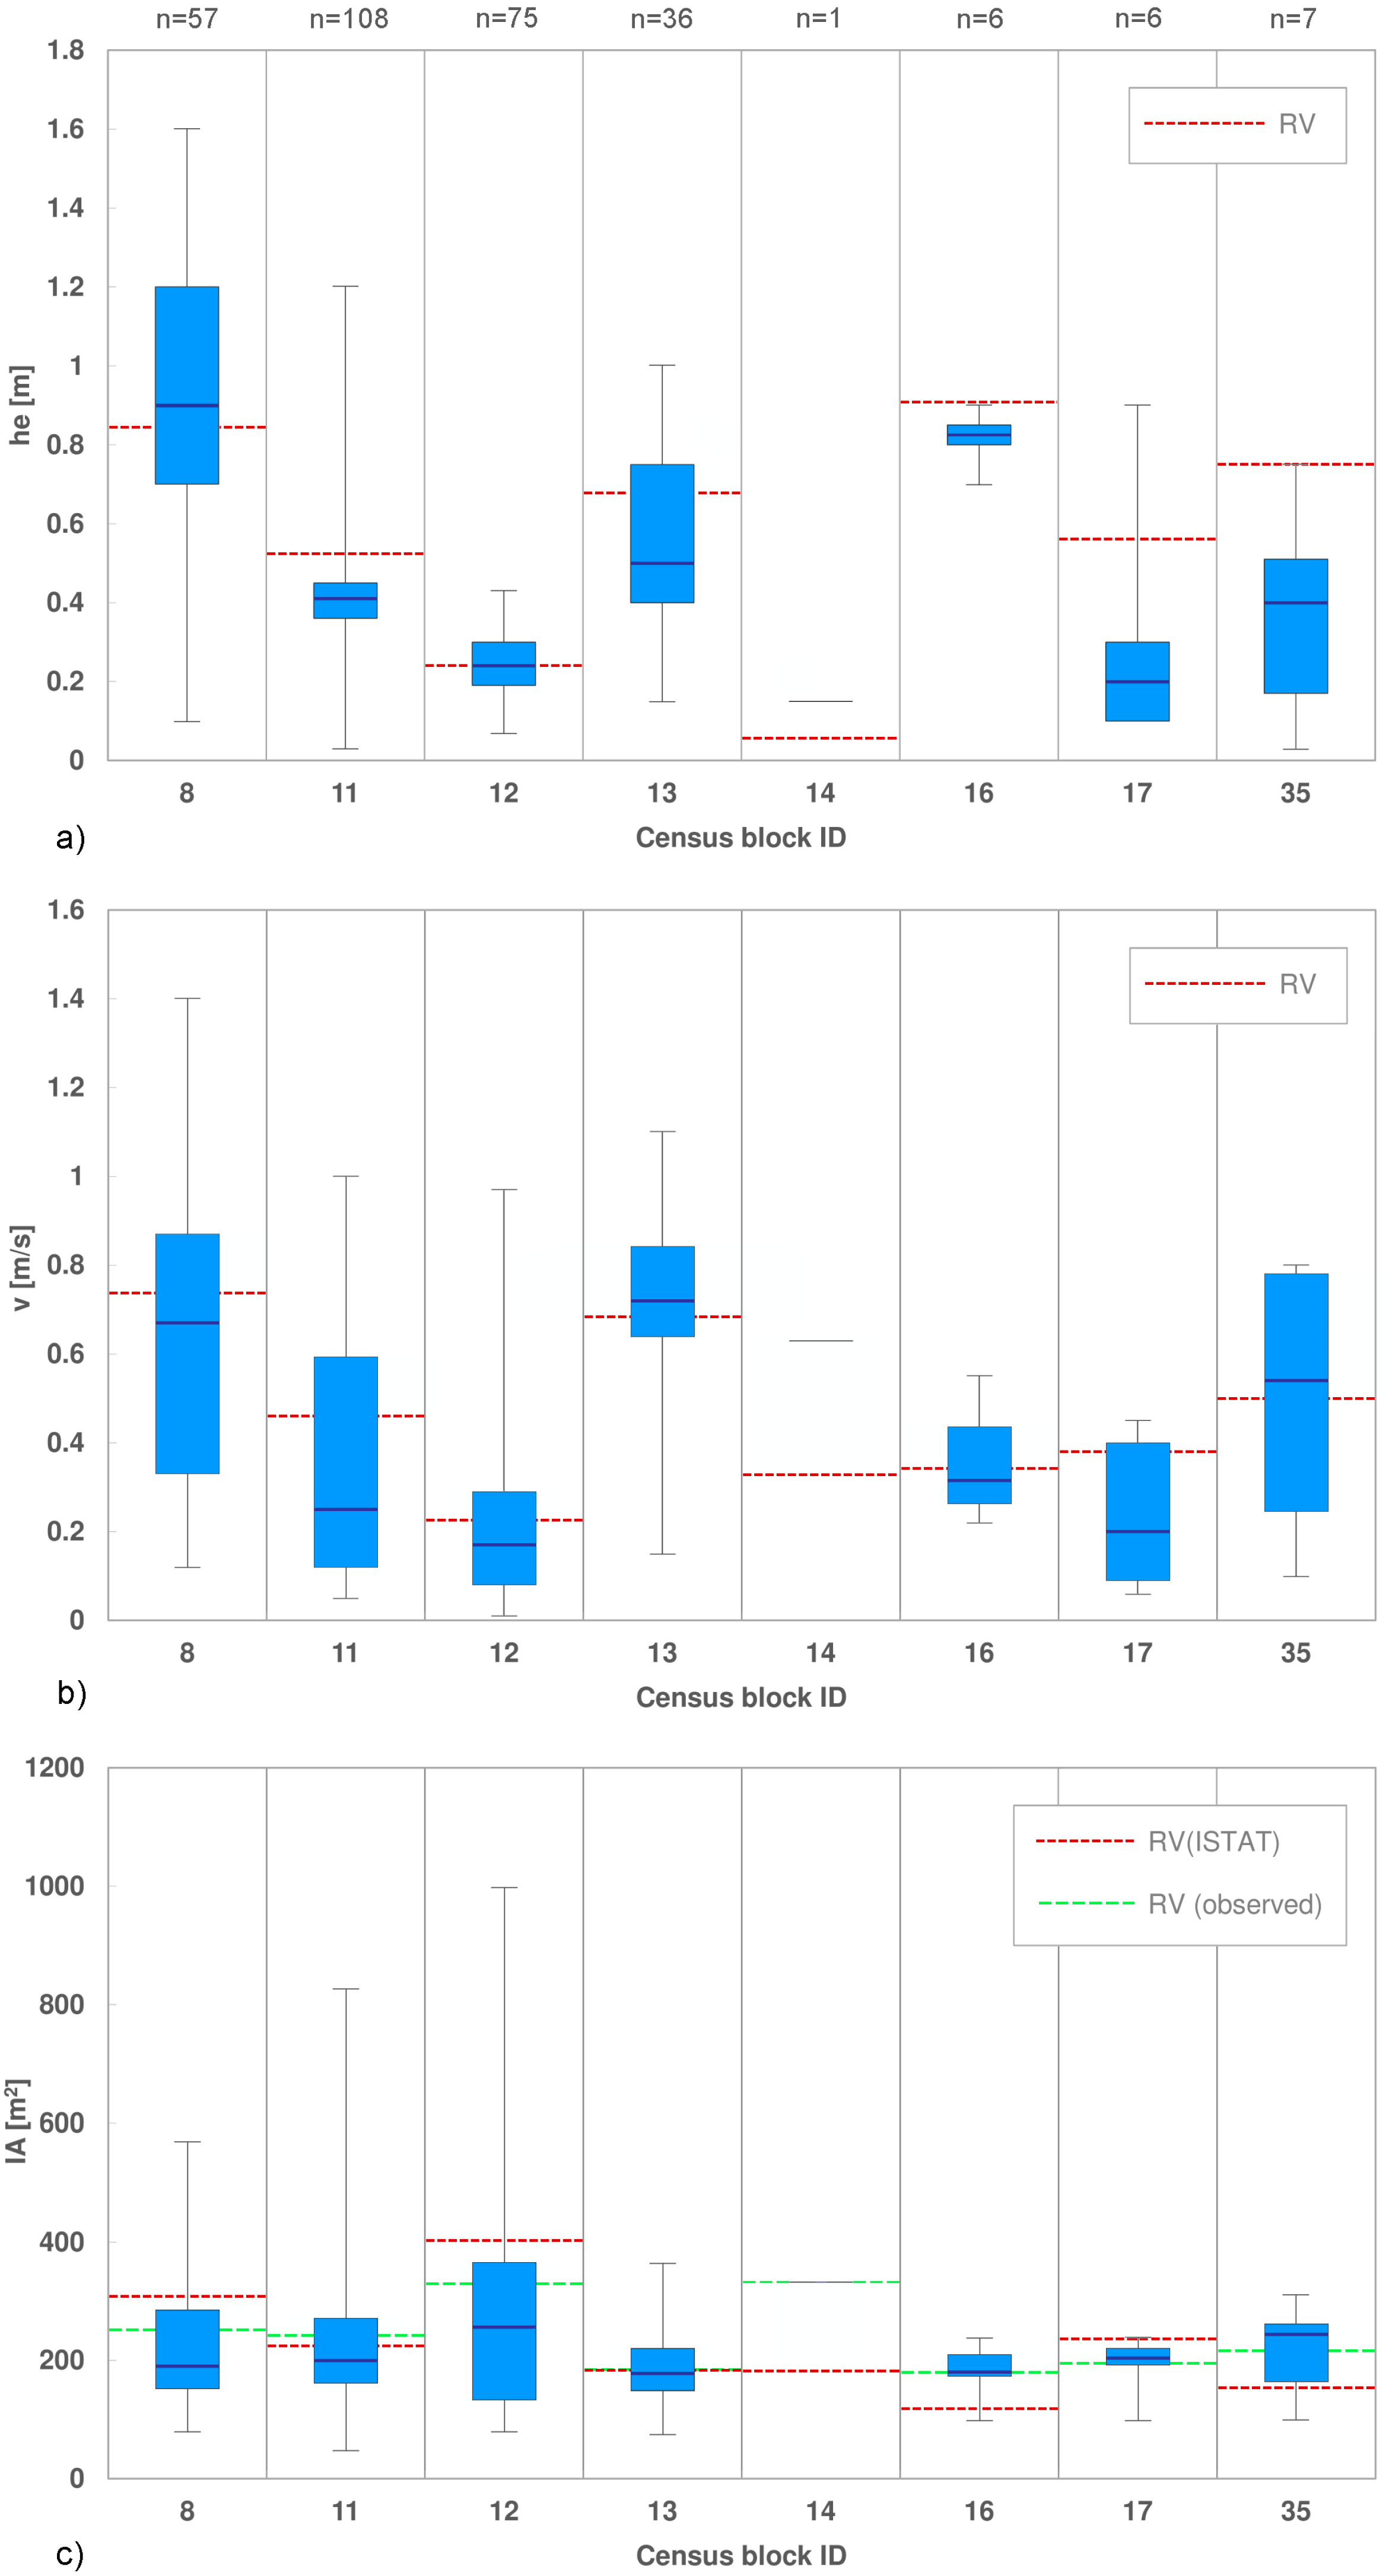
3. Results and Discussion
- bias:
- mean error:
- mean absolute error:
- root mean square error:
Transferability of Results
4. Conclusions
Acknowledgments
Author Contributions
Conflicts of Interest
References
- Merz, B.; Kreibich, H.; Schwarze, R.; Thieken, A. Assessment of economic flood damage. Nat. Hazards Earth Syst. Sci. 2010, 10, 1697–1724. [Google Scholar] [CrossRef]
- Apel, H.; Aronica, G.T.; Kreibich, H.; Thieken, A. Flood risk analyses—How detailed do we need to be? Nat. Hazards 2009, 49, 79–98. [Google Scholar] [CrossRef]
- De Moel, H.; Aerts, J.C.J.H. Effect of uncertainty in land use, damage models and inundation depth on flood damage estimates. Nat. Hazards 2011, 58, 407–425. [Google Scholar] [CrossRef]
- Freni, G.; La Loggia, G.; Notaro, V. Uncertainty in urban flood damage assessment due to urban drainage modelling and depth-damage curve estimation. Water Sci. Technol. 2010, 61, 2979–2993. [Google Scholar] [CrossRef] [PubMed]
- Jongman, B.; Kreibich, H.; Apel, H.; Barredo, J.I.; Bates, P.D.; Feyen, L.; Gericke, A.; Neal, J.; Aerts, J.C.J.H.; Ward, P.J. Comparative flood damage model assessment: Towards a European approach. Nat. Hazards Earth Syst. Sci. 2012, 12, 3733–3752. [Google Scholar] [CrossRef]
- Scorzini, A.R.; Leopardi, M. River basin planning: From qualitative to quantitative flood risk assessment: The case of Abruzzo Region (central Italy). Nat. Hazards 2017, 88, 71–93. [Google Scholar] [CrossRef]
- Molinari, D.; Menoni, S.; Aronica, G.T.; Ballio, F.; Berni, N.; Pandolfo, C.; Stelluti, M.; Minucci, G. Ex post damage assessment: An Italian experience. Nat. Hazards Earth Syst. Sci. 2014, 14, 901–916. [Google Scholar] [CrossRef]
- Cammerer, H.; Thieken, A.H.; Lammel, J. Adaptability and transferability of flood loss functions in residential areas. Nat. Hazard. Earth Syst. Sci. 2013, 13, 3063–3081. [Google Scholar] [CrossRef]
- Dottori, F.; Figueiredo, R.; Martina, M.L.V.; Molinari, D.; Scorzini, A.R. INSYDE: A synthetic, probabilistic flood damage model based on explicit cost analysis. Nat. Hazards Earth Syst. Sci. 2016, 16, 2577–2591. [Google Scholar] [CrossRef]
- Scorzini, A.R.; Frank, E. Flood damage curves: New insights from the 2010 flood in Veneto, Italy. J. Flood Risk Manag. 2015. [Google Scholar] [CrossRef]
- Chen, K.; McAneney, J.; Blong, R.; Leigh, R.; Hunter, L.; Magill, C. Defining area at risk and its effect in catastrophe loss estimation: A dasymetric mapping approach. Appl. Geogr. 2004, 24, 97–117. [Google Scholar] [CrossRef]
- Thieken, A.H.; Olschewski, A.; Kreibich, H.; Kobsch, S.; Merz, B. Development and evaluation of FLEMOps—A new Flood Loss Estimation Model for the private sector. In Flood Recovery, Innovation and Response; Proverbs, D., Brebbia, C.A., Penning-Rowsell, E., Eds.; WIT Press: Southampton, UK, 2008; ISBN 978-1-84564-132-0. [Google Scholar]
- Penning-Rowsell, E.C.; Johnson, C.; Tunstall, S.; Tapsell, S.; Morris, J.; Chatterton, J.; Coker, A.; Green, C. The Benefits of Flood and Coastal Risk Management: A Manual of Assessment Techniques; Middlesex University Press: London, UK, 2005; ISBN 1-904750-51-6. [Google Scholar]


| Event Features | Building Characteristics | ||||||||||||||||||||||
|---|---|---|---|---|---|---|---|---|---|---|---|---|---|---|---|---|---|---|---|---|---|---|---|
| External water depth (he) | Internal water depth (h) | Flow velocity (v) | Sediment load (s) | Duration (d) | Water quality (q) | Footprint area (IA) | Basement area (BA) | External perimeter (EP) | Internal perimeter (IP) | Basement perimeter (BP) | Number of floors (NF) | Interfloor height (IH) | Basement height (BH) | Ground floor level (GL) | Basement level (BL) | Building type (BT) | Building structure (BS) | Finishing level (FL) | Level of maintenance (LM) | Year of construction (YY) | Heat. syst. distrib. (PD) | Heat. syst. type (PT) | |
| Scenario 0 | x | o | x | M | x | x | o | o | o | x | x | x | x | x | o | o | |||||||
| Scenario 1 and 1a | x | o | x | M | x | o | o | M | M | M | M | M | m | m | |||||||||
| Scenario 2 and 2a | x | o | x | M | x | o | o | M | M | M | M | M | m | m | |||||||||
| Scenario 3 and 3a | M | m | M | M | x | o | o | M | M | M | M | M | m | m | |||||||||
| Scenario 4 and 4a | M | m | M | M | M | m | m | M | M | M | M | M | m | m | |||||||||
| Scenario 5 and 5a | M | m | M | M | M | m | m | M | M | M | M | M | m | m | |||||||||
| Scenario 6 and 6a | M | m | M | M | x | o | o | M | M | M | M | M | m | m | |||||||||
| Scenario | Dest [M€] | Bias | ME [€] | AME [€] | RMSE [€] | ||||
|---|---|---|---|---|---|---|---|---|---|
| ID | Water Depth (he) | Flow Velocity (v) | Internal Area (IA) | Other building Variables | |||||
| 0 | observed | observed | observed | observed | 7.66 | 1.01 | 370.3 | 17,483.8 | 28,907.9 |
| 1 | observed | observed | observed | RV-freq. (ISTAT) | 6.65 | 0.88 | −3044.7 | 16,310.0 | 27,658.6 |
| 2 | observed | observed | observed | RV-aver. (ISTAT) | 7.40 | 0.98 | −488.8 | 16,673.4 | 27,623.0 |
| 3 | RV | RV | observed | RV-freq. (ISTAT) | 7.00 | 0.93 | −1864.1 | 17,663.8 | 28,606.9 |
| 4 | RV | RV | RV | RV-freq. (ISTAT) | 11.19 | 1.48 | 12,309.9 | 24,064.7 | 31,420.1 |
| 5 | RV | RV | observed | RV-aver. (ISTAT) | 7.76 | 1.03 | 720.8 | 18,246.8 | 28,692.7 |
| 6 | RV | RV | RV | RV-aver. (ISTAT) | 12.47 | 1.65 | 16,636.1 | 26,640.8 | 33,290.2 |
| 1a | observed | observed | observed | RV-freq. (observed) | 6.97 | 0.92 | −1953.1 | 16,267.0 | 27,426.8 |
| 2a | observed | observed | observed | RV-aver. (observed) | 7.40 | 0.98 | −496.5 | 16,681.0 | 27,629.3 |
| 3a | RV | RV | observed | RV-freq. (observed) | 7.34 | 0.97 | −700.3 | 17,832.9 | 28,487.3 |
| 4a | RV | RV | RV | RV-freq. (observed) | 11.01 | 1.46 | 11,701.2 | 24,061.2 | 31,539.5 |
| 5a | RV | RV | observed | RV-aver. (observed) | 7.76 | 1.03 | 716.7 | 18,251.0 | 28,696.7 |
| 6a | RV | RV | RV | RV-aver. (observed) | 11.54 | 1.53 | 13,478.3 | 24,768.7 | 31,888.9 |
| Country | Level of Detail | Available Variables |
|---|---|---|
| Italy | Census block | NF, BT, BS, YY, LM |
| UK | Census block | BT, PD |
| France | Census block | IA, YY, PD |
| Spain | Census block | IA, NF, YY, LM |
| Belgium | Municipality | YY, LM |
| Germany | Municipality | YY, IA, BT, PD |
| Portugal | Municipality | NF, IA |
© 2017 by the authors. Licensee MDPI, Basel, Switzerland. This article is an open access article distributed under the terms and conditions of the Creative Commons Attribution (CC BY) license (http://creativecommons.org/licenses/by/4.0/).
Share and Cite
Molinari, D.; Scorzini, A.R. On the Influence of Input Data Quality to Flood Damage Estimation: The Performance of the INSYDE Model. Water 2017, 9, 688. https://doi.org/10.3390/w9090688
Molinari D, Scorzini AR. On the Influence of Input Data Quality to Flood Damage Estimation: The Performance of the INSYDE Model. Water. 2017; 9(9):688. https://doi.org/10.3390/w9090688
Chicago/Turabian StyleMolinari, Daniela, and Anna Rita Scorzini. 2017. "On the Influence of Input Data Quality to Flood Damage Estimation: The Performance of the INSYDE Model" Water 9, no. 9: 688. https://doi.org/10.3390/w9090688
APA StyleMolinari, D., & Scorzini, A. R. (2017). On the Influence of Input Data Quality to Flood Damage Estimation: The Performance of the INSYDE Model. Water, 9(9), 688. https://doi.org/10.3390/w9090688