Article

Runoff Effect Evaluation of LID through SWMM in Typical Mountainous, Low-Lying Urban Areas: A Case Study in China

1
College of Water Conservancy and Hydropower, Hebei University of Engineering, Handan 056021, China
2
First Planning Department, Jiangsu Surveying and Design Institute of Water Resources Co., Ltd., Yangzhou 225127, China
3
Rural Economy & Regional Development, China International Engineering Consulting Corporation, Beijing 100048, China
4
State Key Laboratory of Simulation and Regulation of Water Cycle in River Basin, Beijing 100038, China
*
Author to whom correspondence should be addressed.
Water 2017, 9(6), 439; https://doi.org/10.3390/w9060439
Submission received: 30 June 2016 / Revised: 5 June 2017 / Accepted: 8 June 2017 / Published: 19 June 2017

Abstract

:
Urban flooding occurs frequently in many regions of China. To reduce the losses caused by urban flooding, sponge city (SPC) and low-impact development (LID) have been carried out in many Chinese cities. However, urban flooding is influenced by various factors, such as climate, land cover characteristics and nearby river networks, so it is necessary to evaluate the effectiveness of LID measures. In this study, the Storm Water Management Model (SWMM) was adopted to simulate historical urban storm processes in the mountainous Fragrance Hills region of Beijing, China. Subsequently, numerical simulations were performed to evaluate how various LID measures (concave greenbelt, permeable pavement, bio-retention, vegetative swales, and comprehensive measures) influenced urban runoff reduction. The results showed that the LID measures are effective in controlling the surface runoff of the storm events with return periods shorter than five years, in particular, for one-year events. Furthermore, the effectiveness on traffic congestion mitigation of several LID measures (concave greenbelt, vegetative swales, and comprehensive measures) was evaluated. However, the effective return periods of storm events are shorter than two years if the effectiveness on traffic congestion relief is considered. In all evaluated aspects, comprehensive measures and concave greenbelts are the most effective, and vegetative swale is the least effective. This indicated that LID measures are less effective for removing ponding from most storm events in a mountainous, low-lying and backward pipeline infrastructure region with pressures from interval flooding and urban waterlogging. The engineering measures including water conservancy projects and pipeline infrastructure construction combined with the non-engineering measures were suggested to effectively control severe urban storms.

1. Introduction

High-speed urbanization has caused rapid changes to underlying surfaces, resulting in fundamental changes in urban runoff processes. Due to these changes, urban flooding frequently occurs, which is widely influenced by climate change. This has been more distinctly reported as a “sea view in the city” in recent years in China. Urban waterlogging brings a series of socio-economic losses such as traffic paralysis, loss of property, and even human casualties. The effective control of urban waterlogging is both crucial and difficult to manage for urban stormwater runoff. The evaluations of the effectiveness of the various management measures are more important.
Various runoff reduction measures have been implemented, including LID, and widely applied throughout the world [1]. LID is an innovative urban stormwater management system that was jointly introduced by the stormwater management experts from Programs and Planning Division of Prince George’s County Department of Environmental Resources, during the mid-1990s [2]. Since the end of the 1990s, with the promotion of LID by the United States Environmental Protection Agency (USEPA), it has been generally recognized and adopted by countries all over the world. A series of related stormwater management regulations have been formulated in Florida, Chicago, and other locales, and remarkable achievements have been made [3,4]. The idea behind LID is to depress the negative influence of water quantity as well as the quality of the runoff process caused by urbanization to allow regional runoff processes to return to a natural undeveloped state to the largest degree possible [2]. Its meaning has been extended in many countries or regions that have similar ideas regarding stormwater management, such as Water-Sensitive Urban Design (WSUD) in Australia, Sustainable Urban Drainage Systems (SUDS) in the UK, and the natural drainage systems in Seattle [1,5,6,7]. Based on these concepts, SPC for urban stormwater management was proposed in China. The concept of SPC is that the city is similar to a block of sponge that can absorb water in the wet period and release water during a drought, aiming to relieve the waterlogging and water shortage situation in cities. It was first mentioned by the Chinese President in 2013 and proposed in 2014. SPC is a comprehensive concept, focusing on not only the source control (as LID) but also the process control and drainage management. In 2015, SPC construction was proposed, and sixteen cities were selected as the pilot cities in China. The aim of SPC construction is the detention, onsite storage, infiltration, filtration, reuse, and drainage of stormwater [8,9].
The two main purposes of the series of LID measures are controlling the quantity of storm runoff and improving its quality. Regarding the former, LID measures primarily reduce the flood peak and volume by increasing the infiltration and onsite storage. Only the reduction of surface runoff quantity was involved in this study, and the relevant practice measures mainly included permeable pavements, bio-retention facilities, green roofs, and swale systems [10,11,12], measures that have been commonly applied. The permeable pavement is mainly composed of artificial materials (such as porous asphalt and permeable tile) with improvements to the water permeability, and the runoff is reduced by increasing the rainfall infiltration through these measures. Related studies have shown that the runoff reduction has reached 90% in some regions that have applied this measure [13]. However, the reduction percentage has been found to vary under different rainfall conditions in different regions [1]. Bio-retention facility systems are systems that use plants, soil, and micro-flora for storage infiltration and to purify rainwater runoff. These systems were originally designed for rainwater purification applications [2,3]. However, Davis et al. [14] noted that runoff processes can also be reduced by increasing the soil infiltration and evapotranspiration since these measures are close to the natural state. A green roof system is an earlier applied LID measure [15] that mainly cuts runoff by planting vegetation on high-quality roofs. Studies have shown that these measures were able to significantly reduce runoff, and the runoff reduction percentage reached between 29% and 100% in some regions [16]. Swale systems, which are different from the three aforementioned systems, are the measures that have demonstrated effectiveness in runoff control, not only at the source but also during runoff processes, especially in terms of reducing the flood velocity [2,12]. Cheng et al. [17] examined the impacts of concave greenbelts’ design parameters on storm runoffs. The results showed that when the concave greenbelt area ratio was between 10% and 30% and the concave depth ranged from 0.1 m to 0.3 m, the return periods of the designed rainfall would be one year, three years, and five years.
Although the global applications of LID have been relatively successful, the scales of the areas where it is applied are normally units or are experimental, and few have focused on the basin or region scales [18]. The reason for this is that the LID was originally designed as a micro-scale measure for small urban areas [2,3]. In addition, the areas where LID has been applied have been mainly located in flat, highly urban areas, including parks in downtown areas [19] and city blocks [20]; few have focused on mountain cities [21]. The main problem of stormwater management in the urbanization plain areas is local waterlogging, but mountain cities can also suffer floods of the upper reaches or interval floods. China has a varied topography with great differences in climate, and it is also a developing and urbanizing country. These factors make for more complex underlying surface situations, and regional urban waterlogging usually has different causes in China. However, a boom of LID construction has recently occurred in China after advancing SPC construction guidance [22,23,24]. It seems that LID measures are universal for urban water problems. In fact, the effects of different LID measures at different rainfall intensities should be evaluated in different regions. The related evaluation should include the most suitable LID measure, its more economic size, its effective rainfall intensity, etc.
Fragrance Hills, located in Beijing, China, was selected as the mountainous test area in this study. The stormwater management in this region includes not only waterlogging caused by unitization and poor drainage but also the threat of interval flash floods. The simulated effectiveness of surface runoff reduction with four different LID measures (concave greenbelt, permeable pavement, bio-retention, vegetative swale), along with their composed measures through SWMM, were evaluated and compared. This study focused on: (1) model construction and validation for regions with no observed discharge; (2) effect evaluation of different LID measures in a semi-natural-semi-urbanized mountainous area in rain absorption and flood peak reduction; and (3) effect evaluation of different LID measures in improving regional traffic jams under different rainfall conditions. This study comprehensively compared the differences of regional water-logging and traffic jams after the implementation of LID measures through SWMM. The results can provide technical support for optimizing and accelerating the construction of regional drainage pipe networks. This study can also provide integrated technical support and decision-making references for optimizing investment in local SPC construction and improvements in the rational planning of SPC implementation schemes.

2. Study Area and Data Collection

2.1. Study Area

The area in this study is located at the foot of the eastern side of Fragrance Hills, which is a closed mountain catchment (hereafter, FHC). The total area is 11.75 km2, the highest elevation is 667 m, and the lowest elevation is 70 m. It is mainly a mountainous area that belongs to Fragrant Hill Town, Haidian District of Beijing, China. Its administrative divisions and geographical location are shown in Figure 1.
The FHC is in a warm, semi-humid zone of the East Asia monsoon region, with a significant continental monsoon climate and a large annual temperature range. The average annual temperature is 11.7 °C. According to statistics, the annual mean precipitation of the Haidian District from 1956 to 2010 was 525.4 mm, and it was 614.3 mm during normal years and 336.4 mm during dry years. The annual precipitation distribution has been extremely uneven, with a maximum of 1115.7 mm (1956), and a minimum of only 281.4 mm (1965). The precipitation during the wet years can be almost four times more than that during the dry years, with an extremely uneven distribution within the year. In other words, the precipitation during the flood season accounts for over 80% of the total year’s precipitation. The groundwater recharge mainly depends on precipitation and river infiltration, and the ground runoff flows from the northwest to southeast in the ground.

2.2. Precipitation Data

2.2.1. Observed Precipitation Data

The observed precipitation processes were based on the gauge monitoring in the FHC and supplied by Beijing Water Authority (BWA). Three typical precipitation processes were selected for model calibration and validation. The storm of 21 July 2012 (hereafter, “7.21” storm) was a typical storm event in Beijing beginning at 12:20 on 21 July and ending at approximately 5:00 on 22 July. Its total precipitation was approximately 264.5 mm in less than 17 h. This storm had significant effects and 1.9 million people suffered from the storm, of whom at least 79 died in Beijing. The storm of 20 July 2016 (hereafter “7.20” storm) was a typical moderate rain event and the storm of 7 September 2016 (hereafter, “9.07” storm) was a light event, compared with “7.21”. The characteristics of these rain events are listed in Table 1.

2.2.2. Designed Precipitation Processes

In this study, typical precipitation processes of one-year, two-year, five-year, and ten-year return periods (five-minute precipitation processes, which lasted 24 h in total) were selected as the storm inputs for LID effectiveness evaluation. They were calculated according to the local hydrologic handbook, technical code and standard [25,26,27], and the related processes are shown in Supplementary Material S1. The precipitation processes with different return periods are shown in Figure 2.

2.3. Drainage Pipeline Data

The drainage pipe networks have not been constructed in the FHC. Only one drainage pipeline is laid beneath Fragrant Hill South Road; the pipeline length is 438 m and the diameter is between 1 m and 2 m. Due to the large topographic slope, overland flow frequently occurs in the mountainous areas, moves along the roads or pavements toward the low-lying areas, and flows into canals or rivers. Thus, the roads as the drainage channels are the main part of the drainage system in this study (Figure 3a).

2.4. Elevation Data and Sub-Catchment Division

The original elevation data include Digital Topographic Map (DTM) 1:2000 and Remote Sensing Images (RSI) 1:2000, both supplied by Beijing Institute of Surveying and Mapping (BISM). The digital elevation model (DEM) was compiled based on DTM. RSI, DEM and the underlying surface properties were applied for the sub-catchment division.
The principles of the sub-catchment division are the elevation, the uniformity of underlying surface, and the nearest drainage in this study. First, the entire region was roughly divided into three large sub-catchments (areas with red boundaries in Figure 3a) based on the DEM. Second, the large sub-catchments were further divided according to the drainage directions and boundaries (rivers, mountain gullies and roads in Figure 3a), which were both identified by the RSI. Third, the region was divided into small sub-catchments based on the types of underlying surfaces identified by the RSI, historical investigations data and the related research [28]. Finally, based on the balance between simulation precision and elapsed time of computer, the entire modeling region was divided into 72 sub-catchments, and the confluence path and confluence nodes were also built (Figure 3b).

2.5. Investigation, Survey and Interview

The supplementary investigation, survey and interview (ISI for short) were implemented. Because the observed discharge data are absent in the FHC, five positions (Figure 4) were selected according to the flood drainage routes and the waterlogging situation in the low-lying sub-catchments: (1) at the southeast gate of the Fragrant Hill Park and in the upper reaches of the entire valley, and the sub-catchment area mainly covered the Fragrant Hill Hotel and the upper sub-catchment areas; (2) at the intersection between the upper sector of Fragrant Hill and Zhenghuangqicun Roads, below the southeast sections of Fragrant Hill Park; the sub-catchment area mainly covered Fragrant Hill Park, as well as both sides of Fragrant Hill Road; (3) at the upper end of Fragrant Hill Valley, and the basin covered the entire southern sub-catchment area; (4) at the portal of the Fragrant Hill Road Tunnel; and (5) in the northern sub-catchment area at the exit of the Beihan River.
The flood marks of typical runoff processes (“7.21”, “7.20” and “9.07”) in each position were selected as the key factor of ISI and the corresponding accurate values were collected through detailed and repeated ISI. Because the roads functioned as drainage channels, the height of flood marks was equal to the maximum runoff depth (MRD) in this study. The ISI MRD (hereafter, MRDI) of different runoff processes in each position were collected and selected as the calibration and validation variable.
The peak time (PT) is an important characteristic of the runoff processes and the approximate values of the typical processes in each position were collected through interview (hereafter, PTI). PTI was selected as the reference variable for model calibration and validation.
In addition, the types of underlying surface and the geometric characteristics of sub-catchments were also investigated, surveyed and applied for setting the initial values of the model parameters and the correct sub-catchment division.

3. Methodology

3.1. Hydrological Model Selection

There are many types of methods for evaluating the effects of LID measures; the most simple and accurate method is using models. The relevant models include the Long-Term Hydrologic Impact Assessment-Low Impact Development (L-THIA-LID) model [29]; the improved SCS-CN model [30,31]; the System for Urban Storm-water Treatment and Analysis Integration (SUSTAIN) model [32]; and the SWMM [21,33,34,35]. In 2016, DHI-China developed the Sponge City Aided Design (SCAD) module and added it to the Mike Urban model directed against the requirements of the Chinese market [36].
Among these models, the SWMM is widely applied in surface runoff simulations. It is a physically based simulation model in which the storm runoff quantity can be simulated based on the physical processes of surface runoff, infiltration, surface ponding and flow routing. It has a flexible structure and an open code. SWMM has been updated several times, and its functions have been improved significantly [37]. Compared with other models, SWMM has a better simulation effect [38], and it has been widely used in the evaluation and forecasting of the surface runoff process of storm floods by relevant scholars. Marsalek et al. [33] conducted in-depth studies on 12 storm events in three typical small watersheds in the United States and found that the SWMM simulation results fit well with the measured runoff results. Daeryong et al. [34] established a SWMM model for Ulsan, Korea, and analyzed the required scales and storage ranges of three types of storage ponds (with return periods of 2 years, 10 years, and 100 years). Furthermore, they assessed and compared the construction and land costs, as well as the benefits of these ponds. It was found that the storage pond with a return period of 2 years was the most profitable. Villarreal et al. [35] simulated the effectiveness after stormwater and flood management measures were applied in a central urban area, and the rainfall return periods were 0.5, 2, 5, and 10 years.
Within LID simulation, SWMM is one of the earliest hydrological models to be supplemented with an LID module [2]. The LID module of SWMM provides five single measures for storm runoff control. The hydrological process and its key factors, such as regional surface runoff and peak discharge, can be simulated by applying the LID module combined with the hydraulic module. Hence, the runoff reduction effect of LID can be evaluated through these key factors. The SWMM for different LID measures has also been extensively used in different regions and countries, especially in China. Using SWMM, Qin et al. [39] evaluated the effect of LID measures (including the LID compositions) under different rainfall types in the Guangming New District of Shenzhen, and Hu et al. [40] analyzed the implementation effect of LIDs for municipal roads in this region. Jia et al. [19] evaluated the implementation effect of LID-BMPs for Beijing Olympic Park. Li et al. [41] performed a simulation analysis on a rainwater garden of a residential area in Xi’an. Wang et al. [42] assessed the drainage pipeline reconstruction and LID planning in a residential zone of Beijing as well. In addition, relevant research has shown that SWMM could be useful in areas including plains [19], mountains [12,21] and karsts [43].
Because the SWMM was well applied in both storm runoff simulations and LID evaluations and was appropriate for different types of areas, it was selected as the simulation model. SWMM 5.0.022 released in 2011 [12,44] was selected in this study.

3.2. Initial Value of Model Parameter

The initial values of the sensitive parameters are crucial for model simulation. The related studies [45,46] indicated that the characteristic width (W) of the region, impervious coefficient, Manning coefficient (n) and depression storage (D) of the impervious and pervious areas are sensitive parameters in SWMM.
W is determined by the shape and size of the sub-catchment. Because the study area is large and its topography and underlying surface are complex, the flow length is difficult to determine, i.e., the calculation method based on flow length is inappropriate in this study. Therefore, W was calculated according to Equation (1) [46], where K is the shape correction coefficient and A is the area of the sub-catchment. K is crucial for calculating W and was calibrated based on the measured geometric characteristics. According to the shape of the sub-catchments in the FHC (Figure 3b), the initial value of K was assigned as 0.9 in this study. A and W of each sub-catchment were listed in Table S1.
W = K × A ( 0.2 < K < 5 )
The impervious coefficient can directly influence the surface runoff quantity. In this study, the impervious areas of each sub-catchment were calculated based on the RSI and investigation results, and then the corresponding impervious coefficients were obtained (Table 2).
n and D of the impervious and pervious areas are influenced by the properties of the underlying surface, and the setting of initial values are all empirical. Because the roads were generalized as channels and the FHC is a shrub area [28], the initial n of impervious areas (channels) were set as 0.017, and the initial n of pervious areas were set as 0.4 (Table 2), according to the manual of SWMM 5.0 [46]. In this study, D of the impervious and pervious areas were set as 2 and 7 mm, respectively (Table 2), based on the SWMM manual, previous studies [12] and characteristics of the FHC. These sensitive parameters were chosen as the optimization parameters for the model calibration and validation.
The model supplies three methods for infiltration processes, and the Horton model was selected in this study. The infiltration (f) was calculated as Equation (2) [44], where fc is the maximum infiltration rate, f0 is the minimum infiltration rate, and k is the attenuation coefficient.
f = f c + ( f 0 f c ) e k t
Although fc and f0 are less sensitive compared to the above parameters, they are quite critical in infiltration calculation. The soil in the FHC is mainly composed of loamy soil and cinnamon soil, and related research supplied the plant species of study area [28]. Due to these properties, the initial values of fc in each sub-catchment, the initial k and the initial f0 were set according to the SWMM manual (Table 3). The other parameters of SWMM such as cross-section size, the characteristics of the drainage pipeline (channel), and slope, were calculated based on the DEM, RSI and investigation data (Table S1).

3.3. Model Calibration and Validation

Because the discharge data are absent in the FHC, the catchment model was calibrated and validated based on the agreement between the simulated MRD (hereafter, MRDs) and MRDI in each ISI position. The absolute value of relative error (|RE|) was chosen as the measure for evaluating the agreement, described as Equation (3). The agreement between the simulated PT (hereafter, PTs) and PTI in each position was chosen as the reference for model calibration and validation.
| R E | = | ( M R D s M R D I ) / M R D I | × 100 %
The “7.21” storm was chosen for the model calibration and its simulated runoff processes in different positons are shown in Figure 5. The optimal parameters values in each sub-catchment were finally selected (Table 4) according to the minimum |RE| (Table 5) in each ISI position. It was shown that MRDs was similar to MRDI in most of the positions and the related average |RE| was only 7.90% (Table 5) and each PTs was close to PTI (Table 6).
The “7.20” and “9.07” storms were chosen for model validation and their simulated runoff processes are shown in Figure 6 and Figure 7, respectively. It was illustrated that none of the |RE| were larger than 10% and the average value was 7.64% and 2.88%, respectively (Table 5). The values of PTs were all closed to the corresponding PTI (Table 6).
The calibration and validation results indicated that the model simulation results were consistent with the investigation data, according to the national standard [47]. The model can be feasible for flood simulation under rainfall with different return periods.

3.4. LID Selection and Design Scenarios

There are different LID components in SWMM 5.0.022, of which concave greenbelts (rain gardens), permeable pavement, bio-retention cells, and vegetative swales were chosen for the simulation according to the suggestion of some relevant authority research [48] and the local technical code [27]. These single LIDs and their composition measures were designed as different scenarios. The parameters of each LID measure were assigned according to the underlying surface types of each sub-catchment in the FHC and the local technical regulation [27]. The absence of LID was designed as another scenario for comparison.

3.4.1. Concave Greenbelt Scenario

Concave greenbelts were set in 20 different typical residential communities (locating in different sub-catchments). The designed concave depth was 10 cm and the concave ratios were 50%, 70% and 90% as three typical sub-scenarios. The other related parameters are listed in Table S2.

3.4.2. Permeable Pavement Scenario

Permeable pavements were set in the roads of 20 residential communities (the same with the concave greenbelts scenario) and in the municipal sidewalks of 30 sub-catchments. The permeable pavement ratio in municipal sidewalks was set as 100% and that in the roads of residential community were set as 50%, 60% and 70%, respectively, also as three typical sub-scenarios. The thickness of the surface layer was 60 mm with 0.2 porosity; the thickness of the entire layer was 200 mm with 0.75 porosity; and the infiltration rate was assigned as 0.1 mm/s according to the local technical regulation [27]. The other related parameters were listed in Table S3 (residential community roads) and Table S4 (municipal sidewalks).

3.4.3. Bio-Retention Cell Scenario

Bio-retention cells were set in two typical residential communities (located in S21 and S69 sub-catchment). The depth of the surface storage was 150 mm, with 90% vegetation coverage; the soil thickness was 500 mm, with 0.5 porosity. The field capacity was 0.35 and the wilting point was 0.187. The conductivity gradient of the bio-retention cell was 10, with 36 mm/h hydraulic conductivity and the height of the gravel layer was 400 mm with 210 mm suction of the soil moisture. The other related parameters were listed in Table S5.

3.4.4. Vegetative Swale Scenario

Five vegetative swales were set on the sides of Fragrant Hill Road (Figure 4), because the slope of this road is smaller in the FHC and its ponding situation was severe, of which the length was 213.43 m, 313.86 m, 63.41 m, 130.63 m and 275.92 m, respectively. The total swale length was more than 997 m and the total storage volume was approximately 157 m3. All the sections were U shaped with 0.1 m storage depth. The average suction of soil moisture along the capillary was 169.9 mm, the hydraulic conductivity of saturated soil moisture was 0.6138 mm/h, and the initial loss of soil moisture loss (difference value between the soil porosity and initial soil moisture) was 39.25 mm. The storage areas of different water depth in each swale were listed in Table S6.

3.4.5. Comprehensive Measures Scenario

The comprehensive measures were set as the combination of a concave greenbelt scenario with 50% concave ratio, permeable pavement scenario (of which the ratio was 70% in residential community roads and 100% in municipal sidewalks), a bio-retention cell scenario and a vegetative swale scenario.

3.4.6. Basic Scenario

There are three outfalls in the FHC (marked as O1, O2 and O3 in Figure 4), because “O1” is the outfall nearest Xiangquan Roundabout and in the low-lying area, the runoff processes of no LID at O1 outfall were selected as the base case for comparison.
The Permeable pavements and bio-retention cells were both applied in the part of the FHC and evaluating their impacts on the overall study area was inappropriate. Therefore, the runoff processes of no LID in two typical sub-catchments were designed as the base case for evaluating and comparing the effectiveness of these two measures. S38 with a larger impervious area was selected for permeable pavement scenario and S69 close to Xiangquan Roundabout was selected for the other one (Figure 4).

4. Results and Discussion

The different runoff processes in different scenarios were simulated through the validation model, while the above designed precipitation processes (Figure 2) were input. It is evident that the reduction of runoff volume and peak discharge is crucial to the effectiveness evaluation of LID. However, traffic congestion is also an apparent problem influenced by urban flooding. The FHC is located on the top of the Xiangquan Roundabout, which is an important western transportation hub of the Haidian District. This hub is in the low-lying zone and has frequently encountered waterlogging and flooding from the FHC in recent years. Thus, the effectiveness of relieving traffic congestion through the LID measure application was also involved in this study.

4.1. Results in Basic Scenario

The runoff processes under different return periods of O1 outfall (Figure 8), S38 and S69 were simulated in the model. Their corresponding runoff depth and the MRDs of O1 are listed in Table 7. Table 7 shows that the runoff increased sharply when the return period increased: the runoff depth is only approximately 3 mm in the one-year event but more than 80.0 mm in the ten-year event. The “O1” runoff processes of no LID (Figure 8) shows that the runoff volume initially raised slowly, then after 16:30 raised sharply, and then declined quickly. These trends of runoff processes are consistent with those of the corresponding rainfall processes (Figure 2). In addition, the PTs of runoff processes are all later than those of the rainfall processes, which agrees with the law of surface runoff and drainage.
Based on these results in basic scenarios, the evaluation and comparison of different scenarios (LID measures) in the above aspects were studied and illustrated as follows.

4.2. Runoff Volume Reduction

The percentages of runoff reduction in different LID scenarios were calculated and analyzed for evaluating their runoff reduction effectiveness (Table 8). Among all of the single measures, concave greenbelt is the most effective in runoff reduction, especially when the return period of precipitation is shorter than two years. The runoff reduction percentages of concave greenbelt ranged from approximately 5.2% to 57.3% in all types of rainfall events and the reduction percentages are much higher (20.5–57.3%) in the one-year and two-year rainfall events. It is notable that when the concave ratio is 50%, the total runoff can be reduced to 52.5% for the one-year rainfall event, proving the high effectiveness of concave greenbelts in flood mitigation. By contrast, when the concave ratio was 70% or 90%, the reduction percentage increased slightly in comparison with that of the 50% ratio, within a range of 1.5–5.0% in different types of rainfall. That is, the concave ratio of 50% is better for stormwater detention. Therefore, there is no need to expand the facility scale.
Vegetative swale is the least significant among all the single measures, and its entire runoff reduction percentages at the “O1” outlet are only 0.3–3.0%. There are two reasons for this: the first reason is the limits of the application area and frequency in mountain areas (only five lengths of one road applied this measure in the whole region); the other reason is the fast flooding of mountain floods. These results indicated that the vegetative swale is not suitable in mountains areas, although it is effective in controlling runoff in plain areas [49,50,51].
In the permeable pavement scenario, the runoff reduction percentage of S38 ranged from 7.3% to 12.2% in the one-year rainfall event and from 1.9% to 7.0% in the ten-year rainfall event when the permeable pavement ratio of the roads ranged from 50% to 70% (Table 8). This result indicated 70% permeable pavement is much more effective than 50% permeable pavement when it was applied in the roads of a typical residential community.
In the bio-retention measure scenario, Table 8 illustrated that the total runoff of S69 was reduced significantly to 10.2–12.1%. It is remarkable that when the return period of rainfall increased, the decrease trend of runoff reduction percentage was smoother than that in the other scenarios, which implies that this measure has a better reduction effectiveness in various rainfall intensities.
In the comprehensive measures scenario, the percentages of runoff reduction ranged from 15.4% to 57.3% The results compared with the other scenarios demonstrated that the reduction effectiveness (57.3%, the maximum one) is equal to that of 90% concave greenbelt in the one-year rainfall event and the comprehensive utilization of various measures can further improve the effectiveness in the other rainfall events. It is notable that the effectiveness in the comprehensive measures scenario is not equivalent to the summation of each single measure. A possible reason for this phenomenon is that applying various measures changes the state and process of the runoff in part of the study area, which likely offsets some of the overall effectiveness. As a result, the comprehensive utilization of various measures is less effective than the total effectiveness of various measures.
Overall, all the above LID measures can reduce the runoff volume to a certain magnitude in the rainfall events with the return periods shorter than five years and they are less effective in the precipitation events in the return periods longer than five years. The concave greenbelt and comprehensive measures were more effective, while the vegetative swale was the least effective measure. Permeable pavement can have a certain effect in typical sub-catchment and the bio-retention has better reduction effectiveness for a variety of rainfall intensities in the typical catchment. The effectiveness of runoff reduction in all of the scenarios decreased as the rainfall intensity increased.

4.3. Peak Discharge Reduction

The different runoff processes of “O1” in the concave greenbelt scenario (with 50% ratio), vegetative swale scenario and comprehensive measures scenario were simulated (Figure 8) and the percentage of MRD reduction was chosen as the evaluating variable. Then, the effectiveness of these three LID measures on peak discharge reduction was calculated (Table 9). Bio-retention and permeable pavement were not involved because they were only applied in several typical sub-catchments.
Figure 8 and Table 9 demonstrate that the comprehensive measures are the most significant in the effectiveness of peak discharge in all rainfall events. By contrast, vegetative swale is the least significant. The concave greenbelt is more significant in the one-year and two-year rainfall events. The comprehensive measures and concave greenbelt are particularly effective on the peak discharge reduction in the one-year rainfall event, and the reduction percentage is 55.7% and 53.9%, respectively. However, the vegetative swale plays a poor role in this aspect, and the related reduction ratio is only 0.1% in the five-year and ten-year rainfall events.
There are several reasons behind these results: the first and foremost is the limit of the size and numbers of vegetative swales that influenced the water storage capacity, resulting in the ineffectiveness on peak discharge reduction in the study area; the second reason is that the coupling reaction of local waterlogging and the interval flood in low-lying areas would be more prominent when the storm intensity increased. This explanation is concordant with the analysis of the runoff volume reduction.

4.4. Traffic Congestion Relief

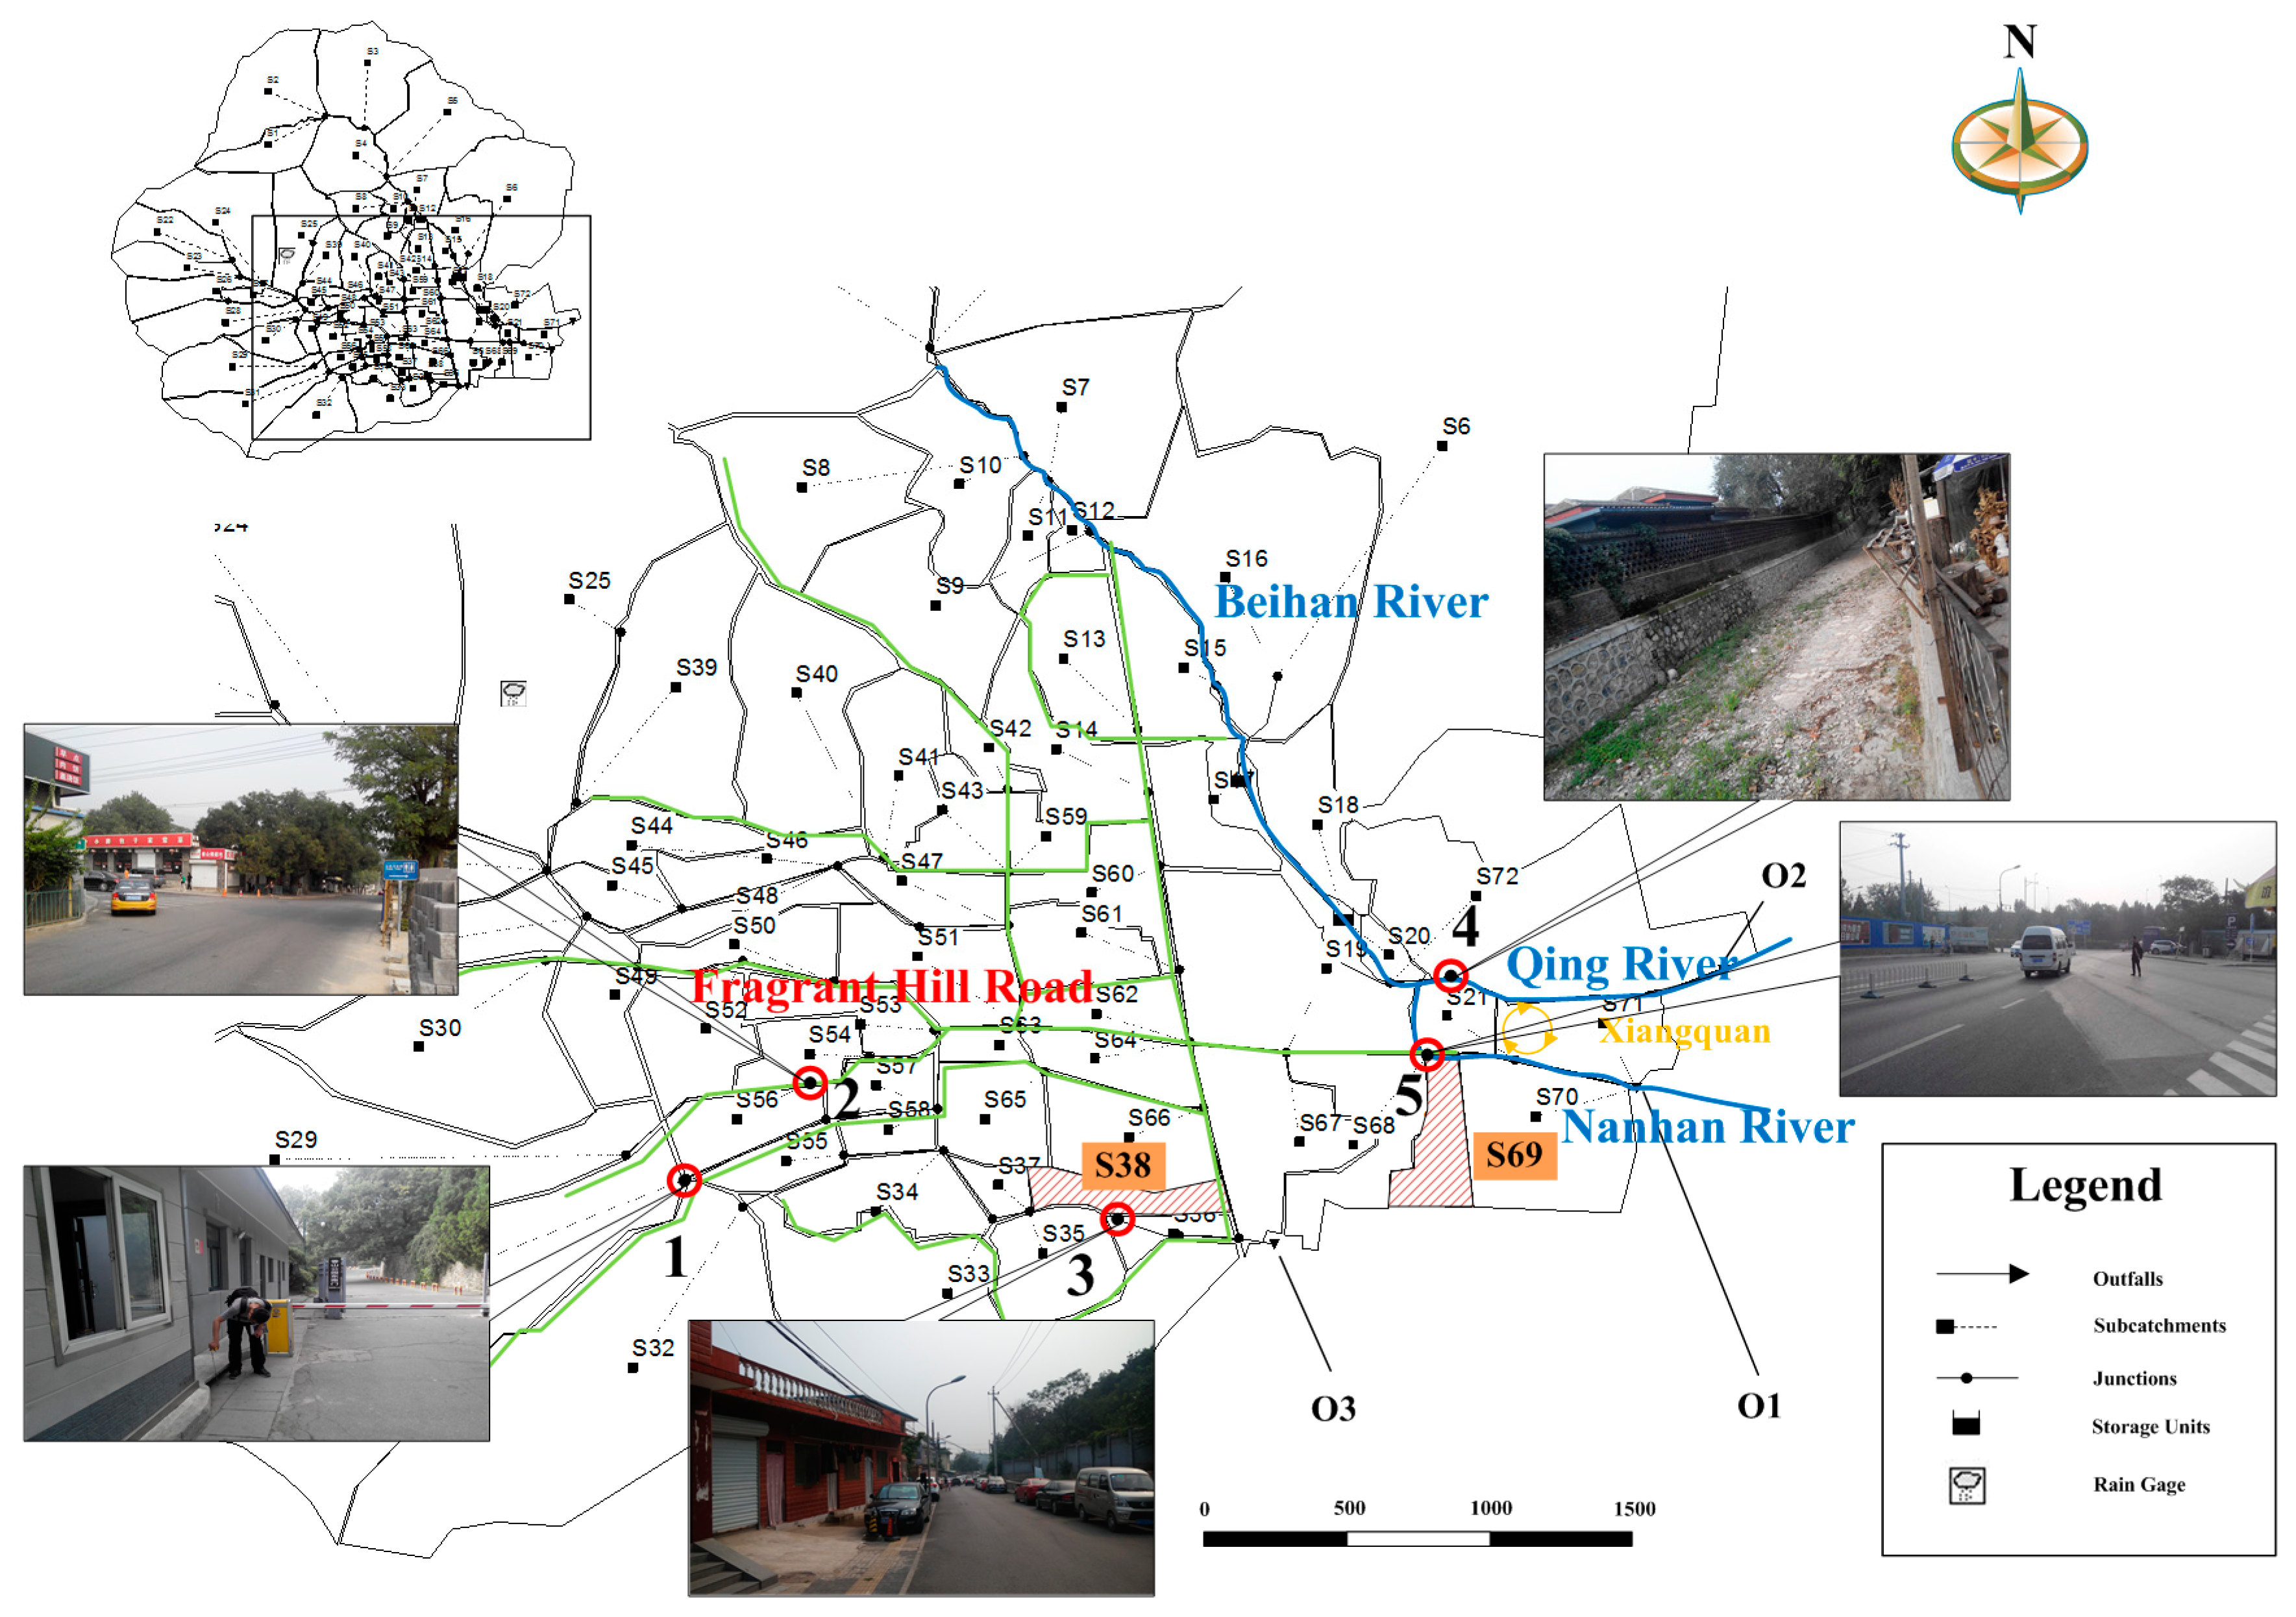
The ponding situation of “O1” is paramount to relieve the traffic congestion on the Xiangquan Roundabout during storms, due to the station of O1 outfall (Figure 4). Therefore, the duration and depth of ponding were both involved in this section. The critical value of the ponding depth was assigned as 15 cm for the drainage design of municipal roads, considering the limit of the ponding height for the vehicles. Thus, the durations of ponding depth over 15 cm at O1 in different LID scenarios and the basic scenario were calculated (Table 10) and can reflect different traffic situations on the Xiangquan Roundabout.
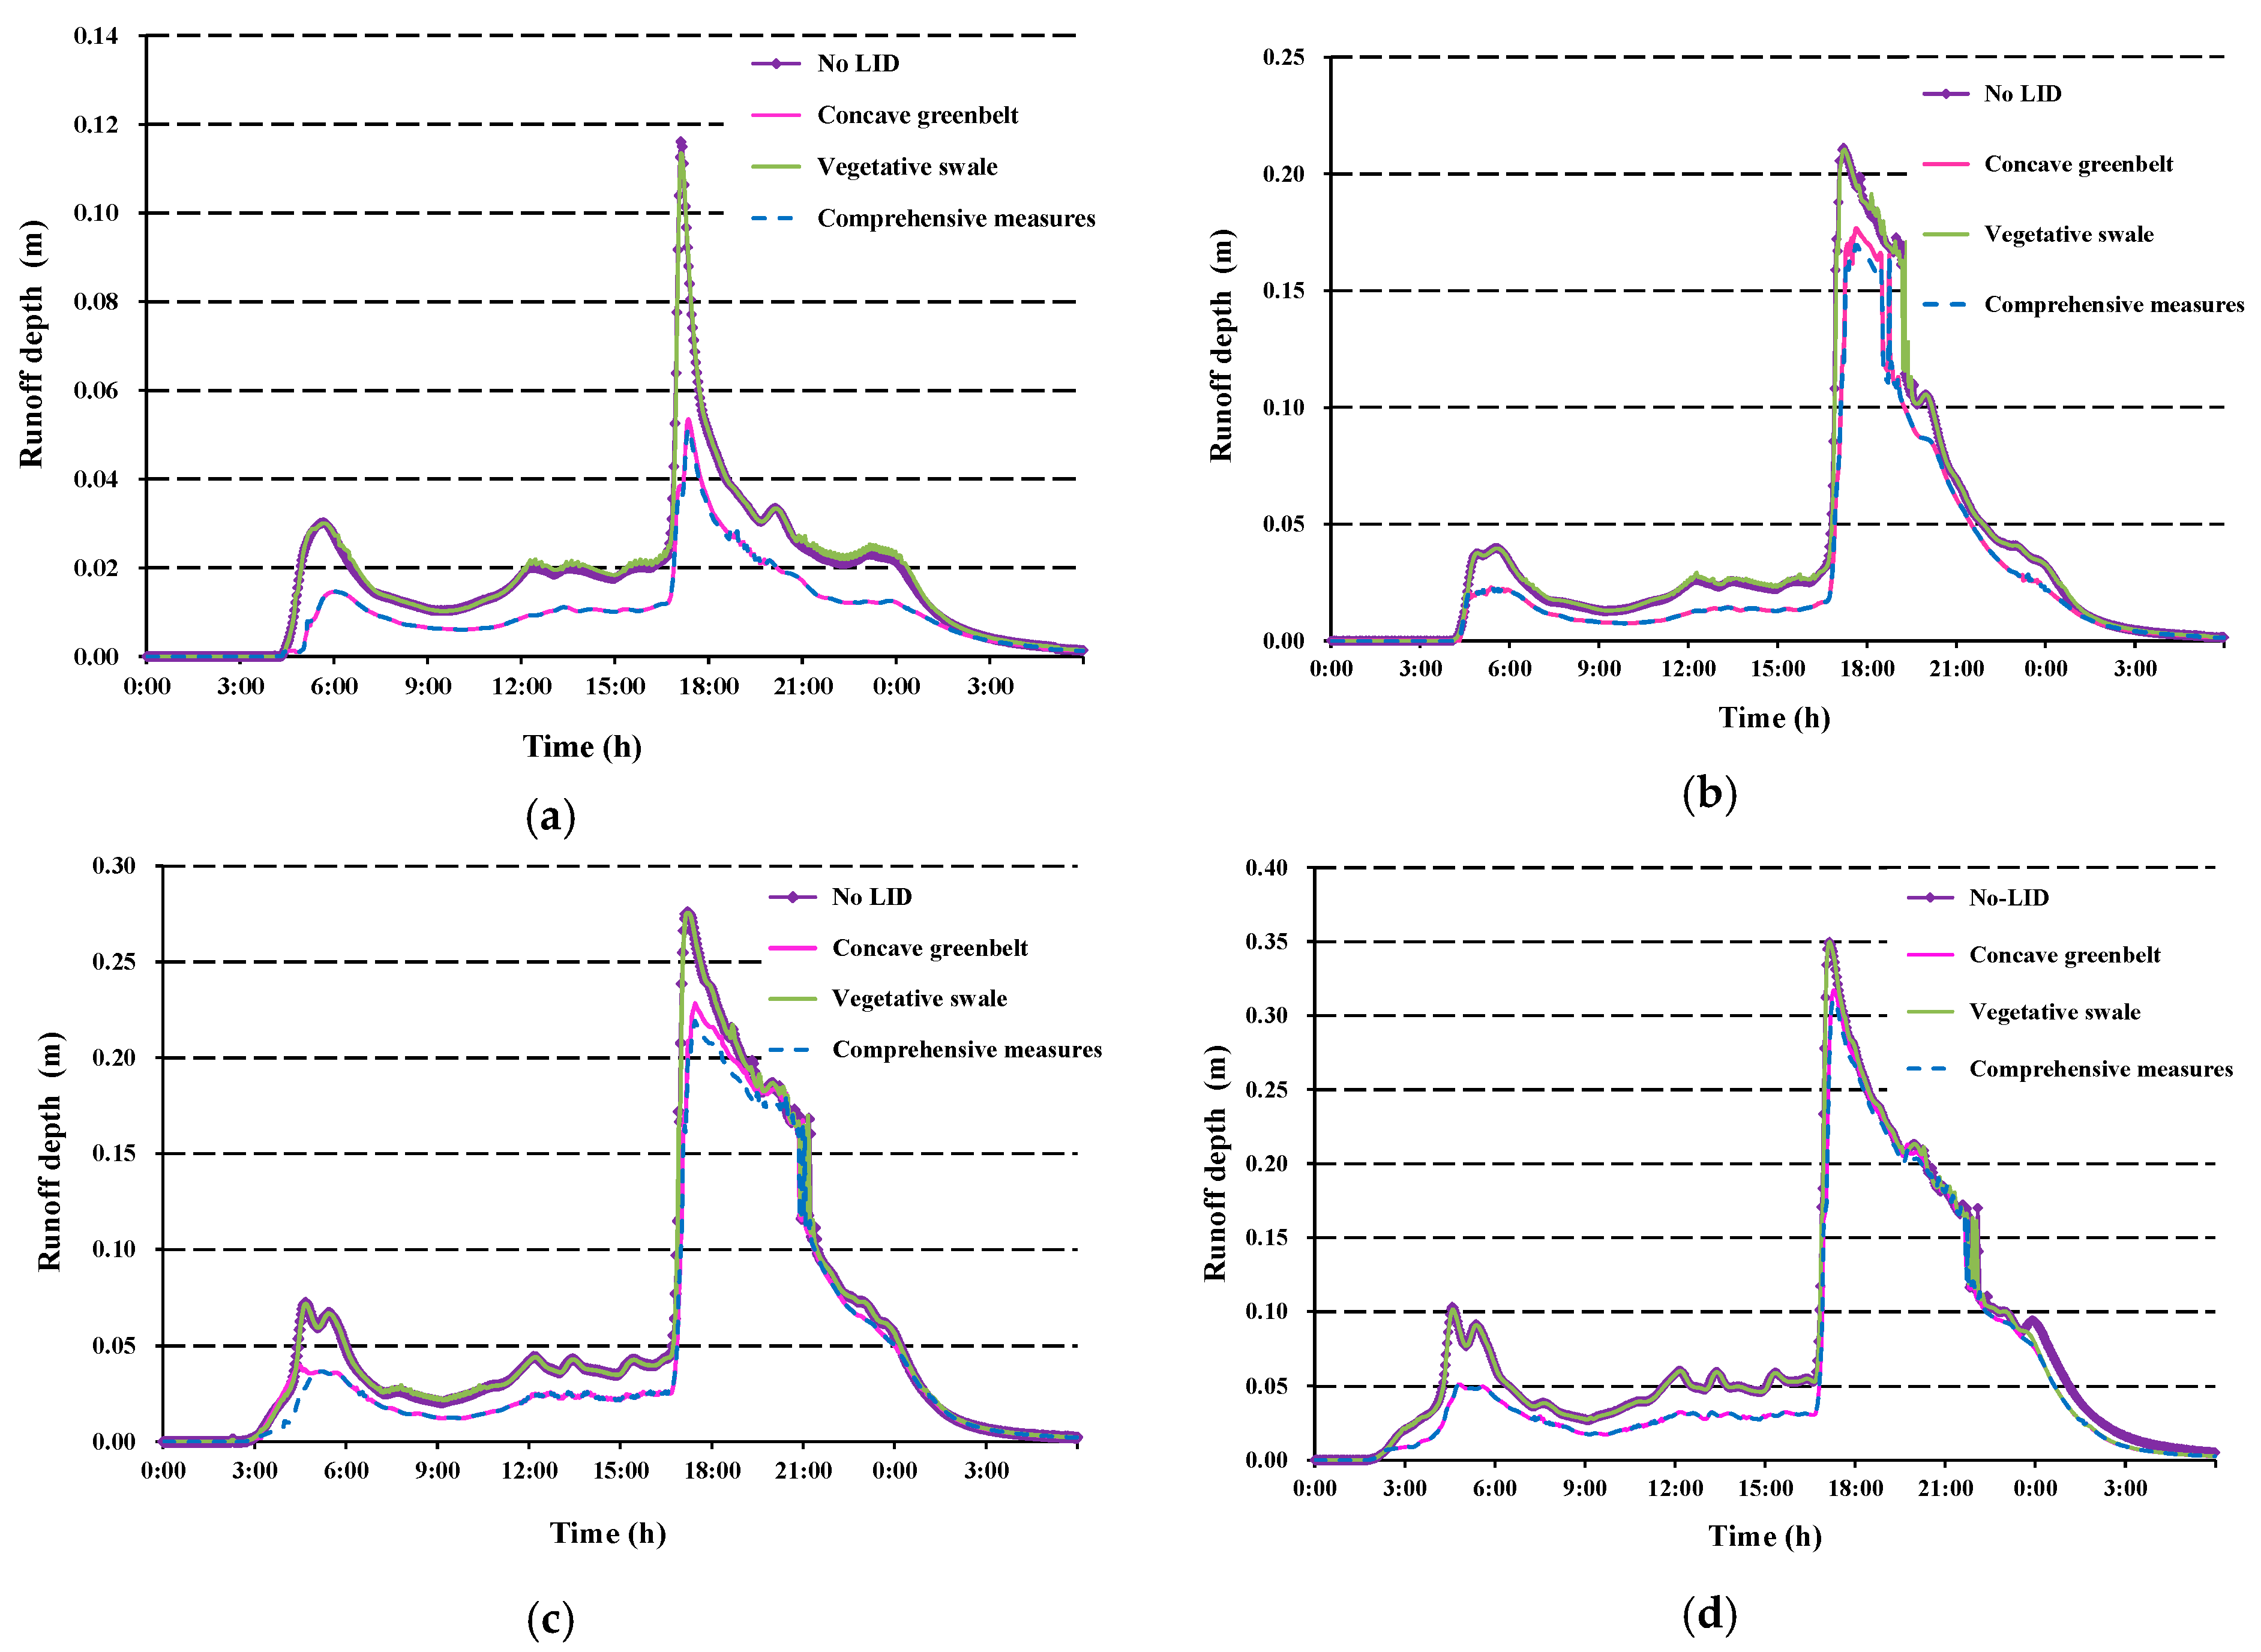
 Table 10 and Figure 8 illustrate that the frequency of traffic congestion resulting from flooding is seldom in the one-year event in all the scenarios; the situation of traffic congestion becomes more severe with the growing of the rainfall return periods. The shortening percentage in different LID scenarios (Table 11) were calculated based on the duration in basic scenario, for the convenience of evaluation and comparison.
Table 10 and Table 11 indicate that the concave greenbelt and comprehensive measures are both effective in relieving the traffic congestion in all of the rainfall events, and the least percentage is 29.1%. In the two-year rainfall event, the corresponding effectiveness for both scenarios was significant. These two durations of ponding depth over 15 cm are 48 min and 30 min, respectively (both less than one hour), and the corresponding shortening percentage is 51.0% and 69.4%, respectively. The result indicated only by these percentages is concordant with evaluation results in the other aspects.
However, the vegetative swale played less of a role in relieving traffic congestion in all of the rainfall events. Its largest shortening duration is only 2 min in the two-year event, and it is ineffective in the ten-year event. The ineffectiveness of applying vegetative swale in traffic congestion relief is inevitable when this measure showed its ineffectiveness both in runoff volume reduction and perk discharge reduction.
Table 10 and Table 11 also indicate that the effectiveness in traffic congestion relief worsened when the return periods of rainfall increased, and this decline trend is similar to those in the other aspects (Table 8 and Table 9). In addition, the comprehensive measures, as the most effective LID measures in this aspect, decreased most sharply when the return periods increased. Its shortening percentage decreased from 69.4% to 34.0%.
However, all of the durations of over 15 cm are more than one hour in the five-year and ten-year rainfall events. This means that traffic congestion would also exist in these rainfall events in the Xiangquan Roundabout if these LID measures are constructed. Table 10 indicates that the duration over 15 cm is approximately 50 min in two-year event, if the concave greenbelt is applied. This means that the traffic congestion would also be serious in the two-year event, although the related reduction percentages is high, which is different from the evaluation of the other methods.
Because Xiangquan Roundabout is located in the low-lying region of the FHC and its pipeline infrastructure is deficient, LID measures have less of an effect when the precipitation intensity is large; and even if LIDs could have a greater effect, they would only be effective in the storage of the local storm, while the flood from the upper reaches and interval region can also remarkably result in the waterlogging of this transportation hub. However, the substantial controlling measures for the mountain flood should combine water conservancy projects and drainage pipeline networks, and only LID measures are less effective. This analysis would supply the different decision-making for the local government.
In summary, only the implementation of LID measures was far from ideal for solving the interval problems of both flood and waterlogging on the mountainous areas. The analysis agrees with the results of the other relevant research [52]. For the mountainous areas, rational analysis and decision-making in accordance with the regional characteristics and the above-described results are required before the implementation of stormwater management, flood management and SPC. In this study, the critical goal of regional waterlogging control is to guarantee the normal operation of transportation hubs of the Xiangquan Roundabout and relieving the traffic congestion. Accordingly, the construction of drainage pipe networks in the downstream low-lying areas should be first considered in making SPC schemes, i.e., the condition of the flood pouring down the street should be avoided. If well-funded, some retaining facilities such as flood-cutting channels should be built in upstream areas. Meanwhile, the drainage network should be expanded and the drainage canals should be dredged on both sides of the roads in middle-reach areas. Moreover, the LID measures coupled with underground tunnels should be built in downstream areas. Only when the runoff during the entire process was controlled, the dilemma of Xiangquan Roundabout being frequently flooded after storms would be fundamentally improved.
In addition, effective non-engineering measures should be employed in the FHC. A regional water-logging risk map should be developed and announced according to the simulation results of the ponding depth under different storm scenarios. The awareness of risk evasion should be acknowledged and build up to the public, especially the inhabitants in the low-lying areas (also the high-risk areas). Meanwhile, the corresponding countermeasures for different levels of ponding risk should be formulated. Although the risk map is static, it should be the crucial reference to the local regulation and planning for the future urban development and construction. Based on this static map, the regional real-time water-logging warning would be achieved combining the dynamic rainfall forecasting through satellite and radar. Furthermore, due to the importance of Xiangquan Roundabout for local transportation, a regional risk map for traffic jam and the corresponding countermeasures for various traffic jam risks should also be formulated according to the suggested traffic alleviation measures in this paper. In this way, the real-time warning of traffic congestion would be achieved, based on the risk map for traffic congestion and the dynamic warning of water-logging risk. If the congestion risk was high, the public would be notified in advance. Thus, the residents could optimize the traffic routes and avoid driving in the high-risk area. Vehicles and people that have entered the high risk area should be guided to the safe spots in accordance with the established evacuation routes, in order to minimize the property losses and lower the risk of traffic congestion.
In the future, field experiments and effect analysis on different LID measures should be carried out based on the related research results and can be convenient for comparing the effectiveness of the model simulation compared with practical engineering. The related results would supply more significant reference for decision-making, to further improve future stormwater and flood management. Additionally, the expected economic benefits of employing LID measures would be analyzed and discussed. These two aspects should be investigated in the future to propose reasonable construction scales of LID measures and then optimize regional the SPC scheme.
This study applied the data and information of detailed investigations, surveys and interviews for model calibration and validation due to the absence of observed runoff data in the study region. In the future, the pipeline and canal flow should be observed and monitored through a triangular weir, hydrometric propeller, and Acoustic Doppler Current Profilers (ADCP) to improve the modeling accuracy.
This study evaluated the effectiveness of the LID measures in reducing the quantity of runoff. In the future, the effectiveness on controlling non-point source pollution from storms should be analyzed and discussed. The above conclusions were applicable to mountainous urban units with semi-arid climate zones. In the future, the feasibility of the LID measures in urban units of humid zones and arid zones should be evaluated.

5. Conclusions

This study applied the SWMM for numerical simulations in the Fragrance Hills catchment (FHC) of Beijing, China, which is an urban mountainous low-lying region with no drainage pipe networks. This study extended the SWMM model to the data-sparse mountainous area, which was different from the previous applications of SWMM, which were mainly applied in highly urbanized regions.
Based on SWMM, the roads were generalized as drainage pipelines since the surface confluences in the region were flooded along the roads; then, according to DEM, RSI and field investigation data, the region was sub-divided into 72 sub-catchments, and thus the digital input of the drainage pipe networks for the model was finished. Because the observed discharge was absent, MRD, which is easily measured by a supplementary survey, was selected as the calibration variable. The parameters in the model were then calibrated using the typical storm process on 21 July 2012, and validated using a storm runoff process and a small rain runoff process on 20 July 2016, and 7 September 2016, respectively. This method is an attempt for model calibration and validation in the data-sparse areas. Based on the validation results, the regional model was established.
The design precipitation processes in different return periods were calculated according to the local regulations [25,26,27] as the input data of the regional model. The concave greenbelts, permeable pavement, bio-retention cells, vegetative swales and their comprehensive measures were selected and assigned as different scenarios. The absence of LID measures was set as the basic scenario. Through numerical simulations, the effectiveness in different LID scenarios was evaluated in three aspects, which was the runoff volume reduction, the peak discharge reduction and the traffic congestion relief, respectively. The duration of ponding depth over 15 cm and its corresponding shortening percentage were selected as the variables for evaluating the effectiveness in relieving the traffic congestion and adding it to the related effectiveness analysis was different from the previous research [18,36,38].
It was concluded that in mountainous urban units with high risks of local flooding and waterlogging, all LID measures were only effective in controlling one-year and two-year rainfall events. This result was different from the situations in the plain urban units [35,49,50,51] and the effective return period of rainfall events was shorter than that in the plain urban units.
Among all of the single LID measures, the concave greenbelt exhibited a significant reduction and controlling effectiveness in these three aspects. When the concave ratio of the greenbelts reached 50%, they were found to play an effective role in all of the aspects. This study suggests that its facility scale should not be expanded. Since mountainous floods exist and limit the construction size in the research region, the adoption of vegetative swale was found to play the least effective role in all of the aspects.
Furthermore, through the comprehensive utilization of various measures, the effectiveness in these three aspects in this region could be further improved under all scenarios. It should also be noted that comprehensive utilization does not mean the direct superposition of these measures, and the comprehensive effectiveness is less than the direct sum of various measures, due to the interaction of each LID measure. The effectiveness of all the LID measures decreased as the rainfall intensity increased, in terms of all the three aspects.
According to the simulation results, the concave greenbelt and comprehensive measures have a certain effect on relieving the traffic congestion in the two-year rainfall events. However, the traffic situation would also exist and be serious in the five-year and ten-year rainfall events, although these two measures were effective in shortening the duration of over 15 cm. This result reflected that LID measures alone could not substantially solve the traffic congestion caused by waterlogging in the mountainous low regions if and the drainage pipeline infrastructure were both absent.
According to the difference between flood in the upstream and water-logging in the downstream of the FHC, the integrated engineering measures are suggested, i.e., the construction of water conservancy project in upstream, drainage pipe networks in the downstream and LID measures coupled with underground tunnels in low-lying areas. Meanwhile, effective non-engineering measures such as risk map and real-time warning for water-logging and traffic congestion are also suggested.

Supplementary Materials

The following are available online at www.mdpi.com/2073-4441/9/6/439/s1. Table S1: Parameters of the study area. Tables S2–S5: Parameters of the concave greenbelts, the permeable pavement in residential community roads, the permeable pavement in municipal sidewalks and bio-retention cells, respectively. Table S6: Storage area of different depth in different vegetative swales.

Acknowledgments

The researchers would like to extend their thanks to the Chinese National Natural Science Foundation (No. 51409078 and No. 51522907) and the National Key Research and Development Program of China (No. 2016YFC0401401-6). The study was also supported by the Research Fund of the State Key Laboratory of Simulation and Regulation of Water Cycle in River Basin, China Institute of Water Resources and Hydropower Research (No. 2016ZY02).

Author Contributions

Qinghua Luan analyzed the results and wrote the paper; Xiaoran Fu performed the post survey and investigation and the model validation; Cuiping Song ran the model in different scenarios; Haichao Wang provided data and technical help; Jiahong Liu provided technical help for the model; and Ying Wang performed the post survey and investigation.

Conflicts of Interest

The authors declare no conflicts of interest.

References

  1. Ahiablame, L.M.; Engel, B.A.; Chaubey, I. Effectiveness of low Impact Development practices: Literature review and suggestions for future research. Water Air Soil Pollut. 2012, 223, 4253–4273. [Google Scholar] [CrossRef]
  2. Prince George’s County Department of Environmental Resources. Low-Impact Development Design Strategies, An Integrated Design Approach; Department of Environmental Resources Programs and Planning Division: Largo, MD, USA, 1999.
  3. The United States Environmental Protection Agency (USEPA). Low Impact Development (LID): A Literature Review; Document No. EPA-841-B-00-005; US Environmental Protection Agency (USEPA): Washington, DC, USA, 2000.
  4. Dietza, M.E.; Clausen, J.C. Stormwater runoff and export changes with development in a traditional and low impact subdivision. J. Environ. Manag. 2008, 87, 560–566. [Google Scholar] [CrossRef] [PubMed]
  5. Lerer, S.M.; Arnbjerg-Nielsen, K.; Mikkelsen, P.S. A mapping of tools for informing water sensitive urban design planning decisions—Questions, aspects and context sensitivity. Water 2015, 7, 993–1012. [Google Scholar] [CrossRef]
  6. Fletcher, T.D.; Shuster, W.; Hunt, W.F.; Ashley, R.; Butler, D.; Arthur, S.; Trowsdale, S.; Barraud, S.; Semadeni-Davies, A.; Bertrand-Krajewski, J.; et al. SUDS, LID, BMPs, WSUD and more—The evolution and application of terminology surrounding urban drainage. Urban Water J. 2014, 12, 1–18. [Google Scholar] [CrossRef]
  7. Zhou, Q. A review of sustainable urban drainage systems considering the climate change and urbanization impacts. Water 2014, 6, 976–992. [Google Scholar] [CrossRef]
  8. Li, X.; Li, J.; Fang, X.; Gong, Y.; Wang, W. Case studies of the sponge city program in China. In World Environmental and Water Resources Congress 2016, West Palm Beach, FL, 22–26 May 2016; Chandra, S., Pathak, C.S., Reinhart, D., Eds.; American Society of Civil Engineers (ASCE): Reston, VA, USA, 2016; pp. 295–308. [Google Scholar]
  9. Xinhua News Agency. “About Advancing the Sponge City Construction Guidance” Issued by the General Office of State Council. Available online: http://www.gov.cn/xinwen/2015-10/16/content_2948112.htm (accessed on 25 June 2016). (In Chinese)
  10. Che, W.; Zhao, Y.; Yang, Z.; Li, J.; Shi, M. Integral stormwater management master plan and design in an ecological community. J. Environ. Sci. 2014, 26, 1818–1823. [Google Scholar] [CrossRef] [PubMed]
  11. Coffman, L.S. Low-Impact Development: An alternative stormwater management technology. In Handbook of Water Sensitive Planning and Design; France, R.L., Ed.; Lewis Publishers: Boca Raton, FL, USA, 2002; pp. 97–123. [Google Scholar]
  12. Song, C. Research on Numerical Simulation of Stormwater Management Measures in Urban Low-Lying Area. Master’s Thesis, Hohai University, Nanjing, China, May 2014. [Google Scholar]
  13. Dreelin, E.A.; Fowler, L.; Ronald, C.C. A test of porous pavement effectiveness on clay soils during natural storm events. Water Res. 2006, 40, 799–805. [Google Scholar] [CrossRef] [PubMed]
  14. Davis, A.P.; Hunt, W.F.; Traver, R.G.; Clar, M. Bioretention technology: Overview of current practice and future needs. J. Environ. Eng. 2009, 135, 109–117. [Google Scholar] [CrossRef]
  15. Miller, C. Vegetated Roof Covers: A New Method for Controlling Runoff in Urbanized Areas. Pennsylvania Stormwater Management Symposium. Ph.D. Thesis, Villanova University, Villanova, PA, USA, October 1998. [Google Scholar]
  16. Roehr, D.; Kong, Y. Runoff reduction effects of green roofs in Vancouver, BC, Kelowna, BC, and Shanghai, P.R. China. Can. Water Res. J. 2010, 35, 53–67. [Google Scholar] [CrossRef]
  17. Cheng, J.; Xu, Q.; Yang, K.; Liu, L.; Li, B. Recessed green rainwater infiltration under storage effectiveness and its influencing factors. Water Supply Drain. 2007, 33, 45–49. [Google Scholar]
  18. Ahiablame, L.; Shakya, R. Modeling flood reduction effectiveness of low impact development at a watershed scale. J. Environ. Manag. 2016, 171, 81–91. [Google Scholar] [CrossRef] [PubMed]
  19. Jia, H.; Lu, Y.; Yu, S.L.; Chen, Y. Planning of LID-BMPs for urban runoff control: The case of Beijing Olympic Village. Separ. Purif. Technol. 2012, 84, 112–119. [Google Scholar] [CrossRef]
  20. Zhang, X.; Guo, X.; Hu, M. Hydrological effectiveness of typical low impact development approaches in a residential district. Nat. Hazards 2016, 80, 389–400. [Google Scholar] [CrossRef]
  21. Zhang, H. Low Impact Development of the Sponge Cities-the Research of the Typical Mountain Runoff Effect. Master’s Thesis, Hebei University of engineering, Handan, China, May 2016. [Google Scholar]
  22. Xinhua News Agency. Reliving Urban Waterlogging through LID Was Suggested by the Member of People’s Political Consultative Conference of Hainan Province, China. Available online: http://news.xinhuanet.com/politics/2016-02/18/c_128729445.htm (accessed on 18 February 2016). (In Chinese).
  23. Changde (China) Official Web Portal. The Implementing Opinion about Advancing the Sponge City Construction Issued by the General Office of Changde Council. Available online: http://swb.changde.gov.cn/art/2016/9/1/art_15645_617086.html (accessed on 29 August 2016). (In Chinese)
  24. Xinhua News Agency. Sponge Wetland Parks Would Be Constructed in Tongzhou and Fangshan Districts, Beijing. Available online: http://www.bj.xinhuanet.com/bjyw/2016-08/15/c_1119393984.htm (accessed on 15 August 2016). (In Chinese).
  25. Beijing Water Bureau. Hydrologic Handbook of Beijing City; Beijing Water Bureau: Beijing, China, 1999.
  26. Beijing Municipal Commission of Urban Planning; Beijing Municipal Administration of Quality and Technology Supervision. Standard of Storm Runoff Calculation for Urban Storm Drainage System Planning and Design (DB11/T969-2013); Beijing Institute of City Planning & Design: Beijing, China, 2013.
  27. Beijing Municipal Administration of Quality and Technology Supervision. Technical Code on Rainwater Harvesting Engineering in Urban Area (DB 11/T 685-2009); Beijing Water Bureau: Beijing, China, 2009.
  28. Shi, Y. Eco-Hydrological Process Analysis on Forest Ecosystems of Major Dominant Species in Beijing Mountainous Area. Ph.D. Thesis, Beijing Forestry University, Beijing, China, 2011. [Google Scholar]
  29. Liu, Y.; Bralts, V.F.; Engel, B.A. Evaluating the effectiveness of management practices on hydrology and water quality at watershed scale with a rainfall-runoff model. Sci. Total Environ. 2015, 511, 298–308. [Google Scholar] [CrossRef] [PubMed]
  30. Cronshey, R.G.; Roberts, R.T.; Miller, N. Urban hydrology for small watersheds (TR-55 REV.). Am. Soc. Civ. Eng. 1986, 55, 1268–1273. [Google Scholar]
  31. Park, Y.S.; Enge, B.A.; Harbor, J. A web-based model to estimate the impact of best management practices. Water 2014, 6, 455–471. [Google Scholar] [CrossRef]
  32. Shoemaker, L.; Riverson, J.; Alvi, K.; Rafi, T. SUSTAIN—A Framework for Placement of Best Management Practices in Urban Watersheds to Protect Water Quality; Document No. EPA-600-R-09-095; US Environmental Protection Agency (USEPA), Office of Research and Development National Risk Management Research Laboratory: Cincinnati, OH, USA, 2009.
  33. Marsalek, J.; Dick, T.M.; Wisner, P.E.; Clarke, W.G. Comparative evaluation of three urban runoff models. Water Resour. Bull. AWRA 1975, 11, 306–328. [Google Scholar] [CrossRef]
  34. Park, D.; Jang, S.; Roesner, L.A. Evaluation of multi-use stormwater detention basins for improved urban watershed management. Hydrol Process. 2014, 28, 1104–1113. [Google Scholar] [CrossRef]
  35. Villarreal, E.L.; Annette, S.D. Inner city stormwater control using a combination of best management practices. Ecol. Eng. 2004, 22, 279–298. [Google Scholar] [CrossRef]
  36. DHI CHINA. Available online: http://www.dhichina.cn/h-col-153.html (accessed on 27 June 2016).
  37. Chen, H.; Li, J.K.; Li, Y.J.; Xu, Y.; Shen, B. Progress on research and application of Storm Water Management Model (SWMM). J. Northwest A F Univ. (Nat. Sci. Ed.) 2015, 43, 225–234. (In Chinese) [Google Scholar]
  38. Koudelak, P.; West, S. Sewerage Network Modelling in Latvia, use of InfoWorks CS and Storm Water Management Model 5 in Liepaja city. Water Environ. J. 2007, 22, 81–87. [Google Scholar] [CrossRef]
  39. Qin, H.; Li, Z.; Fu, G. The effects of low impact development on urban flooding under different rainfall characteristics. J. Environ Manag. 2013, 129, 577–585. [Google Scholar] [CrossRef] [PubMed]
  40. Hu, A.; Ren, X.; Pei, G. Simulation of stormwater control effect of LID municipal road based on SWMM. China Water Wastewater. 2015, 31, 130–133. [Google Scholar]
  41. Li, J.; Li, Y.; Shen, B.; Li, Y. Simulation of rain garden effects in urbanized area based on SWMM. J. Hydrol. Eng. 2014, 33, 60–67. [Google Scholar]
  42. Wenliang, W.; Junqi, L.; Yongwei, G.; Mingjing, Z.; Qingkang, Z. LID stormwater control effect simulation based on SWMM. China Water Wastewater 2012, 28, 42–44. [Google Scholar]
  43. Zhang, C.; Jiang, Y.J.; Lian, Y.Q.; Yuan, D.X.; Pei, J.G.; Jiang, G.H.; Wang, J.L. Rainfall-runoff simulation of a typical Karst fengcong depression system using SWMM model. A case study of the Yaji experimental site in Guilin. Hydrol. Eng. Geol. 2007, 3, 10–14. [Google Scholar]
  44. Environmental Protection Agency (EPA). Available online: https://www.epa.gov/water-research/storm-water-management-model-swmm#description (accessed on 5 May 2016).
  45. Zaghloul, N.Z. Sensitivity Analysis of the SWMM runoff-transport parameters and the effects of catchment discretisation. Adv. Water Res. 1983, 6, 214–223. [Google Scholar] [CrossRef]
  46. Zhao, D.Q.; Wang, H.Z.; Chen, J.N.; Wang, H.C. Parameters uncertainty analysis of urban rainfall-runoff simulation. Adv. Water Sci. 2009, 20, 45–51. [Google Scholar]
  47. General Administration of Quality Supervision, Inspection and Quarantine of the People’s Republic of China, Standardization Administration of the People’s Republic of China. Standard for Hydrological Information and Hydrological Forecasting (GB/T 22482-2008); The Ministry of Water Resources of the People’s Republic of China: Beijing, China, 2008.
  48. Liu, C.; Zhang, Y.; Wang, Z. The LID pattern for maintaining virtuous water cycle in urbanized area: A preliminary study of planning and techniques for sponge city. J. Nat. Res. 2016, 31, 719–731. [Google Scholar]
  49. Wang, W. Hydrological effect assessment of Low Impact Development for urbanized area based on SWMM. Master’s Thesis, Peking University, Beijing, China, 2011. [Google Scholar]
  50. Li, Z.; Qin, H.; Xie, K. Hydrological effect analysis of Low Impact Development under different rainfall conditions. China Water Wastewater 2012, 28, 37–41. [Google Scholar]
  51. Sun, J. Stormwater utilization and ecological design: The first phase of the Hannover Kronsberg Project in Germany. Urban Environ. Des. 2017, 3, 93–96. [Google Scholar]
  52. Chang, T.J. Connection of the LID and urban waterlogging prevention-Taiwan in subtropical rainy area as an example. In Proceedings of the 14th China Water Forum, Changchun, Jilin, China, 26–27 August 2016; Water Resources and Electric Power Press: Beijing, China, 2016. [Google Scholar]
Figure 1. Location of Fragrance Hills, Beijing.
Water 09 00439 g001
Figure 2. Typical design precipitation processes of different return periods of: (a) one year; (b) two years; (c) five years; and (d) ten years.
Water 09 00439 g002
Figure 3. Drainage system (a); and sub-catchments (b) of study area. In this drainage system map (a), rea lines are mountain ridges, blue lines are rivers, black lines are mountain gullies and pink lines are roads.
Water 09 00439 g003
Figure 4. Distribution of the ISI positions.
Water 09 00439 g004
Figure 5. Simulated “7.21” runoff processes in different positions.
Water 09 00439 g005
Figure 6. Simulated “7.20” runoff processes at different positions.
Water 09 00439 g006
Figure 7. Simulated “9.07” runoff processes at different positions.
Water 09 00439 g007
Figure 8. Simulated runoff processes in different scenarios with different return-period events: (a) one year; (b) two years; (c) five years; and (d) ten years.
Water 09 00439 g008
Table 1. Characteristics of the three chosen rainfall events.
RainfallStart and End TimeDuration (min)Maximum Rainfall Intensity (mm/h)Peak TimeTotal (mm)
“7.21”12:20–5:00100016216:23264.5
15619:03
“7.20”1:30–16:309004214:0669.8
“9.07”21:30–4:003404222:1036.4
Table 2. Initial values of sensitive parameters.
Sub-Catchment CodeN of Impervious AreaN of Pervious AreaD of Impervious Area (mm)D of Pervious Area (mm)
S1–S720.0170.427
Table 3. Initial values of the infiltration parameters.
Sub-Catchment Codefc (mm/h)f0 (mm/h)k (1/h)
S1–S6, S22–S26, S28–S3073.26.64
S7–S9, S16–S17, S31–S33, S39–S4296.66.64
S10–S11, S34–S381236.64
S12–S15, S18–S21, S27, S43–S53, S58–S64, S681206.64
S54115.86.64
S55–S571236.64
S65–S67, S69–S72181.26.64
Table 4. Calibrated results of the parameters.
Sub-Catchment CodeN of Impervious AreaN of Pervious AreaD of Impervious Area (mm)D of Pervious Area (mm)
S1, S4, S8–S9, S39–S40,0.0170.82.36.8
S2–S3, S5–S6, S22–S26, S28–S330.0170.82.37.6
S7, S10–S18, S38, S41–S430.0170.42.36.8
S19–S21, S34–S37, S44–S720.0130.242.36.8
S270.0130.42.37.6
Table 5. Comparison between MRDS and MRDI of typical rainfall processes.
Calibration Spot 17.217.209.07
MRDs (cm)MRDI (cm)|RE| (%)MRDs (cm)MRDI (cm)|RE| (%)MRDs (cm)MRDI (cm)|RE| (%)
No. 114137.7222010.0330.0
No. 2121020.049458.9550.0
No. 340385.332358.6550.0
No. 41251204.21051104.5786.7
No. 541402.561656.2777.7
Average--7.90--7.64--2.88
Note: 1 Calibration spot is the corresponding ISI position in this study.
Table 6. Comparison between PTS and PTI of typical runoff processes.
Calibration Spot7.217.209.07
PTsPTIPTsPTIPTsPTI
No. 120:42After 20:3010:34About 10:3022:20About 22:30
No. 216:25About 16:3010:36About 10:3022:30About 22:30
No. 320:38About 20:3011:18After 11:0022:30About 22:30
No. 420:26About 20:3011:28About 11:3022:30About 22:30
No. 520:43After 20:3010:36About 10:3022:40After 22:30
Table 7. The simulated runoff and MRD in basic scenario.
Return PeriodMRD (m) at O1 OutfallRunoff Depth (mm)
O1 OutfallS38 Sub-CatchmentS69 Sub-Catchment
1 year0.1103.23.33.6
2 years0.21113.513.814.7
5 years0.27648.448.953.3
10 years0.34980.080.788.5
Table 8. Percentage of runoff reduction under different scenarios.
ScenarioRatio (%)Runoff Reduction (%)Remarks
1 Year2 Years5 Years10 Years
Concave greenbelt50%52.5%20.5%8.5%5.2%Concave depth 10 cm, outfall O1
70%56.2%22.0%11.1%7.3%
90%57.3%23.4%13.5%8.2%
Permeable pavement50%7.3%3.2%2.2%1.9%Typical sub-catchment S38
60%8.8%3.8%2.6%2.4%
70%12.2%11.5%7.8%7.0%
Bio-retention-12.1%11.8%10.2%10.7%Typical sub-catchment S69
Vegetative swale-3.0%1.1%0.8%0.3%Outfall O1
Comprehensive measures-57.3%40.5%20.2%15.4%Outfall O1
Table 9. Percentages of MRD reduction in different scenarios.
ScenarioPercentage (%)
1 Year2 Years5 Years10 Years
Concave greenbelt53.9%17.2%16.7%9.3%
Vegetative swale2.2%0.3%0.1%0.1%
Comprehensive measures55.7%20.9%20.0%11.1%
Table 10. Durations of ponding depth over 15 cm in different scenarios.
ScenarioDuration of over 15 cm Depth (min)
1 Year2 Years5 Years10 Years
No LID098144206
Concave greenbelt04886146
Vegetable swale096142206
Comprehensive measures03066136
Table 11. Shortening percentages of durations of over 15 cm in different scenarios.
ScenarioShortening Percentages (%)
2 Years5 Years10 Years
Concave greenbelt51.0%40.3%29.1%
Vegetable swale2.04%1.39%0.0%
Comprehensive measures69.4%54.2%34.0%

