Short Note

A Simple Method for the Determination of Deposition Coefficient Using the Analytical Solution of Advection-Dispersion-Deposition Equation for Step Input

1
Department of Rural Systems Engineering/Research Institute of Agriculture and Life Sciences, Seoul National University, Seoul 08826, Korea
2
Center for Water Resources Cycle Research, Korea Institute of Science and Technology, Hwarang-ro 14-gil 5, Seongbuk-gu, Seoul 02792, Korea
3
Division of Energy & Environment Technology, KIST school, Korea University of Science and Technology, Seoul 02792, Korea
4
Department of Earth and Environmental Sciences, Korea University, Anam-ro 145, Sungbuk-gu, Seoul 02841, Korea
*
Author to whom correspondence should be addressed.
These authors contributed equally.
Water 2017, 9(6), 398; https://doi.org/10.3390/w9060398
Submission received: 14 March 2017 / Revised: 18 May 2017 / Accepted: 30 May 2017 / Published: 2 June 2017

Abstract

:
A simple method is proposed for the determination of the deposition coefficient, which plays an important role in bacterial transport in a porous media. The method relies on the analytical solution of an advection-dispersion-deposition equation for the step input of a bacterial solution. The step input solution can be simplified when time goes to infinity, and thereby the deposition coefficient can be obtained as a function of the maximum concentration and peclet number. The deposition coefficient given by the simple method yields a similar expression to those of previous studies with a slight modification. Comparison of the simple method with other methods revealed that it offers an advantange of a wider application, even to a square pulse input as well as step input of a bacterial solution, and that calculation of bacterial mass fraction is not required. Theoretical validation revealed that the method can be valid for the conditions of pulse duration greater than 0.8 pore volume in the column study with Pe 300–400.

1. Introduction

The assessment of bacterial deposition becomes a prerequisite for the correct prediction of bacterial transport for bioaugmentation methods or the prevention of microbial pathogens from contaminating drinking water supplies in alluivial aquifers. The deposition refers to the complex process of removing bacteria from a suspension in a porous medium, such as straining, attachment, sorption, etc. To date, numerous studies on the process of bacterial deposition have been conducted to verify the effects of chemical factors such as solution chemistry [1,2], physical factors such as grain size and bacterial surface protein [3], and saturated and unsaturated porous media [4], grain size and pore water velocity [5], and physico-chemical factors such as saturated and unsaturated media and ionic strength [6].
Deposition coefficients are typically determined by fitting transport models to the observed bacterial breakthrough curves (BTCs) eluted from the porous medium. Several studies have been conducted to use easily determined measures in order to determine the deposition coefficient [7,8]. A method for the determination of sticking efficiencies has been proposed using the filtration model of Yao et al. [7]. This method requires time-consuming treatment such as the measurement of complete BTCs or the dissection of a column and enumeration the deposited bacteria.
Bolster et al. proposed another method for calculating the bacterial deposition coefficent using a simple measure—the fraction of bacteria recovered from a laboratory column breakthrough experiment [8]. This method was derived from the analytical solution of the bacteria transport equation for pulse input. The dimensionless form of the bacterial transport equation for advection, disperstion, and deposition processes can be given as [8]:
C T = 1 P e 2 C X 2 C X κ 1 C
S T = κ 1 C
where peclet number P e = v L / D , Damkohler number representing time-scale ratios for deposition to flow velocity κ 1 = k c L / v , dimensionless length X = x / L , dimensionless time T = v t / L , normalized concentration of bacteria in aqueous phase C = c / c 0 , and normalized concentration of bacteria on the solid phase S = s / c 0 (v: porewater velocity or advection coefficient, L: column length, D: dispersion coefficient, c: bacterial concentration in aqueous phase, s: bacterial concentration in solid phase, c 0 : injection concentration, k c : deposition coefficient). A solution to Equation (1) for the bacterial flux concentration at the end of the column (X = 1) for a step input was given as [8]:
C ( 1 , T ) = 1 2 exp [ P e 2 ( 1 1 + 4 κ 1 P e 1 ) ] erfc [ 1 T 1 + 4 κ 1 P e 1 4 T P e 1 ] + 1 2 exp [ P e 2 ( 1 + 1 + 4 κ 1 P e 1 ) ] erfc [ 1 + T 1 + 4 κ 1 P e 1 4 T P e 1 ]
The bacterial flux concentration at the end of the column for a pulse input was generated by using the principle of superposition.
C ϵ ( 1 , T ) = C ( 1 , T ) C ( 1 , T ϵ )
where C ϵ ( 1 , T ) is the solution for a pulse input and ϵ is the length of the pulse input.
The cummulative recovery of bacteria is obtained by integrating the equation for the bacterial flux concentration. The fractional mass recovery (fr) for a pulse input is obtained by normalizing the cummulative recovery with the mass input.
f r = exp [ P e 2 ( 1 1 + 4 κ 1 P e 1 ) ]
Rearranging Equation (5) yields the folllowing dimensionless deposition coefficient (Bolster et al. 1998 [8]):
κ 1 = ln ( f r ) + [ ( ln ( f r ) ) 2 P e ]
Equation (6) is independent of pulse length, and can be conveniently used for a porous media which undergoes bacterial dispersion and deposition. The deposition coefficient ( κ 1 ) is a function of the fractional mass recovery (fr) and the peclet number (Pe), and for large Pe the relationship between κ 1 and ln ( f r ) becomes linear.
Retrospection of Equation (3) enables us to gain some insights on the relationship between C(1, T) and κ 1 for the step input experiment. The Equation (3) can be simply expressed as:
C ( 1 , T ) = c 1 e r f c ( f ( T ) ) + c 2 e r f c ( g ( T ) )
where:
c 1 = 1 2 exp [ P e 2 ( 1 1 + 4 κ 1 P e 1 ) ]
c 2 = 1 2 exp [ P e 2 ( 1 + 1 + 4 κ 1 P e 1 ) ]
f ( T ) = 1 T 1 + 4 k 1 P e 1 4 T P e 1
f ( T ) = P e 4 ( 1 T 1 + 4 κ 1 P e 1 T )
g ( T ) = 1 + T 1 + 4 κ 1 P e 1 4 T P e 1
g ( T ) = P e 4 ( 1 T + 1 + 4 κ 1 P e 1 T ) P e 2 + 4 κ 1 P e 4 > P e
As time goes to infinity and P e > 4 , the complement error function (erfc) terms approach a constant value, as follows:
lim T   erfc   ( f ( T ) ) = 2
lim T   erfc   ( g ( T ) ) = 0
Under these conditions, the effluent concentration reaches the steady-state concentration c s and is simplified so that:
C ( 1 , ) = exp [ P e 2 ( 1 1 + 4 κ 1 P e 1 ) ]
and at that condition, C ( 1 , ) = c s / c 0 . Therefore, we can obtain the following relation:
ln ( c s / c 0 ) = P e 2 ( 1 1 + 4 κ 1 P e 1 )
Rearranging this equation gives the following relationship for κ 1 :
κ 1 = ln ( c s / c 0 ) + 1 P e ( ln ( c s / c 0 ) ) 2
This relationship between the steady-state concentration (plateau concentration) and the deposition rate can be used to obtain an accurate bacterial deposition coefficient for a step input.
Alternatively, the deposition coefficient can also be estimated using the approach of Yao et al. [7]. The effluent bacterial concentration of a packed bed with length L is related to the efficiency of a single spherical collector:
c L = 3 2 ( 1 θ ) d α η c
where θ is the bed porosity, α is a collision efficiency factor, η is the collector efficiency, and d is the grain diameter. The integration of Equation (19) yields the following relationship between the deposition κ 1 and the effluent concentration in steady-state c s / c 0 , so that:
κ 1 = ln ( c s / c 0 )
where:
κ 1 = 3 2 ( 1 θ ) d α η L
The relationship between κ 1 and c s / c 0 given by Equation 18 implies that the deposition coefficient is a function of c s / c 0 and Pe, and for high Pe it becomes only a function of c s / c 0 . A similarity can be found between Equations (6) and (18) in that both of them have an identical form, as is shown in Table 1, and they differ in that the deposition coefficient is a function of c s / c 0 for Equation (18) while it is a function of fr for Equation (6). Another similarity also can be found between Equations (18) and (20) in that both of them are functions of ln ( c s / c 0 ) , except for the presence of the additional term ( ln ( c s / c 0 ) ) 2 / P e in Equation (18). These similarities suggest that both simple measures, fr as well c s , are applicable for the determination of the bacterial deposition coefficient. However, it is necessary to compare the accuracy of the two methods using c s . The objective of this study is to propose a simple method for the estimation of the deposition coefficient from breakthrough curves of pulse and step input. The validity of the new method was tested by comparing the accuracy of the estimated deposition coefficient with the other two methods. Furthermore, it is shown how they deviate from each other according to Pe and the injection duration of the bacterial solution (pulse or step input).

2. Theoretical Analysis

The validity of the simple method for the determination of κ 1 was tested by comparing the value of κ 1 given for simulating bacterial transport and the κ 1 values estimated using Equations (6), (18) and (20). For the simulation of bacterial transport, a clean bed system with step and pulse injection for fixed P e were postulated. The bacterial flux concentration at the end of the column for step and pulse input were calculated using Equations (3) and (4), respectively.
Sensitivity analysis for κ 1 was performed to compare the accuracy of the methods for the estimation of κ 1 . The bacterial BTC was simulated for short ( T 0 = 0.5 ) and long pulse inputs ( T 0 = 2 ) with P e = 100 and various κ 1 . The deposition coefficient ( κ 1 ) was estimated using Equations (6), (18) and (20) based on the c s / c 0 and f r of the simulated BTCs. From the BTC of long pulse and step inputs, the steady-state concentration c s could be determined from the concetration of the plateau part. From the BTC of short pulse input, the relative peak concentration c p e a k / c 0 was used instead of c s / c 0 . The fractional mass recovery was calculated by the following:
f r = 0 T 0 c   d t / c 0 T 0
Coincidence of the given and estimated values could indicate the validity of the equation for the estimation of κ 1 .
The sensitivity analysis was also conducted for P e and T 0 to confirm the applicable range of parameters for Equations (6), (18) and (20). The range of parameters used for the sensitivity analysis are shown in Table 2. The applicability was also determined by comparing the given κ 1 values with those previously estimated.

3. Results and Discussion

3.1. Discrepancy between the Given Deposition Coefficient and the Estimated Values

The advection dispersion equation is widely used to describe the bacterial transport in saturated porous materials. Assuming the bacterial deposition during the transport as the first order kineic process, the bacterial BTCs were simulated for the various conditions of deposition ( κ 1 ), transport (Pe = 100), and input (T0) (Figure 1). The simulated BTCs are shown in Figure 1a,b for short and long pulse inflows, respectively. Here, the simulations were conducted under various deposition coefficients ( κ 1 = 0.1–0.9 ) to show the effect of deposition on the bacterial BTC. The higher κ 1 resulted in the lower peak. The peak concentrations for the short pulse (in Figure 1a) are slightly lower than those (in Figure 1b) for the long pulse due to the occurrence of dispersion.
The deposition coefficients ( κ 1 ) can be determined from the simulated BTCs using the estimated values for c s / c 0 , c p e a k / c 0 , f r and the three equations in Table 1. As an example, Table 3 shows how to estimate κ 1 from the simulated BTCs for the pulse and the step inputs with P e = 100 and κ 1 = 0.5 . The BTC of step input is not shown due to the similarity with that of long pulse input. The steady-state concentration c s / c 0 in step input is equal to the peak concentration c p e a k / c 0 in the long pulse input. The peak concentration for the short pulse are slightly lower than that of the long pulse. The fractional recovery calculated from the breakthrough curves of short and long pulse inputs were equal. It is remarkable that for the long pulse case, the value of c p e a k / c 0 becomes identical to that of fr. For both pulse inputs, the equation of Bolster et al. (1998) [8] could estimate κ 1 = 0.5 to be tha same as the given value. For the step and the long pulse inputs, the equation of Yao et al. (1971) [7] could also estimate κ 1 to be the same as the given values. The new equation in this study (Equation (18)) could estimate accurate κ 1 for step and long pulse inputs by assuming c s = c p e a k , but estimated higher κ 1 for short pulse input than the given value due to c p e a k < c s .
The parameter estimation methods can be evaluated by comparing the estimated parameter and the given parameter, since the curve was simulated using the given deposition coefficient. A comparison between given and estimated deposition coefficients is shown in Figure 1c,d. Under the short pulse injection condition, Equation (6) suggested by Bolster et al. [8] showed good agreement between the given and the estimated values. However, the deposition coefficients obtained by the other methods were overestimated (Figure 2c) because the peak concentration did not reach the steady-state concentration. For the long pulse injection condition (Figure 2d), all three methods showed identical deposition coefficients between the estimated and the given values because the pleatau concentration can be replaced with the steady-state concentration. This indicates that the applicability of the methods for κ 1 determination is dependent on the pulse length. The good applicability of the equation of Bolster et al. [8] for pulse type injection is natural because the equation was derived from Equation (4), which is a solution of the advection dispersion equation under pulse injection. The one disadvantage of using the equation of Bolster et al. [8] is that the integration calculation must be performed in order to calculate fr.
To use Equations (18) and (20), the integration of BTC is not necessary. It is enough to read the maximum or steady-state concentration from the observed BTC. However, the applicability of the method using Equations (18) and (20) is restricted to the long pulses. Equation (18) was derived from the solution of the advection dispersion equation under step injection, and Equation (20) was derived from the concept of the packed bed reaching a steady-state concentration. Even though the bacterial solution is injected not with a step type but with a pulse type input, Equations (18) and (20) are applicable if the peak concentration of BTC reaches the plateau concentration, which it would reach under the condition of step injection. Under restricted conditions where c s =   c p e a k , Equations (18) and (20) can be simple alternatives to estimate the bacterial deposition coefficient.

3.2. Validation of the Detemined Deposition Coefficient

3.2.1. Effect of the Peclet Number

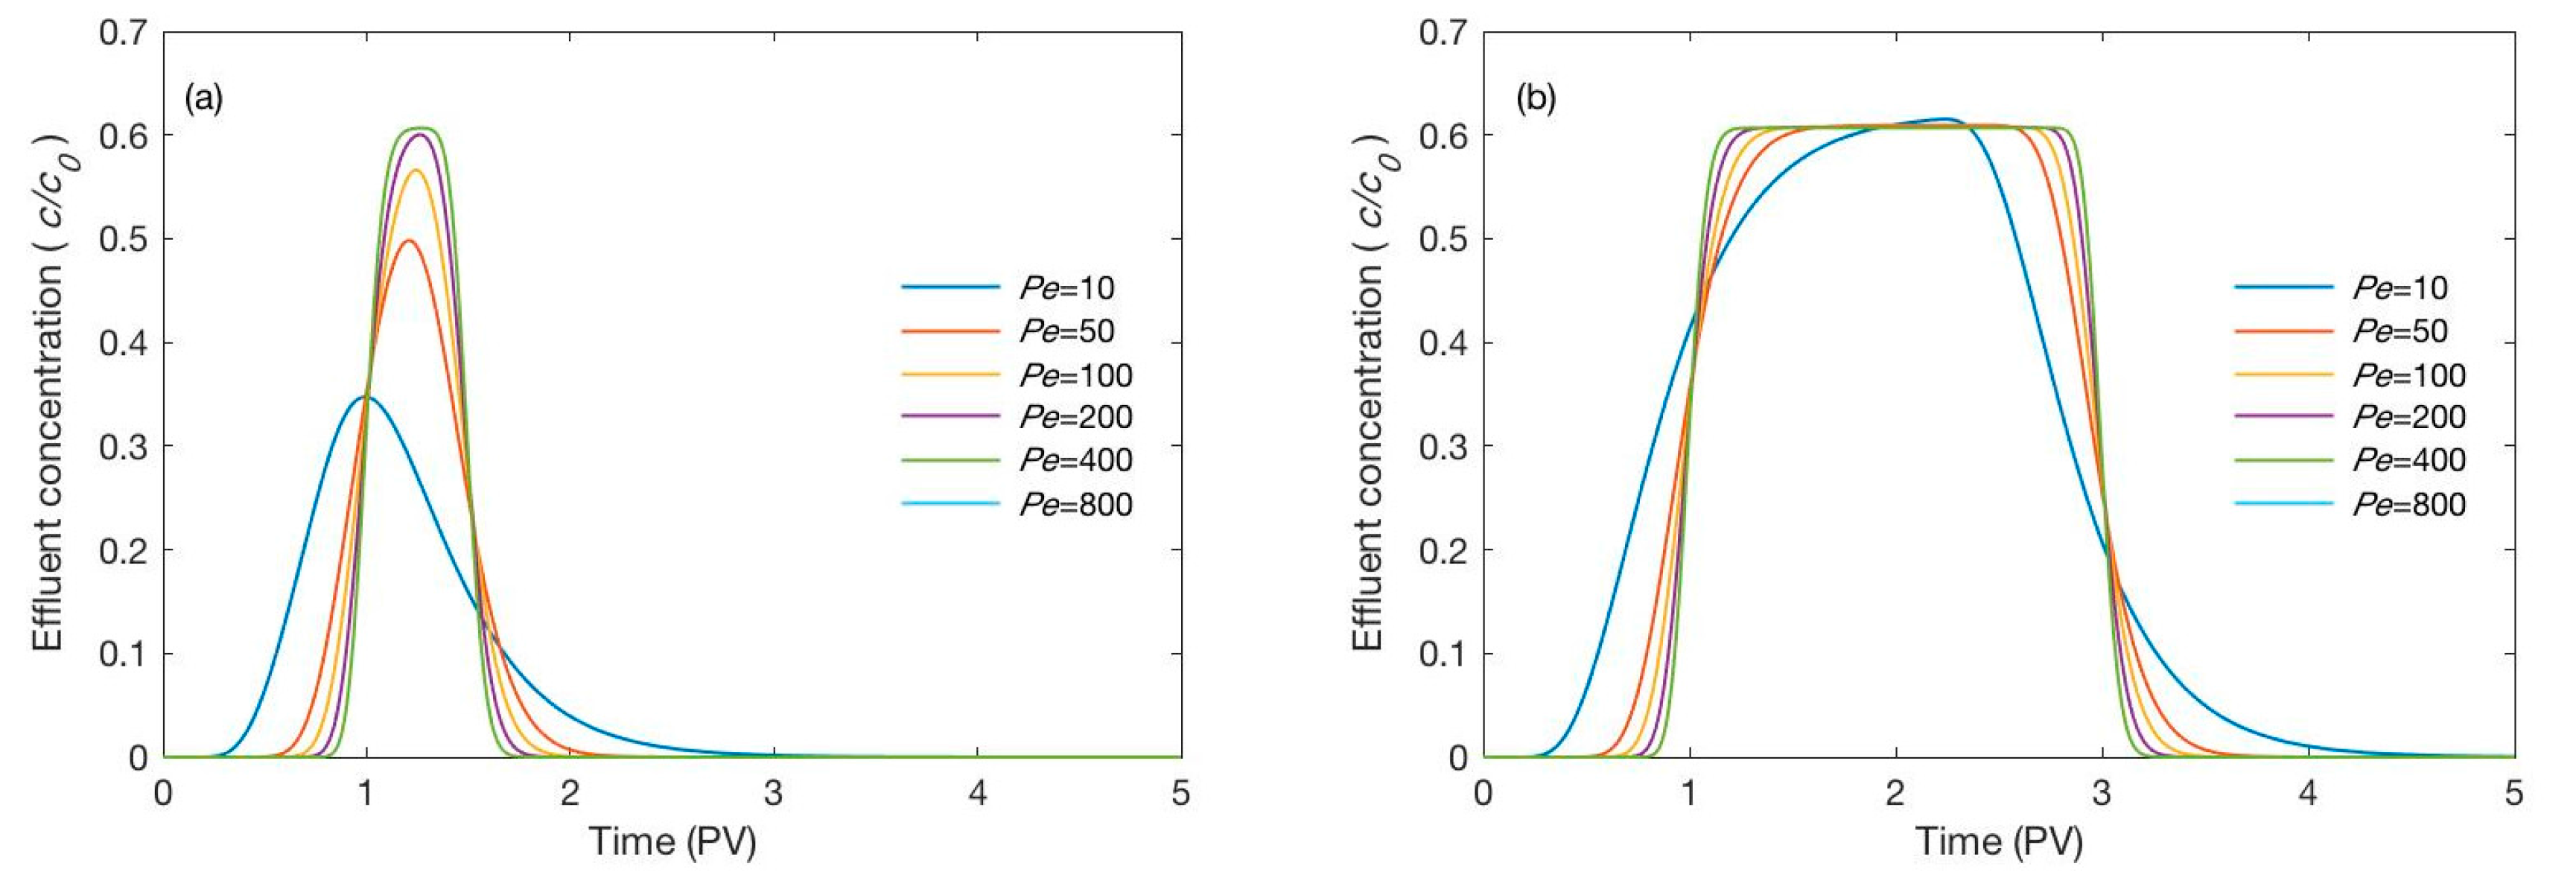
Figure 2 shows the effect of Pe on the BTCs for the short (T0 = 0.5) (Figure 2a) and long pulses (T0 = 2.0) (Figure 2b) when κ 1 = 0.5 was assumed. As the Pe deminishes from 800 to 10, the peak heights are lower with dispersion, especially for the short pulse, while they are relatively constant for the long pulse. Accordingly, the c p e a k / c 0 decreases with decreasing Pe. For the short pulse, the values of κ 1 estimated by the method of Yao et al. (1971) [7] and this study are overestimated, especially for Pe < 200 (Figure 2c). For the long pulse, deviation of κ 1 still exists for the method of Yao et al. (1971) [7], but the method of this study offers the correct estimation of κ 1 for Pe > 20 (Figure 2d). Therefore, the use of the new method offered in this study is restricted to the conditions of Pe > 300 and Pe > 20 for the short and long pulses, respectively. This implies that higher Pe is required for lower T0, and vice versa. The higher requirement of Pe for lower T0 can be explained by the fact that less dispersion occurrs for higher Pe.

3.2.2. Effect of the Pulse Duration

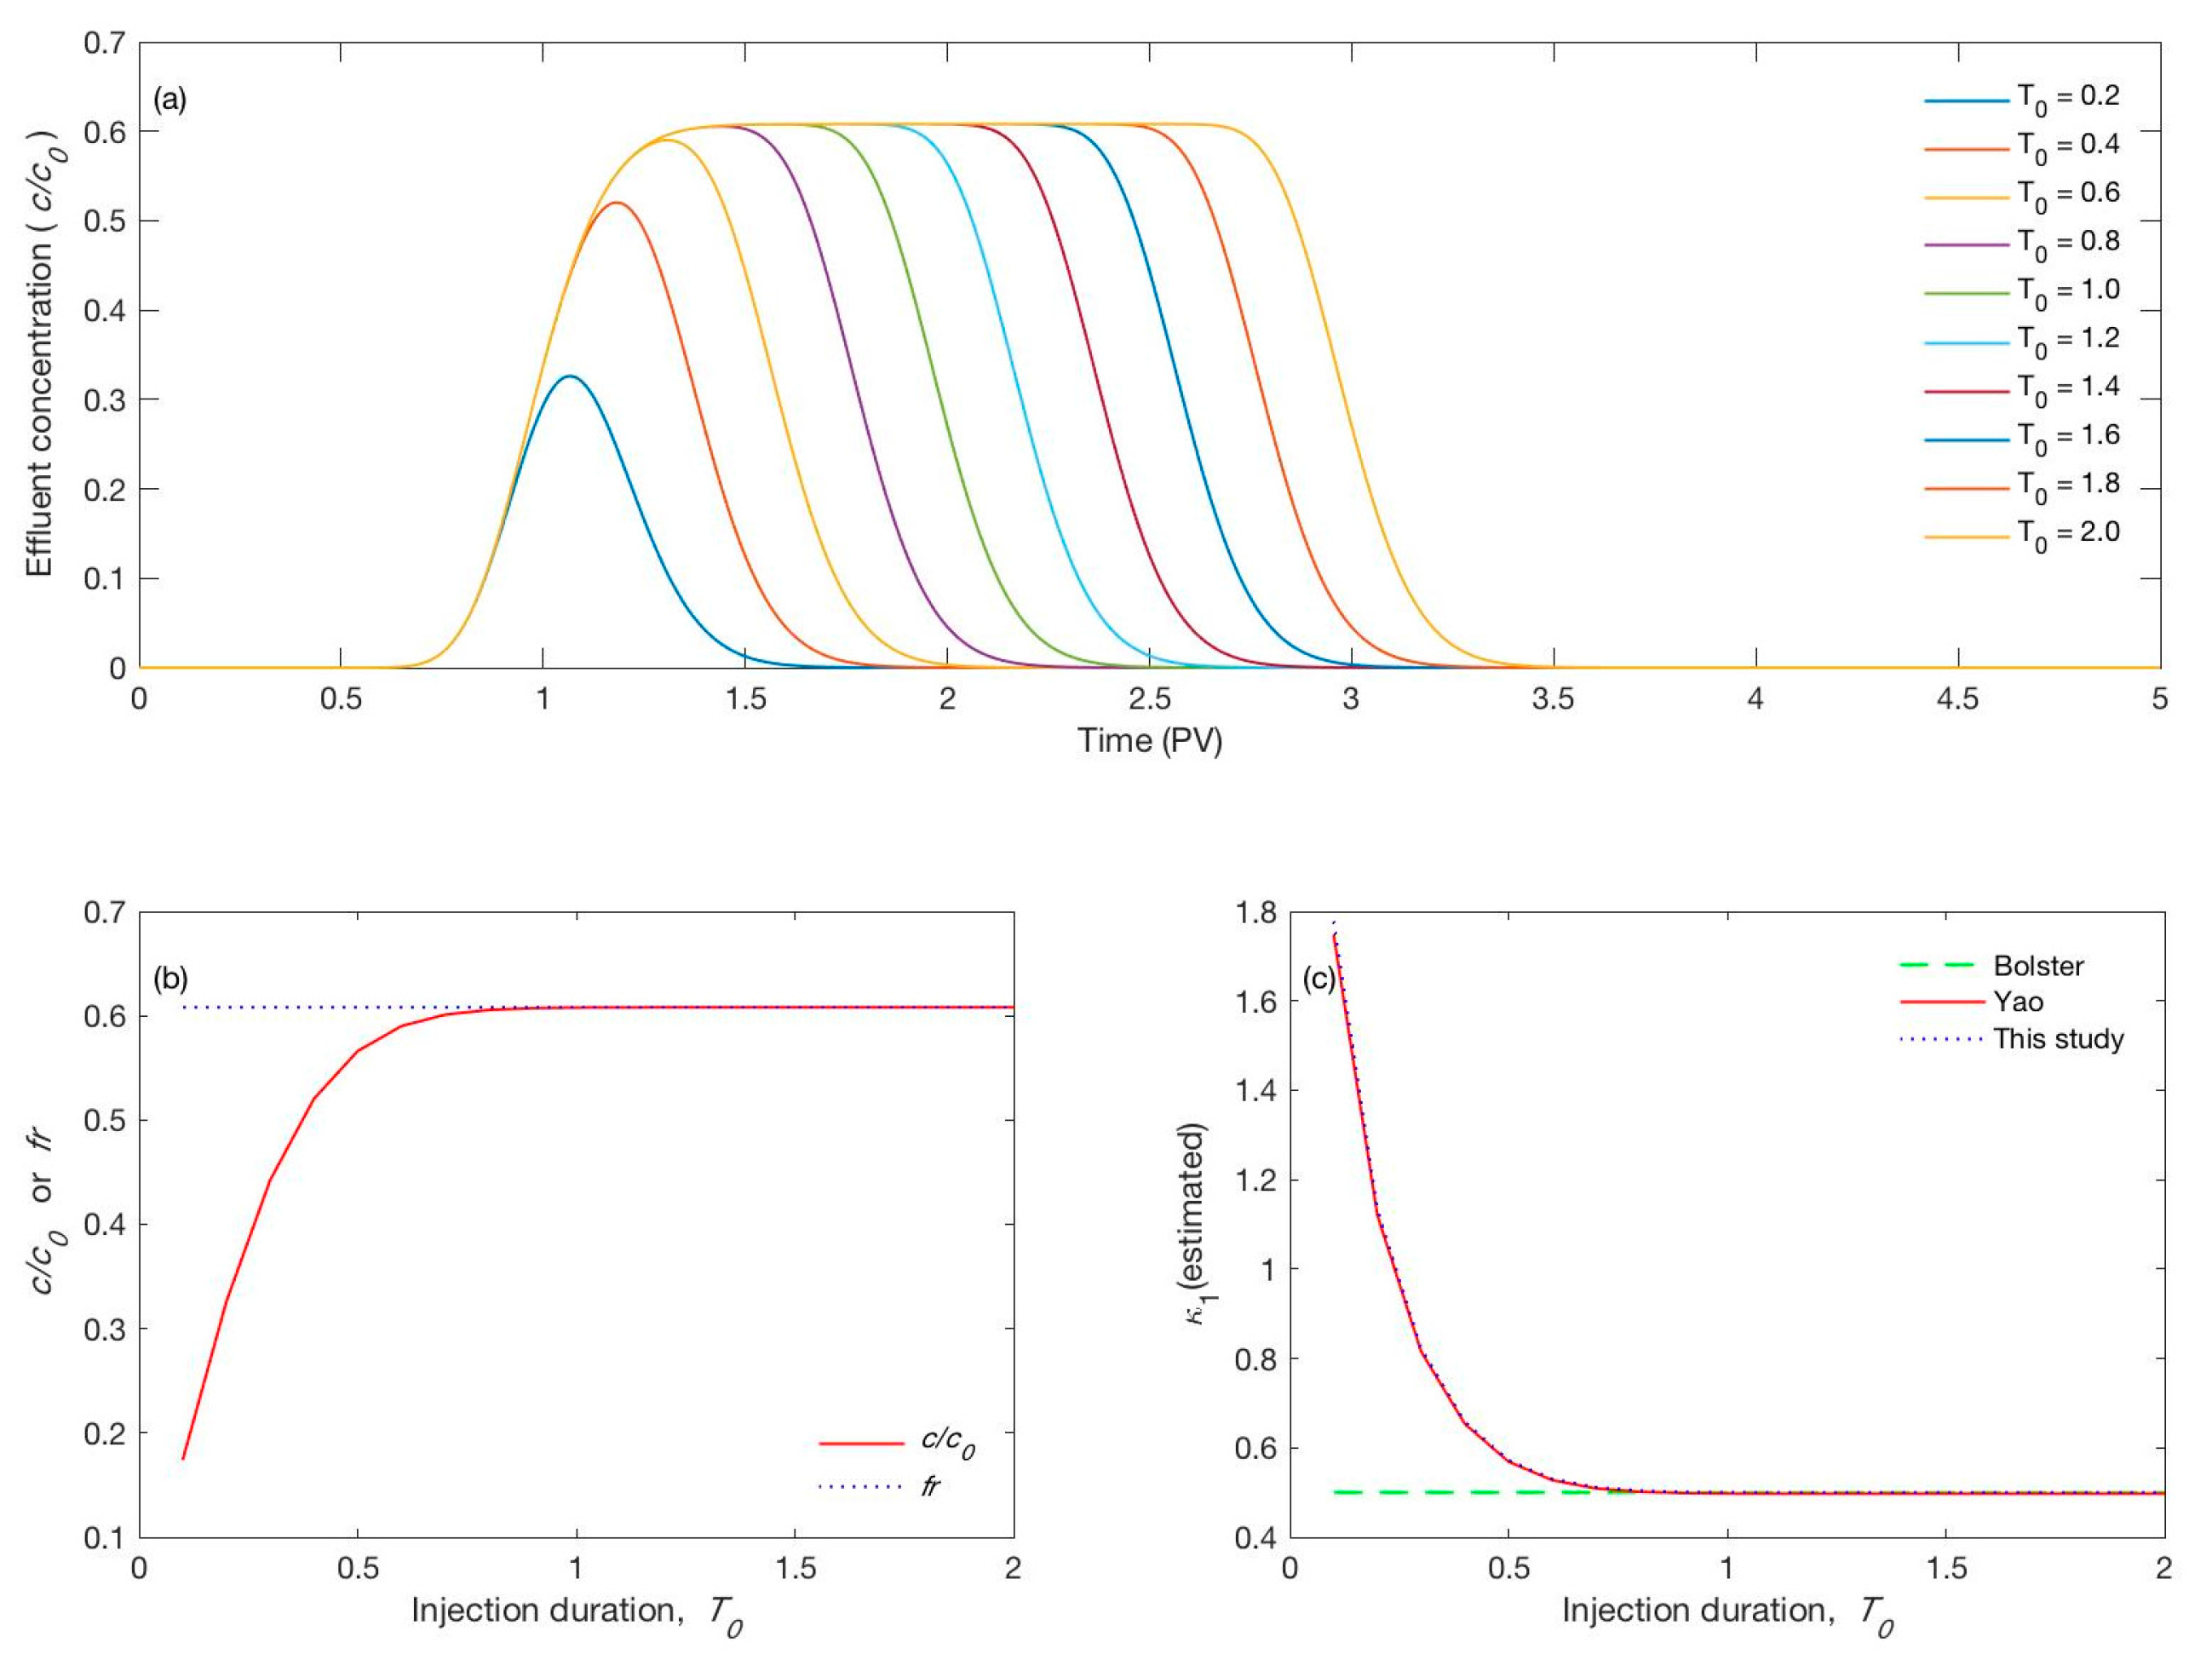
Since the methods of Yao et al. (1971) [7] and this study are strongly dependent on the c p e a k / c 0 , and c p e a k / c 0 is also dependent on the pulse duration (T0), sensitivity was performed on the effect of the pulse duration (T0 = 0.2–2.0) on the c p e a k / c 0 and κ 1 for a given Pe = 100 and κ 1 = 0.5 . As is shown in Figure 3a, the BTC shows different shapes depending on the pulse injection time. The longer the duration, the higher and wider the plateau of the peak. Thus, c p e a k / c 0 decreases with decreasing pulse duration (Figure 3a), and c p e a k / c 0 = f r (Figure 3b) for T0 > 0.8 which results in a result idential to that achieved by the method of Bolster et al. (1981) [8]. However, for T0 < 0.8 values of κ 1 in the equations put forth by Yao et al. (1971) [7] and this study are severely overestimated (Figure 3c). Therefore, in order to adopt the simple method, a pulse duration of at least 0.8 pore volume is required for the porous media exhibiting Pe = 100.

3.2.3. Applicablility of the New Method for the Estimation of κ 1

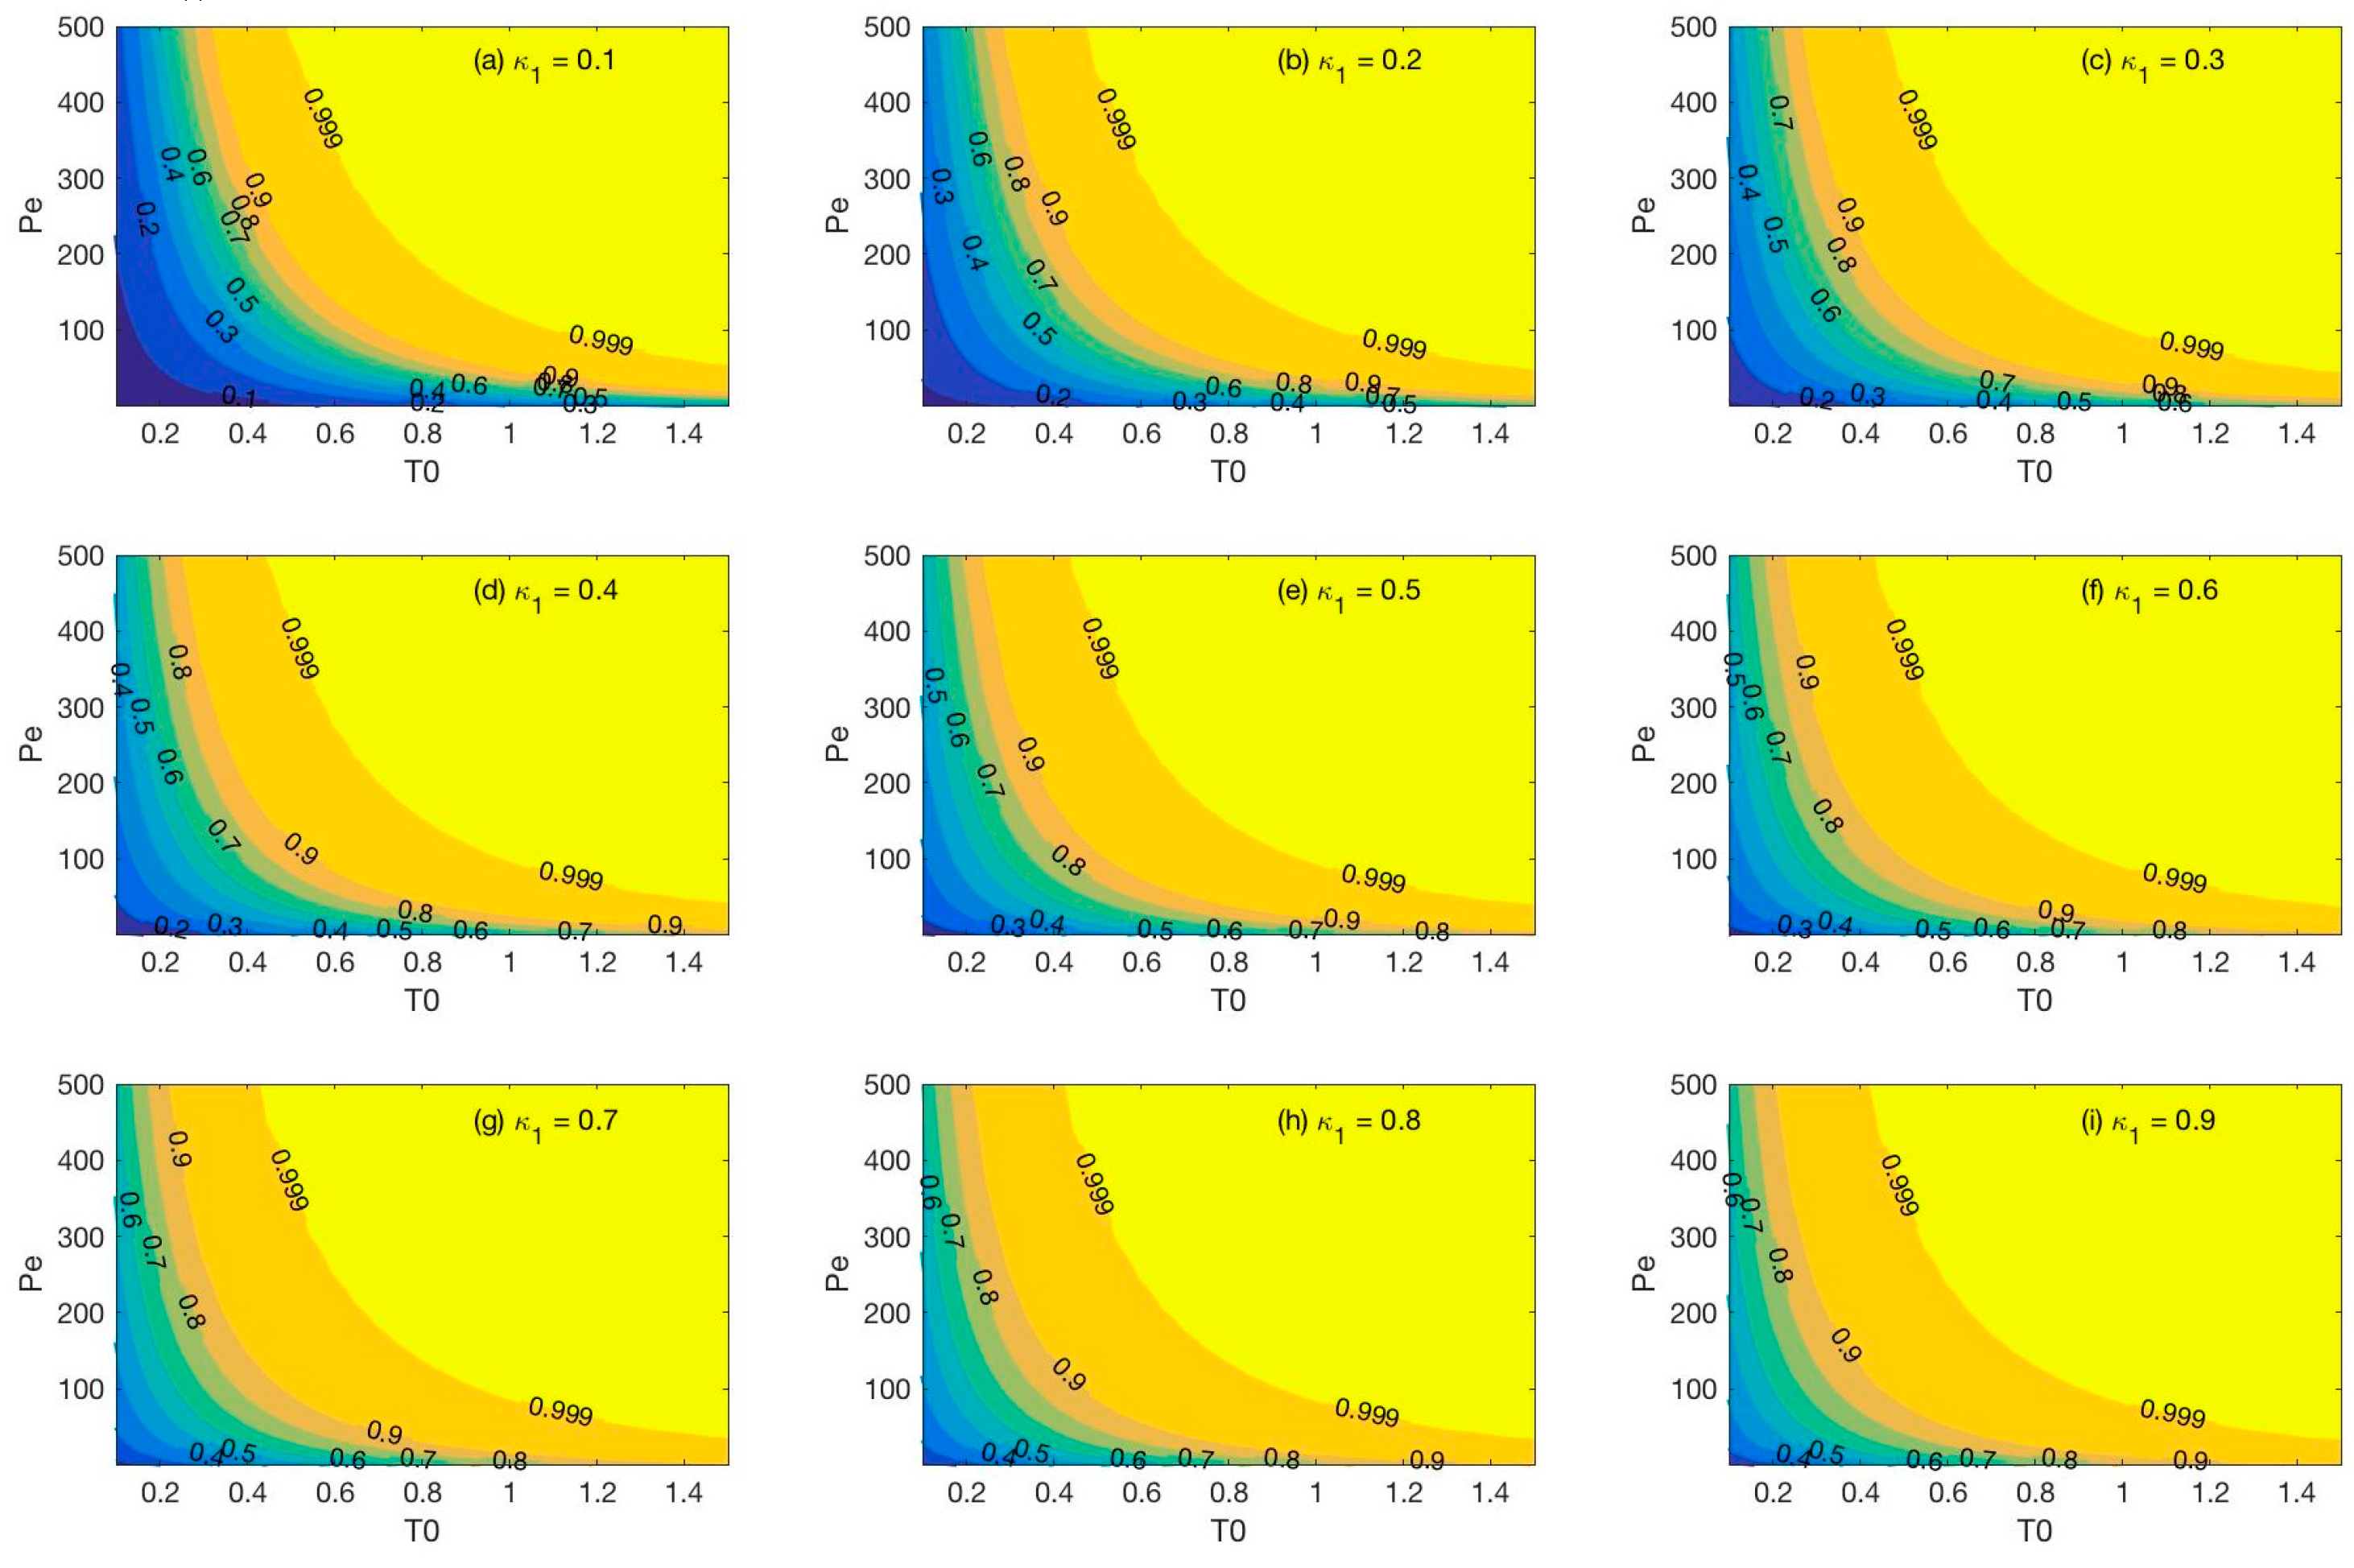
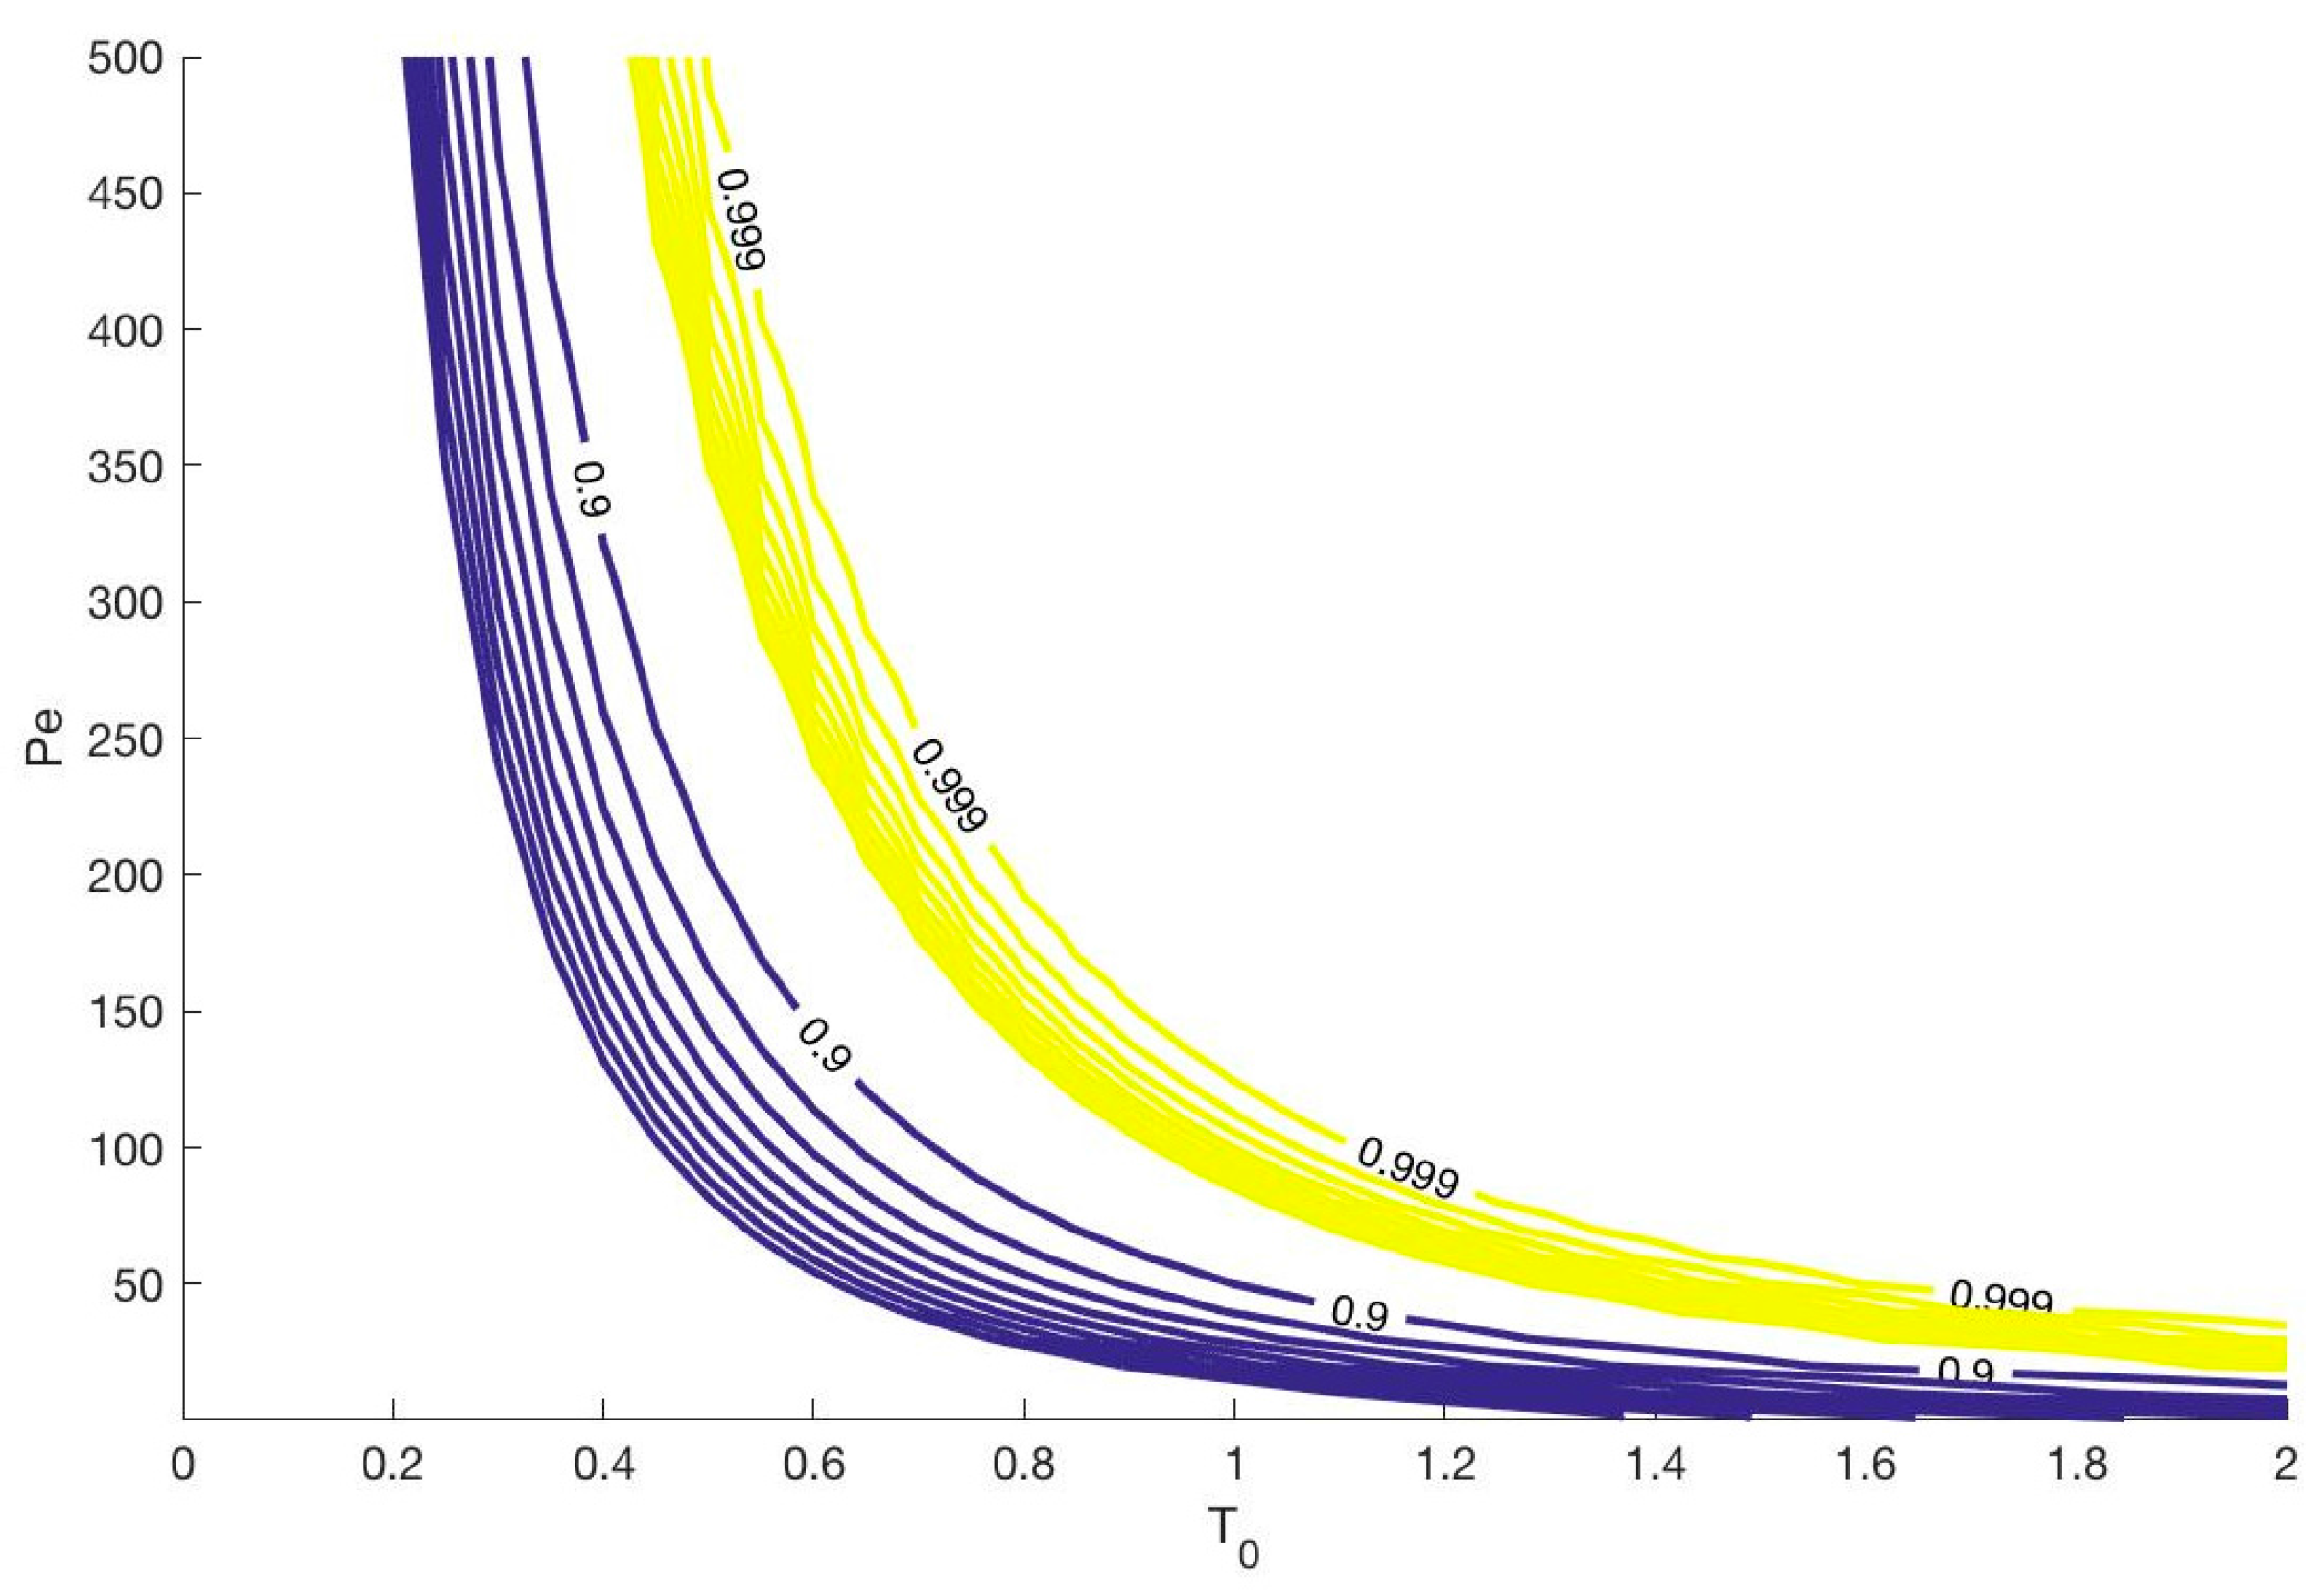
Numerous BTCs were simulated with wide ranges of Pe, T0 and κ 1 to find the condition where the new method is applicable. Using c p e a k / c 0 to obtain the simulated BTCs, κ 1 was estimated and its accuracy was calculated as a ratio of the given κ 1 to the estimated κ 1 . The accuracy is presented in Figure 4 as a function of Pe, T0 and κ 1 . The estimated κ 1 is accurate for longer pulse input with high Pe. The high accuracy condition is shown in Figure 5. The accuracy lines were also dependent on the given κ 1 . Above the band of 0.999 accuracy, the new method can estimate the exact value of κ 1 . For example, in our previous study, dispersion in the column filled with coarse sand showed Pe of 250–550. Figure 5 shows that the new method could be valid for the condition of a pulse duration greater than 0.8 pore volume.

4. Conclusions

In this study, we proposed a simple method for calculating the deposition coefficient, which is based on the analytical solution of the advection-dispersion-deposition equation obtained for step input. The simple method offered a slightly different form compared to the methods of Bolster et al. (1998) [8] and Yao et al. (1971) [7], with for minor modifications. Sensitivity analyses were then performed on various Pe values and pulse durations. Theoretical anlysis revealed that for Pe > 300 and a pulse duration greater than 0.8 pore volume, the simple method could be used for short pulse input, and suggested the conditions of pulse duration and Pe where the method is available. An advantage of the simple method can be found in the fact that it can be used for both square pulse and step injections, and in that it no longer requires the calculation of mass fraction from the bacterial BTC.

Acknowledgments

This subject is supported by Korea Ministry of Environment (MOE) as “GAIA (Geo-Advanced Innovative Action) Project (ARQ201502032001)”. This work was also supported by the institutional program grant (2E27030) from the Korea Institute of Science and Technology. We also thank professor Dong-Ju Kim’s insightful suggestions.

Author Contributions

N.-C.C. carried out the transport experiments, participated in the reference research and drafted the manuscript. J.-W.C. participated in the design of the study, and supervised the research work. S.-G.L. carried out the model analysis. K.-S.K. and B.-J.K. helped to review and to edit the manuscript. S.L. conceived of the study, and participated in its design and coordination and helped to draft the manuscript. All authors read and approved the manuscript.

Conflicts of Interest

The authors declare that they have no competing interests.

References

  1. Abramson, A.; Brown, D.G. Influence of solution ionic strength on the collision efficiency distribution and predicted transport distance of a Sphingomonas sp. Flowing through porous media. Water Res. 2007, 41, 4435–4445. [Google Scholar] [CrossRef] [PubMed]
  2. Kim, H.N.; Walker, S.L. Escherichia coli transport in porous media: Influence of cell strain, solution chemistry, and temperature. Colloids Surf. B Biointerfaces 2009, 71, 160–167. [Google Scholar] [CrossRef] [PubMed]
  3. Gargiulo, G.; Bradford, S.; Simunek, J.; Ustohal, P.; Vereecken, H.; Klumpp, E. Bacteria transport and deposition under unsaturated conditions: The role of the matrix grain size and the bacteria surface protein. J. Contam. Hydrol. 2007, 92, 255–273. [Google Scholar] [CrossRef] [PubMed]
  4. Chen, G.; Walker, S.L. Fecal indicator bacteria transport and deposition in saturated and unsaturated porous media. Environ. Sci. Technol. 2012, 46, 8782–8790. [Google Scholar] [CrossRef] [PubMed]
  5. Syngouna, V.I.; Chrysikopoulos, C.V. Transport of biocolloids in water saturated columns packed with sand: Effect of grain size and pore water velocity. J. Contam. Hydrol. 2011, 126, 301–314. [Google Scholar] [CrossRef] [PubMed]
  6. Fang, J.; Xu, M.J.; Wang, D.J.; Wen, B.; Han, J.Y. Modeling the transport of TiO2 nanoparticle aggregates in saturated and unsaturated granular media: Effects of ionic strength and pH. Water Res. 2013, 47, 1399–1408. [Google Scholar] [CrossRef] [PubMed]
  7. Yao, K.M.; Habibian, M.M.; Omelia, C.R. Water and waste water filtration—Concepts and applications. Environ. Sci. Technol. 1971, 5, 1105–1112. [Google Scholar] [CrossRef]
  8. Bolster, C.H.; Hornberger, G.M.; Mills, A.L.; Wilson, J.L. A method for calculating bacterial deposition coefficient using the fraction of bacteria recovered from laboratory columns. Environ. Sci. Technol. 1998, 32, 1329–1332. [Google Scholar] [CrossRef]
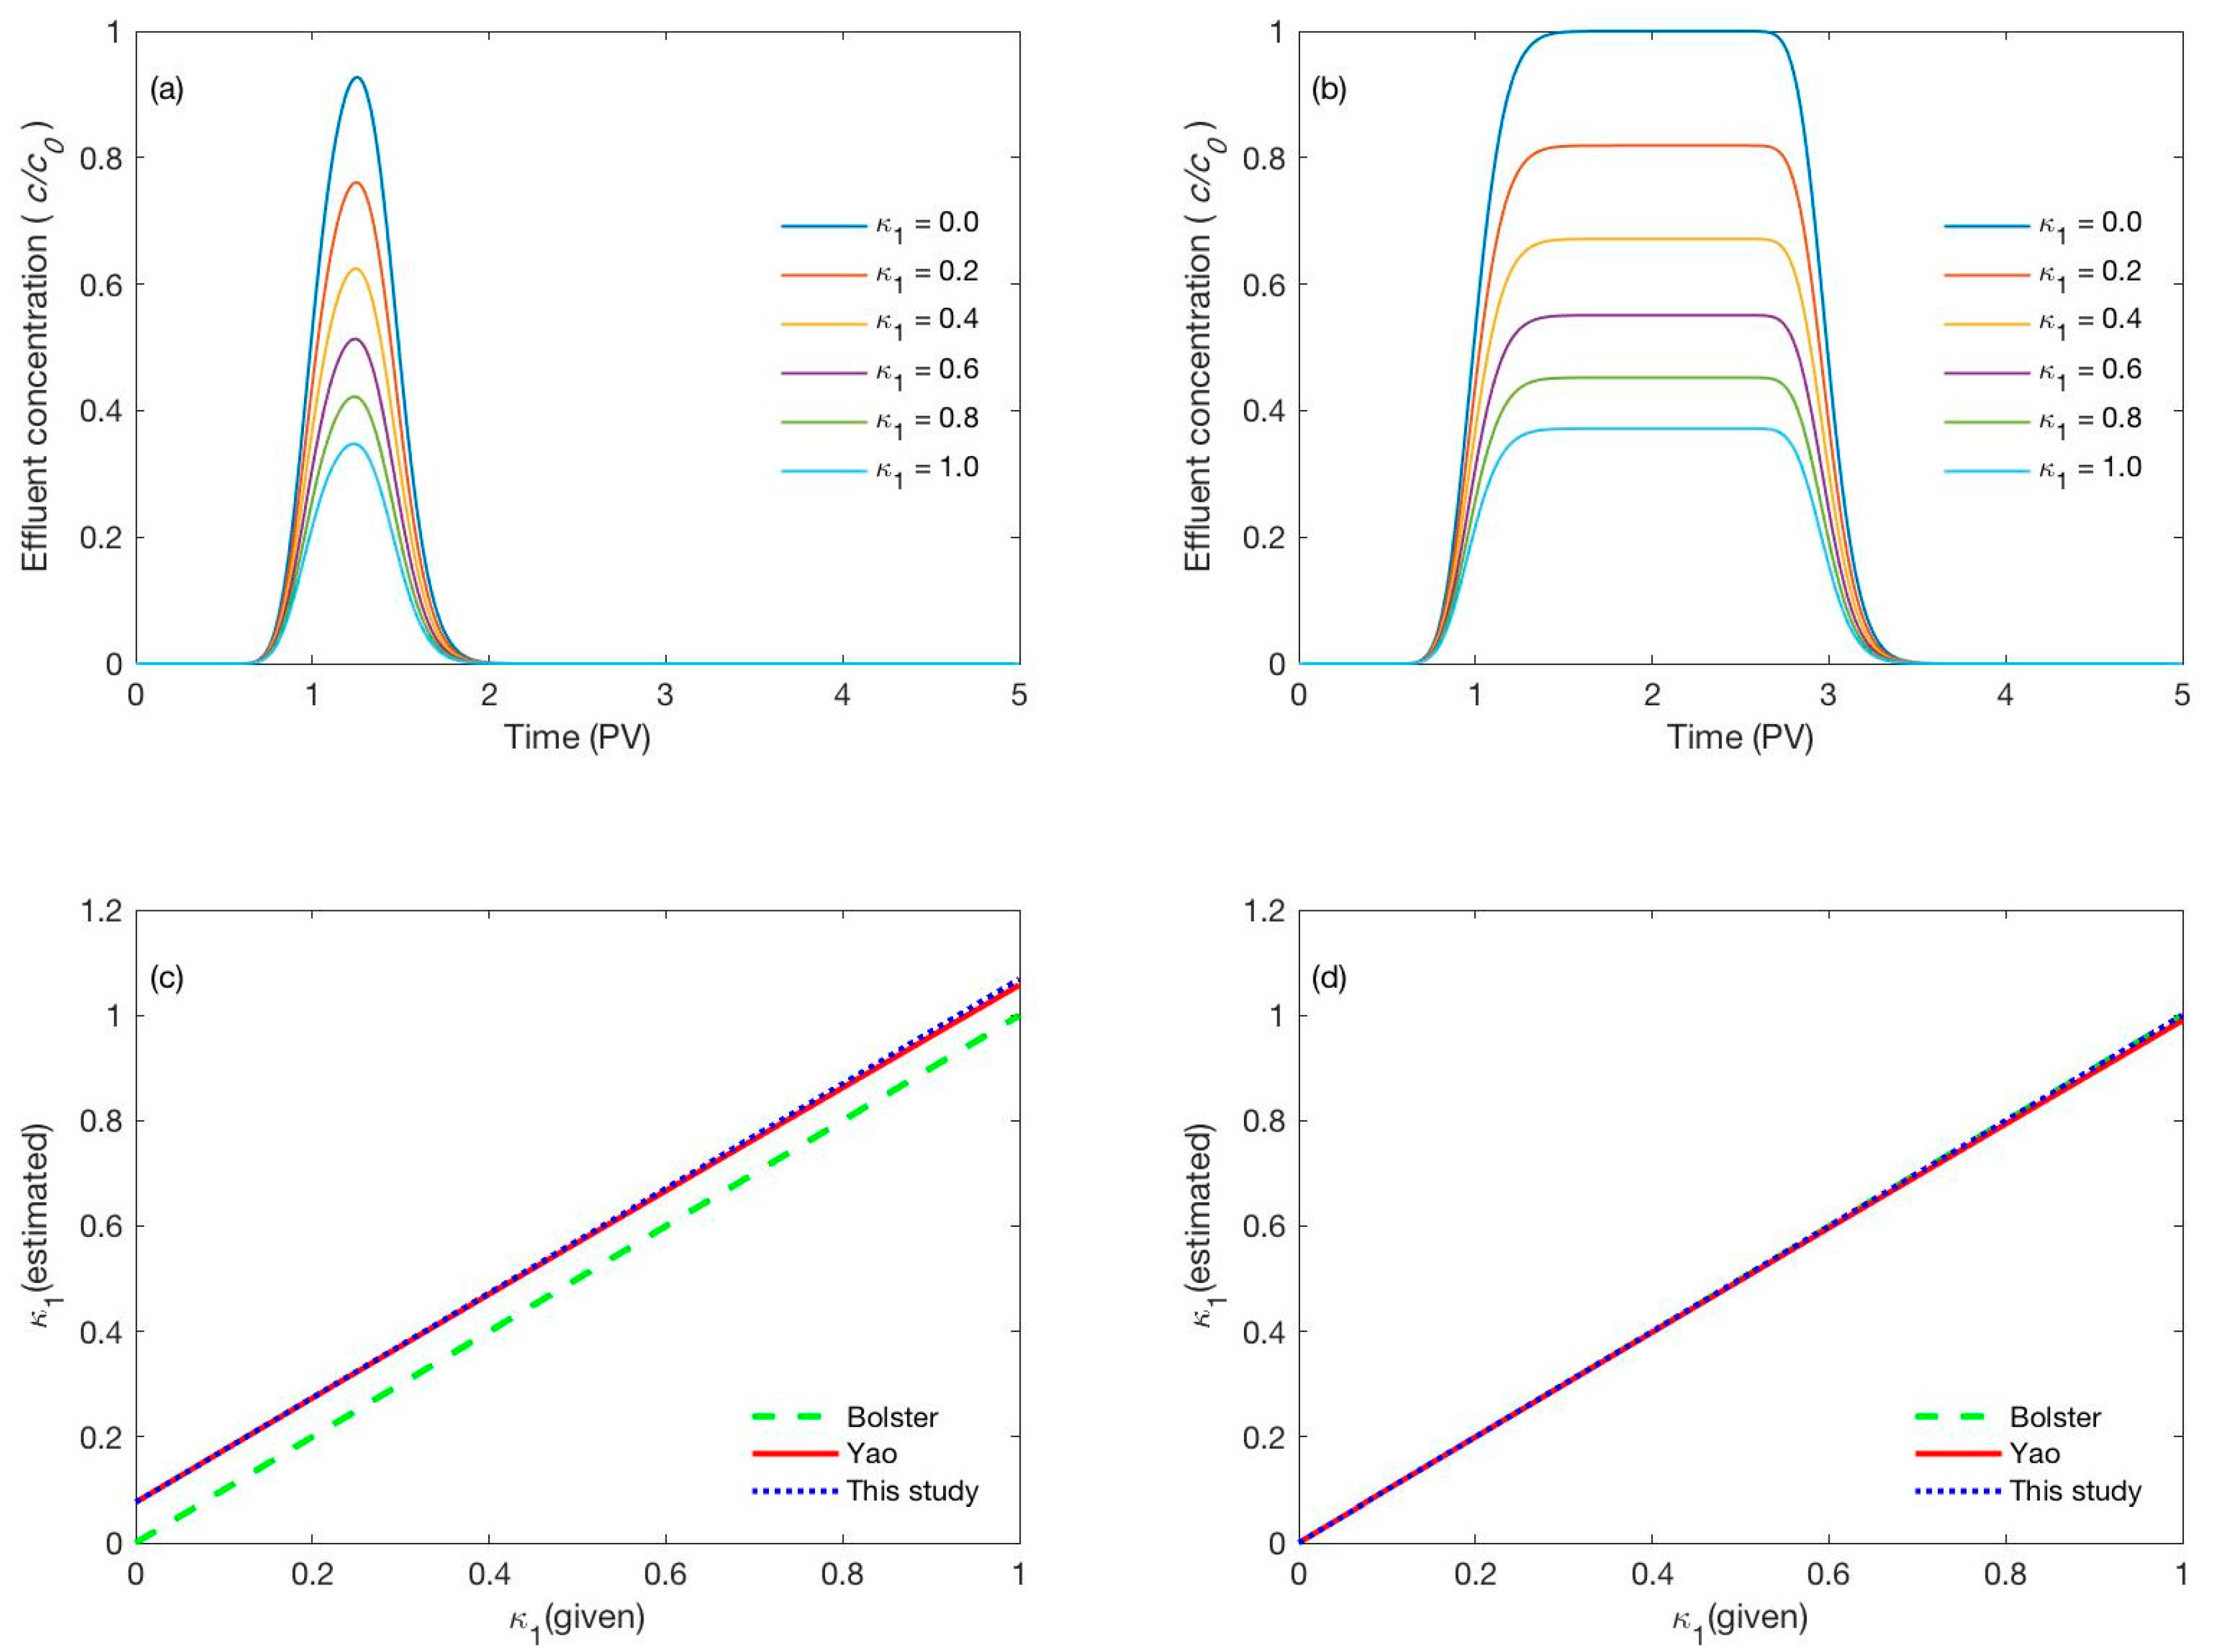
Figure 1. Simulated breakthrough curves (BTCs) with various κ 1 values for (a) short and (b) long pulses, and comparison of κ 1 between the given and estimated values by three methods for (c) short and (d) long pulses.
Water 09 00398 g001
Figure 2. Simulated BTCs with various P e ( P e = 10–700 ) for the (a) short and (b) long pulse injection, and comparison of κ 1 between the given and estimated values by three methods for (c) short and (d) long pulses.
Water 09 00398 g002aWater 09 00398 g002b
Figure 3. (a) Simulated BTCs with various injection durations (T0 = 0.2–2.0); (b) comparison of c p e a k / c 0 and fr; and (c) κ 1 estimated by the three methods for various injection durations T0.
Water 09 00398 g003
Figure 4. Accuracy of κ 1 estimation method suggested in this study as a function of the injection duration (T0) and Peclet number ( P e ). Here, the accuracy was calculated as a ratio of the given κ 1 to the estimated κ 1 .
Water 09 00398 g004
Figure 5. Bands of the accuracy 0.9 and 0.999 for the κ 1 estimation method suggested in this study. Here, the accuracy was calculated as a ratio of the given κ 1 to the estimated κ 1 from the simulated BTCs.
Water 09 00398 g005
Table 1. Comparison of the equation of the deposition coefficient between the new method proposed in this study and previous studies in the literature.
k 1 Reference
κ 1   = ln f r + ( ln f r ) 2 / P e Bolster et al. (1998) [8]
κ 1   = ln ( c s / c 0 ) Yao et al. (1971) [7]
κ 1   = ln ( c s / c 0 ) + ( ln ( c s / c 0 ) ) 2 / P e This study
Table 2. Ranges of parameters ( κ 1 , P e and T 0 ) used for the sensitivity analysis.
Cases κ 1 P e T 0
κ 1 analysis0.1–1.01000.5, 2
P e analysis0.510–8000.5, 2
T 0 analysis0.51000.1–2
Table 3. Estimation of deposition coefficients ( κ 1 ) from the simulated BTC for short, long pulse and step injection modes, and the comparison of the estimated κ 1 with the given κ 1 = 0.50.
ParametersStepShort PulseLong PulseRemark
Pe100100100Parameters used for the simulation of BTC
κ 1 (given)0.500.500.50
T 0 -0.502.00
c s / c 0 0.61--Obtained from BTC
c p e a k / c 0 -0.560.61
f r -0.610.61
κ 1 (estimated)-0.500.50Bolster et al. (1998) [8]
κ 1 (estimated)0.50-0.50Yao et al. (1971) [7]
κ 1 (estimated)0.500.570.50This study