Article

Sorption Dynamics of Uranium onto Anion Exchangers

DVGW-Technologiezentrum Wasser (TZW), Karlsruher Str. 84, 76139 Karlsruhe, Germany
*
Author to whom correspondence should be addressed.
Water 2017, 9(4), 268; https://doi.org/10.3390/w9040268
Submission received: 20 December 2016 / Revised: 22 March 2017 / Accepted: 4 April 2017 / Published: 10 April 2017

Abstract

:
Uranium can occur naturally in groundwater which is used for drinking water production. Depending on its concentration levels, uranium elimination might become necessary. In German waterworks, anion exchange technology represents the state of the art for selective uranium removal. Operation times usually vary between one and two years until the exchanger is exhausted. In order to study uranium removal by anion exchange on a scientific base, column experiments at the pilot scale were performed in several waterworks. The resin with the highest capacity for uranium showed operation times between 120,000 and >300,000 bed volumes until breakthrough occurred, strongly depending on the water composition. To forecast uranium breakthrough on a theoretical base, a computer program was established using the model of combined film and surface diffusion. Both equilibrium data and kinetic parameters necessary for applying the model had been determined in previous research work. Modelled breakthrough curves were compared to experimental data from lab scale column experiments. As a rule, the time-dependency of the column effluent concentration can be well predicted by the theoretical model. By modelling the sorption dynamics, diffusion through the liquid film was identified as the rate controlling transport step. By increasing the filter velocity, the thickness of the liquid film decreases and the diffusion in the liquid accelerates. As a consequence for treatment plants in waterworks, the filter velocity can be increased by optimising the filter geometry. A smaller filter diameter is more appropriate for efficient uranium adsorption and longer times of operation might be achieved.

1. Introduction

Naturally occurring uranium in rocks and soils leads to its presence in groundwater. In some cases considerable uranium concentrations in groundwater have been observed due to anthropogenic impacts such as agricultural and mining activities [1,2,3,4]. Due to its chemical toxicity, the occurrence of elevated levels of uranium in drinking water poses a health risk. Therefore, several drinking water standards for uranium exist worldwide. While the US Environmental Protection Agency (EPA) introduced a standard of 30 µg/L [5], the World Health Organisation (WHO) recommends a lower value of 15 µg/L [6]. In Germany, a standard of 10 µg/L has been implemented [7].
In nature, uranium is found in oxidation states varying from +2 to +6. In water, it forms the stable uranyl ion (UO22+) which predominates at acid conditions. At neutral pH conditions, the speciation depends on the counter ions and their concentrations. Under typical groundwater conditions, the predominant uranium species are UO2(CO3)22− und UO2(CO3)34− [8,9,10]. Other literature sources mention the existence of non-negligible uranium complexes with different alkaline earth metals such as calcium and magnesium [11,12,13,14,15].
Various theoretical predictions on uranium speciation at different water compositions and at varying pH values have been published [10,16,17,18,19]. A calculated uranium speciation without considering alkaline earth metals complexes is shown in Figure 1 [17]. At pH values between 7 and 8 the divalent UO2(CO3)22− and the tetravalent UO2(CO3)34− complexes mainly exist. With increasing pH, the tetravalent complex becomes predominant.
The divalent uranyl carbonate ion UO2(CO3)22− and especially the tetravalent complex UO2(CO3)34− show a very high affinity to anion exchangers because of their high negative charges of −2 and −4, respectively. In the case of the existence of the neutral calcium uranyl carbonate complex Ca2UO2(CO3)3, no ion exchange can take place. However, according to the literature, at neutral pH conditions a divalent anionic complex of uranium and calcium (CaUO2(CO3)32−) might exist as well [11,12,14,15,19].
As in some areas, uranium concentrations in groundwater exceed these standards, and uranium removal during drinking water preparation becomes necessary. Besides flocculation, nanofiltration, or reverse osmosis, anion exchange is an appropriate technology for uranium removal from water. A major advantage of anion exchangers is their high selectivity for uranium which leads to long operation times and low costs. Furthermore, the natural water composition remains almost unchanged during anion exchange treatment (which, e.g., is not the case for treatment of the water by membranes). In contrast to flocculation processes, ion exchange needs no dosage of chemicals and thus ion exchange technology represents the state of the art for uranium removal in all cases where no additional elimination of turbidity or microorganisms is necessary.
In general, both weak and strong ion exchangers are appropriate for selective uranium elimination. During drinking water treatment, strong base anion exchangers (SBA) show a greater sorption capacity towards uranium than weak base anion exchangers (WBA) [20]. This is due to the bigger adsorption capacity of SBA in the neutral pH range, as the functional groups of SBA remain positively charged in nearly the whole pH range. In contrast, the functional amino groups of WBA become deprotonated above a certain pH and thus, the capacity decreases.
When the resin is exhausted, the exchanger is replaced by either a new product or by a regenerated resin. Typically, no resin regeneration is performed onsite. In Germany, products and materials used during drinking water treatment have to be approved by the Federal Environmental Agency (UBA). For uranium removal, one SBA and one WBA resin are listed as approved materials [21].
According to practical experience, the operation period of anion exchangers in waterworks until their replacement lasts between one and two years. The breakthrough of uranium usually is determined by analytical measurements in the filter effluent. In this work, a mathematical model has been implemented and compared to the breakthrough behaviour of uranium observed in bench scale and full scale experiments. Additionally, the mathematical model has been used for the investigation of the impact of different parameters like the particle diameter, particle diffusion coefficient, and mass transfer coefficient in the liquid phase on the breakthrough behaviour, and for deriving the consequences for the operation of the anion exchangers in waterworks. Finally, the regeneration of uranium exhausted anion exchangers has been investigated in bench scale systems.

2. Materials and Methods

2.1. Exchangers

Bench scale column experiments on uranium removal and resin regeneration have been performed using two commercially available weak basic anion exchangers: the acrylic acid-divinyl benzene based resin Amberlite IRA 67 from DOW Chemical company (at that time, Rohm and Haas Company) and the polystyrene-divinyl benzene based anion exchanger Lewatit MP 62 from Lanxess. Amberlite IRA 67 possesses tertiary and secondary amine groups while Lewatit MP 62 contains only tertiary amine groups. Table 1 shows data on the characteristic properties of the two resins which were used for the calculation of the column dynamics.
In order to remove impurities and residual monomers, the exchangers were preconditioned prior to use by repeated treatment with hydrochloric acid and caustic soda (each 1 N). Both exchangers were applied in the free base form after intensive rinsing with distilled water.
In the pilot scale experiments, the macro-porous strong base ion exchanger Lewatit S6368 from Lanxess was additionally investigated. This monodisperse resin with a bead diameter of 0.62 mm contains quaternary amine groups and is commercially available in chloride form.

2.2. Experimental Methods

2.2.1. Column Experiments

In the bench scale experiments, the column had an inner diameter of 2 cm and the bed height was 8 cm, resulting in a resin volume of 25 mL. The resin was fixed between two layers of glass beads. The flow through the column (Q) was in the upstream direction with an adjusted flow rate of 20 bed volumes per hour (BV/h). The raw water used for the experiments was uranium spiked tap water. Due to continuous stripping of carbon dioxide during the experiments, the raw water would exhibit an increasing pH value over time. To avoid this unwanted effect, an adjustment of pH was performed by means of aeration with carbon dioxide in the reservoir. To avoid the growth of algae, the raw water in the reservoir (PE, 55 L) was replaced regularly.
Uranium concentrations in the effluent of the columns were measured by ICP-MS (Inductively Coupled Plasma Mass Spectrometry) according to DIN EN ISO 17294-2 [22] in samples taken by an automatic sampler. Furthermore, both the feed and effluent pH were measured continuously.
Initial uranium concentrations of the raw water were adjusted to 1000 µg/L by dosing an aqueous solution of uranyl nitrate (UO2(NO3)2) from Merck. This is about 10 to 20 times higher than the highest naturally occurring uranium concentrations in German groundwater. This high concentration was chosen to avoid operation periods longer than several months.
Additional column experiments were carried out in two German waterworks with uranium concentrations in their raw waters between 60 and 80 µg/L. In these experiments, filter columns with an inner diameter of 10 cm were used. With an exchanger bed height of 1 m, the resin volume was about 8 L. The specific flow Q was adjusted to a value between 25 and 60 BV/h.

2.2.2. Regeneration

The regeneration of the anion exchangers was studied in batch as well as in column experiments. For the experiments, weak basic anion exchangers that have been loaded with uranium by lab column experiments or by application in a pilot scale plant were used.
Mean uranium loadings of the exchangers were calculated by integrating the experimental data of the uranium breakthrough during column operation. This calculated value was the basis for determining the efficiency of regeneration.
Batch experiments were performed with resins from a pilot plant. The resin samples were taken by mixing sub-samples from the whole filter material to compensate for the axial differences of uranium loading. Resin samples were centrifuged for 20 min at 1300 g to remove water adhering at the surface of the resin beads. The weighed resin mass was corrected for the mass of adsorbed uranium using the mean uranium loading. This was about 1% for the exchangers from the pilot scale plants and about 7% for the resins used in bench scale columns. Other adsorbed water constituents like sulphate, carbonate, and organic matter were not taken into account for mass correction. Thus the removal efficiency for uranium is underestimated by this approach.
For the batch regeneration experiments, resin samples were brought into contact with the regenerant (0.5 M sulphuric acid or 1 M caustic soda) for at least 16 h without stirring. After separating the exchanger material from the regenerant by decantation and washing the resin with deionised water, a fresh batch of the other regenerant was put in contact with the resin. After each step of regeneration, the uranium concentration in the regenerant was quantified analytically.
Column experiments for regeneration were performed directly after the bench scale filter loading using identical equipment. 1 M caustic soda was used as the regenerant. The regenerant flux was 8 BV/h in counter flow. During the regeneration process, the effluent was sampled in different time intervals for the analysis of uranium. The pH was measured continuously.

2.3. Modelling

To provide a theoretical prediction of the filter performance, a computer program was written in C++ language using finite-difference methods and both explicit and implicit calculation schemes. The Newton-Raphson method, dichotomy, and the sweep method were used for a numerical solution of the sets of relevant equations (see Section 3). The sweep method was used to calculate the loading distribution inside the ion exchanger particles. The Newton-Raphson method was applied to define the concentration and the loading related to the particle surface. If the numerical solution at the next calculation step was outside of the given range, a correct solution was found by means of the dichotomy (bisection) method [23,24].
A verification of the program was performed by firstly evaluating the calculated uranium concentrations in the filter effluent in relation to the theoretical stoichiometric breakthrough (relevant theoretical principles are given in Section 3). Furthermore, the influence of various parameters such as the particle diameter, filter density, equilibrium parameters (qmax and KL), and kinetic parameter (DS and βL) on the calculated breakthrough curves were checked.

3. Theoretical Description of Sorption Dynamics

Within a fixed bed sorption filter, species from the solution sorb onto ion exchanger particles until their loading is in equilibrium with the concentration of the species in the solution (assuming that the flow rate is slow enough to allow for equilibrium conditions to be reached). The increase of loading in a given layer of the filter leads to a corresponding decrease of the concentration in the solution. Thus, the profiles of filter loading and of the residual concentration in the solution are generated which propagate through the column. These profiles move with increasing operation time in the direction of the flow and finally the concentration in the effluent of the filter column increases. The concentrations in the liquid phase and loadings in the exchanger particles are, therefore, a function of both location in the filter and time.
Assuming unlimited fast kinetics, ideal plug-flow conditions through the filter, and favourable sorption equilibrium, the effluent concentration of a given species increases promptly at the stoichiometric breakthrough time tstoich. Deduced from a simple mass balance, tstoich can be calculated as shown in Equation (1) [25].
t s t o i c h = q 0 ρ F V F c 0 Q
In this equation, q0 (in g per g) denotes the equilibrium loading corresponding to the initial concentration c0, (in g/L), ρF is the bulk density (in g/L), VF is the filter volume (in m3), and Q is the axial water flow (in m3/h).
The treated volume of water until stoichiometric breakthrough occurs is expressed by Equation (2).
V s t o i c h [ B V ] = q 0 ρ F c 0
In a more realistic manner, the column performance can be mathematically predicted by the model of combined film and surface diffusion [25,26,27,28,29]. Based on an enhanced liquid phase mass balance of an infinitesimal bed layer (Equation (3)) combined with a kinetic approach of the transport in the solid phase corresponding to Fick’s law of diffusion (Equation (4)) and with the Langmuir relationship of the equilibrium between the liquid phase concentration at the particle surface and the exchanger loading at the particle outer layer (Equation (5)), three equations are available to determine the three dependent variables; concentration c, concentration at the particle surface c*, and the loading of the particle q (where the relevant initial and boundary conditions have to be taken into account). This theoretical prediction makes use of the parameters of sorption equilibrium (KL and qmax) and of sorption kinetics (βL and DS). For uranium adsorption to anion exchangers, these parameters have been determined in previous works [19,30].
ε δ c ( t ,   z ) δ t + v F δ c ( t , z ) δ z + 6 β L ( 1 ε ) d P ( c ( t , z ) c * ( t , z ) ) = 0
δ q ( t , z , r ) δ t = D S ( δ 2 q ( t , z , r ) δ r 2 + 2 r δ q ( t , z , r ) δ r )
q ( t , z , r = d P / 2 ) = q m a x K L c * 1 + K L c *
With: c = concentration (g/L), c* = concentration at the particle surface (g/L), DS = effective particle diffusion coefficient (m²/s), dP = particle diameter (m), q loading (g/g), qmax = Langmuir isotherm constant (g/g) (corresponds to the maximum loading), KL = Langmuir isotherm constant (L/g), r = radial intra-particle coordinate (m), t = time (s), z = axial filter coordinate (m), βL = liquid phase mass transfer coefficient (m/s), ε = bulk porosity.
The required boundary conditions to solve Equations (3)–(5) are:
  • No loading on the initial adsorbent:
    q ( t = 0 , z , r ) = 0
  • Symmetry of the loading at the centre of the particle:
    [ q ( t , z , r ) r ] r = 0 = 0
  • Film mass flow is equal to the mass flow at the exterior of the particle:
    [ q ( t , z , r ) r ] r = d P / 2 = β L ρ P D S ( c ( t , z ) c * ( t , z ) )
  • Increase of the mean solid phase loading is given by the mass flow through the film:
    q ¯ ( t , z ) t = 6 β L ρ P d P ( c ( t , z ) c * ( t , z ) ) = t [ 24 d P 3 0 d P 2 q ( t , z , r ) r 2 d r ]
  • Initial and boundary conditions for the concentration for the filter mass balance:
    c ( t = 0 ,   z ) = 0
    c ( t ,   z = 0 ) = c 0
Numerical solutions of this set of equations were obtained by developing a computer program (see Section 2 and Section 3).
In the combined film and surface diffusion model, the molecular transport until equilibrium that is reached is composed of two transport steps, the diffusion across the Nernst diffusion layer (“film”) and the diffusion inside the particle. Depending on the boundary conditions, one of these diffusion steps could become rate controlling and could slow down the other transport step which could be faster. Film-diffusion control is often encountered in the case of small particle sizes, high concentrations of functional groups at the exchanger, and diluted solutions. In the opposite conditions, the ion exchange process is often controlled by particle diffusion [31,32,33,34].
By relating the mass flows in the liquid phase and the solid phase, respectively, to the convective flow through the filter column, dimensionless forms of the equations are obtained. These are the surface diffusion modulus Ed (Equation (12)), the modified Stanton number St* (Equation (13)), and the Biot number Bi (Equation (14)).
E d = 4 D S C F τ d P 2 r a t e   o f   t r a n s p o r t   b y   i n t r a p a r t i c l e   s u r f a c e   d i f f u s i o n r a t e   o f   t r a n s p o r t   b y   c o n v e c t i o n
S t * = 2 ( 1 ε ) β L τ d P ε r a t e   o f   t r a n s p o r t   b y   f i l m   t r a n s f e r r a t e   o f   t r a n s p o r t   b y   c o n v e c t i o n
B i = d P c 0 β L 2 ρ P q 0 D S r a t e   o f   t r a n s p o r t   b y   f i l m   t r a n s f e r r a t e   o f   t r a n s p o r t   b y   i n t r a p a r t i c l e   s u r f a c e   d i f f u s i o n
With: c0 = initial concentration (g/L), CF = capacity factor (see Equation (7)), DS = effective particle diffusion coefficient (m²/s), dP = particle diameter (m), q0 = loading in equilibrium to c0 = (g/g), βL liquid phase mass transfer coefficient (m/s), ε = bulk porosity, ρF filter density (g/L), ρP = sorbent density (g/L), τ = effective residence time (s).
The capacity factor CF used in Equation (6) is defined by Equation (15).
C F = q 0 ρ F c 0 ε
The surface diffusion modulus Ed compares the rate of intra-particle transfer of uranium species to the rate by which uranium is transported in an axial direction by fluid flow. With an increasing value of Ed, the transport rate of intra-particle diffusion becomes large compared to the transport rate in the axial direction through the filter column. Very small values of Ed indicate that the intra-particle transport is negligible compared to the axial transport.
The modified Stanton number St* compares the rate of film diffusion to the convective transport through the filter. Thus, high Stanton numbers indicate that the film diffusion is not the transport controlling process.
The Biot number Bi describes the ratio of film diffusion to intra-particle diffusion. High Biot numbers (Bi > 50–100) indicate intra-particle diffusion to be rate controlling. Small Biot numbers (Bi > 0.5–1), however, reveal film diffusion to control the overall transport [25,27].

4. Results

4.1. Filter Dynamics

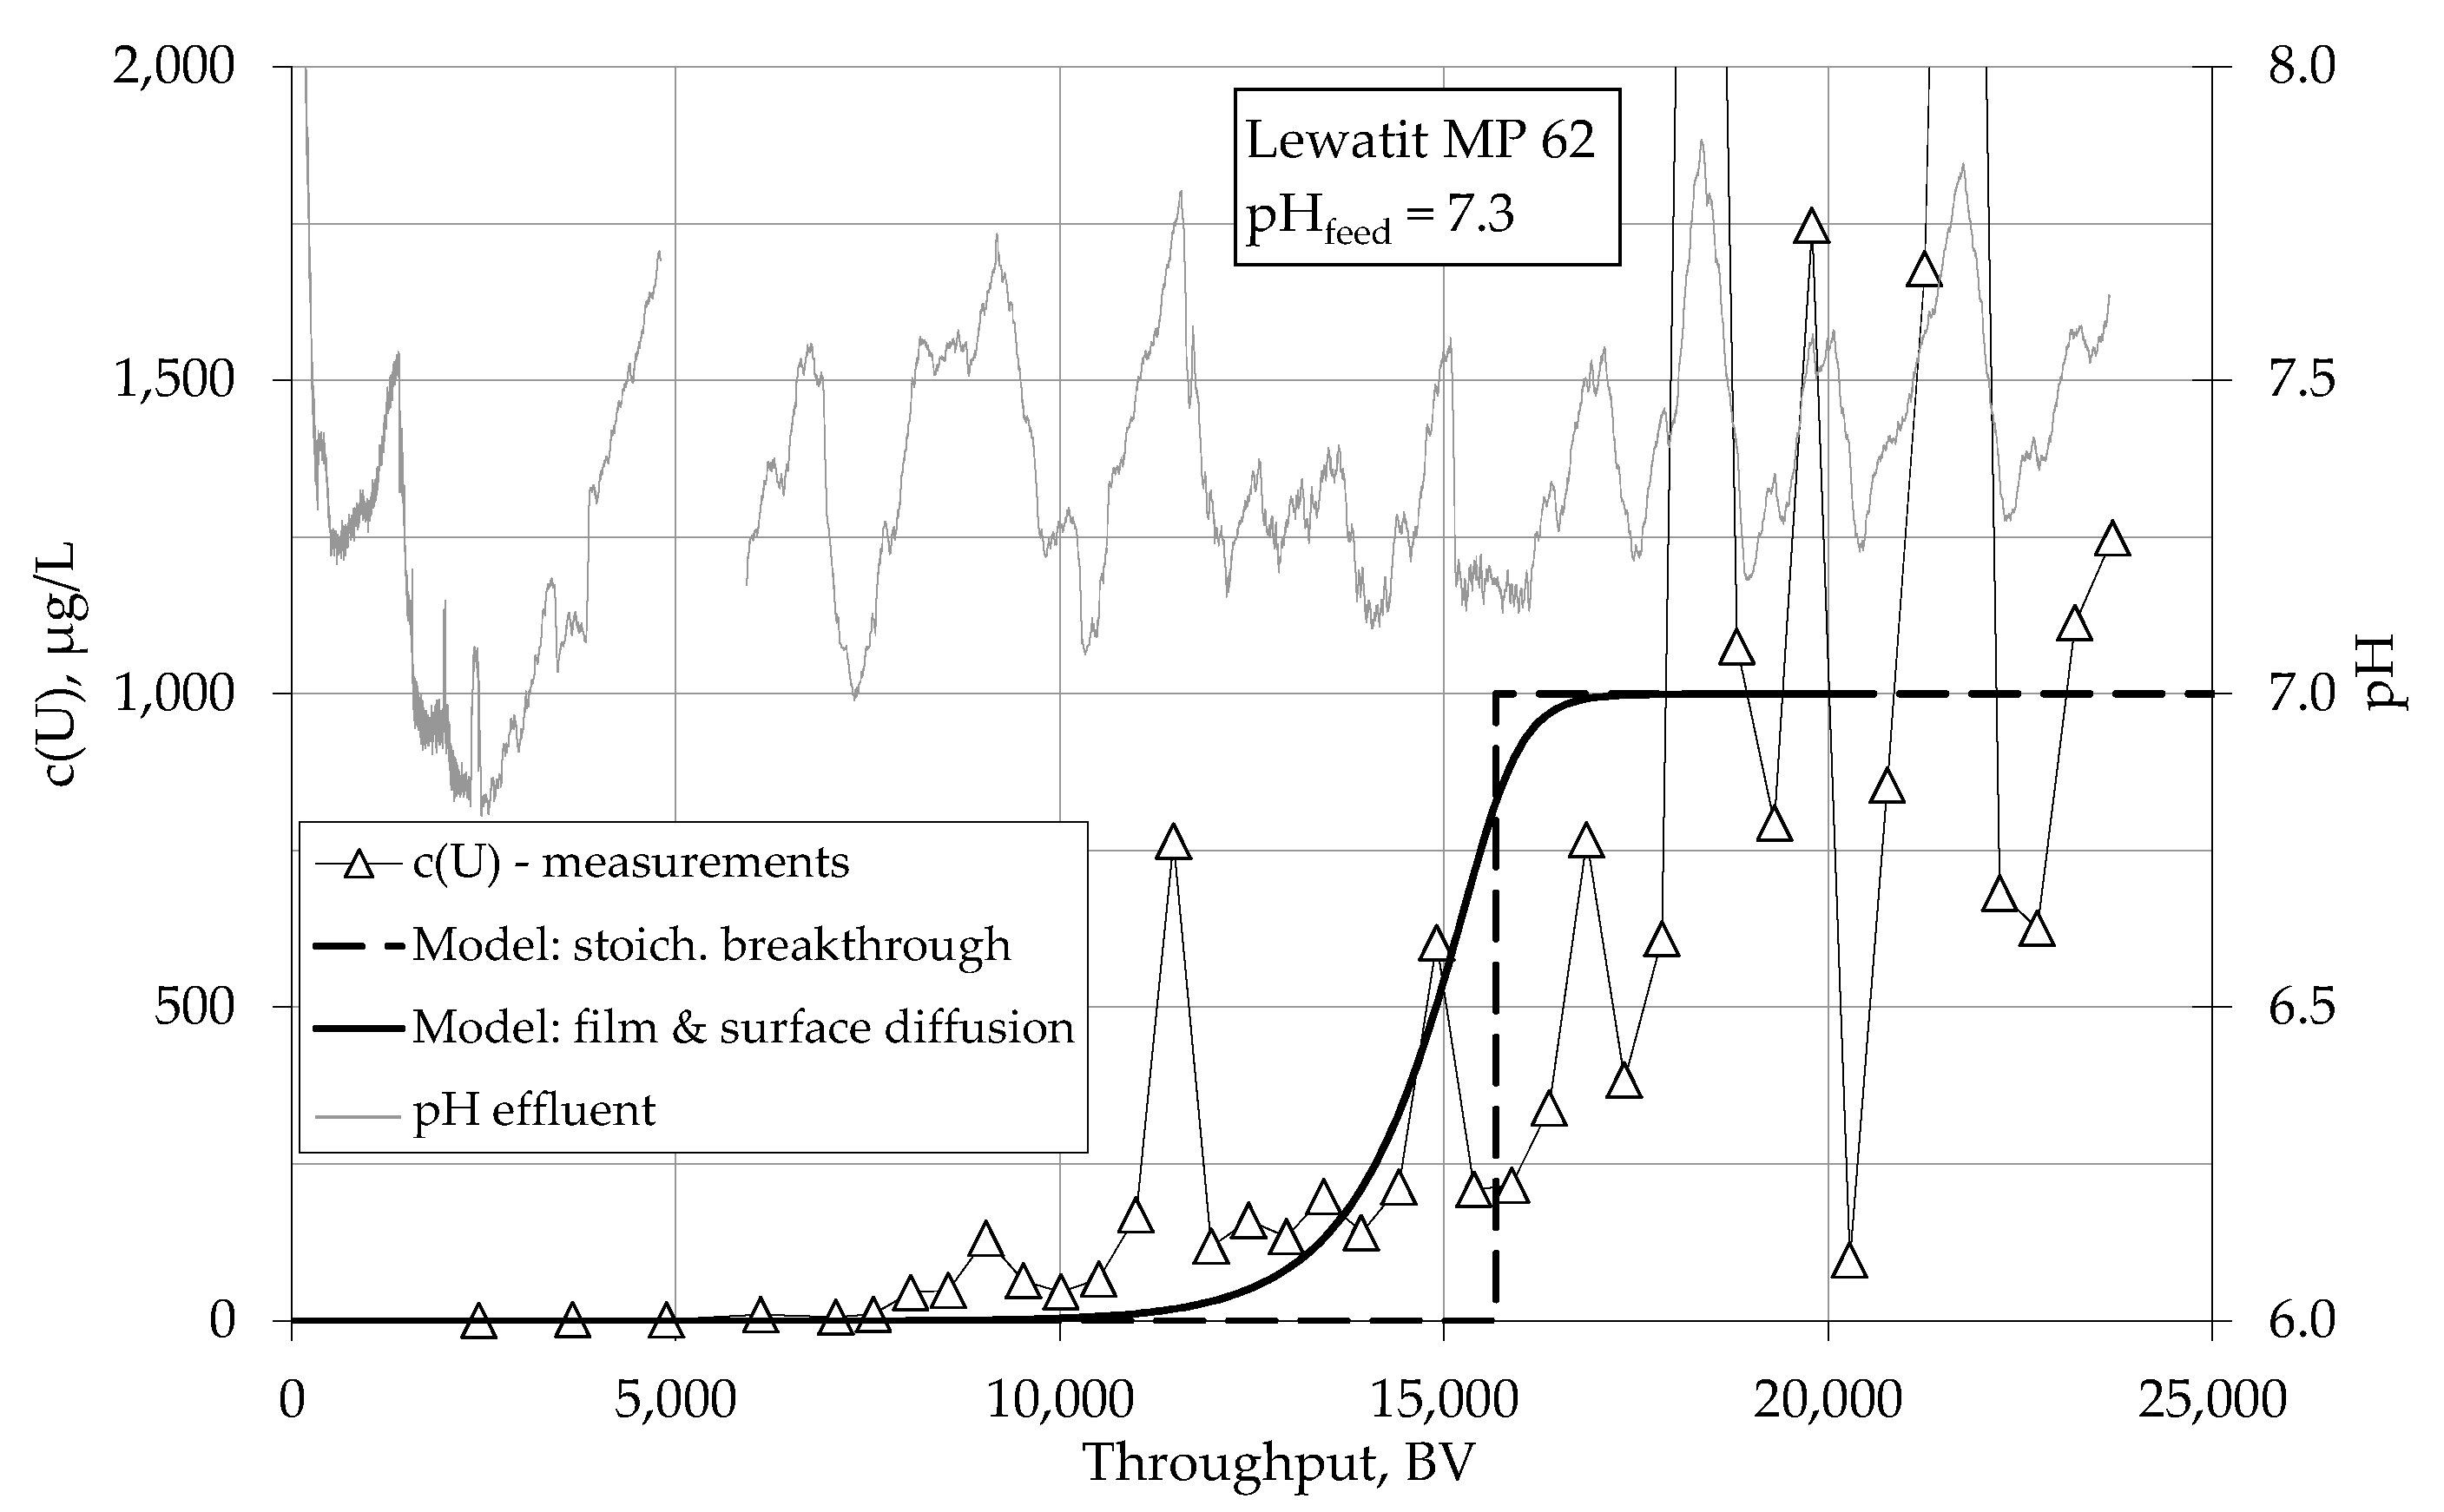
4.1.1. Breakthrough Behaviour of Uranium Species in Bench Scale Experiments

The breakthrough performance of the exchanger Amberlite IRA 67 for uranium is shown in Figure 2. Experimental uranium effluent concentrations and theoretical predictions (left ordinate) as well as the effluent pH values (right ordinate) are plotted as a function of the throughput in bed volumes (BV). Under the chosen experimental conditions, where the feed pH was adjusted to 7.3, uranium is more or less quantitatively removed up to a treated volume of about 30,000 BV. After this volume has been treated, the breakthrough of uranium starts. After about 42,000 BV the effluent concentration has reached half of the feed concentration. This throughput corresponds to the breakthrough which is predicted by the stoichiometric breakthrough model when equilibrium data for a pH of 7.3 are used. However, the prediction by the film and surface diffusion model not only predicts the breakthrough volume, but shows a very good agreement with the experimental data for the first part of the breakthrough curve. After a throughput of 43,000 BV the pH in the experiment exceeded a value of 7.7 for a short time because of problems with the pH adjustment. As a consequence, the degree of protonation of the functional amino groups on the exchanger surface decreases and previously sorbed uranium species are desorbed. In this time period, the effluent concentration reaches a value of about 1300 µg/L. Decreasing the pH again to a value below 7.5 immediately stops the desorption of uranium species and an approximately constant effluent concentration is reached. After 63,000 BV the pH increased to values above 8.0 and, as a consequence, strong desorption of uranium was observed again with effluent concentrations exceeding 4000 µg/L.
In this bench scale experiment, the column effluent concentration of uranium can be well predicted by the film and surface diffusion model for the first 40,000 BV. However, variations of the effluent concentrations which are due to oscillations of the pH value could not be predicted. These changes in pH were not incorporated in the model and thus the resulting effects cannot be well predicted. Furthermore, the pH of groundwater is usually very constant and no significant variations will occur. Finally, the beginning of the breakthrough of uranium concentrations can be predicted sufficiently well by the model and the time of stoichiometric breakthrough corresponds well to the experimental data. Thus, the model seems to be suitable for determining the time after which the resin has to be replaced or regenerated.
Due to the good agreement between the experimental and calculated breakthrough curves at constant pH conditions, as well as the correct prediction of the stoichiometric breakthrough, both the equilibrium and the kinetic parameters can be regarded as being verified.
By integrating the differences between the feed and effluent concentrations, the average loading of the filter was calculated. At a throughput of 42,000 BV, a uranium loading of 250 µmol/g or 60 mg/g was determined. This value correlates well to the results of batch experiments under equilibrium conditions where an initial uranium concentration of 1000 µg/L corresponded to a loading of the resin of 267 µmol/g [19].
For the weak basic anion exchanger Lewatit MP 62, the experimentally determined and the predicted breakthrough curves are shown in Figure 3. Under identical experimental conditions, the increase in uranium concentration in the effluent starts much earlier than for the exchanger Amberlite IRA 67. The calculated stoichiometric breakthrough is already reached after 16,000 BV which is due to a poor sorption equilibrium. Experimental data show that after 16,000 BV, most of the uranium breakthrough has already occurred. Obviously the resin Lewatit MP 62 shows a much larger pH dependency than the previously tested resin Amberlite IRA 67: After a throughput of approximately 11,000 BV, the uranium concentration in the effluent increased drastically up to 750 µg/L due to an increase of the pH to 7.8. Analogue concentration peaks are observed after 15,000 BV, 17,000 BV, and in an extreme manner, after 18,000 BV and 22,000 BV.
The beginning of the breakthrough after 8000 BV cannot be predicted very well by the homogeneous film and surface diffusion model. According to the model, the breakthrough should start several thousands of bed volumes later. Thus, for both models, the prediction of the uranium concentrations at the column effluent is poor compared to the results for the resin Amberlite IRA 67.

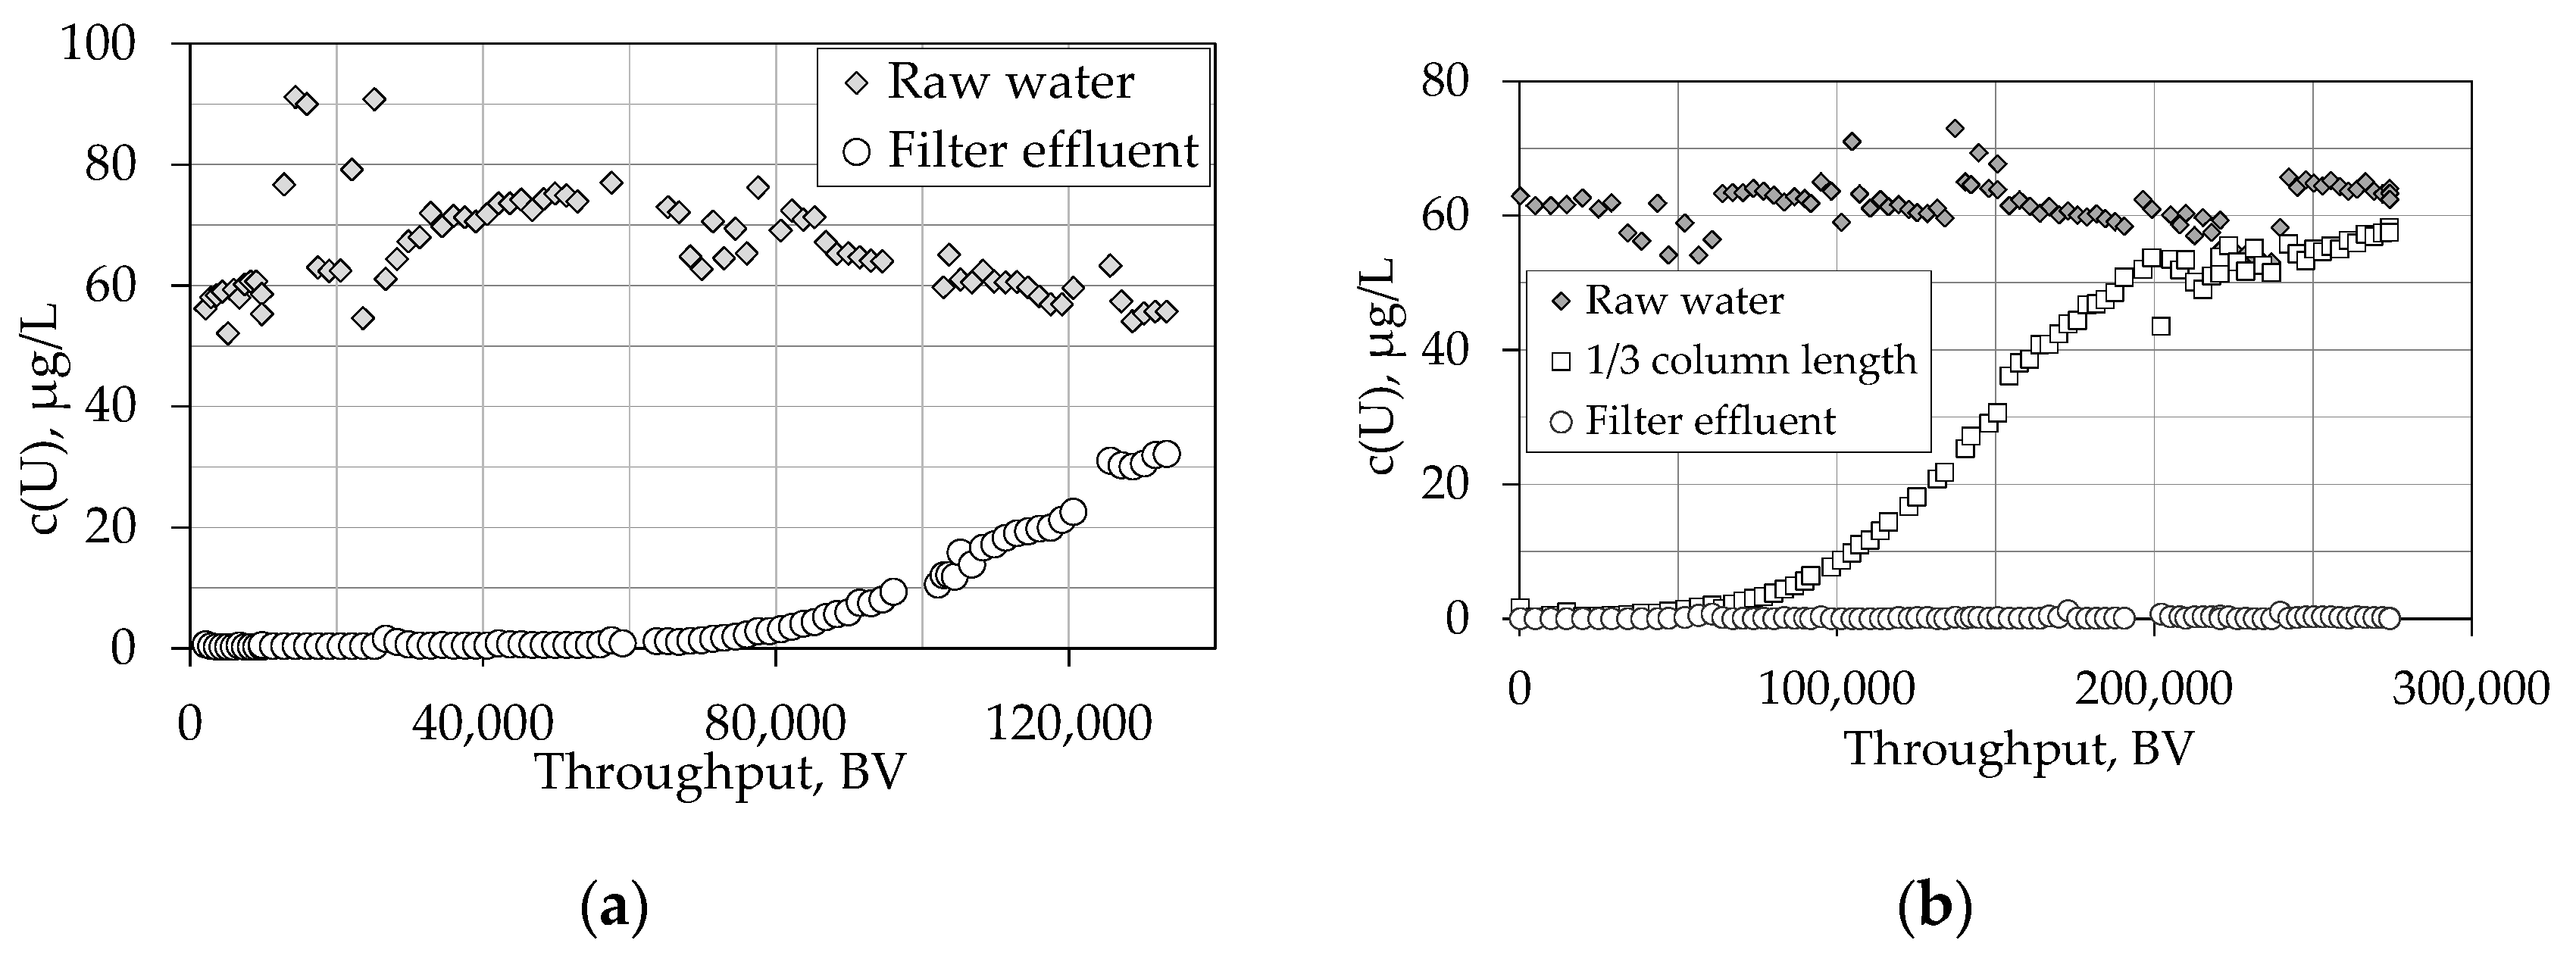
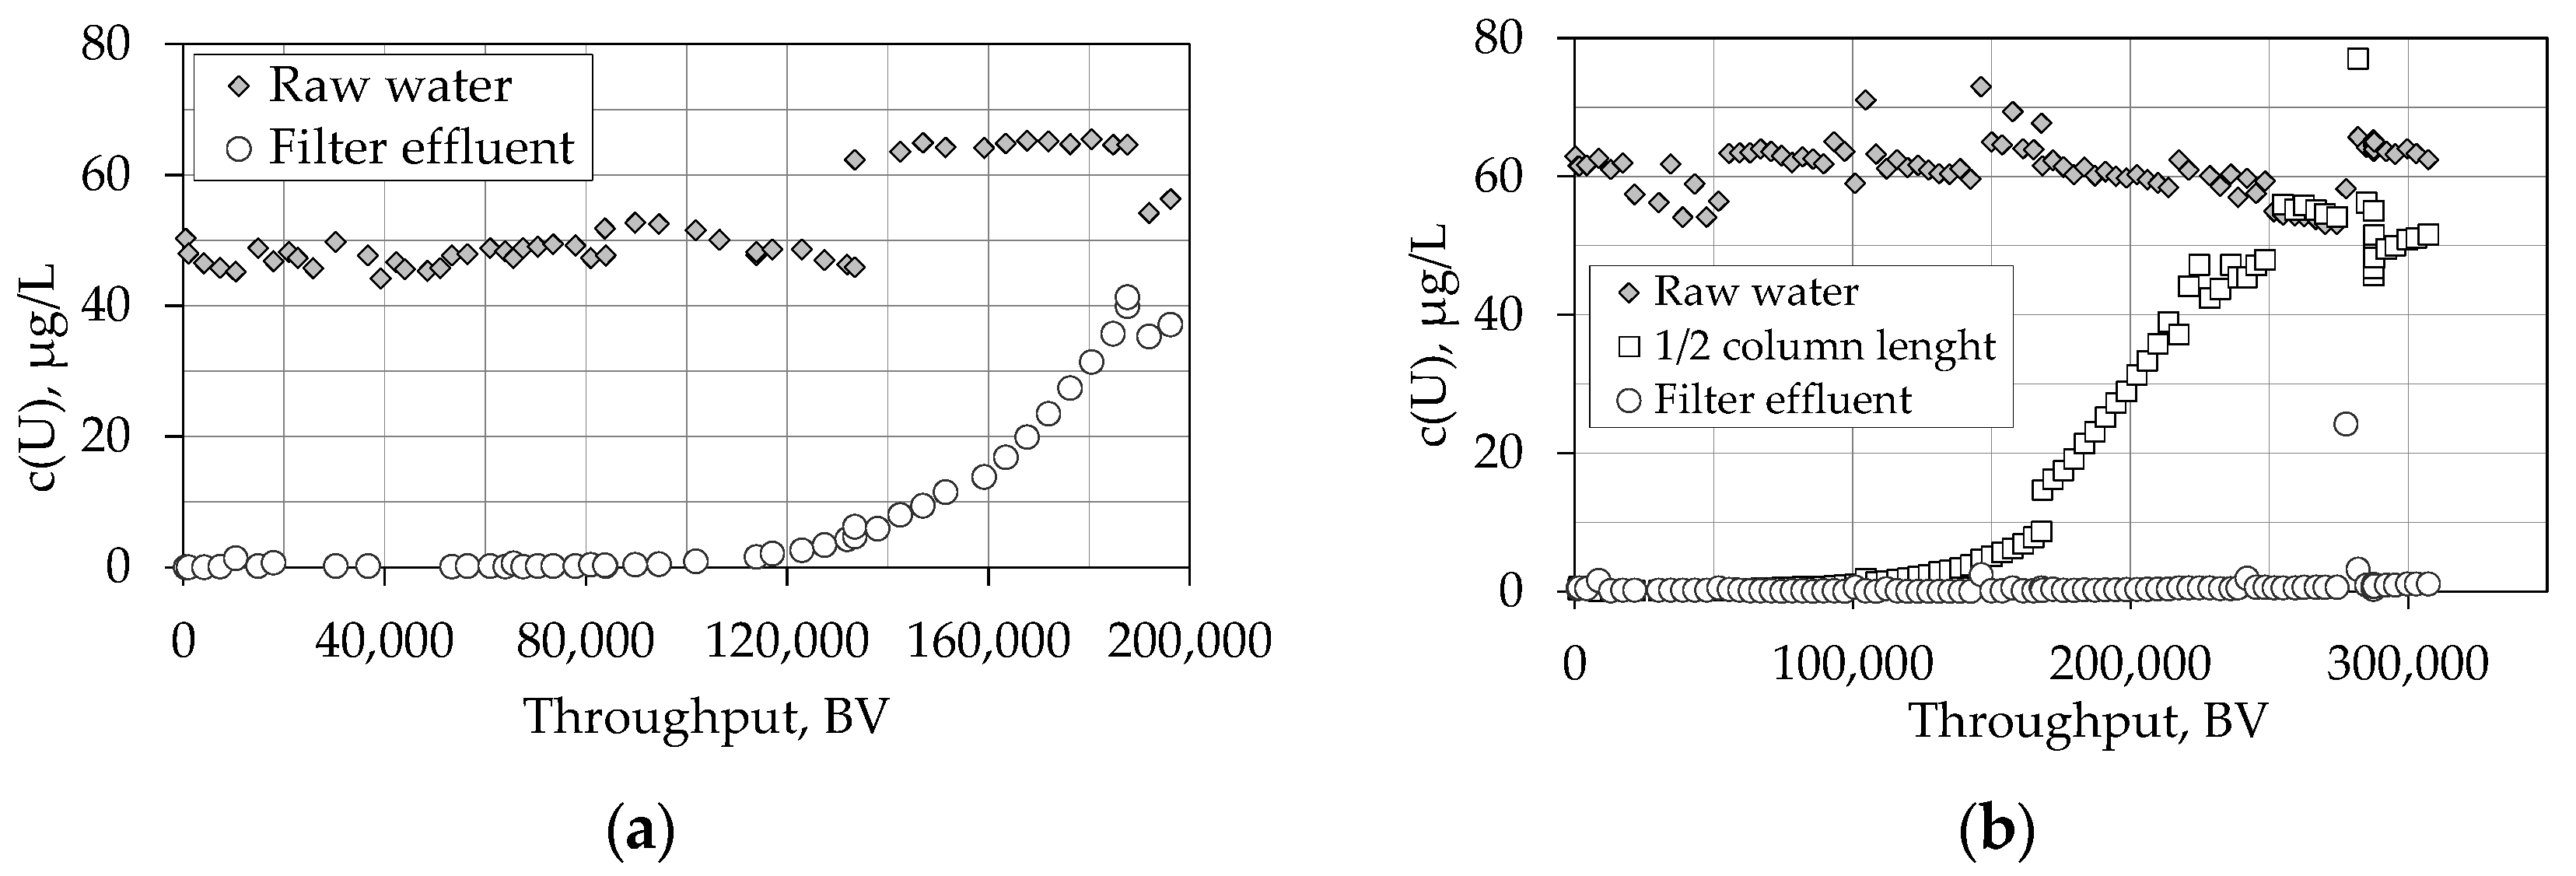
4.1.2. Breakthrough Behaviour of Uranium Species in Pilot Scale Experiments

Figure 4 shows the uranium breakthrough for the resin Amberlite IRA 67 in two different waterworks. In both cases, the raw water contains uranium concentrations of 60 to 70 µg/L. At waterworks I, the specific throughput was 25 BV/h. At waterworks II, the flux was initially adjusted to 50 BV/h, but due to head losses it was reduced to 30 BV/h, successively. As the data show, uranium can be removed completely until a throughput of about 70,000 BV in waterworks I (Figure 4a). An effluent concentration of 10 µg/L was reached after approximately 90,000 BV. At this time the medium resin loading with uranium was 9 g/kg.
Figure 4b shows the uranium breakthrough at waterworks II. Until a water throughput of 275,000 BV (i.e., after 10 months of operation), still no uranium breakthrough was observed in the column effluent. The uranium concentrations at a column length of 30 cm (approx. 1/3 of the total filter length) are also plotted in Figure 4b. At this filter position, a uranium concentration of 10 µg/L was obtained after 100,000 BV. This indicates an effluent concentration of 10 µg/L after a throughput of 300,000 to 350,000 BV. The mean uranium loading of the resin after 300,000 BV would be about 26 g/kg.
The time of operation until uranium breakthrough varies strongly at the two waterworks. This is due to the different raw water characteristics at the treatment sites. The concentrations of the main raw water constituents are listed in Table 2. The negative effects of uranium adsorption onto anion exchangers are mainly caused by the high calcium and high sulphate concentrations [19]. At waterworks I, where uranium breakthrough starts much earlier, the amounts of these two ions are nearly twice as high as at waterworks II. Furthermore, the content of natural organic matter which is characterised by the parameter DOC (dissolved organic carbon) and which could also affect the adsorption negatively, are three times as high at site I than at site II.
At the given pH of the raw water at waterworks II of 7.4, a significant amount of uranium exists as tetra-valent complexes (see Figure 1) with a huge affinity for ion exchange. At the lower pH of 6.9 of the raw water at waterworks I, a much smaller amount of uranium is present as tetra-valent species and a larger fraction of the bi-valent UO2(CO3)2− complex exists. Thus, the lower pH value at waterworks I will lead to a further negative sorption effect. On the other hand, the less functional amine groups of the weak basic anion exchangers are protonated at higher pH values in the neutral pH range. This leads to a smaller sorption capacity above a specific pH. However, experimental investigations show that lower pH values have a positive effect on uranium adsorption [19]. For strong and weak basic anion exchangers, an increasing concentration of bicarbonate also affects the sorption of uranium species positively [19], but these positive conditions seem to be only of minor relevance in waterworks I.
The experimental results for the uranium breakthrough of the strong basic anion exchanger Lewatit S 6368 at the two waterworks under investigation are shown in Figure 5. At both sites, z the flux was adjusted to a constant flow of 55 to 60 BV/h. At waterworks I, an effluent concentration of 10 µg/L was reached after approximately 142,000 BV. At this time, the resin had a mean loading of uranium of 13 g/kg. Compared to the weak basic exchanger Lewatit IRA 67, the sorption performance improved by approximately 40%.
At waterworks II, no uranium breakthrough could be observed after a throughput of 300,000 BV. By means of the uranium concentration at a column length of 50 cm (1/2 column length), which is additionally shown in Figure 5b, the breakthrough at the column effluent can be estimated. A concentration of 10 µg/L presumably will be reached after a throughput of 350,000 BV. Then, the resin would have a medium uranium loading of 31 g/kg.

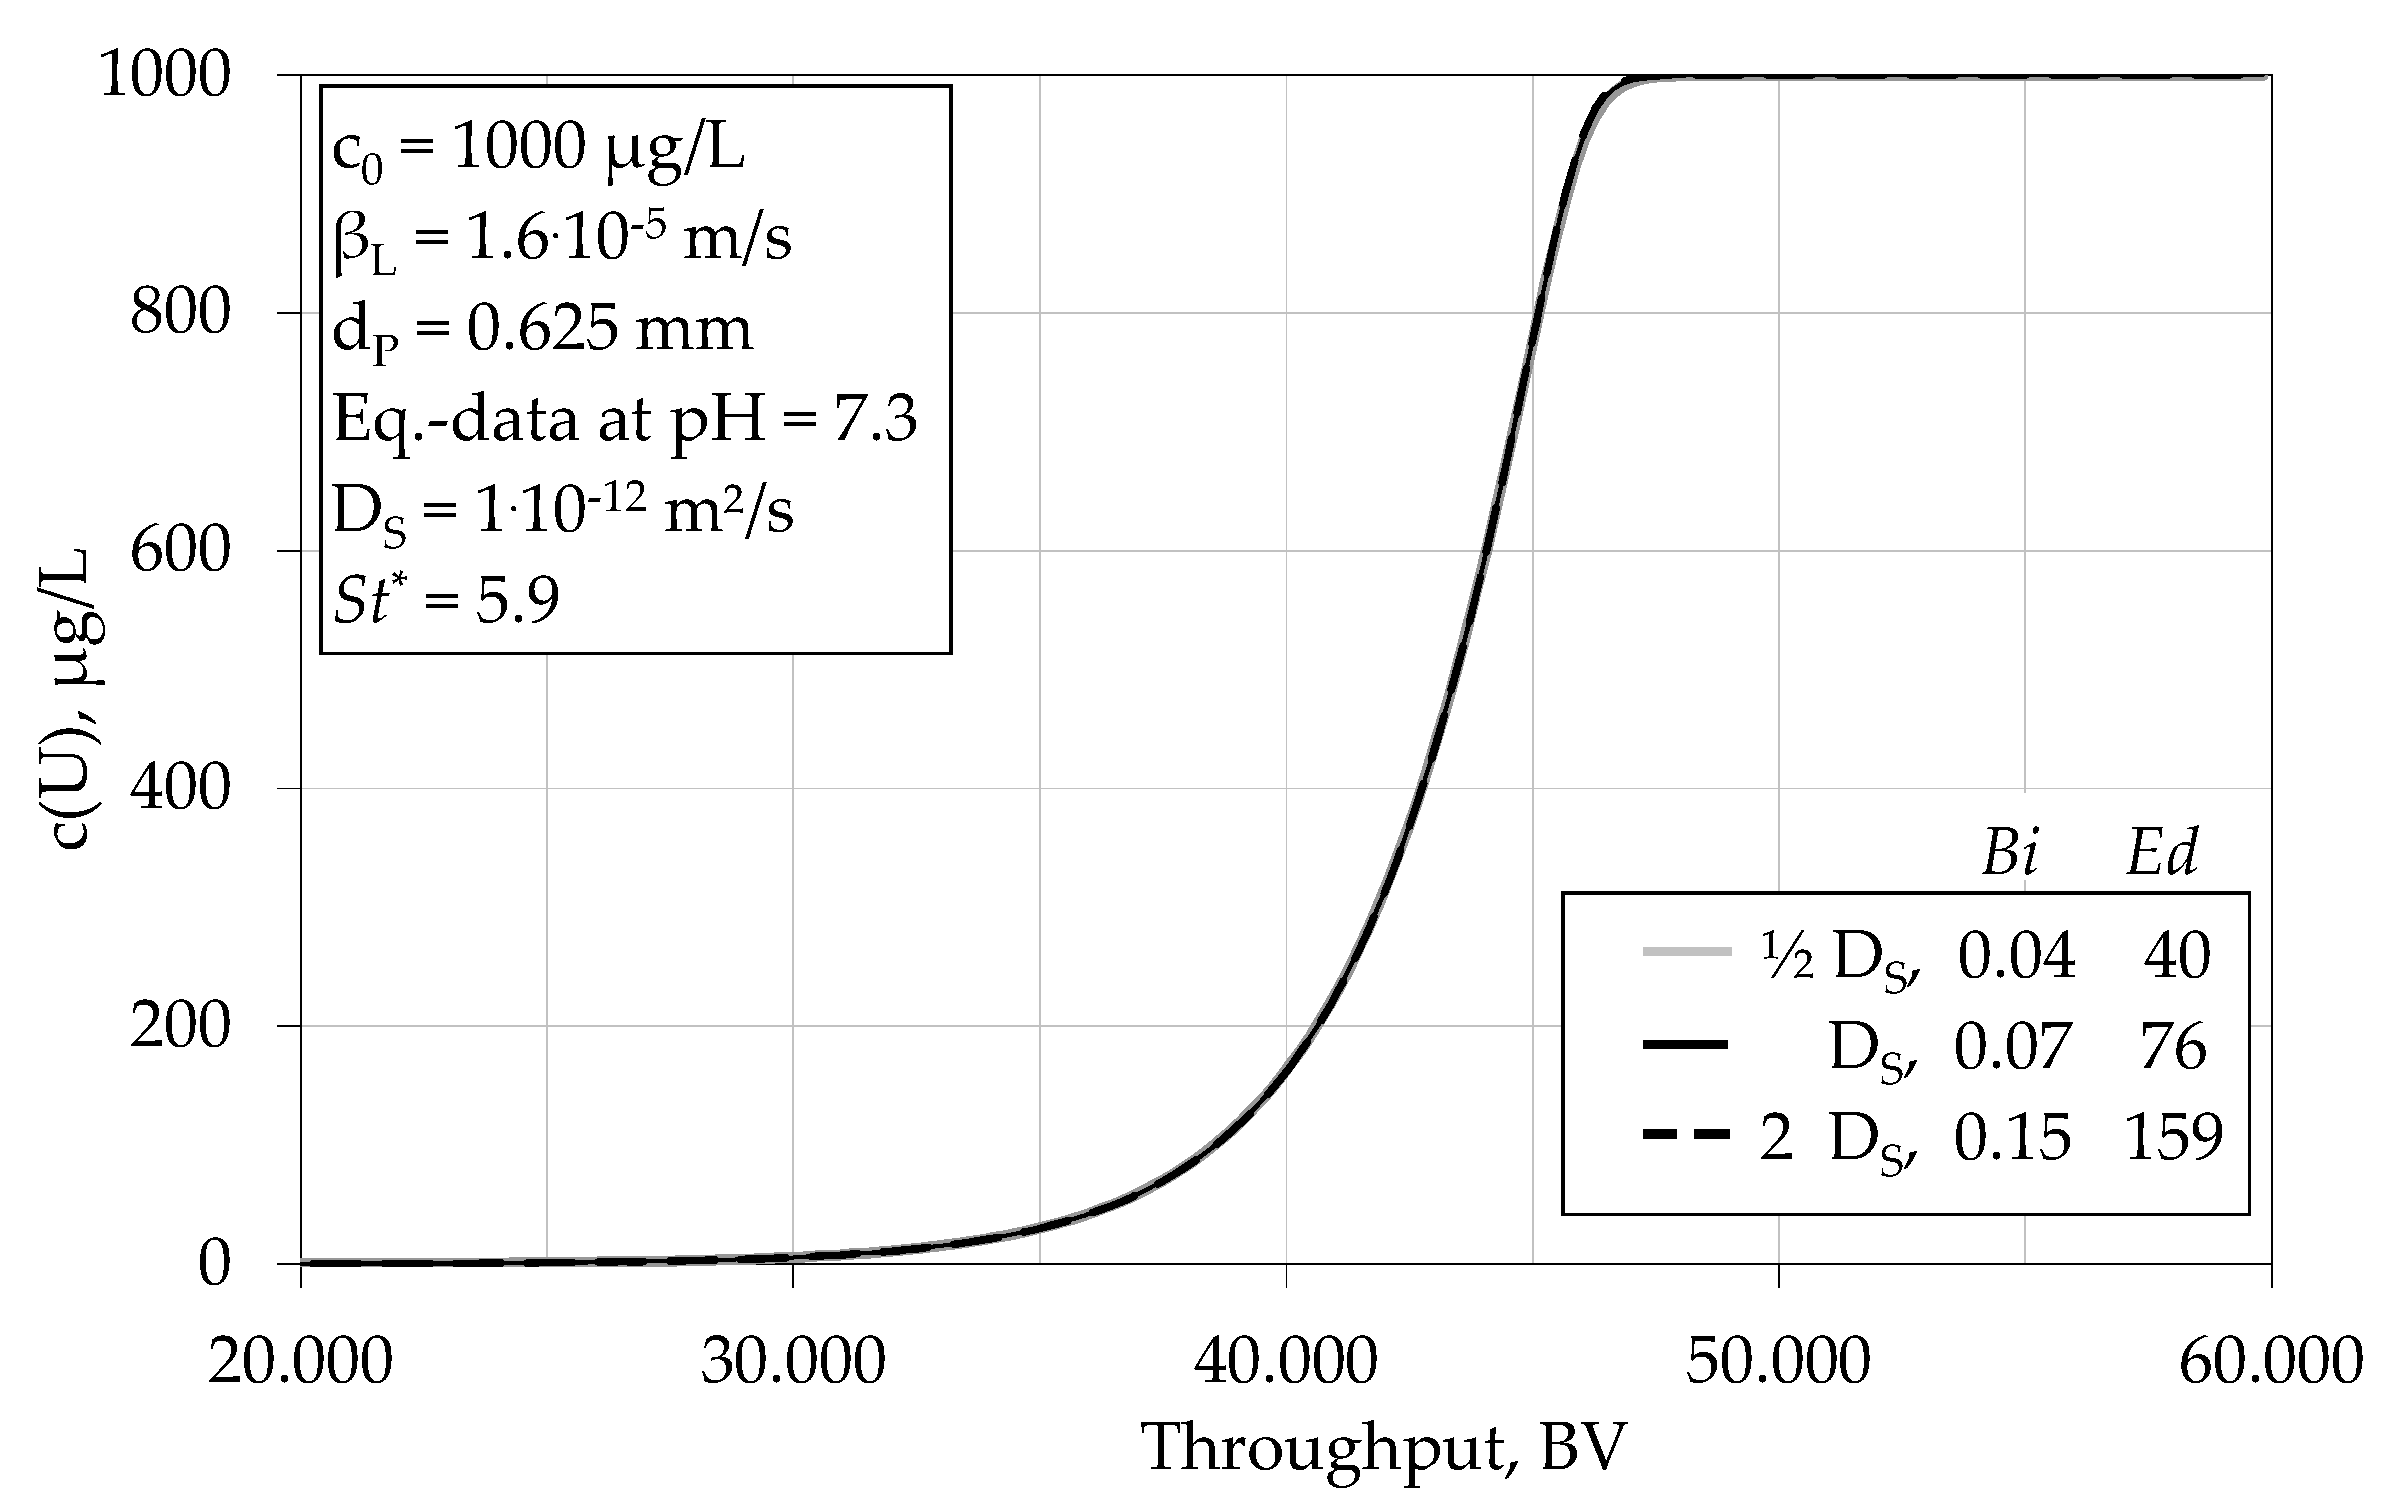
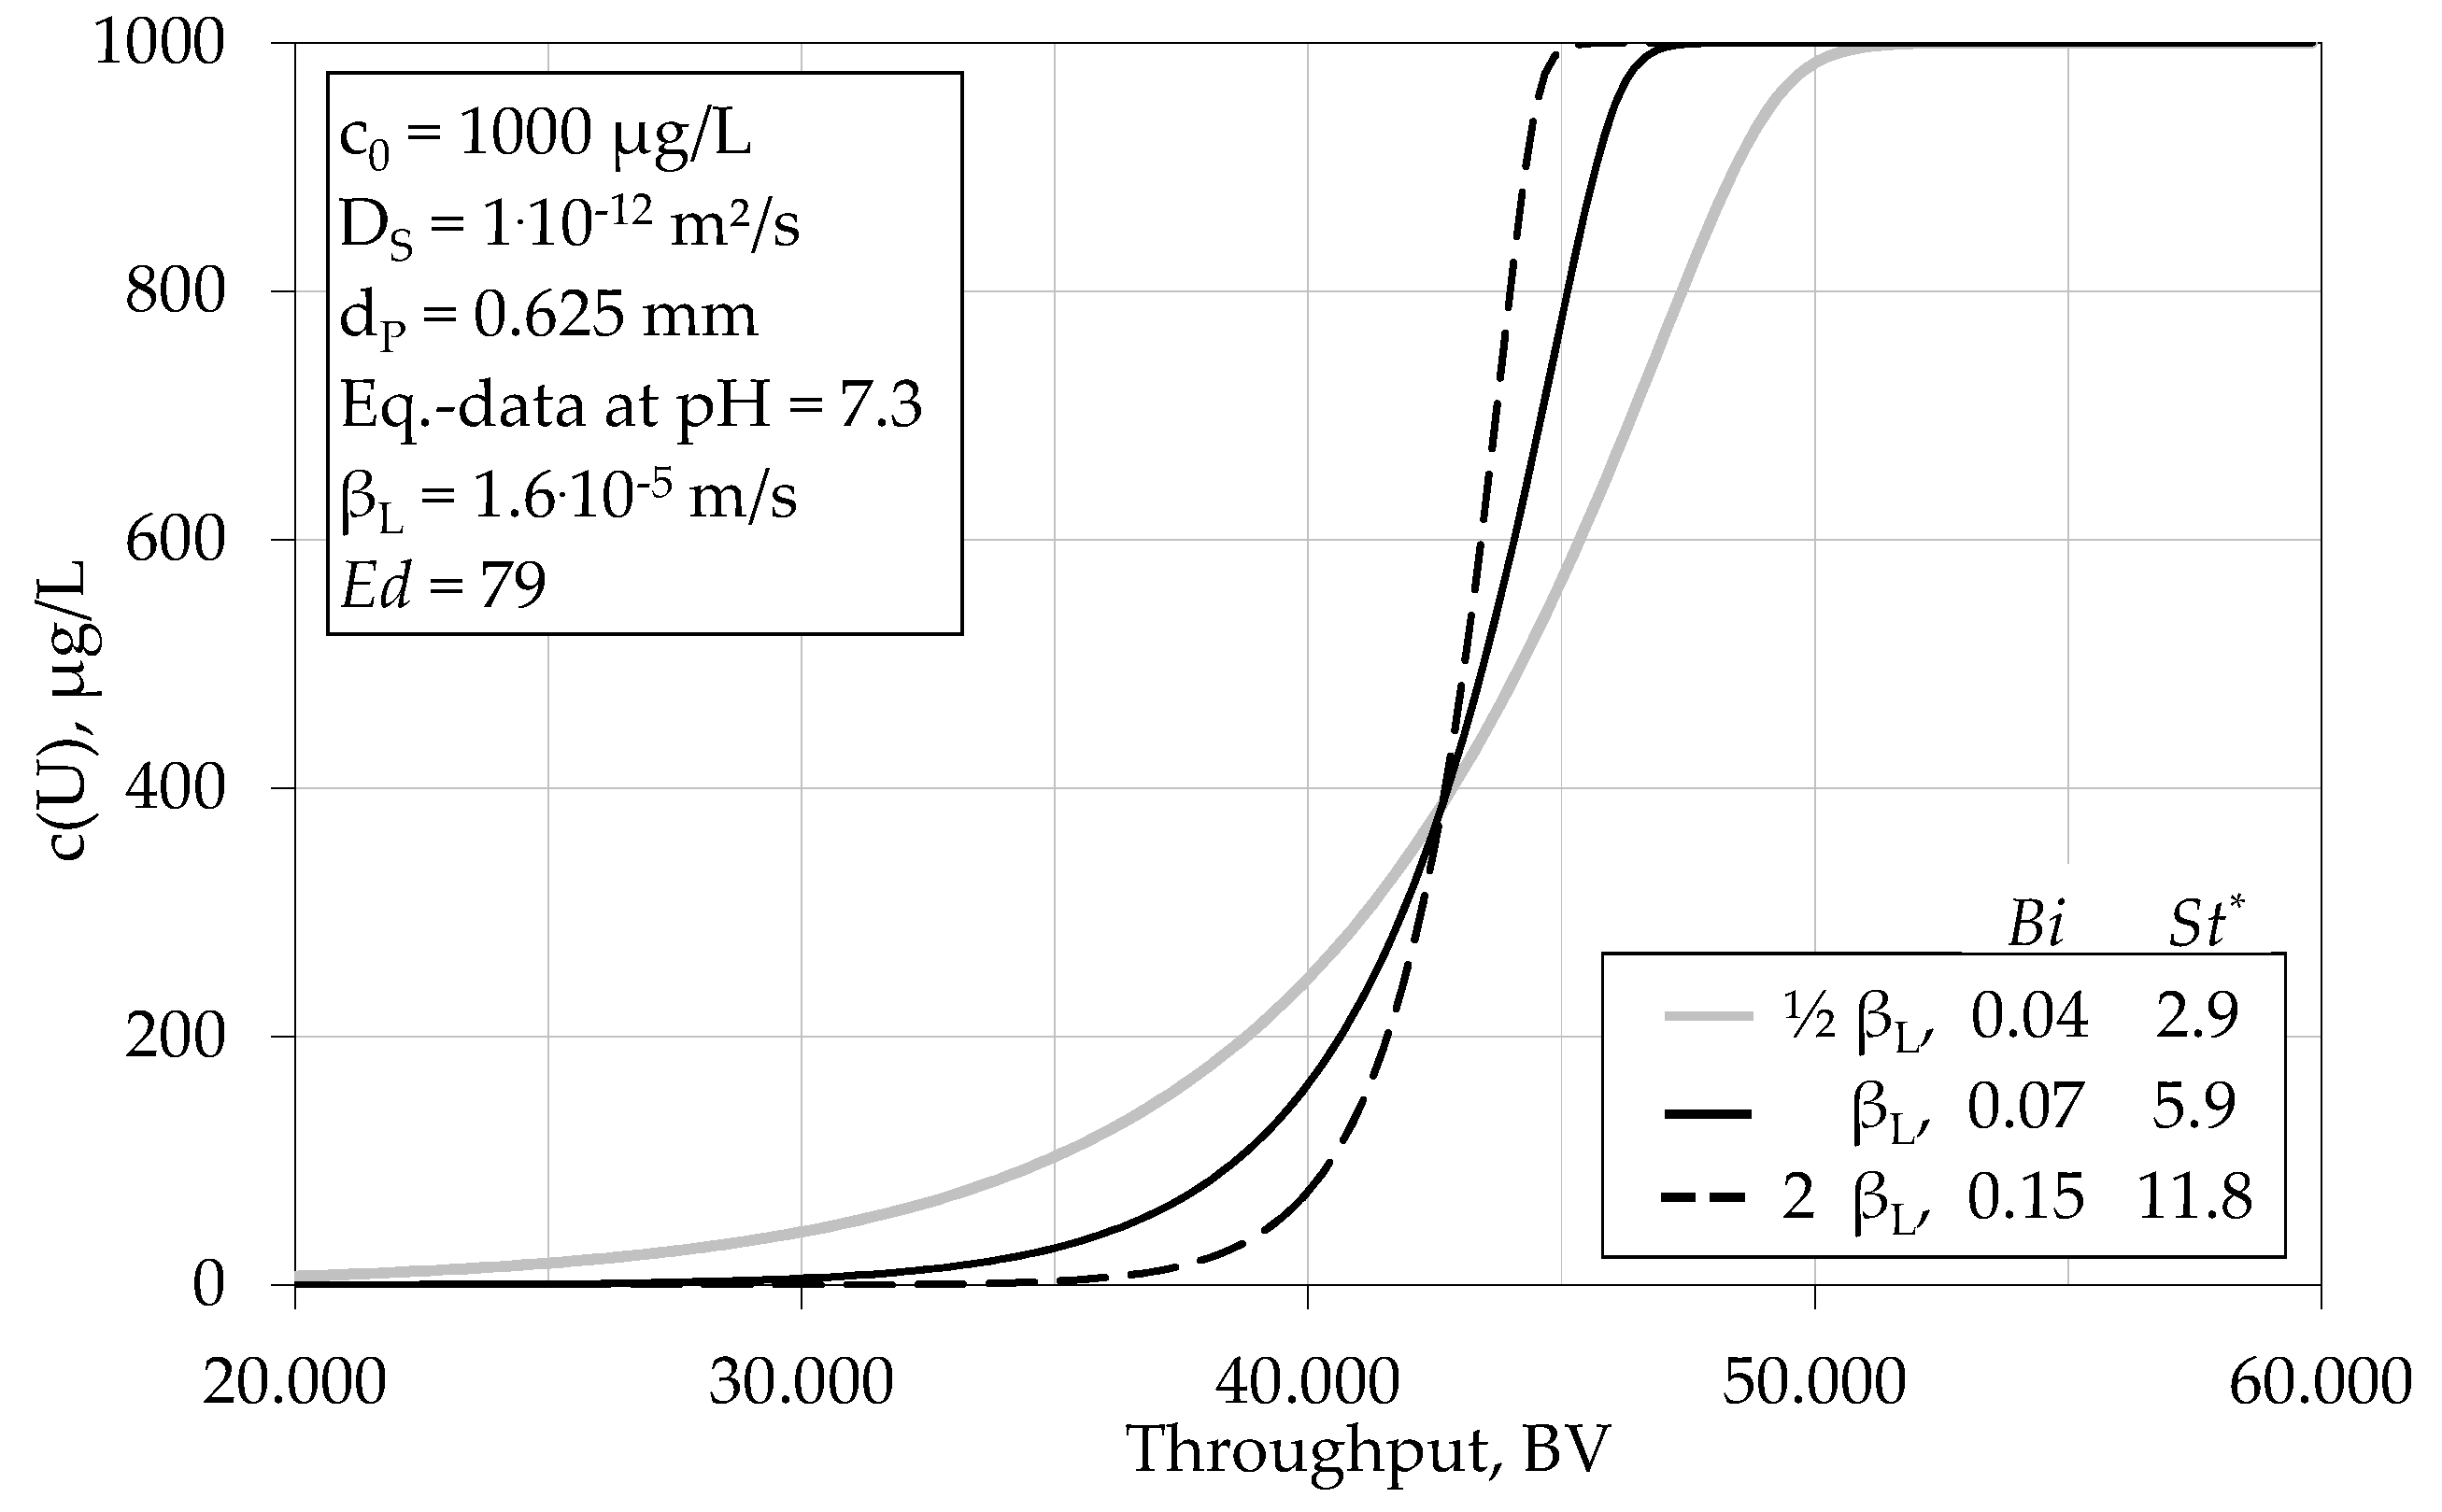
4.1.3. Impact of Various Parameters on the Breakthrough Behaviour

The theoretical model was further used to investigate the impact of various parameters on the breakthrough behaviour of uranium. The three parameters (particle diffusion coefficient (DS), liquid phase mass transfer coefficient (βL), and particle diameter (dP)) were considered based on the data available for the exchanger Amberlite IRA 67 and the results obtained from its application in bench scale column experiments.
Figure 6 shows the theoretical effect of the solid phase diffusion coefficient DS. Both doubling and dividing the initial value of 10−12 m2/s in half obviously has no effect on the uranium breakthrough. Though the surface diffusion modulus Ed increases with increasing diffusion coefficients, the intra-particle diffusion has no impact on the total uranium transport as long as the film diffusion is rate controlling (Bi << 1). Thus, the particle diffusion coefficient has no effect on the breakthrough of uranium.
The impact of the liquid phase mass transfer coefficient βL is demonstrated in Figure 7. Doubling this parameter from 1.6 × 10⁻⁵ m/s to 3.2 × 10⁻⁵ m/s leads to a noticeable delay in uranium breakthrough and the rise in concentration is much steeper. A uranium concentration of 10 µg/L is reached 5000 BV later (37,000 BV instead of 32,000 BV) when βL is doubled. On the other hand, reducing βL to 8 × 10⁻⁶ m/s leads to a dramatic deterioration of the filter efficiency with a much earlier increase of uranium concentrations at the effluent. A uranium concentration of 10 µg/L is obtained 10,000 BV earlier (at 22,000 BV). This effect becomes clear when considering the dimensionless numbers. As long as the film diffusion is rate controlling (Bi > 1), an increasing modified Stanton number St* sharpens the breakthrough curve and retards the start of the breakthrough.
As the liquid phase mass transfer coefficient βL is increasing with an increasing filter velocity, thin filters with small filter diameters are more appropriate for an efficient uranium adsorption than filters with larger filter diameters (assuming constant filter volumes). The reduction of the filter diameter is of course limited by the head loss which increases with increasing filter velocity. For example, reducing the filter diameter from 1 m to 0.7 m will lead to a doubling of the filter velocity and, thus, to an approximately 30% increase of the liquid phase mass transfer coefficient βL (using the relation of Gnielinski to calculate βL [35], the formula of Worch to compute the liquid phase diffusion coefficient [36], and assuming a constant empty bed contact time).
Finally, Figure 8 shows the effect of particle diameter variation on the breakthrough of uranium. The theoretical calculation with a doubled effective diameter of 1.25 mm (dashed black line) results in an earlier breakthrough due to a smaller specific particle surface, and thus a slower diffusion. A contrary behaviour is obtained when using a particle diameter of only 0.31 mm for the calculation (solid grey line).
Variation of the particle diameter will also change the liquid phase mass transfer coefficient βL. Using the correlation of Wilson [37] to adjust βL, leads to the both dotted lines in Figure 8. Due to an increasing mass transfer coefficient for smaller particles, uranium breakthrough is further delayed (dotted grey line). When considering larger particles, the breakthrough performance gets even worse because of a decrease of the mass transfer coefficient (dotted black line).

4.1.4. Theoretical Scale-Up and Consequences for Waterworks

The results from the bench scale column experiments are not directly transferable to waterworks’ conditions because of differences in column size, filter velocity, and, essentially, the initial uranium concentration. To highlight the differences, the major conditions and the dimensionless numbers characterising the sorption process have been compiled in Table 3.
For the calculation of the decisive parameters for the full scale plant, a filter diameter of 1 m and a filter height of 1.5 m were chosen. As mentioned before, thin filters with smaller diameters and larger filter heights are more appropriate for a better sorption performance.
A full scale plant with a specific flux of 20 BV/h will be operated with a much faster filter velocity than the bench scale experiments. In the chosen example, the filter velocity is 18 times higher in the full scale plant (30 m/h compared with 1.7 m/h). Thus, the liquid phase mass transfer coefficient βL and the Biot number Bi increase accordingly. Therefore, just by increasing the dimension of the filter, the sorption performance improves with a later and steeper breakthrough (as is demonstrated in Figure 7).
A decrease of the initial uranium concentration c0 will lead to a reduction of the ratio c0/q0 (in the case of a favourable equilibrium). This ratio has an effect on the Biot number (Equation (8)) and leads to a decrease of the Bi number. The interfering impact of both effects, the increase of the filter dimension, and the decrease of the initial concentration, is a nearly constant Biot number. Thus, under real full scale conditions, film diffusion will also be the rate controlling mechanism.
The modified Stanton number St* increases in a full scale plant by approximately a factor of three (from 6 to 19) due to a larger liquid phase mass transfer coefficient. Thus, the amount of uranium transported through the liquid film to the resin particles increases in relation to the part which is convectively transported through the column. Hence, the shape of the breakthrough curve becomes steeper and the increase of the uranium concentration at the filter effluent can be expected later.
Finally, an increase of the surface diffusion modulus Ed is observed by a factor of 2.6 (from 86 to 226) in the full scale plant, due to the decline of the ratio c0/q0. Therefore, more uranium can be transported via particle diffusion than by the convective transport through the column. However, because the film diffusion is rate controlling, this variation should not result in an observable effect.

4.2. Regeneration

4.2.1. Batch Experiments

The experiments on resin regeneration first addressed the possibility of uranium desorption. Both weak basic anion exchangers partially released the previous adsorbed uranium when they came in contact with 1 M caustic soda or 0.5 M sulfuric acid. Figure 9 shows the efficiency of desorption for a two-step regeneration with a ratio of regenerant to resin of 200 mL/g. This amount corresponds to a 75-fold excess of effective ions compared to the resin capacity. The resin Lewatit MP 62 was nearly fully regenerated independent of the order of the regenerant. With the exchanger Amberlite IRA 67, uranium is only extractable with sulfuric acid. Nearly no desorption of uranium occurred when caustic soda was used. This becomes obvious in Figure 9 where for bar No. 3 only 8% of uranium is desorbed during the first regeneration step with caustic soda.
By increasing the pH during regeneration, two mechanisms become relevant. The functional exchanger groups of the WBA become deprotonated on the one hand and the speciation of uranium changes towards the tetravalent UO2(CO3)34− complex on the other hand. Regarding the acrylic exchanger Amberlite IRA 67, uranium seems to be fixed to the resin so strongly by the change in speciation that no deprotonation of the functional groups can happen.
At low pH values, uranium is transformed to the positively charged cation UO22+ which does not attach to the positively charged functional ion exchanger groups. A desorption of uranium is the consequence.
Regarding resin work cycles of adsorption and regeneration, it thus seems appropriate to regenerate first under acidic conditions and second with caustic soda to finally transfer the exchanger into the free base form.
During the experiments on exchanger regeneration, the organic matter was additionally desorbed. The experimentally determined total amount of dissolved organic carbon (DOC) during a two-step regeneration indicated a DOC loading of about 50 mg/g. This amount of DOC accumulated on the resin during its half year operation in a waterworks.

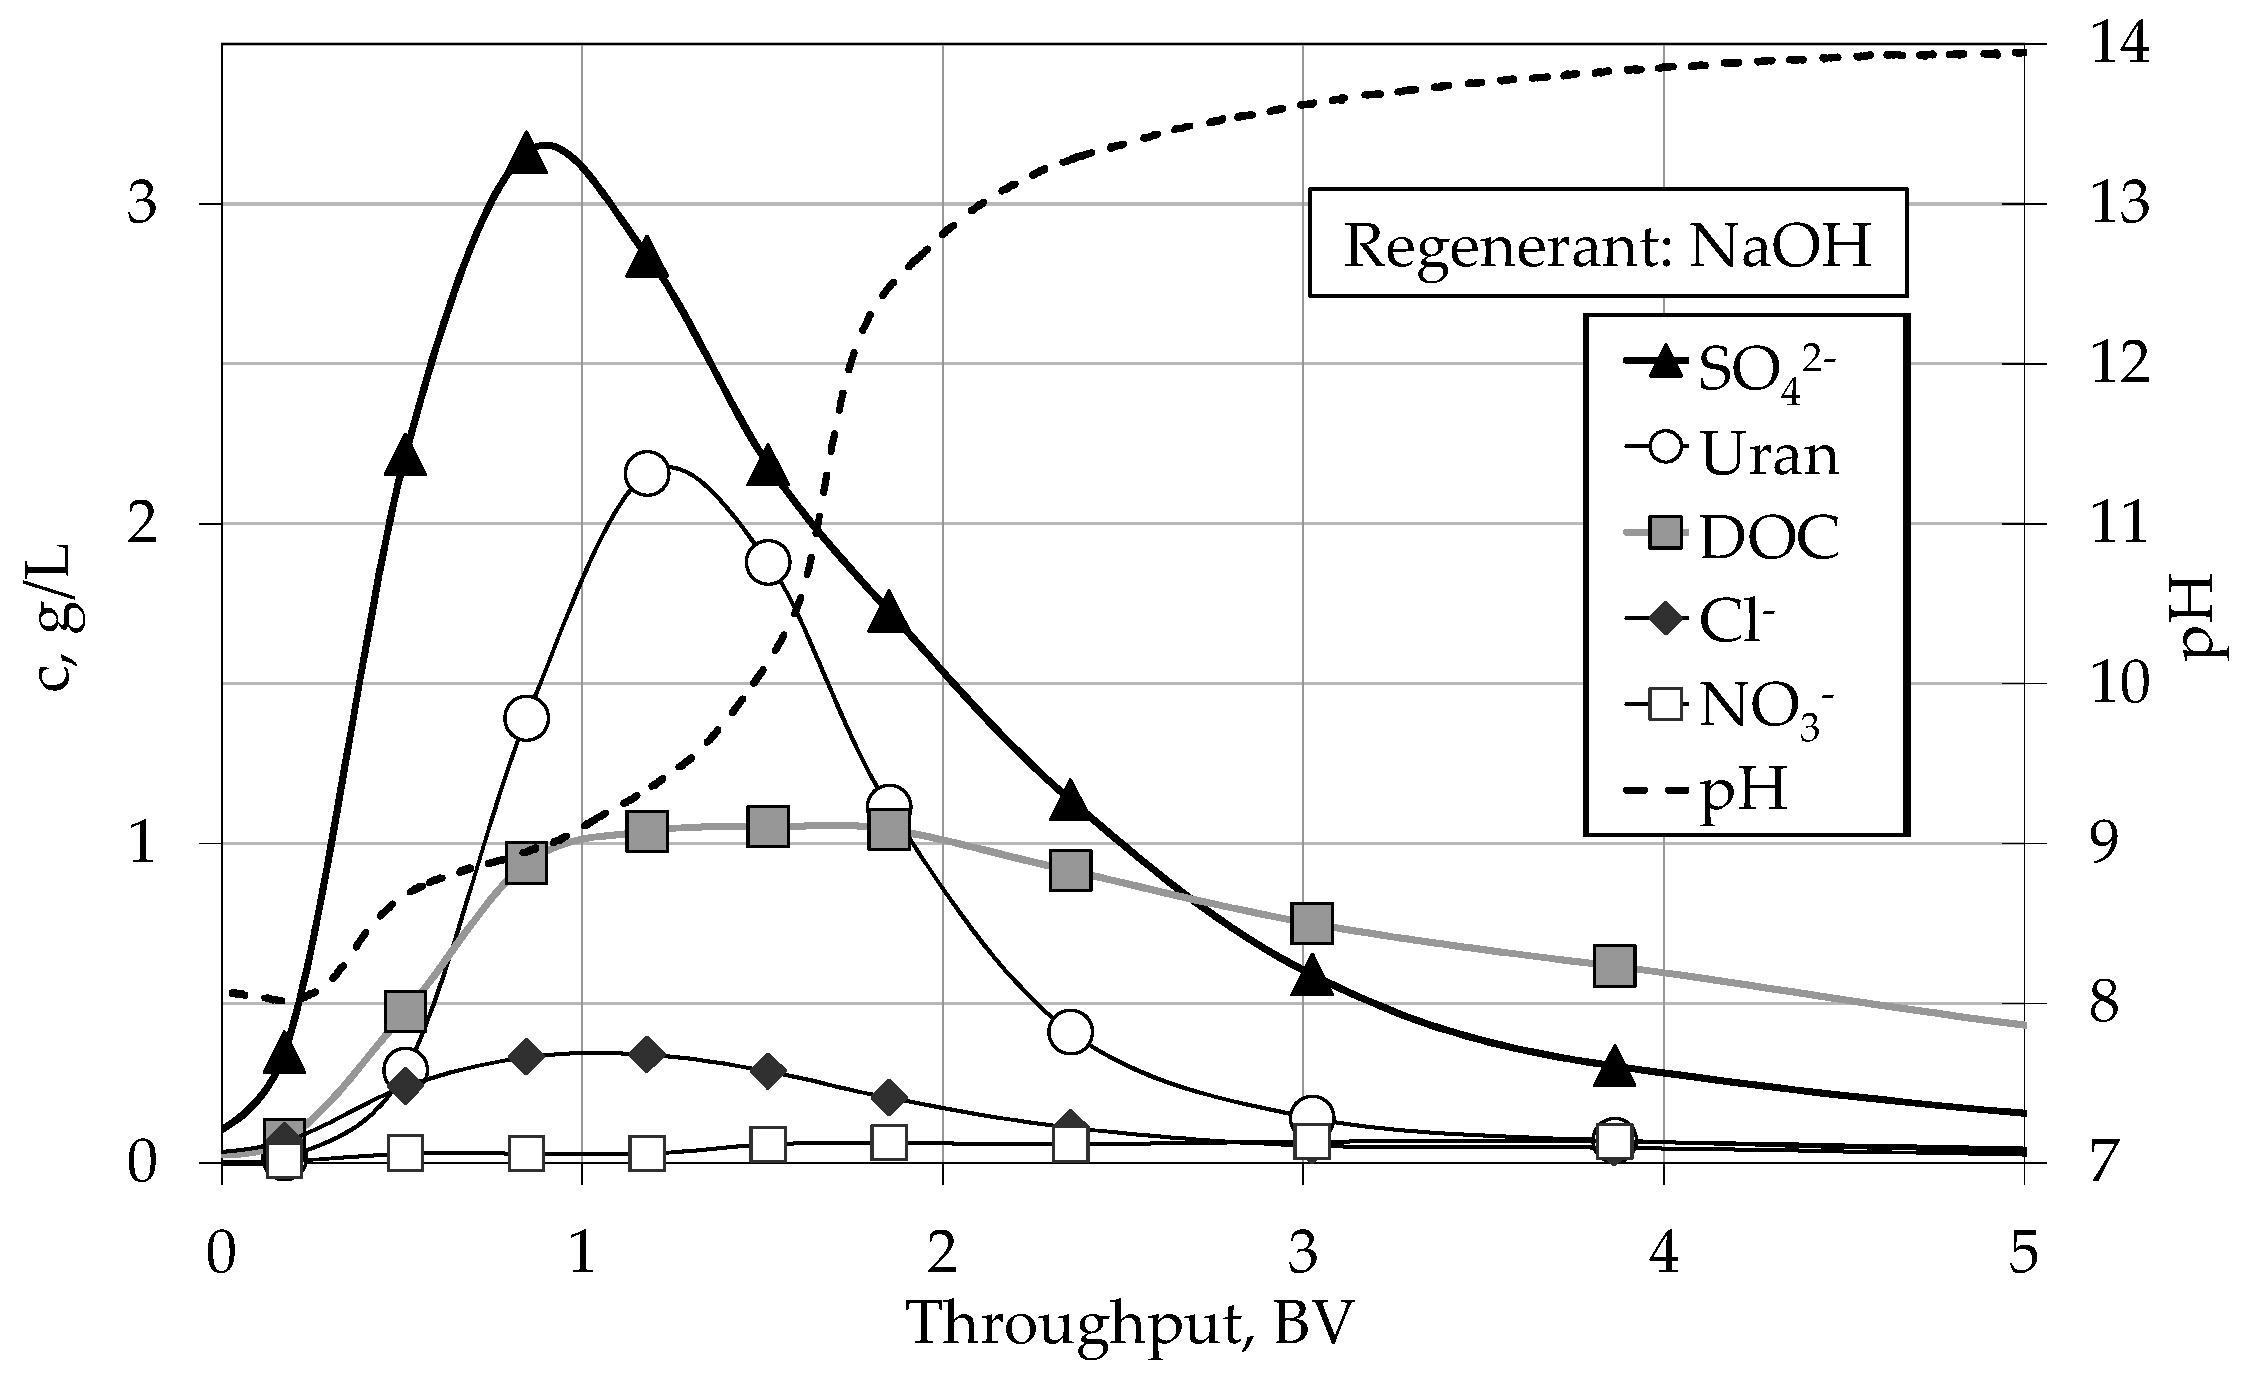
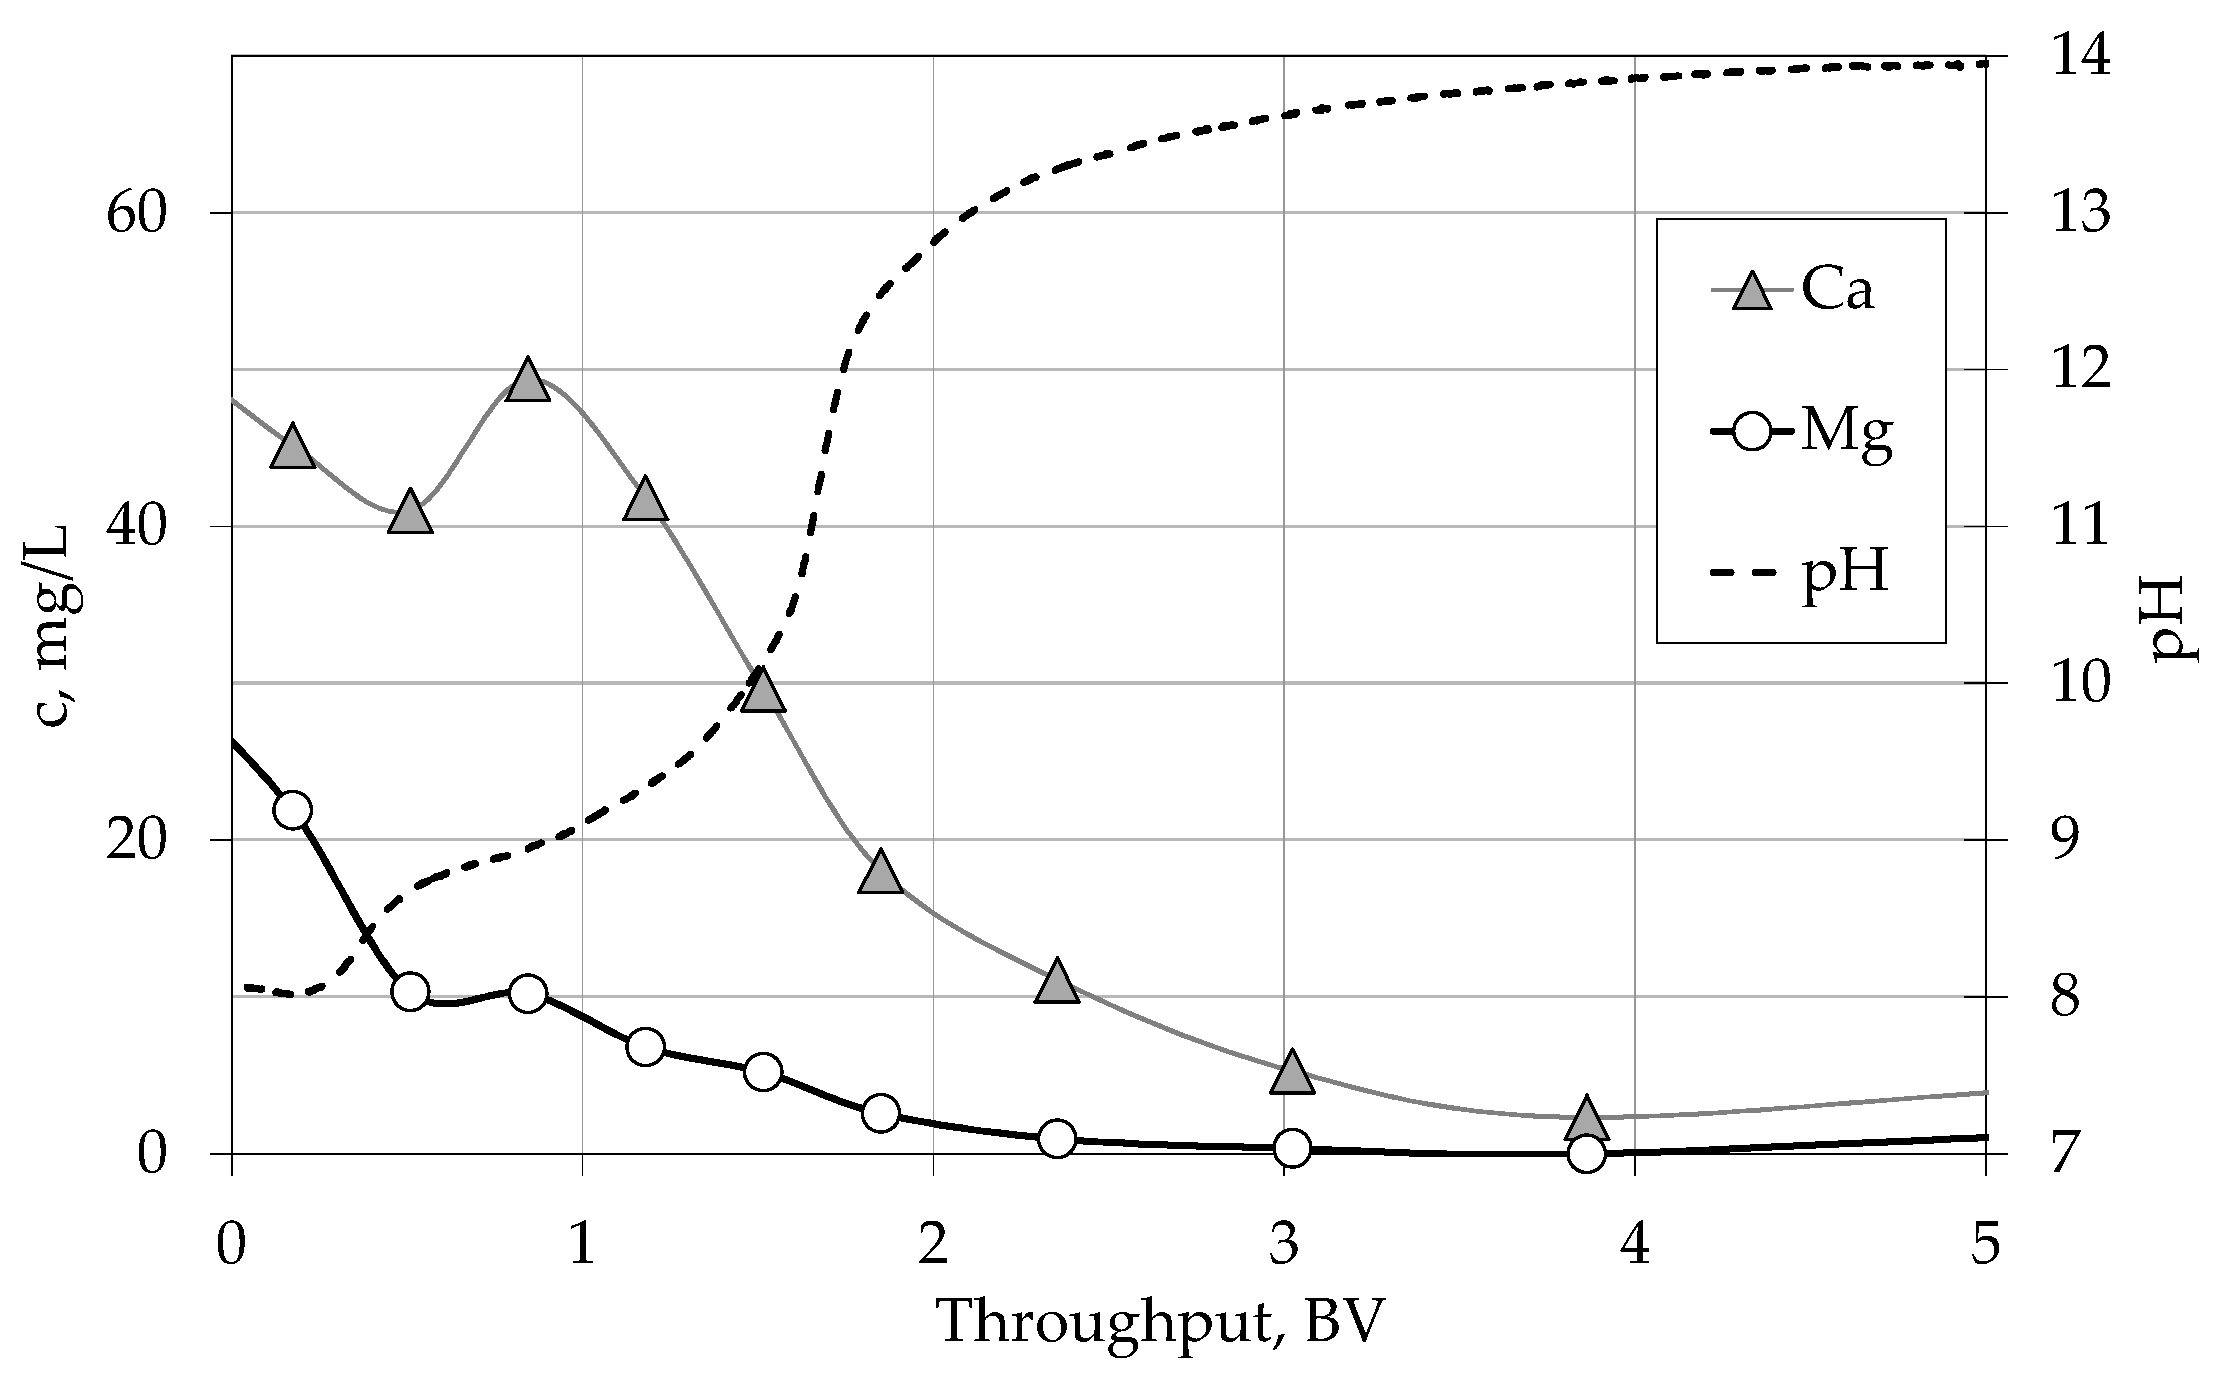
4.2.2. Column Experiments

To determine the mechanisms of uranium regeneration with 1 M caustic soda in column experiments, the concentrations of various anionic species were additionally determined. Due to technical reasons, a relatively high regenerant flow of 8 BV/h was used during these experiments. Figure 10 shows the concentrations of uranium, sulphate, chloride, nitrate, and DOC as well as the pH value during the filter regeneration of Amberlite IRA 67 in a lab scale column experiment. The largest amount of uranium and of the inorganic anions is released within 3 BV. Uranium concentrations amount to more than 2 g/L in this period. Sulphate and organic matter (DOC) occur in high concentrations as well. Chloride is found in much smaller concentrations; nitrate concentrations can be neglected. Consequently, until the time of resin exhaustion, no nitrate and only small amounts of chloride have been adsorbed onto the resin. Thus, the major competitor to uranium for sorption sites is divalent sulphate.
A uranium mass balance in the regenerant shows that only 10% of the adsorbed amount of uranium was released during the regeneration experiment. This poor regeneration efficiency can be explained by the alkaline regenerant (caustic soda) and corresponds to the results of the batch experiments in Figure 9.
Between a throughput of regenerant of 0.5 and 1.5 BV, the pH only increases slowly. In this period, most of the hydroxide ions of the regenerant are spent for deprotonating the functional resin groups and the release of the previously sorbed species is the most pronounced.
Compared to the inorganic species, the release of organic substances occurs much slower: After a regenerant throughput of 4 BV, the DOC is still 600 mg/L, corresponding to 60% of its maximum measured value. Although the pH has already increased to a value close to 14, an ongoing release of organic species is observed.
For the same regeneration experiment, the corresponding concentrations of calcium and magnesium are plotted in Figure 11. When the regeneration starts, both cations occur immediately at the column effluent because of their presence in the tap water which filled the column. After a throughput of about 1 BV, the concentration of calcium slightly increases. At this time, calcium is released from the exchanger, simultaneously with the release of uranium and sulphate. By balancing the measured concentrations and comparing the released masses, it can be deduced that calcium is released by less than 12% compared to the amount of uranium. Thus, only a small fraction of adsorbed uranium exists as a complex with calcium (assuming that CaUO2(CO3)32− is desorbed in the same manner as UO2(CO3)22− and does not remain on the ion exchanger to a large extend).
As almost no magnesium is released during the regeneration process, multivalent negatively charged uranium complexes with magnesium seem to be negligible for the adsorption onto the anion exchangers.

5. Discussion

The experiments have demonstrated that basic anion exchangers allow the efficient elimination of uranium species from groundwater. They show excellent uranium elimination over long periods of operation. Depending on the water composition, operation times of more than 300,000 BV can be reached. A strong impact on uranium adsorption by sulphate and carbonate can be seen. For weak basic anion exchangers, the pH value of the treated water also has a major impact on the sorption capacity. These results have also been found in previous batch experiments on uranium removal by anion exchangers [19].
The shape of the breakthrough curves and the calculated dimensionless parameters indicate that the film diffusion is rate controlling. As a consequence, the Nernst film becomes thinner and the diffusion in the liquid phase accelerates when increasing the filter velocity, VF, e.g., by matching the filter geometry. Thus, for technical filters, smaller column diameters are more appropriate for an efficient uranium adsorption and longer times of operation.
A further impact factor on the sorption dynamics is the diameter of the resin beads: The smaller the beads, the better the sorption behaviour. In practical applications, however, it is difficult to take advantage of this fact as an increasing head loss over the filter occurs when significantly decreasing the diameter of the beads.
When using weak basic anion exchangers in their free base form, it has been demonstrated that resin regeneration is feasible. The performed experiments indicate that a two-step regeneration seems appropriate, with a first acid regeneration step for uranium removal and a second alkaline regeneration step to reconvert the resin into the free base form. Thus, the regeneration of the resin during its use for uranium removal in drinking water treatment could also be performed on site in the waterworks.

Acknowledgments

The authors thank the German Federal Ministry of Education and Research (BMBF) and the German Technical and Scientific Association for Gas and Water (DVGW) for their financial support of this work. In addition, they are grateful to Rohm and Haas Comp. and LANXESS for providing the exchange resins.

Author Contributions

Marcel Riegel conceived and designed the bench scale experiments; Marcel Riegel performed the bench scale experiments and evaluated the experimental results; Volker Schlitt conceived, designed, and performed the pilot scale experiments; Marcel Riegel conceived the model and interpreted the data; Marcel Riegel wrote the paper.

Conflicts of Interest

The authors declare no conflict of interest.

References

  1. Nolan, J.; Weber, K.A. Natural uranium contamination in major U.S. aquifers linked to nitrate. Environ. Sci. Technol. Lett. 2015, 2, 215–220. [Google Scholar] [CrossRef]
  2. Gómez, P.; Garralón, A.; Buil, B.; Turrero, M.J.; Sánchez, L.; de la Cruz, B. Modeling of geochemical processes related to uranium mobilization in the groundwater of a uranium mine. Sci. Total Environ. 2006, 366, 295–309. [Google Scholar] [CrossRef] [PubMed]
  3. Birke, M.; Rauch, U.; Lorenz, H. Uranium in stream and mineral water of the Federal Republic of Germany. Environ. Geochem. Health 2009, 31, 693–706. [Google Scholar] [CrossRef] [PubMed]
  4. Liesch, T.; Hinrichsen, S.; Goldscheider, N. Uranium in groundwater—Fertilizers versus geogenic sources. Sci. Total Environ. 2015, 536, 981–995. [Google Scholar] [CrossRef] [PubMed]
  5. United States Environmental Protection Agency (US-EPA). National Primary Drinking Water Regulations; Radionuclides; Environmental Protection Agency: Washington, DC, USA, 2000.
  6. World Health Organization (WHO). Guidelines for Drinking-Water Quality, 1st Addendum to 3rd ed.; World Health Organization: Geneva, Switzerland, 2006. [Google Scholar]
  7. Verordnung über die Qualität von Wasser für den Menschlichen Gebrauch (Trinkwasserverordnung—TrinkwV) (Ordinance on the Quality of Water Intended for Human Consumption) vom 21. Mai 2001. Neufassung vom 10. März 2016. Available online: http://www.gesetze-im-internet.de/bundesrecht/trinkwv_2001/gesamt.pdf (accessed on 24 November 2016).
  8. Hanson, S.W.; Wilson, D.B.; Gunaji, N.N. Removal of Uranium from Drinking Water by Ion Exchange and Chemical Clarification; U.S. Environmental Protection Agency: Washington, DC, USA, 1987.
  9. Wazne, M.; Korfiatis, G.P.; Meng, X. Carbonate effects on hexavalent uranium adsorption by iron oxyhydroxide. Environ. Sci. Technol. 2003, 37, 3619–3624. [Google Scholar] [CrossRef] [PubMed]
  10. Katsoyiannis, I.A. Carbonate effects and pH-dependence of uranium sorption onto bacteriogenic iron oxides: Kinetic and equilibrium studies. J. Hazard. Mater. 2007, 139, 31–37. [Google Scholar] [CrossRef] [PubMed]
  11. Kalmykov, S.N.; Choppin, G.R. Mixed Ca2+/UO22+/CO32− complex formation at different ionic strengths. Radiochim. Acta 2000, 88, 603–606. [Google Scholar] [CrossRef]
  12. Dong, W.; Brooks, S.C. Determination of the formation constants of ternary complexes of uranyl and carbonate with alkaline earth metals (Mg2+, Ca2+, Sr2+, and Ba2+) using anion exchange method. Environ. Sci. Technol. 2006, 40, 4689–4695. [Google Scholar] [CrossRef] [PubMed]
  13. Dong, W.; Brooks, S.C. Formation of aqueous MgUO2(CO3)32− complex and uranium anion exchange mechanism onto an exchange resin. Environ. Sci. Technol. 2008, 42, 1979–1983. [Google Scholar] [CrossRef] [PubMed]
  14. Kelly, S.D.; Kemner, K.M.; Brooks, S.C.; Fredrickson, J.K.; Carroll, S.L.; Kennedy, D.W.; Zachara, J.M.; Plymale, A.E.; Fendorf, S. Ca-UO2-CO3 complexation—Implications for bioremediation of U(VI). Phys. Scr. 2005, T115, 915–917. [Google Scholar] [CrossRef]
  15. Kelly, S.D.; Kemner, K.M.; Brooks, S.C. X-ray absorption spectroscopy identifies calcium-uranyl-carbonate complexes at environmental concentrations. Geochim. Cosmochim. Acta 2007, 71, 821–834. [Google Scholar] [CrossRef]
  16. Riegel, M.; Höll, W.H. Removal of natural uranium from groundwater by means of weakly basic anion exchanges. In Proceedings of the IEX 2008, Cambridge, UK, 9–11 July 2008; Cox, M., Ed.; Society of Chemical Industry: London, UK, 2008; pp. 331–338. [Google Scholar]
  17. Riegel, M. Untersuchungen zur Elimination von Natürlichen Uranspezies aus Wässern mit Hilfe Schwach Basischer Anionenaustauscher (Investigation of Elimination of Natural Occurring Uranium Species from Water by Means of Weak Basic Anion Exchangers). Ph.D. Thesis, Technical University of Karlsruhe, Karlsruhe, Germany, 2009. [Google Scholar]
  18. Langmuir, D. Uranium solution-mineral equilibria at low temperatures with applications to sedimentary ore deposits, Geochim. Cosmochim. Acta 1978, 42, 547–569. [Google Scholar] [CrossRef]
  19. Fox, P.M.; Davis, J.A.; Zachara, J.M. The effect of calcium on aqueous uranium(VI) speciation and adsorption to ferrihydrite and quartz. Geochim. Cosmochim. Acta 2006, 70, 1379–1387. [Google Scholar] [CrossRef]
  20. Jekel, M.; Bahr, C.; Riegel, M.; Schlitt, V.; Baldauf, G.; Höll, W.H. Uranentfernung in der Trinkwasseraufbereitung (Elimination of uranium during drinking water treatment). Energ. Wasser Prax. 2010, 6, 54–59. [Google Scholar]
  21. Umweltbundesamt (Federal Environmental Agency). Liste der Aufbereitungsstoffe und Desinfektionsverfahren gemäß § 11 Trinkwasserverordnung 2001 (List of Preparation Substances and Disinfection Processes in Compliance with § 11 German Drinking Water Ordinance). 12. Änderung, Stand Dezember 2009. Available online: https://www.umweltbundesamt.de/sites/default/files/medien/481/dokumente/17_aenderung_aufbereitungsstoffe_desinfektionsverfahren_11_trinkwv_11_2012.pdf (accessed on 24 November 2016).
  22. Water Quality–Application of Inductively Coupled Plasma Mass Spectrometry (ICP-MS)—Part 2: Determination of 62 Elements (ISO 17294-2:2003); Beuth: Berlin, Germany, 2003.
  23. Agarwal, R.P. Difference Equation and Inequalities; Marcel Dekker: New York, NY, USA, 2000. [Google Scholar]
  24. Bjoerck, A.; Dahlquist, G. Numerical Mathematics and Scientific Computation; Siam: Philadelphia, PA, USA, 1999. [Google Scholar]
  25. Sontheimer, H.; Crittenden, J.C.; Summers, R.S. Activated Carbon for Water Treatment; DVGW-Forschungsstelle: Karlsruhe, Germany, 1988. [Google Scholar]
  26. Crittenden, J.C.; Weber, W.J. Predictive model for design of fixed-bed adsorbers: Single-component model verification. J. Environ. Eng. Div. 1978, 104, 433–443. [Google Scholar]
  27. Crittenden, J.C.; Wong, B.W.C.; Thacker, W.E.; Snoeyink, V.L.; Hinrichs, R.L. Mathematical model of sequential loading in fixed-bed adsorbers. J. Water Pollut. Control Fed. 1980, 52, 2780–2795. [Google Scholar]
  28. Sperlich, A.; Schimmelpfennig, S.; Baumgarten, B.; Genz, A.; Amy, G.; Worch, E.; Jekel, M. Predicting anion breakthrough in granular ferric hydroxide (GFH) adsorption filters. Water Res. 2008, 42, 2073–2082. [Google Scholar] [CrossRef] [PubMed]
  29. Zhang, Q.; Crittenden, J.; Hristovski, K.; Hand, D.; Westerhoff, P. User-oriented batch reactor solutions to the homogeneous surface diffusion model for different activated carbon dosages. Water Res. 2009, 43, 1859–1866. [Google Scholar] [CrossRef] [PubMed]
  30. Riegel, M.; Tokmachev, M.; Höll, W.H. Kinetics of uranium sorption onto weakly basic anion exchangers. React. Funct. Polym. 2008, 68, 1072–1080. [Google Scholar] [CrossRef]
  31. Grossmann, J.J.; Adamson, A.W. The diffusion process for organolite exchangers. J. Phys. Chem. 1952, 56, 97–100. [Google Scholar] [CrossRef]
  32. Helfferich, F. Kinetik des Ionenaustauschs. Angew. Chem. 1956, 68, 693–698. [Google Scholar] [CrossRef]
  33. Schlögl, R.; Helfferich, F. Comment on the significance of diffusion potentials in ion exchange kinetics. J. Chem. Phys. 1957, 26, 5–7. [Google Scholar] [CrossRef]
  34. Helfferich, F.; Plesset, M.S. Ion exchange kinetics. A nonlinear diffusion problem. J. Chem. Phys. 1958, 28, 418–424. [Google Scholar] [CrossRef]
  35. Gnielinski, V. Gleichungen zur Berechnung des Wärme- und Stoffaustausches in durchströmten Kugelschüttungen bei mittleren und großen Peclet-Zahlen. Verfahrenstechnik 1978, 12, 363–366. [Google Scholar]
  36. Worch, E. Eine neue Gleichung zur Berechnung von Diffusionskoeffizienten gelöster Stoffe. Vom Wasser 1993, 81, 289–297. [Google Scholar]
  37. Wilson, E.J.; Geankoplis, C.J. Liquid mass transfer at very low Reynolds numbers in packed beds. Ind. Eng. Chem. Fundam. 1966, 5, 9–14. [Google Scholar] [CrossRef]
Figure 1. Calculated uranium speciation, c(U) = 1000 µg/L, total inorganic carbon = 48 mg/L, using the MINEQL© software [17].
Water 09 00268 g001
Figure 2. Experimental and calculated breakthrough curves for Amberlite IRA 67, modelling parameters: qmax = 296 µmol/g, KL = 9.2 L/mg (equilibrium parameter at pH 7.3), DS = 10−12 m2/s, βL = 1.6×10⁻⁵ m/s, dP = 0.625 mm, ρF = 0.68 kg/L, ε = 0.36.
Water 09 00268 g002
Figure 3. Experimental and calculated breakthrough curves for Lewatit MP 62, modelling parameters: qmax = 120 µmol/g, KL = 4.3 L/mg (≙ equilibrium parameter at pH 7.3 [19]), DS = 2 × 10⁻¹³ m2/s, βL = 1.6 × 10⁻⁵ m/s, dP = 0.47 mm, ρF = 0.65 kg/L, ε = 0.37.
Water 09 00268 g003
Figure 4. Uranium breakthrough of WBA Amberlite IRA 67 in (a) waterworks I and (b) waterworks II.
Water 09 00268 g004
Figure 5. Uranium breakthrough of SBA Lewatit S 6368 in (a) waterworks I and (b) waterworks II.
Water 09 00268 g005
Figure 6. Theoretical impact of the solid phase diffusion coefficient DS on uranium breakthrough.
Water 09 00268 g006
Figure 7. Theoretical impact of the liquid phase mass transfer coefficient βL on uranium breakthrough.
Water 09 00268 g007
Figure 8. Theoretical impact of the particle diameter dP on uranium breakthrough.
Water 09 00268 g008
Figure 9. Level of uranium regeneration during a two-step process, V/m = 200 mL/g (each step); arrows indicate the order of regenerant application.
Water 09 00268 g009
Figure 10. Concentrations of various parameters during column regeneration.
Water 09 00268 g010
Figure 11. Concentrations of the main cations and pH during column regeneration.
Water 09 00268 g011
Table 1. Resin characteristics.
Amberlite IRA 67Lewatit MP 62Lewatit S 6368
WBAWBASBA
Matrix 1 Acrylic acid divinylbenzene copolymerStyrene divinylbenzene copolymerStyrene divinylbenzene copolymer
Functional groups 1 Tertiary and secondary amineTertiary amineQuaternary amine
Effective size dP 1mm0.470.5–0.750.62
Particle density ρP 2g/mL1.061.03-
Bulk density ρF 2g/mL0.680.65-
Bulk porosity ε 2-0.360.37-
Notes: 1 Manufacturers’ data, 2 Experimentally determined.
Table 2. Raw water composition at the two treatment sites.
Waterworks IWaterworks II
pH-6.97.4
Ca2+mg/L7948
SO42−mg/L9238
HCO3mg/L350221
Clmg/L6519
DOCmg/L1.80.6
Table 3. Comparison of sorption conditions between bench and full scale plants.
Bench ScaleFull Scale
Filter geometry
Filter diameterdF2 cm1 m
Filter heighthF8.5 cm1.5 m
Filter volumeVF27 mL1.2 m3
Ion exchanger
Resin amountm18 g800 kg
Kinetics
Solid diffusion coefficientDS10–12 m2/s10–12 m2/s
Liquid mass transfer coefficientβL1.5 10–5 m/s5 10–5 m/s
Raw water
Initial concentrationc01000 µg/L60 µg/L
Loading in equilibrium with c0q0267 µmol/L42 µmol/L
Filter conditions
FluxQ20 BV/h20 BV/h
Q0.5 L/h24 m3/h
Filter velocityVF1.7 m/h30 m/h
Stoichiometric throughputVstoich43,000 BV113,000 BV
Time of stoichiometric breakthroughtstoich90 d235 d
Surface diffusion modulusEd86226
Modified Stanton numberSt*619
Biot numberBi0.070.08

