1. Introduction
According to the World Meteorological Organization (WMO), the Probable Maximum Precipitation (PMP) is the theoretical maximum precipitation for a given duration under modern meteorological conditions [
1]. The PMP approach has been widely used to estimate extreme precipitation, providing disaster risk management procedures including emergency preparedness. Particularly, over the last few decades, estimated PMP values have allowed for the design, operation, and risk assessment of large hydraulic infrastructures, such as dams, levees, and urban drainage [
2]. However, these issues remain difficult to solve because many global disasters are caused by heavy precipitation and floods. Also, a future projection based on global circulation models shows that water vapor concentrations will increase worldwide during the 21st century, which, in turn, will result in an increase in PMP [
3].
Traditionally, PMP estimates have relied chiefly on statistical and hydro-meteorological approaches. The statistical methods are based on a frequency analysis of annual maximum precipitation data [
4]. However, the analyses that solely rely on historical records and their sample statistics may no longer be suitable for making inferences on the future behavior of the hydro-climate conditions over a watershed [
5]. Most scientific organizations follow the hydro-meteorological approach of the WMO for the PMP estimation. While there are different methods depending on the amount of available data or basin location, the procedure follows the maximization and transposition of actual storms [
6].
Although this particular PMP approach has been improved through various studies and applied in many regions worldwide, it still has some limitations. First, it is calculated based on historically observed local data. Hence, it is very sensitive to the availability of local observation data [
7]. Moreover, it is fundamentally based on the assumption of stationarity of the observation data and cannot account for non-stationarity, although various evidences of global climate change have been recently reported [
8]. Second, this PMP approach is questionable in that the orographic component can be linearly separated from the convergence component, while the Earth’s atmosphere is a highly nonlinear system [
5]. Approximately 70% of the land on the Korean Peninsula is mountainous, thus, precipitation is usually enhanced by the topography [
9]. This orthographic component is especially important in Korea. Third, the spatiotemporal distribution of precipitation in the watershed is dynamically changed by the physical interaction between the meteorological factors and the geographical factors. Therefore, the assumption of artificial distribution types is often inappropriate [
10]. Fourth, although there have been a number of studies that have estimated PMP by applying properly well-recognized methodologies, there is little research to objectively evaluate the accuracy of PMP estimation. These limitations have questioned the validity and physical reality of the current PMP. Therefore, a more scientific method to estimate PMP is required.
In Korea, three PMP reports have been nationally published by the Ministry of Construction and Transportation (MOCT) in 1988, 2000 and 2004, respectively [
11,
12,
13]. In the most recent report published in 2004 [
13], Typhoon Rusa and Typhoon Maemi were added to recalculate the PMP. However, even this report has some problems for PMP estimation [
10]. Actually, it does not properly provide PMP information near Gangneung, which was greatly affected by Typhoon Rusa. Because of this, a report for PMP and Probable Maximum Flood (PMF) estimation procedures guidance service was published by the Ministry of Land, Transport and Maritime Affairs (MOLTMA) and Korea Water Resources Corporation (K-Water) in 2008 [
10].
A regional climate model (RCM) approach that accounts for the various effects of the nonlinear atmospheric system in an orographic region may provide an objective PMP estimate without any assumptions and statistical linear relationships [
5]. This model-based approach can overcome the limitations of traditional approaches and provide various information. Some recent studies have attempted to estimate the PMP using such a regional climate model [
5,
7]. Several studies have been performed to reconstruct extreme precipitation events in Korea using the Weather Research and Forecasting (WRF) model. Lee and Choi [
9] and Kim and Lee [
14] carried out the numerical simulation of Typhoon Rusa. Choi et al. [
15] and Byun et al. [
16] examined the ability of the WRF model in reconstructing the extreme precipitation over central Korea. Hong and Lee [
17] examined the ability of the WRF model for flash-flood extreme precipitation events that occurred in Gyeonggi region. Lee and Lee [
18] simulated precipitation in the Jecheon city. Also, Lee and Hong [
19] simulated the extreme precipitation that occurred in the Yangdong area and examined the orographic effects.
The mentioned studies are carried out in the meteorological field for the purpose of forecasting (e.g., performance evaluation, sensitivity analysis of the model and causes of the extreme rainfall). Therefore, the spatial distribution of the interest meteorological factors (e.g., pressure and wind speed) is excellently reconstructed. However, most of the results underestimated the precipitation and did not reconstruct temporal distribution. These results have many limitations in the application of hydrological or disaster prevention field, in which the total amount of extreme rainfall and its spatio-temporal distribution are the most important.
A RCM approach for PMP estimates has not yet been applied to Korea. This paper suggests a method to estimate the extreme precipitation in Korea using a RCM. In this study, the estimated extreme precipitation is called RCM_PMP, to distinguish it from the traditional PMP.
2. Materials and Methods
The modeling processes of the suggested method are as follows. First, several historical extreme precipitation events are identified and the most powerful extreme event is selected. Second, the selected event is reconstructed through the WRF model, which is a RCM. Finally, the reconstructed event is maximized by adjusting initial and boundary conditions to obtained RCM_PMP that will be compared to the existing PMP in
Section 3.2.
2.1. Selection of Historical Extreme Event
A majority of heavy precipitation events in Korea are concentrated in the summer monsoon season, in part due to the coincident typhoon season in the western North Pacific [
20]. A typhoon is a mature tropical cyclone that comes with strong wind and torrential rain, and is the most damaging natural disaster in Korea. Recently, many studies have reported that the increase of the intensity of typhoons is related to climate change [
21]. Based on these results, this study focuses on typhoons in historical extreme events.
Several important storms can affect the PMP estimate, but not all of them need to be considered. In this study, Typhoon Rusa (22 August–3 September 2002) has been selected for a worst case extreme event. Typhoon Rusa was the most powerful extreme event to strike Korea since Typhoon Sarah in 1959.
While Typhoon Rusa passed over the southern Korean Peninsula, heavy rainfall occurred in the southern and the eastern coastlines and the inland. Typhoon Rusa produced record-breaking daily rainfall over Gangneung with a daily accumulated precipitation of 870.5 mm and a maximum hourly rainfall rate of 98 mm/h. The daily precipitation exceeded 60% of the total annual precipitation (1401.9 mm) at Gangneung [
9].
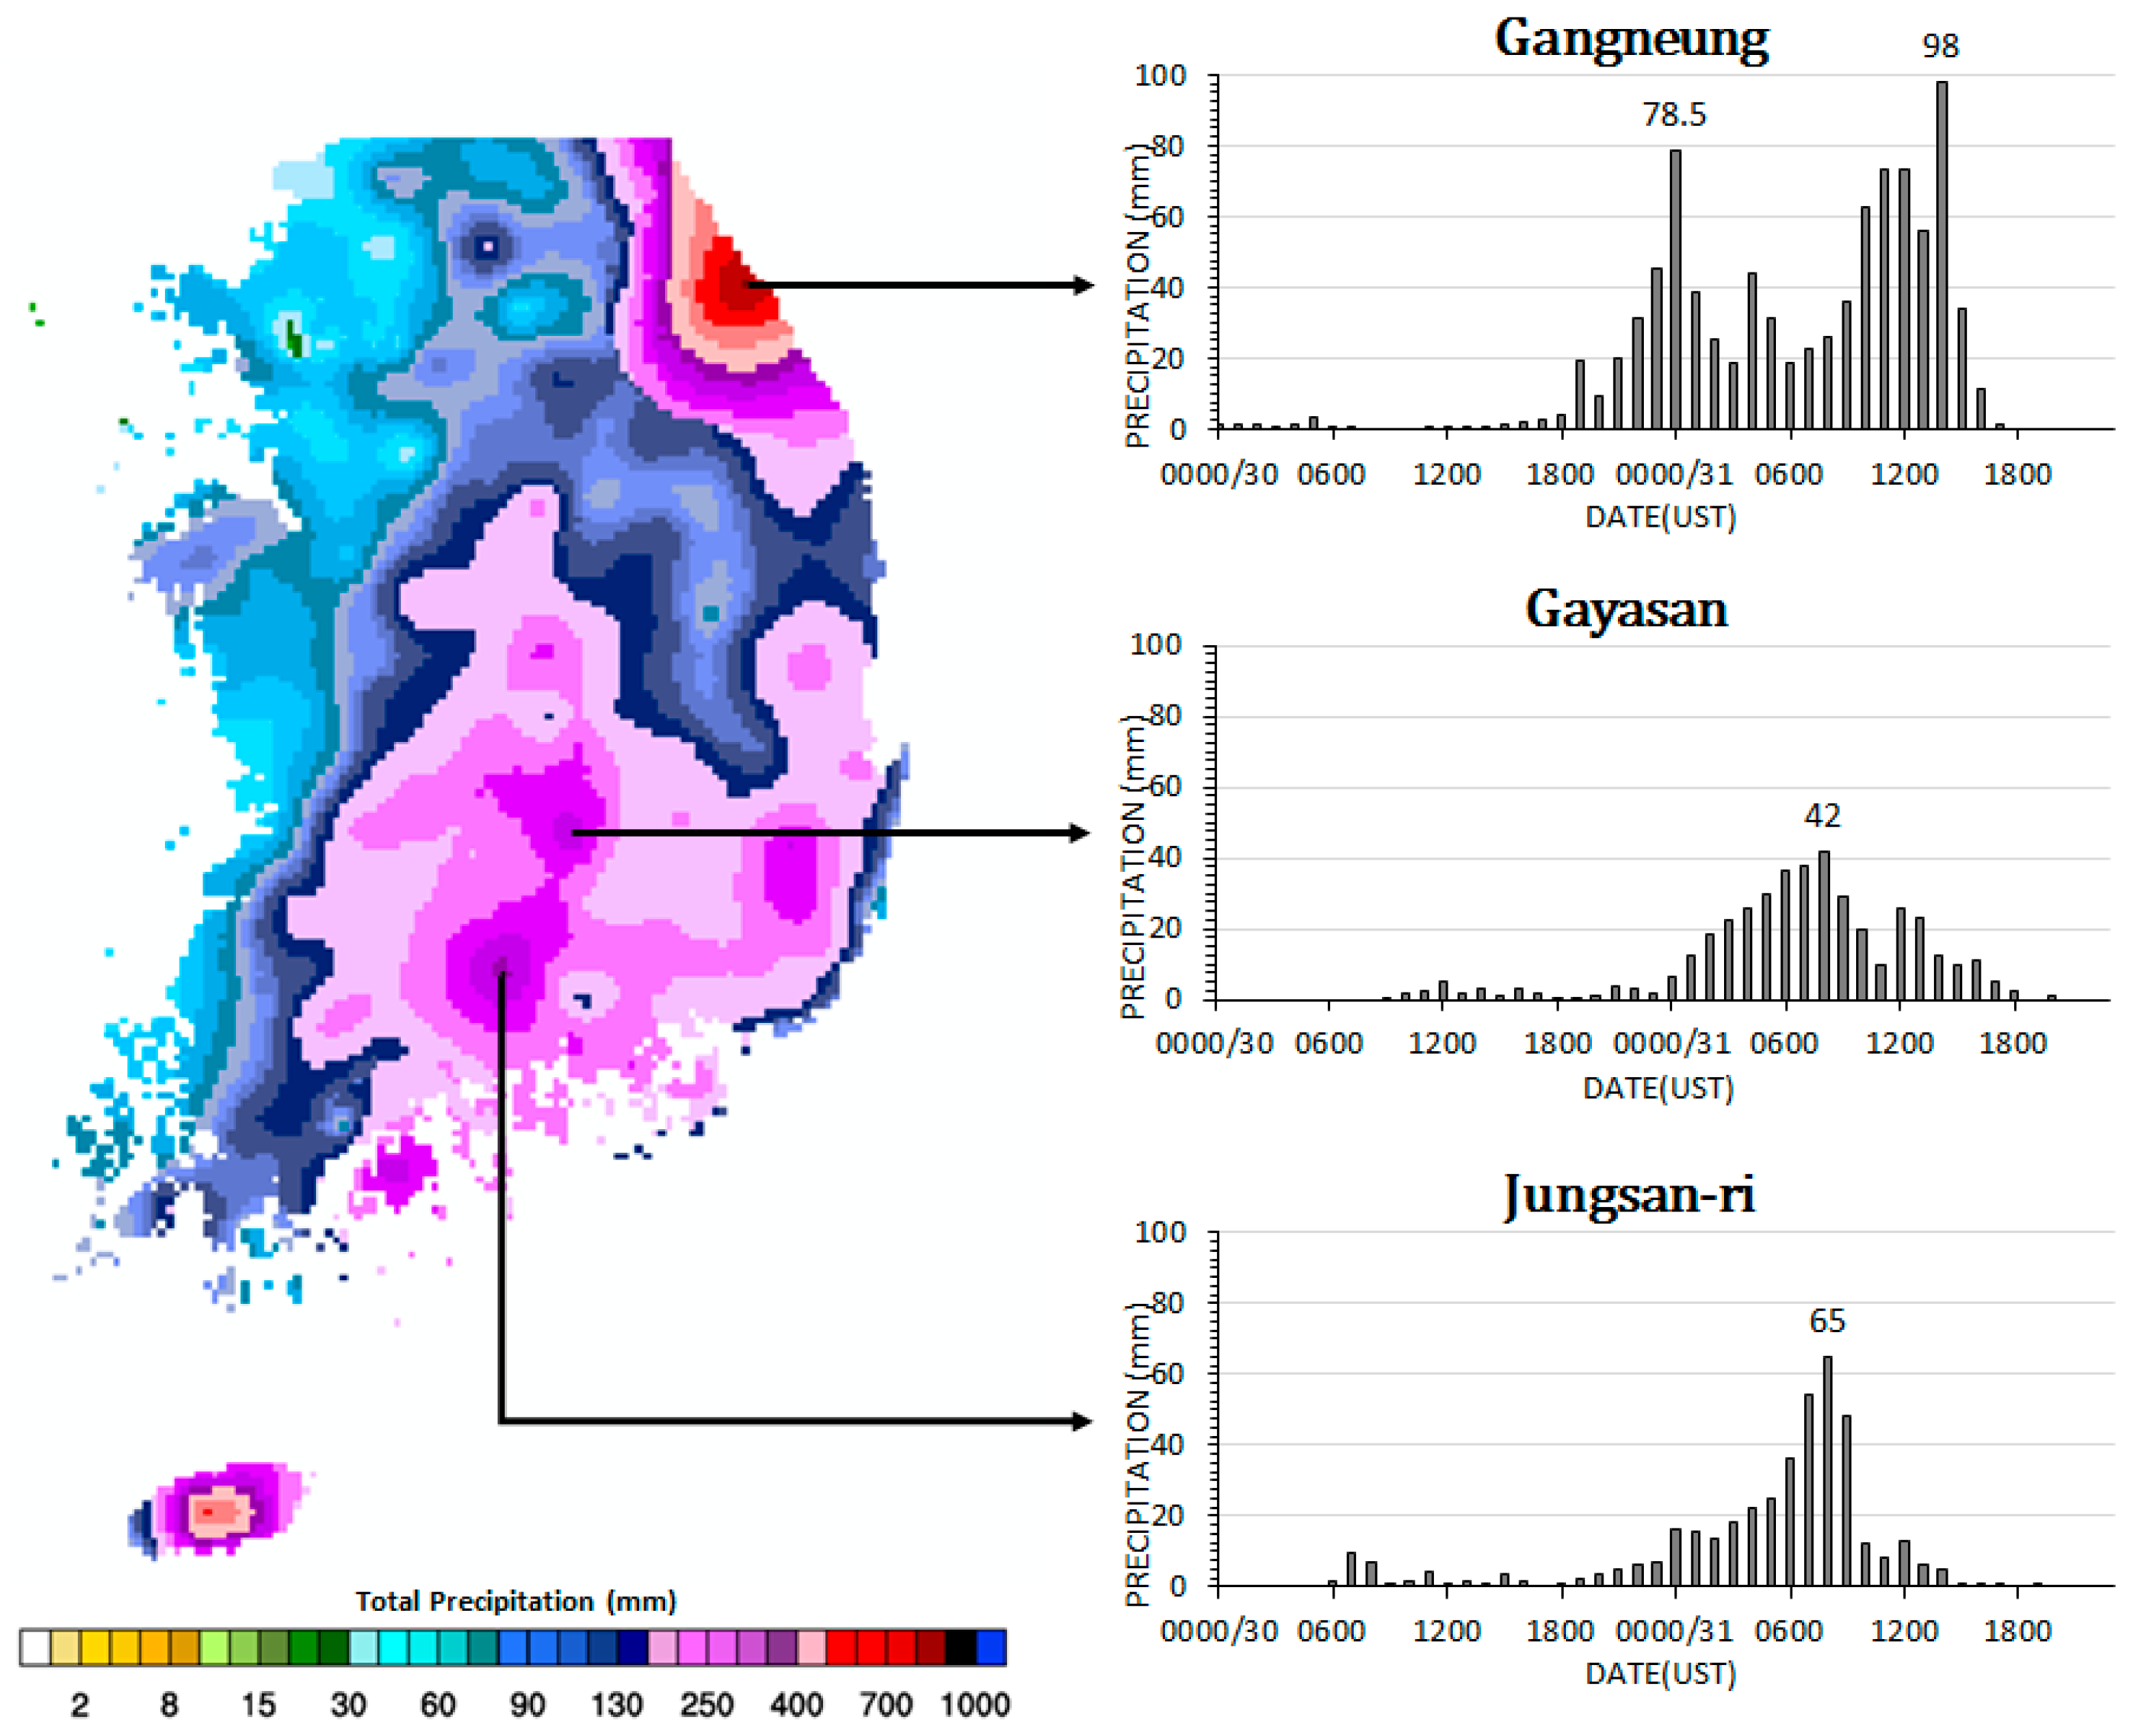
Figure 1 shows the observed accumulated precipitation and the time series of hourly precipitation at Gangneung, Gayasan and Jungsan-ri ground weather stations caused by Typhoon Rusa from 00 UTC 30 to 18 UTC 31 August 2002. They are based on hourly rainfall data from the 426 Automatic Weather System (AWS) and the 74 ASOS (Automated Synoptic Observing System) provided by the Korea Meteorological Administration (KMA), and the spatial distribution of accumulated precipitation derived by the Kriging method. During this period, Gangneung, Gayasan and Jungsan-ri stations recorded the 42 h accumulated precipitation of 896, 419.5 and 415 mm and maximum intensity of 98, 42, 65 mm/h, respectively.
2.2. Overview of WRF
The WRF Model is a next-generation mesoscale numerical weather prediction system designed for both atmospheric research and operational forecasting needs [
22]. The model serves a wide range of meteorological applications across scales from tens of meters to thousands of kilometers. The WRF system contains two dynamical solvers, referred to as the ARW (Advanced Research WRF) core and the NMM (Nonhydrostatic Mesoscale Model) core. The ARW core is used for this study. The equation set for ARW is fully compressible, Eulerian and nonhydrostatic with a run-time hydrostatic option. It is conservative for scalar variables. The model uses terrain-following, hydrostatic-pressure vertical coordinate with the top of the model being a constant pressure surface. The horizontal grid is the Arakawa-C grid. The time integration scheme in the model uses the third-order Runge-Kutta scheme, and the spatial discretization employs 2nd to 6th order schemes [
23].
We used the WRF version 3.6.1 to simulate the typhoon including heavy precipitation event in Korea.
2.3. Reconstruction of Historical Extreme Event
The performance of numerical model depends heavily on initial conditions and physics options. A number of numerical experiments are carried out to reconstruct the historical extreme event by changing the model options and the initial/boundary conditions (IC/BC). The WRF has various physical options that influence the different meteorological parameters. Among them, microphysics scheme (MPS), cumulus parameterization scheme (CPS) and planetary boundary layer (PBL) are known to influence the precipitation [
17,
24,
25]. Each physics option contains different schemes and the details of all schemes have been comprehensively explained by Skamarock et al. [
22].
Various experiments were performed, consisting of the eight different MPS (K, L, WSM3, WSM5, F, WSM6, GGCE, TG) and the three CPS (KF, BMJ, GFE) and the two different PBL (YSU, MYJ). The best combination of physics options is identified based on these experiments using observed precipitation data and typhoon best track.
The WRF model was run on triple-nested domains with 27 km (d01), 9 km (d02), and 3 km (d03) horizontal resolution (
Figure 2). The whole domain has 30 vertical layers with the layer-top pressure of 50 hPa.
One way nesting method applies to each domain, because results did not show a significant difference between one and two way nesting. The one way nesting method means that information exchange between the parent and the nest is strictly down-scale. All experiments were performed for 66 h starting at 0000 UTC 30 August 2002. The IC and 6-hourly BC were forced by the improved National Center for Environmental Prediction (NCEP) FNL data. The improved NCEP FNL data was created based on conventional NCEP data and Real-Time, Global, Sea Surface Temperature analysis data, NCEP global surface observational weather data, ASOS and AWS data from KMA to improve the IC/BC.
Table 1 shows the summary of the WRF model configuration.
2.4. RCM_PMP
RCM_PMP is estimated based on the reconstructed historical extreme event. Like the traditional PMP approach, the model-based approach also requires techniques to maximize precipitation. Maximization is performed with reference to the moisture maximization technique of the traditional PMP approach.
The moisture maximization technique maximizes the observed precipitation by the moisture maximizing ratio
, where
is the probable maximum precipitable water equivalent of the maximum persisting 12-h 1000-hPa dew point temperature for the date of storm occurrence and
is precipitable water equivalent of the representative persisting 12-h 1000-hPa dew point temperature [
1]. That means that the traditional PMP is affected by dew point temperatures. If the relative humidity is 100%, the dew point temperature is equal to the current air temperature.
In order to determine the ideal model-based moisture maximization technique, we established two scenarios according to increase of Relative Humidity (
RH), Air Temperature (
T) and Sea Surface Temperature (
SST). At this time, the changes of
RH were reflected only in d03. The BC of d01 and d02 are far from the storm area, so the effect of the BC changes on the storm area is insignificant. The changes of
T and
SST were applied to the entire domain.
Analysis of dew point temperature data at the Gangneung station during 15 UTC 30 August to 00 UTC 1 September 2002 gives the maximum dew point temperature of 20 °C. An estimation of 100-year return period dew point temperature has been carried out by the frequency analysis of the annual maximum series of dew point temperature in August and September at the Gangneung station. The 100-year dew point temperature was found to be 26 °C. Thus, ΔT is set as 6 °C.
If the T rises, the SST increases, too. To obtain SST increases, we performed regression analysis using buoy observations (daily air temperature and sea surface temperature) on Korea’s south coast. Regression analysis showed that SST increased by 3.84 °C when T increased by 6 °C. Thus, ΔSST is set as 3.84 °C.
The RCM_PMP is identified on the basis of each scenario, then it is compared to the existing PMP value which has been estimated by Lee et al. [
26], which include the most recent PMP estimates in Korea. As mentioned in the introduction, there are some problems with nationally published reports about PMP. To overcome these problems, Lee et al. [
26] improved the existing PMP estimation method and calculated the PMP in Korea by applying the latest PMP estimation method suggested by WMO (2009).
3. Results and Discussion
3.1. Reconstruction of Historical Extreme Event
Numerical experiments were performed on a total of 25 physics option combinations (MPS, CPS and PBL) to reconstruct the historical extreme event. By using observed typhoon track and precipitation data, the best combination of physics option was determined.
Numerical experiments revealed that a combination of microphysics scheme (WSM6), cumulus parameterization scheme (BMJ) and planetary boundary layer (MYJ) schemes resulted in relatively good performance on the typhoon track and the spatial distribution of observed precipitation data. It was thus concluded that the combination of WSM6, BMJ and MYJ scheme is the best combination of physics option for the WRF in this study.
However, the typhoon track tended to be slanted toward northwest. The precipitation also occurred earlier than observed. Therefore, numerical experiments were again carried out by modifying the model IC and BC, and each result was evaluated on the basis of the observed typhoon track and precipitation data.
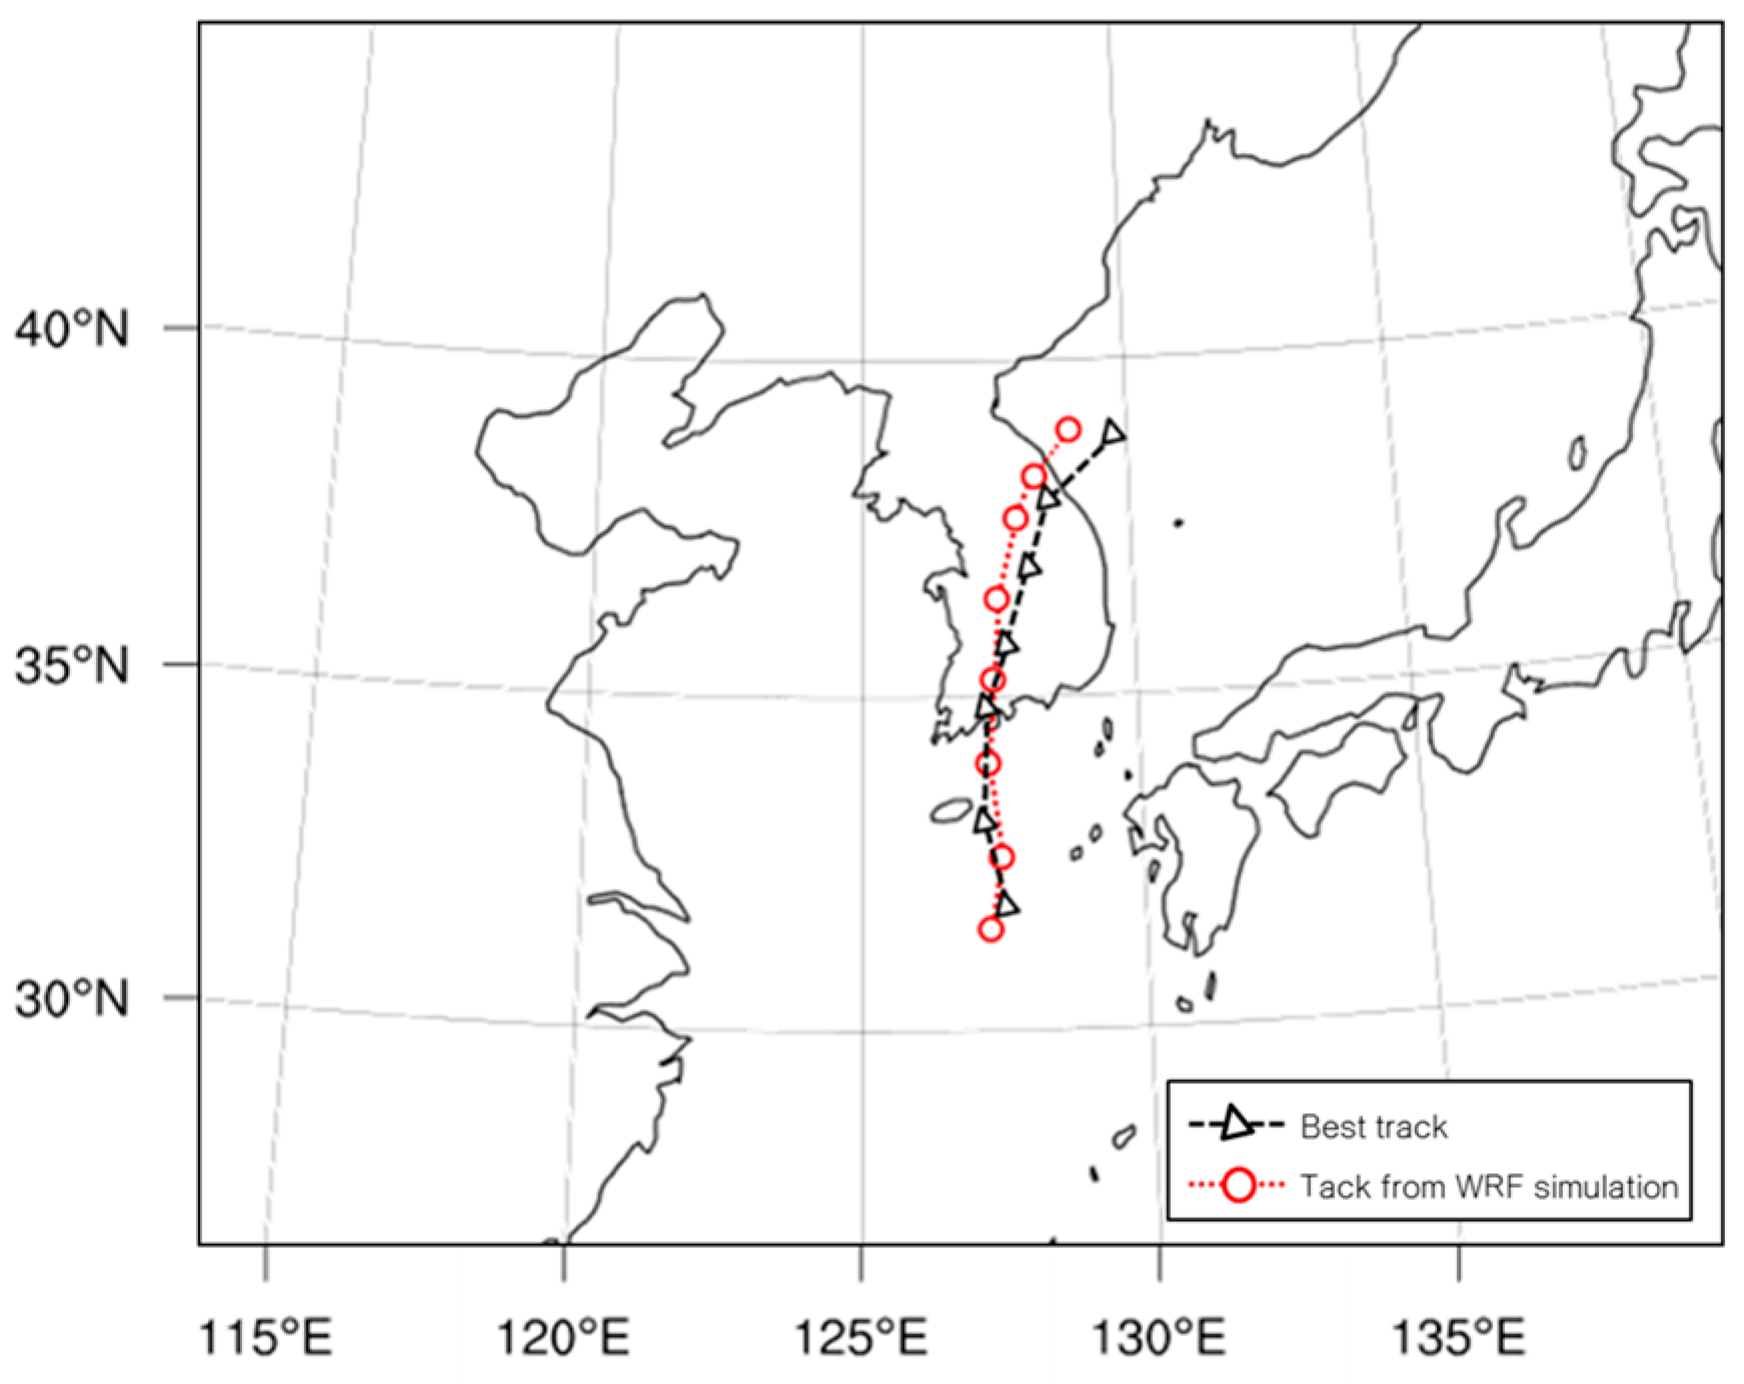
When the model IC and BC were modified, all pressure-related variables (e.g., surface pressure, sea level pressure, and temperature) shifted about 76 km toward southeast and wind velocity was decreased by 70%. Hence, the simulation results showed the best agreement with the observation. Although it was still slightly shifted westward and tended to move slower than the best track after the typhoon passed the Jiri Mountain, the simulated track was close to the best track (
Figure 3).
The WRF successfully simulated the observed precipitation in terms of spatial and temporal distribution.
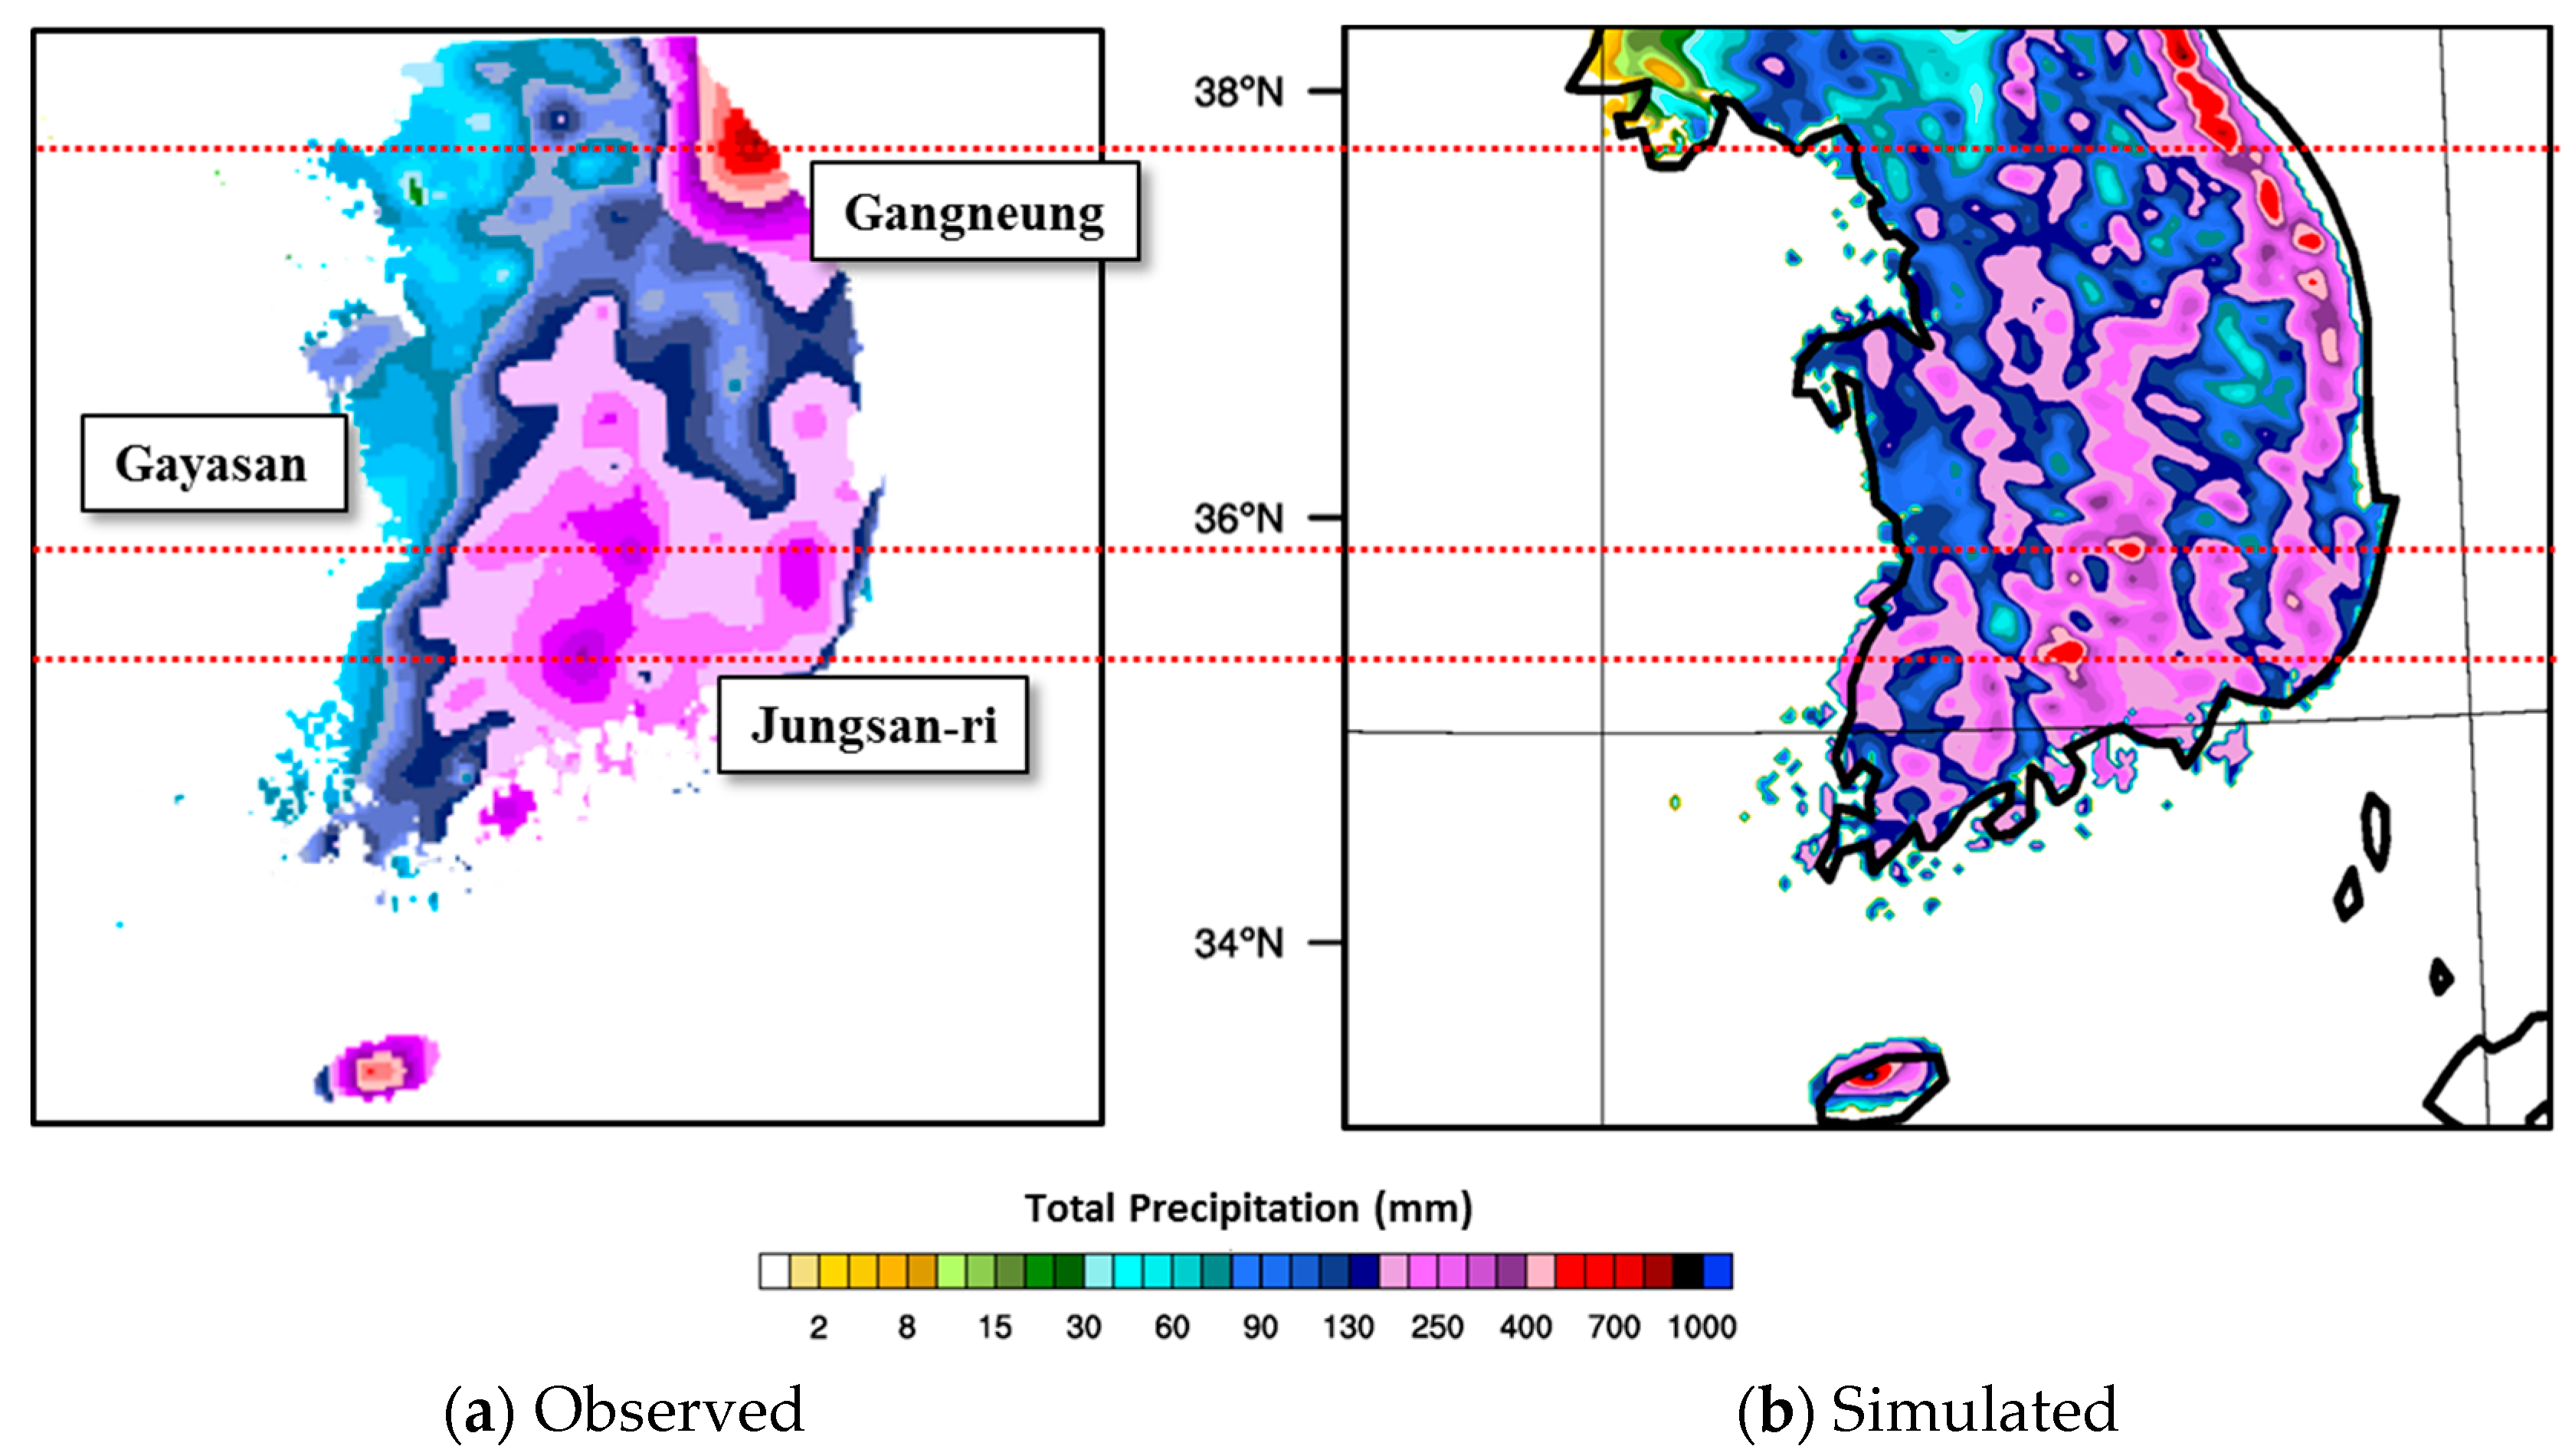
Figure 4 shows the total accumulated spatial precipitation simulated by the WRF in d03 and observation by AWS and ASOS. In
Figure 4, red lines indicate the latitudes of three stations considered in this study (Gangneung, Gayasan and Jungsan-ri) and the maximum local accumulated precipitation observed. While the maximum accumulated precipitation occurred at the Gangneung station, the simulation results show the maximum precipitation at a point about 50 km northwest of Gangneung. These results are thought to be due to the inaccurate prediction of the typhoon track from the WRF. Therefore, observed precipitation data of Gangneung is compared with this point.
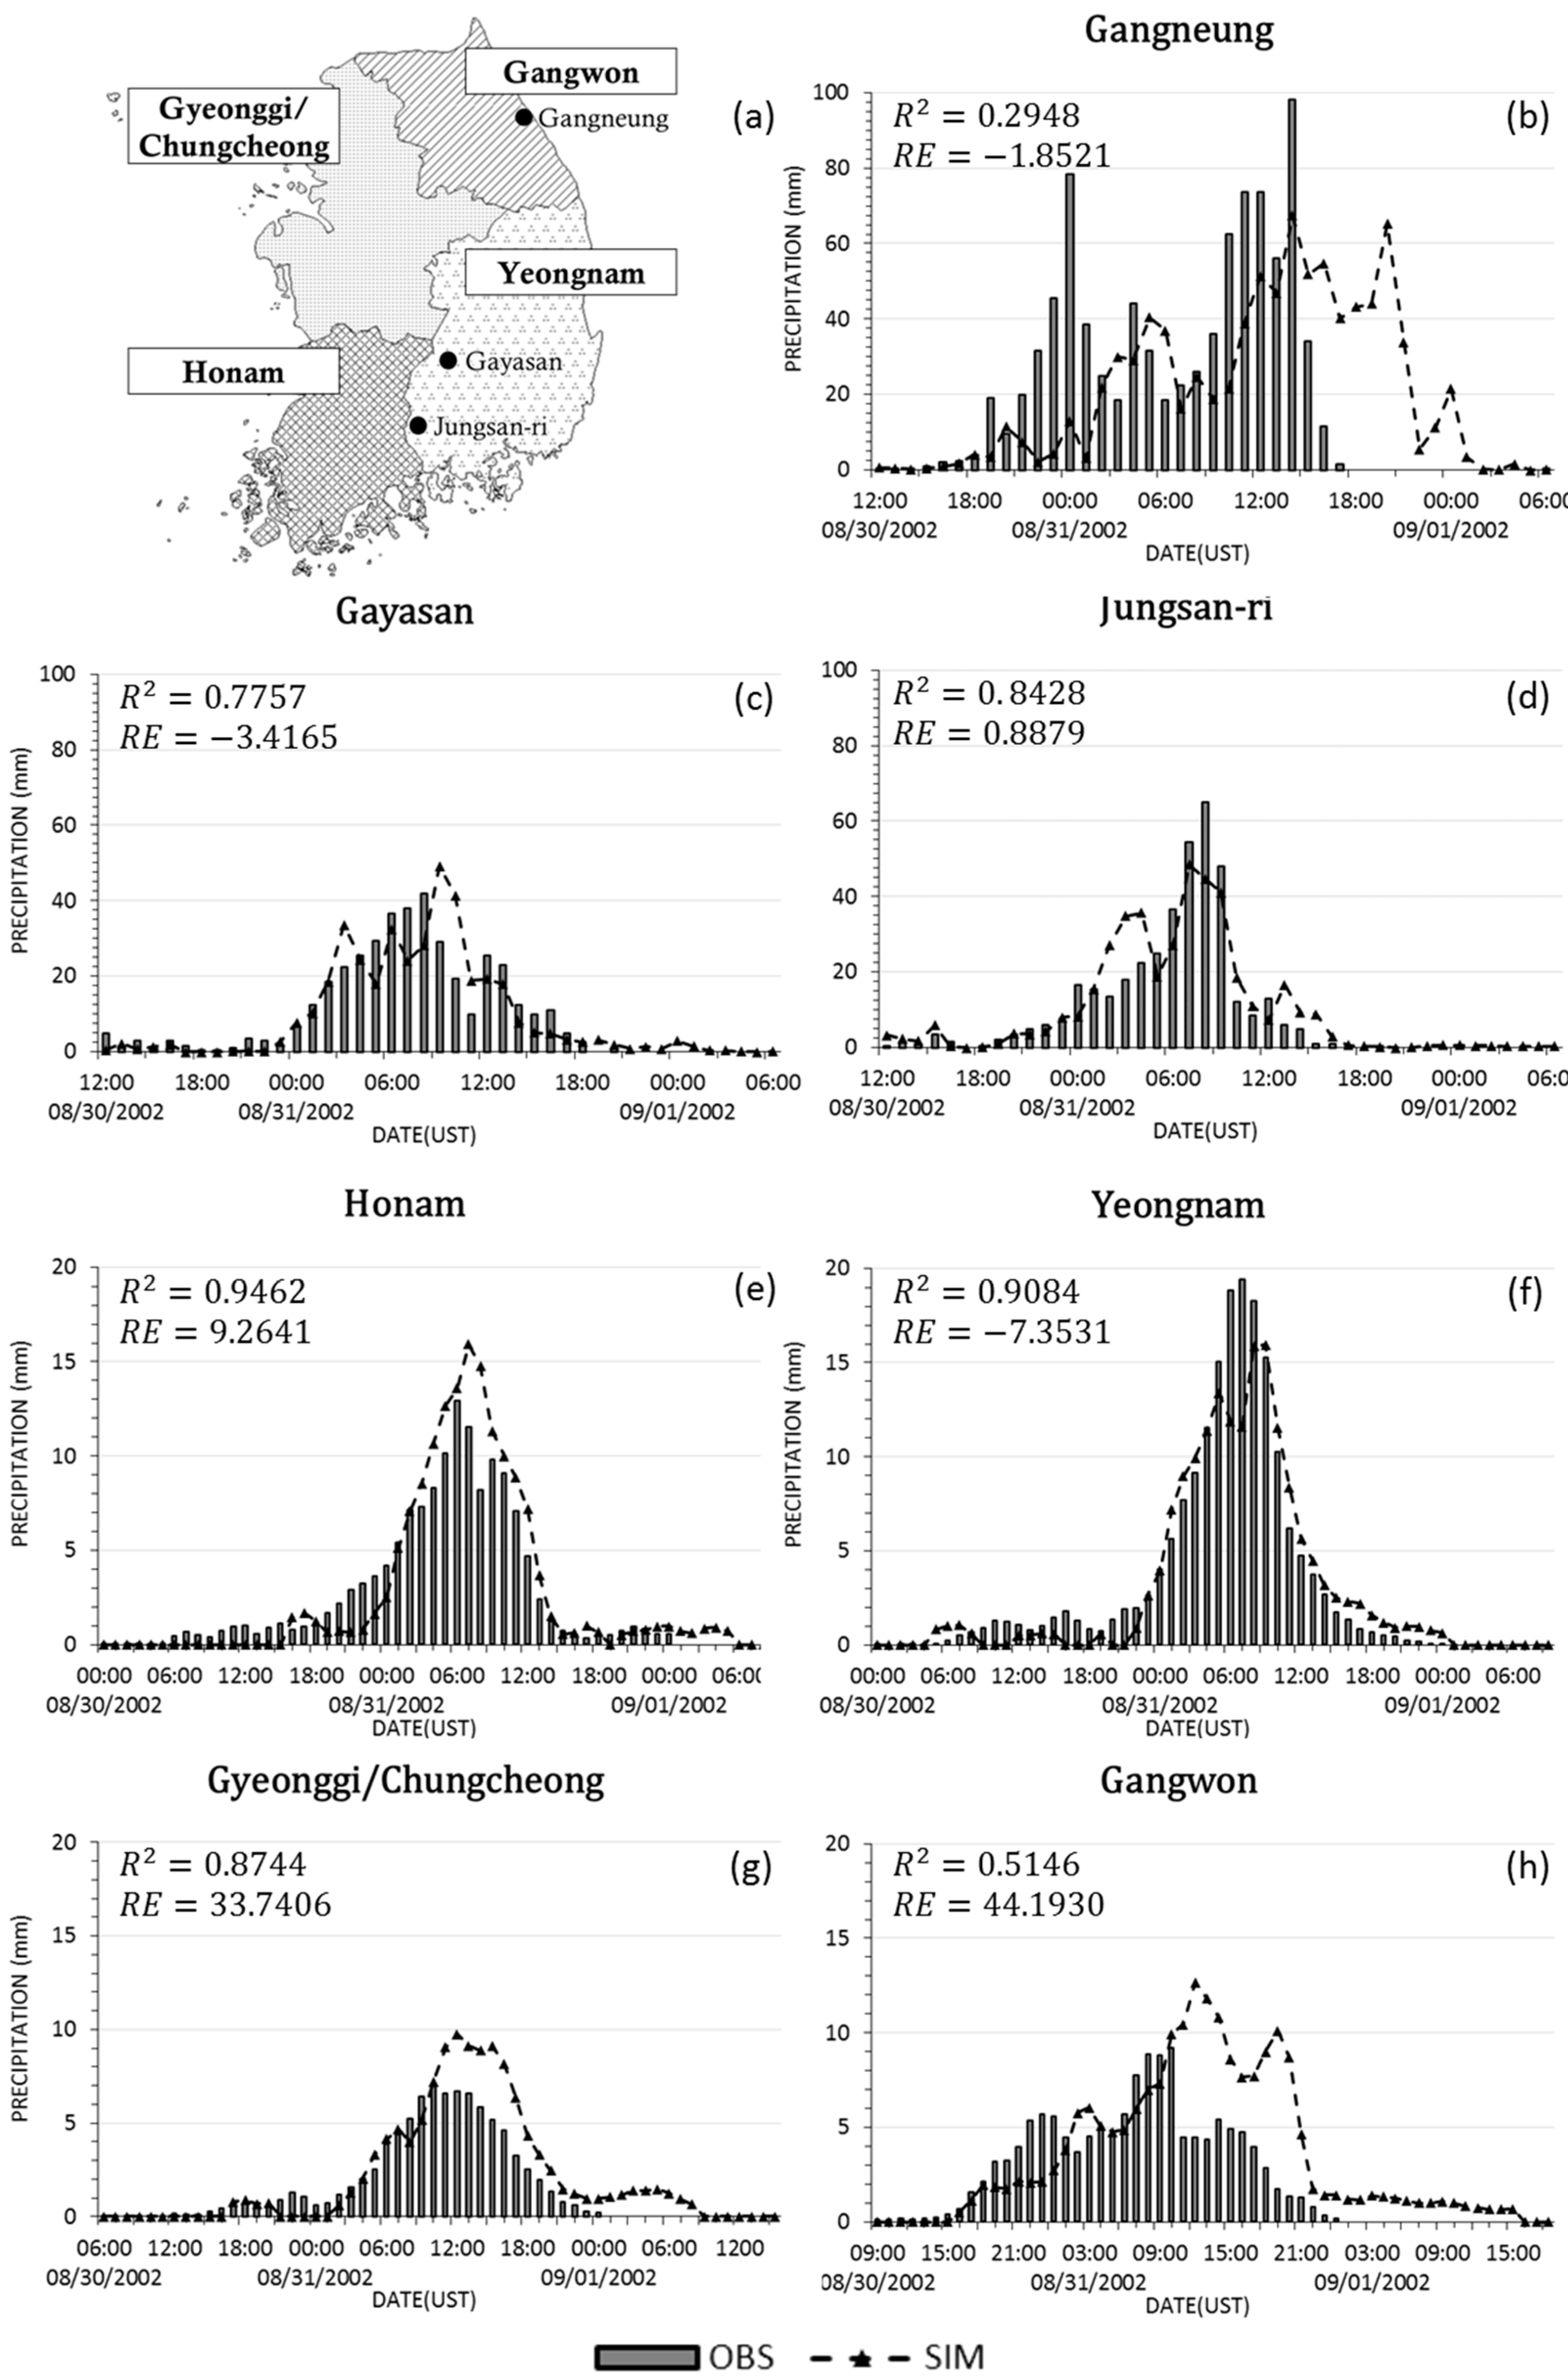
Figure 5 compares the observed and simulated hourly precipitation, and presents statistical values (coefficient of determination,
R2; and relative error,
RE) for evaluating the performance of the model.
Figure 5b–d compares the observed and simulated hourly precipitation at Gangneung, Gayasan and Jungsan-ri stations. The 66 h accumulated precipitation at each station is 896, 410 and 420 mm, respectively. The WRF results shows the 66 h accumulated precipitation of 879, 396 and 423 mm respectively. It is apparent that the WRF reasonably reconstructs the observed precipitation at the Gayasan and Jungsan-ri points in terms of total precipitation amount and time series. However, Gangneung point (see
Figure 5b) shows the simulated precipitation occuring later than the observation. Although there are several reasons for this, the result seems to be attributed to the inaccuracy of the simulated typhoon track. To evaluate the behavior of spatial precipitation, the Korean Peninsula is separated into four regions (
Figure 5a).
Figure 5e–h compares the observed and simulated space-averaged precipitation in the four regions. The time series of simulated space-averaged precipitation shows the best agreement with the observations with respect to timing of precipitation and total precipitation in Honam, Youngnam and Gyeonggi/Chungcheong regions. But, the Gangwon region (included Gangneung) relatively overestimates the amount of precipitation and misses the timing. The
R2 of the Honam, Yeongnam, and Gyeonggi/Chungcheong regions were fairly well, 0.95, 0.91 and 0.87, respectively, but the
R2 of Gangwon region, where the precipitation is overestimated, is 0.51.
According to Gangwon Regional Meteorological Administration [
27], there was a communication disruption because of Typhoon Rusa affecting the Gangwon and the eastern coast of Korea. It is thought that this may have had some influence on the data accuracy. Nonetheless, the WRF seemed to reconstruct the precipitation fairly well in terms of overall distribution.
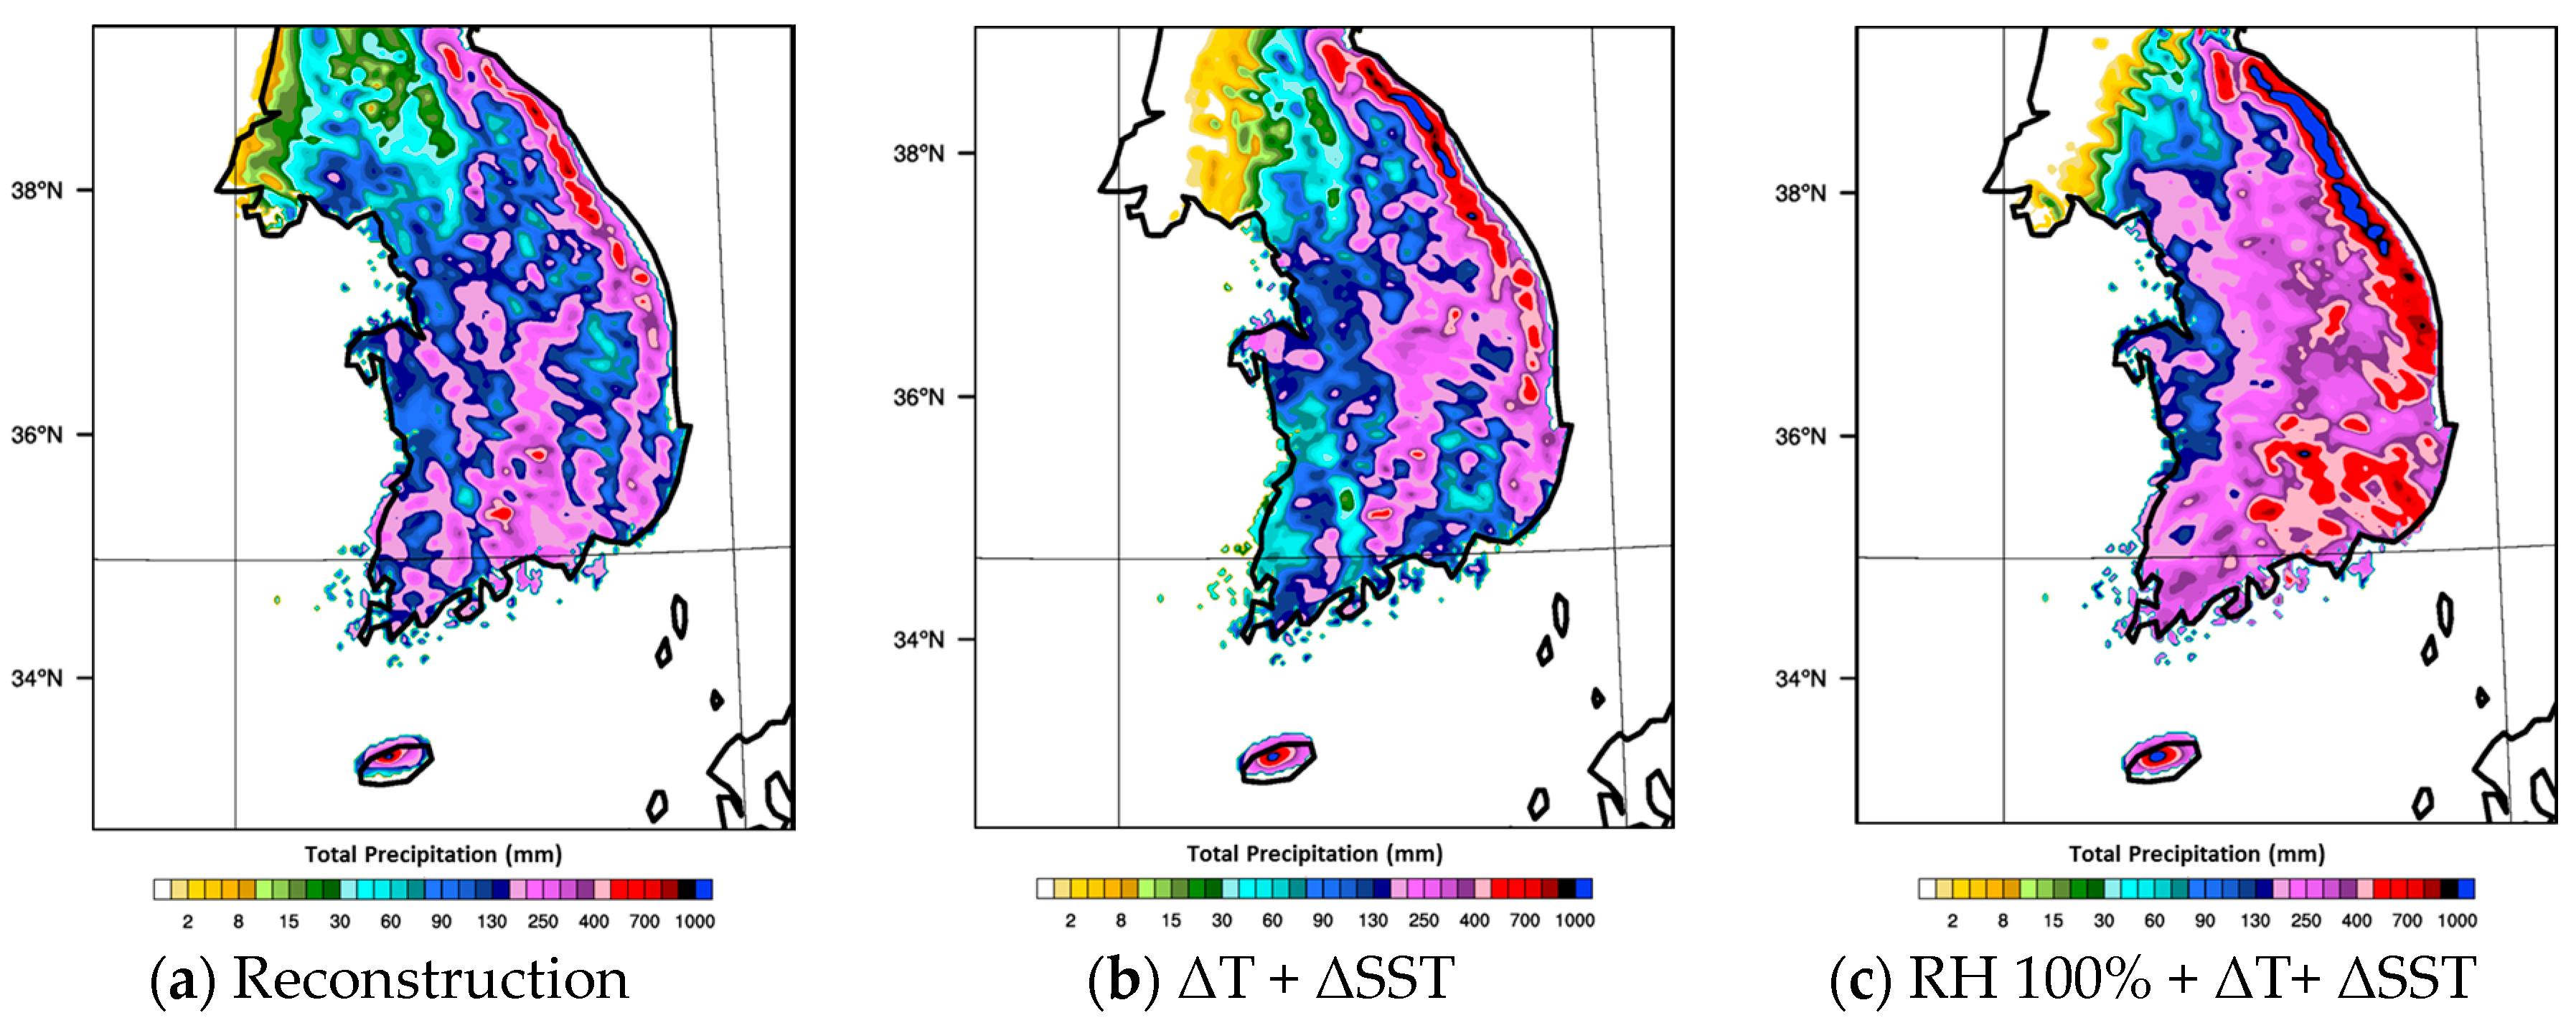
3.2. RCM_PMP
Figure 6 shows the total accumulated spatial precipitation according to maximization scenarios. As expected, there was a specific scenario of “
RH 100% + Δ
T + ΔSST” that showed maximum precipitation. This figure indicates that precipitation is positively affected by humidity and temperature. Therefore, the RCM_PMP was estimated on the basis of this scenario.
Traditional PMPs were estimated for areas from 25 to 19,600 km
2 and for durations of 1 to 72 h [
26]. Hence, a comparison of RCM_PMP and PMP needs a specific area and a duration. In this study, RCM_PMP and PMP were compared for an area of 36 km
2 (four grid areas of d03) and a duration of 8, 12, 18, 24 and 48 h.
Figure 7 shows the time series of space-averaged precipitation (the bar graph in
Figure 7) and its maximum moving summation (the line graph in
Figure 7) according to the various durations at maximum precipitation area. Once the storm area is identified, the RCM_PMP for the various durations is estimated as such procedure. Because the complete spatial precipitation field at 3-km resolution and 1-h time increment was reconstructed over Korea, one can easily compute the basin-average precipitation.
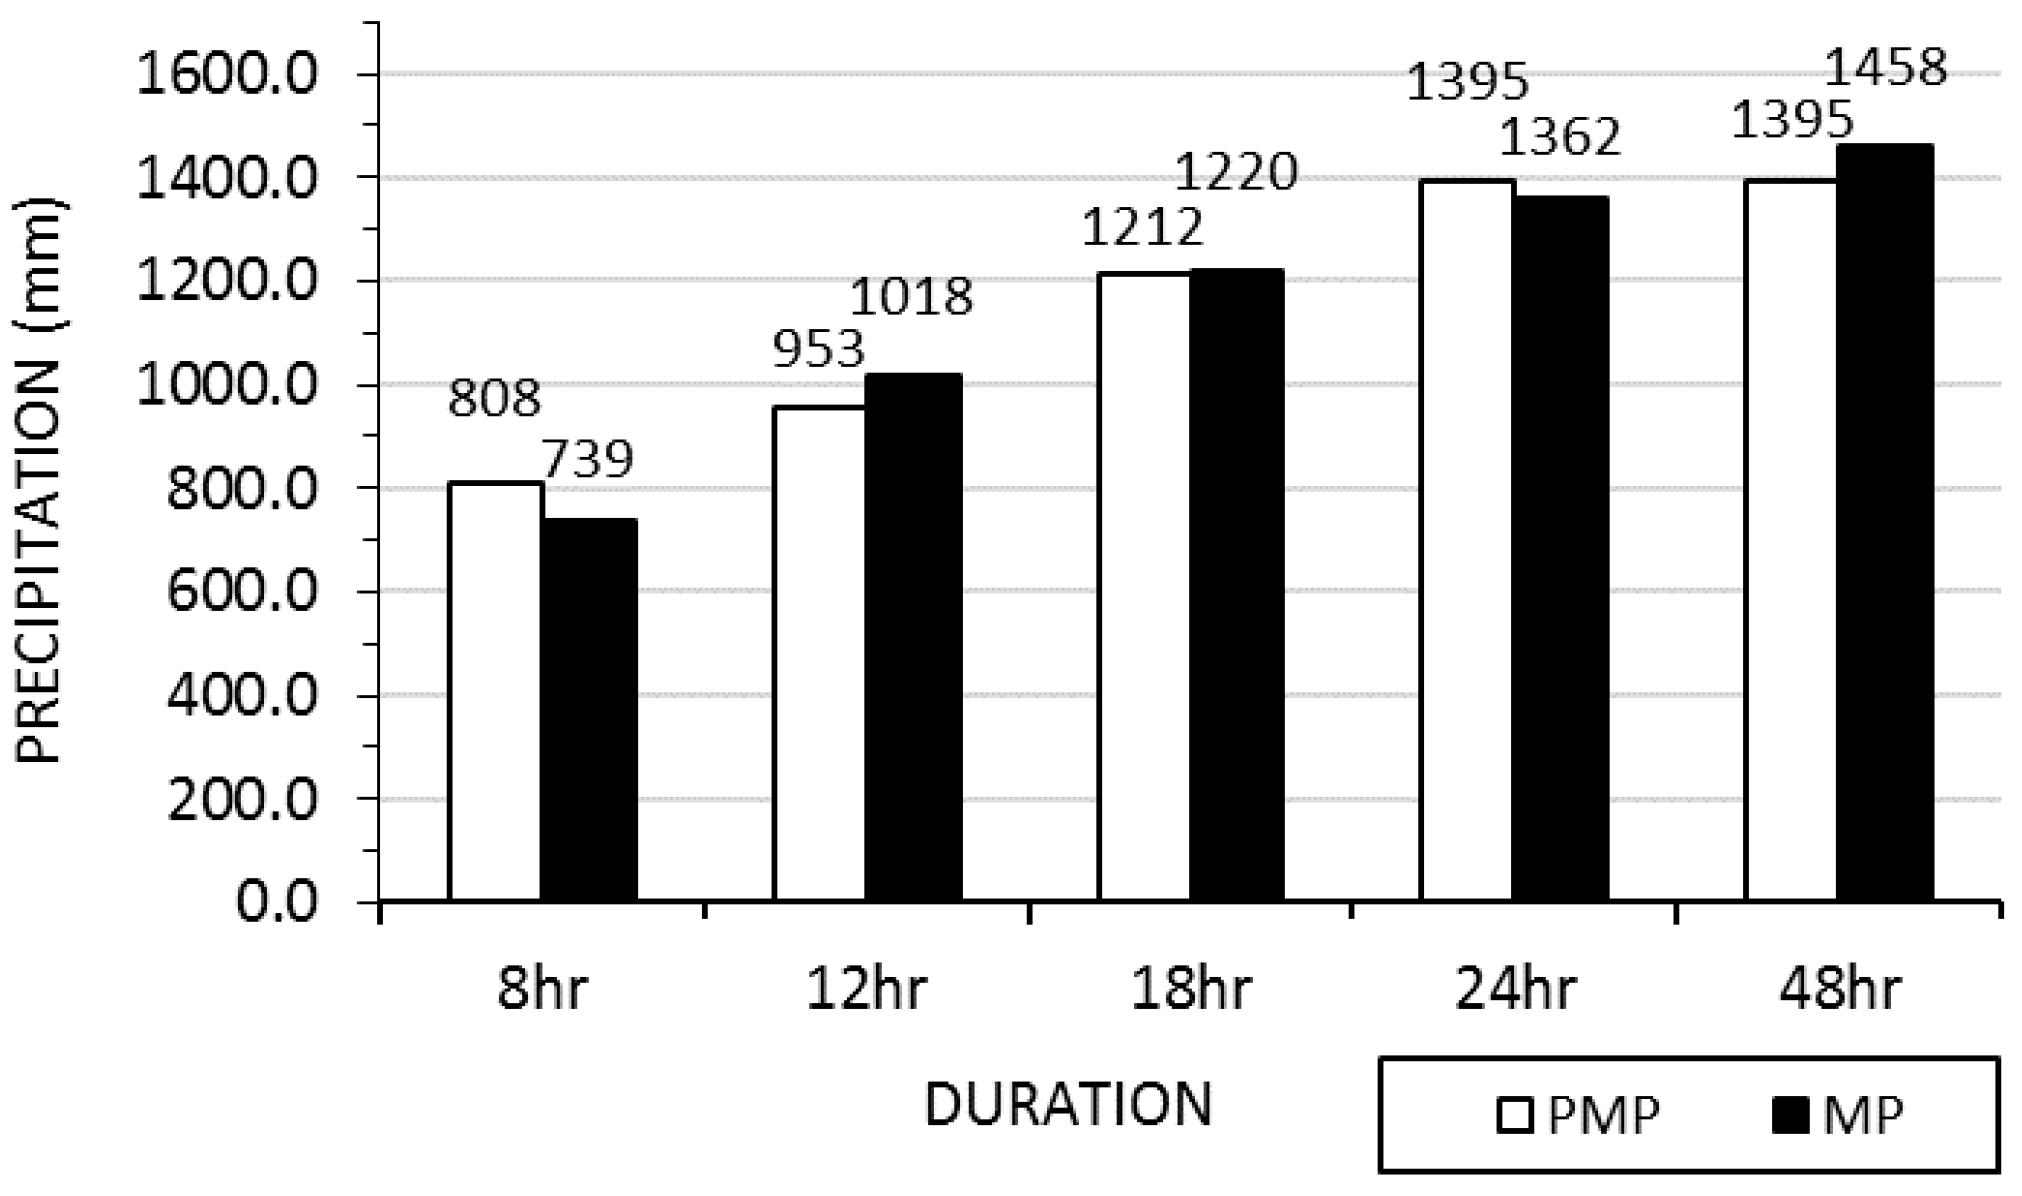
The RCM_PMP was evaluated as 739, 1018, 1220, 1362 and 1458 mm and its duration was 8, 12, 18, 24 and 48 h, respectively. These values were compared to the existing PMP values: 808, 953, 1212, 1395 and 1395 mm, respectively.
As can be seen in
Figure 8, the RCM_PMP of 1018 mm was slightly overestimated to the existing PMP of 953 mm for the 12-h duration. The RCM_PMP of 1220 mm was closely matched to the existing PMP of 1212 mm for the 18-h duration. There was little difference between the RCM_PMP and the PMP for 24-h and 48-h durations. In the case of the 8-h duration however, the RCM_PMP was found to be 8.5% smaller than the PMP. The RCM_PMP results were generally in good agreement with PMP. It is expected that the new methodology can be used for evaluation of existing PMPs.
4. Conclusions
This study proposed a method to estimate the extreme precipitation using a RCM and examined the applicability of this method in Korea.
As an extreme event case, the historical extreme precipitation event by Typhoon Rusa was selected. Numerical experiments were performed on a total of 25 combinations (combination of MPS, CPS and PBL) to reconstruct the historical extreme event. This study identified WSM6, BMJ and MYJ schemes as the best combination of Typhoon RUSA reconstruction. However, because there was a limitation in reconstructing the historical extreme event with the best combination, the WRF model’s IC and BC were additionally modified to reconstruct the historical extreme event. Finally, the temporal and special patterns of observed precipitation fields were well reconstructed using the WRF model simulated with low-resolution input data.
Maximization is performed using the moisture maximization technique of the traditional PMP estimation method. Simulations of various scenarios according to T, SST and RH changes were performed to estimate the RCM_PMP. Of these, there was a specific scenario of “RH 100% + ΔT + ΔSST” that led to the maximum precipitation. The estimated RCM_PMP was compared to the existing PMP. The RCM_PMP and PMP results were generally consistent. Thus, the existing PMPs were well reconstructed using the WRF model and it can be concluded that the estimated RCM_PMP is valid.
The suggested method has several advantages over the traditional method for PMP estimation. First, the numerical modeling that accounts for the various effects of the nonlinear atmospheric processes provides more scientific PMP estimates without assumptions, such as linearity. Second, unlike the traditional approach, the proposed method can provide temporal and spatial patterns of extreme precipitation fields based on physics. Therefore, the reconstructed meteorological variables (e.g., precipitation, temperature, wind speed, and many others) will have a wide range of applicability (i.e., input data for various hydrological models or design parameters for many disaster prevention facilities). However, the suggested methodology is still in the early phase. Therefore, further studies on various aspects are required.
In particular, the high-resolution input data does not always guarantee good results. Thus, among the various available data (e.g., data from the NCEP and National Center for Atmospheric Research (NCAR) global reanalysis product, as well as high-resolution data from Europe), it will be necessary to study what is appropriate in Korea. Furthermore, whether long-term data is available should also be considered. Long-term information is essential for the reconstruction study of historical extreme precipitation events. Second, the results of the best combination derived from this study are limited to a single event (Typhoon Rusa). Therefore, a study on various historical extreme precipitation events should be conducted. Third, it is necessary to supplement the technique of maximizing reconstructed precipitation events. In this study, T and SST were simply shifted up using the moisture maximization method of the traditional PMP approach. However, a moisture maximization technique applied to the WRF model should be investigated. Also, the distance between the BCs of model and the storm area should be further studied.
If the methodology is established through further research, it will provide more realistic and scientific maximum precipitation estimates. Also, the suggested methodology is expected to provide the evaluation of existing PMPs and offer a new alternative to estimate them. In addition, future PMP estimates that reflect non-stationarity through the application of climate change scenarios can be expected. The proposed methodology is also expected to be extended to the transposition of maximized precipitation events.


