Abstract
Protection of nearshore area by means of artificial structure is an important issue for coastal engineering community. In this study, we aim to investigate wave hydrodynamics and hydrodynamic performance due to solitary waves interacting with double submerged barriers. Double barriers, put bottom-mounted vertically on the flat seafloor and also paralleled to each other, are considered as a wave absorber. New experiments are carried out to provide measured data for model validation. Numerical simulations are performed using a depth- and phase-resolving model, based on the Reynolds-Averaged Navier–Stokes equations with a non-linear k-ɛ turbulence closure model. Model–data comparisons show good agreements in terms of free surface fluctuations in time histories and error analyses are performed. Numerical results are then used to study the variations of the free surface motions of breaking waves and the flow fields. In particular, the model results reveal that the optimal horizontal distance, judged as minimum wave transmission, between two submerged barriers is approximately 2.5 times the still water depth for present wave conditions and obstacle geometries. Furthermore, numerical model is extended to evaluate the functional efficiency of a dual-slotted-barrier system with different obstacle configurations under various conditions of solitary waves by means of energy reflection, transmission and dissipation coefficients.
1. Introduction
Coastal areas provide important benefits for humans as strategic locations of residential, recreational and industrial purposes. Protection of nearshore region by means of artificial breakwater or other defense scheme is therefore a vital issue for coastal engineering community. Those structures are expected to play an important role on reflecting as well as dissipating energy of progressive waves or currents and thus to preserve the safety of local residents. For a specific location to construct coastal structures, the determination of the size and type of object is necessary and site dependent. In recent years, submerged-type or low-crested breakwaters have been regarded as a valuable alternative compared to traditional emerged-type structures [1,2]. This kind of breakwater has advantages in enhancing the circulation of water, providing relative lower costs and sustaining natural coastal landscape for recreational purpose. Another alternative of coastal structure is wave barrier. The classic type of barrier in the form of thin, rigid, vertical, slotted and surface-piercing structures can be considered as one of the replacement for economic and environmental concerns. Since an isolated barrier can reduce the transmitted waves [3,4], it is quite straightforward to take a multi-barrier system into account as a wave absorber to enhance its functional efficiency for this kind of application.
The functional efficiency by means of wave reflection (R), wave transmission (T) and dissipation (D) coefficients for an individual surface-piercing barrier under the attacks by periodic water waves has attracted considerable attention, in which dissipation coefficient means energy loss during wave–structure interactions. Most of those studies developed numerical models that assumed the fluid is incompressible and inviscid, and the flow is irrotational. For example, the case of impermeable barrier, the boundary element method [5] and the eigenfunction expansion method [6] were used to estimate RT coefficients. For slotted barriers, considering the porosity of the structure, Isaacson et al. [7,8] used the eigenfunction expansion method with matching boundary condition along the permeable barrier to investigate the RTD coefficients of waves scattering by an isolated and dual barriers, respectively. Huang [9] proposed an empirical expression for RT coefficients of wave interaction with one or two rows of rectangular cylinders. To the best knowledge of the authors and also raised by a review paper [10], the literature related to water waves interacting with submerged barriers is relatively rare, especially under solitary waves.
Since it is well-known that vortices would be generated due to flow separation and the flow field in the vicinity of the object would become turbulent as water waves pass over an obstacle, the potential flow theory with irrotational flow assumption is inadequate to investigate the flow fields and energy loss due to flow separation. An understanding of the hydrodynamic interaction between the structure itself and the induced flow fields is therefore of great importance for design purpose and being the main motivation we hold. In addition, although the waves in the ocean are naturally regarded as periodic, the solitary wave can be utilized to represent certain behavior of extreme non-linear long waves, such as leading wave of tsunami [11,12]. The multi-barrier system may be considered as a potential application on tsunami mitigation [13]. The literature on the interactions of solitary wave and an isolated barrier has been extensively investigated in the past few years. For example, Liu and Al-Banaa [14] investigated non-breaking solitary wave run up on a vertical surface-piercing barrier, and Wu et al. [15] recently studied breaking solitary waves propagation over a submerged bottom-mounted barrier. Both studies [14] and [15] performed laboratory experiments using the particle image velocimetry (PIV) technique and numerical modeling based on a viscous numerical wave tank. To the knowledge of the authors, the multi-barrier system under solitary wave forcing only refers to the study of [13]. However, the main focus of [13] was more concentrated on the regular and irregular waves rather than solitary wave. The optimal distance between two barriers under solitary waves has not yet been fully understood presently. If the distance between two barriers can be found to be minimized, the construction costs for the structure can therefore be reduced.
In this study, we investigate breaking solitary waves interacting with a submerged dual-barrier configuration to study the effects of wave hydrodynamics by adding an additional barrier with varying the distance between two of them. As the first step, both barriers are considered impermeable and bottom-mounted. New experiments are conducted in a laboratory-scale wave flume. The distances between two neighboring barriers are varied along with considering different wave conditions of solitary waves. Numerical results are obtained from a depth- and phase-resolving volume of fluid (VOF)-type wave model, based on the two-dimensional (2D) Reynolds-Averaged Navier–Stokes (RANS) equations and the non-linear k-ɛ turbulent closure model to the Reynolds stresses [16,17]. Model–data comparisons in terms of free surface elevation time series are performed to confirm the accuracy of numerical model. Numerical model is then extended to investigate how the second barrier with different horizontal positions affects the wave hydrodynamics in terms of violent free surface motion due to wave breaking and the induced flow fields. Several combinations of obstacle configurations and wave conditions are numerically reproduced and the corresponding functional efficiency in terms of energy reflection (KR), transmission (KT) and dissipation (KD) coefficients is calculated using the energy integral method [18], based on integration of energy flux instead of using the wave height information only. In addition, the optimal distance between two solid barriers is evaluated, which is judged of minimum wave transmission. Considering the porosity of the barrier, dual-slotted-barrier configurations under solitary waves are also studied numerically and an empirical curve fit is provided based on present obstacle and wave conditions to have a quick estimation for RTD coefficients.
2. Research Methods
2.1. Experiment
New experiments were carried out in a 2D glass-walled wave flume located at Tainan Hydraulics Laboratory of National Cheng-Kung University, Taiwan. The dimensions of the wave flume are 22.0 m in length, 0.50 m in width and 0.76 in depth. A programmable piston-type wavemaker was installed at one end of the flume to generate desired solitary waves while a 1/20 sloping beach made of anodized aluminum plates was placed at the other end of the wave flume to absorb transmitted wave energy. The target solitary wave was generated using the procedure suggested by [19] and, although not shown here, the generated solitary waves using this facility fit the theoretical solution of solitary wave very well, which can be found in [15,20,21]. In this study, the solitary waves were generated in a constant water depth (h) of 14.0 cm with four different wave heights (H), i.e., H/h = 0.50, 0.35, 0.20 and 0.15.
Double barriers with the same overall size, put bottom-mounted vertically on a flat seafloor and paralleled to each other, are designed. The barrier is a 2D structure, consisted of a rigid Plexiglas plate with dimensions of 10 cm in height (a), 2 cm in thickness (b) and spanning the width of the wave flume. The aspect ratio of the barrier is 0.2 (i.e., b/a) and the height of the barrier occupies around 0.71 h. The horizontal distances (D) between two barriers varying for D = 0.00, 0.02, 0.05, 0.10, 0.15, 0.20, 0.25, 0.30, 0.35, 0.50, 0.75 and 1.00 m are considered, in which D = 0.00 m means that only a single barrier is considered and D = 0.02 m is for two barriers closely spaced. Considering the combinations of different wave conditions as well as configurations of two barriers, a total of 48 experimental conditions were carried out. Each scenario was repeated five times and the ensemble-averaged method was used to obtain the mean quantities.
Figure 1 shows the experimental layout, apparatus, definitions of variables and flowchart for instrument synchronization. Four capacitance-type wave gauges with a sampling rate of 50 Hz were used to measure the free surface time series and their relative locations with the model structure can be also found in Figure 1, in which the locations of wave gauges were identical to the single barrier case [15]. The wave gauges were well-synchronized with the wavemaker by using a data acquisition system (DAQ, National Instruments) along with an in-house developed LabVIEW program. In addition, the origin of the coordinate system (x, z) = (0, 0) is defined at the intersection between the weather side of the first barrier and the seafloor. The origin of the time (i.e., t = 0 s) is referenced as the instant of wave crest of the solitary wave arriving the first wave gauge (i.e., WG1).
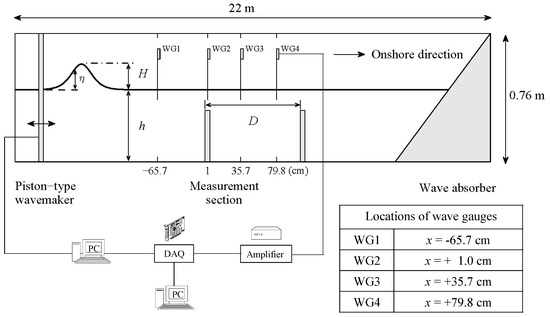
Figure 1.
Overview of experimental set-up, facilities (not to scale) and definitions of variable assigned for a dual-solid-barrier configuration.
2.2. Numerical Model
A 2D depth- and phase-resolving viscous numerical wave model is used to simulate the interactions of solitary wave and double submerged barriers. The model equations are based on the RANS equations to describe the mean flow field and the non-linear k-ɛ turbulent closure model to approximate the Reynolds stresses. The free surface elevation during wave propagation and wave breaking is traced by the volume of fluid method [22]. The accuracy of numerical model relies on the rigorous validation against measurement for many coastal-related problems. For instances, the applications on solitary waves interaction with coastal structures can be found in [12,23]. In particular, similar issue on solitary waves interacting with a single submerged barrier has been reported by [15]. Interactions of solitary waves and an isolated submerged slotted barrier can be found in [20]. Additional model–data comparisons in terms of free surface fluctuations are given in Section 3.1 for double submerged barriers under solitary waves and the interactions of double solid/slotted barriers and solitary waves are shown in later sections based on numerical simulations.
In terms of boundary conditions, the no-slip condition was applied at the solid boundaries and the zero-stress condition was implied to the mean free surface to neglect the air-flow effect. The surface tension effect was not considered herein. The desired solitary wave was generated through the inflow boundary by giving the theoretical free surface elevation along with the corresponding horizontal and vertical velocities. For the downstream boundary, the radiation boundary condition was utilized. Detailed numerical implementations can be found in [16,17].
A numerical wave tank is designed with −2.5 ≤ x ≤ 2.3 m and 0 ≤ z ≤ 0.3 m, where structured and uniform rectangular grids with Δx = Δz = 1.0 mm were employed, based on grid convergence tests, for accurate and efficient computations. We note that the numerical wave tank as well as the model setup used in this study are mostly similar to [15]; the only difference is to lengthen the numerical wave flume in order to include an additional submerged barrier inside the computational domain. The total simulation time is 10 s and the time step was automatically adjusted during calculations to satisfy stability constraints by both the advection and the diffusion processes. Numerical simulations are performed on an Intel i7 3.80 GHz computer and, for each case, the computational times range approximately 5–8 h. Since a truncated wave flume is used, the numerical wave height H is determined by matching that of WG1 from the experiments. In terms of wave conditions, the water depth is identical to that of experimental setup, i.e., h = 14 cm, with H/h = 0.50, 0.35, 0.20, 0.15 and 0.10. All experimental configurations are numerically reproduced for dual-solid-barrier scenarios.
In addition to dual-solid-barrier cases, the slotted barrier is composed of three impermeable elements with the same size such that the porosity (N) is determined by the size of element and the space between two neighboring elements. We here consider six different porosities of the slotted barrier, i.e., N = 0.00, 0.04, 0.10, 0.19, 0.31 and 0.40, in which N = 0.00 is for the case of impermeable barriers. Figure 2 shows the sketch of the computational domain and the definitions of variables for dual-slotted-barrier study, in which N1 and N2 respectively represents the porosity of the offshore/first and onshore/second barrier. To find an optimal distance between two solid/slotted barriers, two barriers with identical porosity, i.e., N1 = N2 = 0.00 and N1 = N2 = 0.10, but with various horizontal distances are simulated. Once the optimal distance is obtained, scenarios with different combinations of various porosities and wave conditions are all numerically analyzed.

Figure 2.
Details of numerical wave flume and definitions of variable used for dual-slotted-barrier configurations.
3. Results and Discussion
3.1. Model–Data Comparison
To confirm the model accuracy for complicated wave–structure interactions, the comparisons between experimental measurements and numerical simulations must be demonstrated. Five different barrier configurations in experiments were selected for model–data comparisons, including D = 0.00, 0.05, 0.15, 0.35 and 1.00 m along with H/h = 0.50, 0.35 and 0.20. Figure 3 shows the model–data comparisons for three selected wave gauges, which are located at upstream (WG1), in the middle (WG2) and at downstream (WG3) of the offshore barrier. Figure 3a–e provides model–data comparisons for the cases of D = 0.00, 0.05, 0.15, 0.35 and 1.00 m, respectively. For each scenario, three different H/h are superimposed together in order to show the variations. Recording of WG1 shows the incident solitary waves, which have not yet been affected by the submerged barrier, and the wave reflections due to the presence of the barrier. It is evident that the reflected waves for the case of D = 0.15 m for different H/h are consistently higher than the cases of D = 0.00, 0.05 and 0.35 m; the reason to cause such difference will be discussed in Section 3.2. Moreover, only one main wave reflection was recorded and simulated for the case of D = 0.00 m; however, due to the presence of the second barrier, a train of wave reflections was recorded for multi-barrier cases. For the case of D = 1.00 m, it is obvious to observe two main groups of wave reflections, which are contributed from the offshore and onshore barriers, respectively. A more quantitative discussion for wave reflections due to different configurations of barriers along with various H/h will be given in Section 3.3.
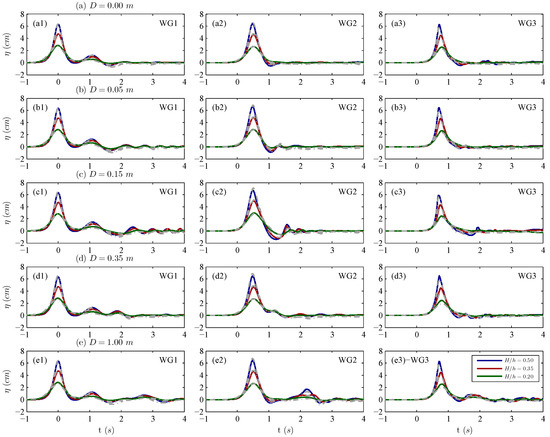
Figure 3.
Model–data comparison in terms of free surface time series recorded by WG1, WG2 and WG3, for the cases of: (a) D = 0.00 m; (b) D = 0.05 m; (c) D = 0.15 m; (d) D = 0.35 m; and (e) D = 1.00 m. The solid lines and dashed lines correspond to the numerical and measured results, respectively.
While the WG2 is located right above the offshore/first barrier, the recording free surface fluctuations are very complicated. Comparing to the main waveform of WG1, the measured/model wave heights of WG2 are higher than those of recordings at WG1 because the wave surfers a sudden change in terms of local water depth caused by the presence of the offshore barrier. As the second barrier is quite far away from the offshore barrier for the case of D = 1.00 m, the wave transformation behavior in terms of free surface elevations before t = 1.5 s is identical to the case of D = 0.00 m (Figure 3(e2)). For the recordings of WG3, those waves mean wave transmissions of double barriers for the cases of D = 0.00, 0.05 and 0.15 m. We note that the main waveforms of WG3 recordings for the case of D = 0.15 m with all three H/h are consistently lower than the other cases with different distances between two barriers. As explained in [15], the “crest–crest exchange” event described by [24] can be reproduced by the single barrier setup, so that one may observe approximate double crests with equal wave heights during wave–structure interactions. For the case of D = 0.15 m, this even is triggered at the position close to WG3 such that it leads to lower wave heights of the main waveform than the other cases, in which such phenomenon can be well reproduced by the model (Figure 3(c3)). In particular, the main waveform of WG3 recordings for D = 0.35 m is a bit higher than other cases (Figure 3(d3)). This is because the location of WG3 is right at the position of the second barrier such that, as mentioned, the wave amplification leads to larger wave heights due to the sudden change of local water depth. For the case of D = 1.00 m, the second barrier is still far behind the location of WG3, so that, before t = 1.5 s, the free surface elevation time series is identical to that case of D = 0.00 m.
In general, model–data comparisons for different configurations of submerged barriers along with various wave conditions of solitary waves show satisfactory agreement in terms of free surface elevation time series. Maximum error between model and measured wave heights is less than 2.5% for WG1, 6.5% for WG2 and 7.4% for WG3. We note that, for the case of D = 0.00 m with H/h = 0.50, the accuracy of numerical model results has been confirmed through rigorous comparisons against PIV measurements in terms of free surface displacement, velocity as well as vorticity fields and turbulent kinetic energy. Detailed comparisons can be found in [15]. In the following sections, based on numerical results, we will discuss the induced wave hydrodynamics and the hydrodynamics performances of double submerged solid as well as slotted barriers under solitary waves in detail.
3.2. Wave Hydrodynamics
In this section, the wave hydrodynamics induced by solitary wave propagation over a submerged dual-solid-barrier configuration are presented based on numerical calculations. The deformation of free surface and the evolution of velocity with vorticity fields are given and discussed. The magnitudes of vorticity are simply calculated by taking curl of mean velocity fields. Although twelve horizontal distances between two barriers associated with four different wave heights in a constant water depth are all simulated, we here only present the cases of D = 0.00, 0.05, 0.15 and 0.35 m with the highest wave height given by H/h = 0.50 as examples to show the key variations of wave hydrodynamics. For the rest of other computed cases, we briefly summarize and discuss the hydraulic performance in Section 3.3. Figure 4, Figure 5, Figure 6 and Figure 7 show the simulated evolutions of the free surface elevation, velocity and vorticity maps respectively for the cases of D = 0.00, 0.05, 0.15 and 0.35 m at various time instants of interest. In those figures, only every 10th of velocity column are plotted to have clear presentations on the figures of velocity fields. In addition, 10 contours of the VOF function with an interval of 0.1 from 0.1 to 1.0 are adopted to mimetically simulate the phenomenon of “air and water mixing” by breaking waves [12,25]. Notably, the calculated case of D = 0.00 m is identical to [15] for an isolated submerged barrier under solitary wave forcing. The same case as well as results used here is for benchmarking the comparisons with dual-barrier configurations under identical wave condition. For simplicity, the results are briefly described.
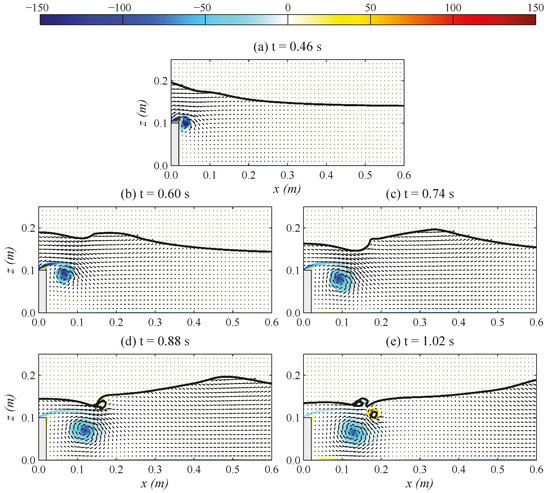
Figure 4.
Simulated evolutions of the free surface elevation, velocity and vorticity (unit: s−1) (color map) fields for the case of D = 0.00 m at five time instants: (a) t = 0.46 s; (b) t = 0.60 s; (c) t = 0.74 s; (d) t = 0.88 s; (e) t = 1.02 s.
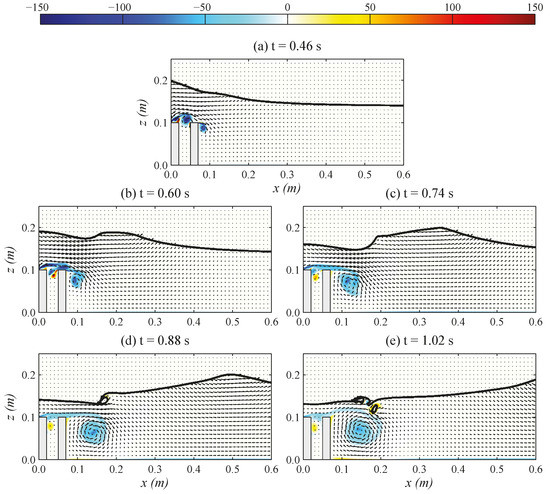
Figure 5.
Simulated evolutions of the free surface elevation, velocity and vorticity (unit: s−1) (color map) fields for the case of D = 0.05 m at five time instants: (a) t = 0.46 s; (b) t = 0.60 s; (c) t = 0.74 s; (d) t = 0.88 s; (e) t = 1.02 s.
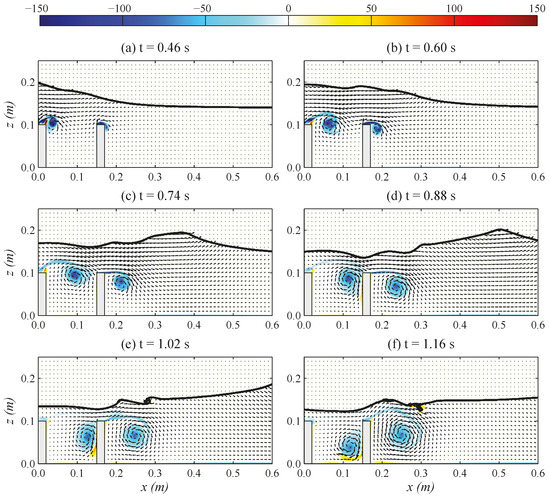
Figure 6.
Simulated evolutions of the free surface elevation, velocity and vorticity (unit: s−1) (color map) fields for the case of D = 0.15 m at six time instants: (a) t = 0.46 s; (b) t = 0.60 s; (c) t = 0.74 s; (d) t = 0.88 s; (e) t = 1.02 s; (f) t = 1.16 s.
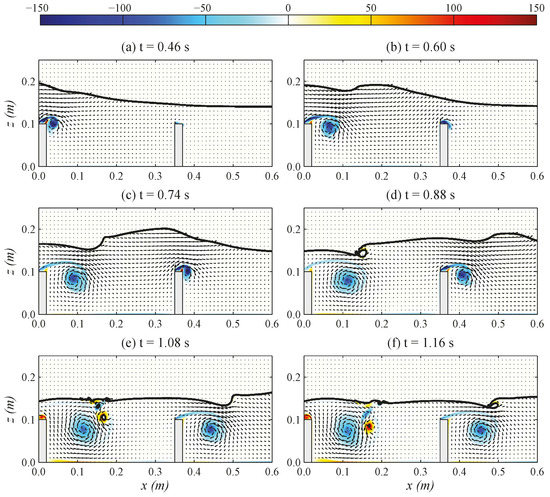
Figure 7.
Simulated evolutions of the free surface elevation, velocity and vorticity (unit: s−1) (color map) fields for the case of D = 0.35 m at six time instants: (a) t = 0.46 s; (b) t = 0.60 s; (c) t = 0.74 s; (d) t = 0.88 s; (e) t = 1.08 s; (f) t = 1.16 s.
As can be seen in Figure 4, the first stage of the wave deformation induced by solitary wave passing over a submerged bottom-mounted barrier shows approximate double crests with equal wave heights when the wave front approaches the barrier but the wave crest has not yet traveled over the barrier completely (Figure 4a,b). After the crest of the solitary wave passes over the barrier, the slope of the tail surface of transmitted wave becomes steep and then breaks in the opposite direction of the progressive waves. Figure 4c displays the overturning jet just appears and then the overturning jet impinges onto the free surface with air being entrapped into the water as shown in Figure 4d. Due to strong wave breaking phenomena, the splash-up event occurs, as can be seen in Figure 4e. For the velocity fields, the main vortex is induced at the tip of the barrier (Figure 4a) due to flow separation with adverse pressure gradient being generated [15]. This main vortex rotates with clockwise direction and grows in size enveloped by the shear layers. The main vortex is convected downstream until the backward breaking event occurs. Afterward, this clockwise vortex slightly moves in the opposite direction to that of wave propagation (Figure 4e) due to the backward breaking wave.
We further study the effects on adding an additional barrier with D = 0.05 m. It is interesting to note that the free surface elevation is similar to the case of D = 0.00 m, including the crest–crest exchange (Figure 5b), the backward breaking (Figure 5c) and the splash-up events (Figure 5e). In addition, the location of the impingement of the overturning jet (Figure 5d) is almost identical to the case of D = 0.00 m. Even although the wave deformation for the case of D = 0.05 m is almost the same compared with the scenario of D = 0.00 m, the initial stage of the formation of the main vortex exhibits different processes. As the wave front of solitary wave reaches the dual-barrier configuration, the vortex is first introduced at crown of the first/offshore barrier and the vortex induced by the second or onshore barrier is generated later (Figure 5a). As can be seen in Figure 5b, the first vortex then bypasses the second barrier to convect downstream. At that moment, the first vortex induced by the offshore barrier and the second vortex induced by the onshore barrier merge into a distinct main vortex with clockwise rotation due to their rotating direction being the same (Figure 5c). Afterward, the behavior of main vortex does not have significant difference comparing to the case of D = 0.00 m (Figure 5d,e). The reason to cause such similar phenomena of wave hydrodynamics with the single barrier case may be partly because the distance between two barriers is very limited, which is around 6% of the 95% characteristic wavelength of solitary wave (i.e., ). Therefore, such distance is insignificant comparing to the effective wavelength of incoming wave.
We then lengthen the distance between two barriers to D = 0.15 m. According to the modeled results for the case of D = 0.00 m, as shown in Figure 4d, the impinging position of overturning jet onto the free surface is roughly at x = 0.15 m. More specifically, the second/onshore barrier for the case of D = 0.15 m is located near the impinging point of overturning jet due to the first barrier. Numerical simulation results reveal that the free surface evolution is quite distinct from those of the two aforementioned scenarios. The physics of wave deformation of crest–crest exchange (Figure 6a,b) as well as the backward breaking (Figure 6c,d) induced by the first barrier are blocked by the second barrier. Relatively small breaking phenomena can be seen in Figure 6e, showing that two waves would break in the opposite direction to that of incident waves. The onshore wave crest breaks in the first place and then the offshore one breaks slightly later that causes those two waves merge into a large reflected wave to the offshore direction (Figure 6f). Figure 6f further indicates that the moving pathway of the main vortex induced by the first barrier is obstructed by the second barrier, and then it interacts with the weather edge of the second barrier that causes this vortex moves downward and finally interacts with the seafloor. It suggests that this vortex may result in significant scouring at the foot of the weather side of the second barrier, which may lead to the instability issue on the foundation of the second barrier.
Figure 7 shows the simulated results for the largest distance between two barriers presented in this section with D = 0.35 m. Since the distance between two barriers are seemingly long enough, the free surface elevation as well as the evolution of main vortex induced by the first barrier remains almost the same comparing to the results of D = 0.00 m (Figure 7a,b), which means the second barrier would not affect the interactions of solitary waves and the first barrier. In addition, a solitary wave propagation over an abrupt junction would disintegrate into several solitons [26] either for wave breaking or not if the distance is long enough to allow the complete evolution of solitary wave. Similar phenomenon can also be observed for present obstacle configuration. As solitary wave propagates over the first barrier and, after wave breaking, a soliton-like solitary wave with a decreased wave height is formed (Figure 7c). Therefore, this soliton would interact with the second barrier that exhibits the events of crest–crest exchange (Figure 7d), backward breaking (Figure 7e) and splash-up (Figure 7f) similar to the one presented by the case of D = 0.00 m.
3.3. Hydraulic Performance for Dual-Solid-Barrier Configuration
The functional efficiency of the submerged dual-barrier configuration is evaluated by means of the RTD coefficients using the energy integral method [18], which is based on integration of energy flux, instead of using wave height information only. Using this method to determine RTD coefficients is more appropriate and accurate during the wave–structure interaction under the process of wave breaking and vortex shedding. This estimated method has been frequently employed and advocated in the literatures to evaluate the hydrodynamic efficiency of coastal structures under solitary wave forcing [15,18,23,27,28]. Detailed numerical implementation on using the energy integral method to calculate RTD coefficients can be found in [18].
In Figure 8, we plot all calculated results of RTD coefficients for different distances between two surrounding barriers under various H/h, and the transverse coordinate is the distance between two barriers normalized by the given water depth (D/h). For H/h = 0.50 with varied D/h, the energy reflection coefficient first increases rapidly with extending the distance between two neighboring barriers from D = 0.00 to 0.15 m, then the energy reflection coefficient decreases from D = 0.15 to 0.35 m. Afterward, the magnitudes of the energy reflection coefficients remain nearly a constant value from D = 0.35 to 1.00 m. The peak value of the energy reflection coefficient around 0.32 is interestingly found for the case of D = 0.15 m. The reason to cause relatively larger reflected waves than the other cases was mentioned in Section 3.2 and also shown in Figure 6e. The lowest value of the energy reflection coefficient is around 0.23 achieved by the case of D = 0.00 and 0.02 m, and this finding suggests that the increased thickness to two times of the original barrier width exhibits similar hydraulic performance on energy reflection coefficient. The energy transmission coefficient increases slowly with increasing the distance between two barriers from D = 0.00 to 0.05 m, and then it decreases quickly from D = 0.05 to 0.35 m. Although the value of energy transmission coefficient is slightly reduced when increasing the distance between two adjacent barriers from D = 0.35 to 1.00 m due to the viscous damping of bottom boundary, the energy transmission coefficient for those cases is on the same order of magnitude with value of 0.75, which is the best performance. The largest energy transmission coefficient is found for the case of D = 0.05 m, approximately 0.88. For the case of D = 0.00 and 0.02 m, similar level of energy transmission coefficient is again achieved, which is consistent with the similar levels of energy reflection coefficient. Energy dissipation coefficient (KD) can be calculated by KR2 + KT2 + KD2 = 1, in which KR and KT respectively represents the energy reflection and transmission coefficients. The lowest energy dissipation coefficient is for the case of D = 0.05 m, and then the energy dissipation coefficient increases with increasing the distance of two barriers from D = 0.05 to 0.35 m. After that, the results again show a nearly constant value of energy dissipation coefficient from D = 0.35 to 1.00 m. The largest magnitude of energy dissipation coefficient in Figure 8 for H/h = 0.50 with a value of approximately 0.60 is observed.
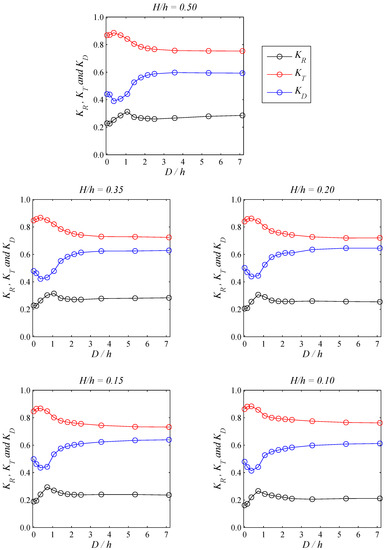
Figure 8.
Effects of the horizontal distance (D) between two barriers on the energy reflection (KR), transmission (KT) and dissipation (KD) coefficients, for the cases of H/h = 0.50, 0.35, 0.20, 0.15 and 0.10.
Other calculated results of various wave heights used herein are also given and demonstrated in subplots of Figure 8. We here note that the borderline wave condition for allowing the solitary wave to be breaking over the barrier is H/h ≥ 0.35. Other calculated results with H/h = 0.20, 0.15 and 0.10 show that the waves would not break induced by the first barrier as well as the second barrier. In general, the trends of energy reflection, transmission and dissipation coefficients are almost identical to that presented for the case of H/h = 0.50. The extreme value of energy transmission as well as dissipation coefficients is found for the case of D = 0.05 m for all five wave conditions as we considered in this paper. Only the peak value of energy reflection coefficient is not achieved by the same case of the distance between two neighboring barriers under varied wave heights. The peak value of energy reflection coefficient for H/h = 0.50 and 0.35 is found for the case of D = 0.15 m, but the peak value is shifted to the case of D = 0.10 m for H/h = 0.20, 0.15 and 0.10. The reason to cause this variation may be partly because, as we mentioned, the interactions between breaking or non-breaking solitary waves and submerged barriers may exhibit different results in terms of wave hydrodynamics and thus affect its hydraulic performance.
According to the RTD results presented in Figure 8, the relationships for the energy transmission coefficients due to different H/h of solitary waves interacting with a single barrier are not linear however. The best hydraulic performance occurs for the case of H/h = 0.20, and the energy transmission coefficient is about value of 0.83. On the other hand, the worst hydraulic performance is found for the case of H/h = 0.10, and the energy transmission coefficient is about value of 0.86. To add an additional submerged barrier parallel to the original one improves the functional efficiency of the dual-barrier configuration under solitary waves. The best hydraulic performance by means of the energy transmission coefficient under solitary wave of H/h = 0.20 and 0.10 is reduced to about values of 0.72 and 0.76, respectively. While the distance between two surrounding barriers is greater than or equal to 0.35 m, the hydraulic performance by means of the energy transmission coefficient is almost identical. We therefore conclude that the optimal distance between two neighboring solid barriers is 2.5 times the given water depth for the wave conditions and obstacle geometries we considered in this study.
3.4. Hydraulic Performance for Dual-Slotted-Barrier Configuration
We here extend to further investigate the effects of varied horizontal distances for dual-slotted-barrier configurations under identical solitary waves with five various wave heights. The porosity of both slotted barrier is simplified as identical the value of N1 = N2 = 0.10. Figure 9 shows the modeled results of energy coefficients for dual-slotted-barrier configuration under solitary waves with various H/h.
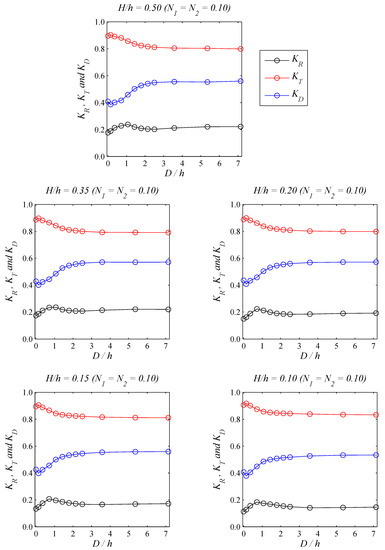
Figure 9.
Effects of the horizontal distance (D) between two slotted barriers on the energy reflection (KR), transmission (KT) and dissipation (KD) coefficients, for the cases of H/h = 0.50, 0.35, 0.20, 0.15 and 0.10.
Overall trends of energy coefficients are similar to that of the impermeable cases shown in Figure 8. The peak value of energy reflection coefficients remains to be shifted depending on the different wave heights of solitary wave given. However, the performance of energy coefficients is almost the same for the cases from D = 0.35 to 1.00 m. Consequently, the optimal distance between two neighboring slotted barriers for N1 = N2 = 0.10 keeps the same result of 0.35 m as we determined for impermeable scenarios. However, the extreme values on the energy transmission and dissipation coefficient are achieved by the case of D = 0.02 m for slotted barriers instead of D = 0.05 m for solid scenarios. The best hydraulic performance by means of the energy transmission coefficient is achieved for the cases of H/h = 0.50, 0.35 and 0.20 and found to be 0.79.
The effects of the wave non-linearity on the hydraulic performance of dual-slotted-barrier are then investigated. Since the optimal distance between two neighboring barriers is found to be D/h = 2.50 for both solid and slotted scenarios, we here only show those of modeled results with this optimal distance between two barriers. Figure 10 shows three various sets of modeled results on the energy coefficients: single-barrier case [15], dual-solid-barrier and dual-slotted-barrier scenarios. Numerical results reveal that the energy reflection coefficients, in general, increase with increasing H/h. The lowest level of energy reflection coefficients is achieved by dual-slotted-barrier case followed by single-barrier case, and the largest level is accomplished by dual-solid-barrier scenario. The best performance by means of energy transmission coefficient is found for the case with H/h = 0.20 for all barrier scenarios. For the dual-slotted-barrier case, the energy transmission coefficients remain an approximate constant value of 0.79 obtained from H/h = 0.20 to 0.50, and the energy dissipation coefficients keep the same order of magnitude of 0.55 obtained from H/h = 0.20 to 0.50. Such finding indicates that the scenarios of dual-slotted-barrier can achieve the lower energy reflection and transmission coefficients compared to the case of single-barrier.
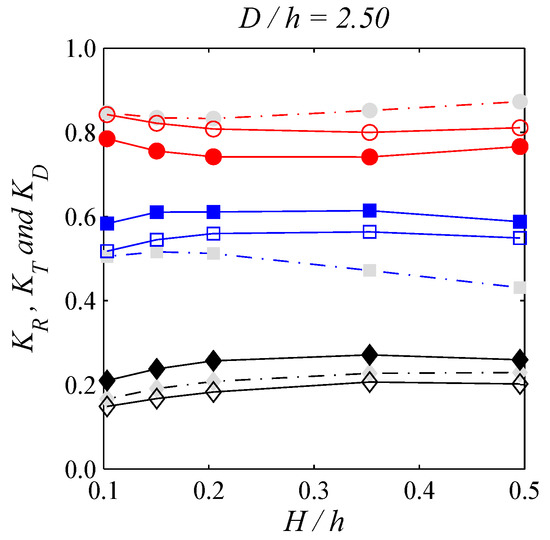
Figure 10.
Effects of H/h on the hydraulic performance for fixed D/h = 2.50. The hollow and solid symbols respectively depict the results of N1 = N2 = 0.10 and 0.00 scenarios. The dashed lines with gray signs show the results of single solid barrier case. Black, red and blue colors represent KR, KT and KD, respectively.
Since we have found the best hydraulic performance is achieved for solitary wave with H/h = 0.20 acting on a dual-slotted-barrier configuration, we here select this wave condition as an instance to illustrate the effects on the porosities of two neighboring slotted barriers. Figure 11 shows the energy coefficients versus the porosity value of the offshore/first barrier and the energy coefficients against the porosity value of the onshore/second barrier. A quite straightforward result is expected. For a fixed N1, the energy reflection and dissipation coefficients decrease with increasing the value of N2, and the energy transmission coefficients increase with increasing the value of N2. Those results reveal a similar trend on the energy coefficients in despite of changing the N1 with respect to N2 and vice versa. This finding further indicates that the arrangement of porosities for two slotted barriers is insignificant on the energy coefficients. We note that this argument may only be validated for the scale as we designed here. More considerations in terms of model scale and its environmental impact should be further accounted for before implementing into real engineering practices.
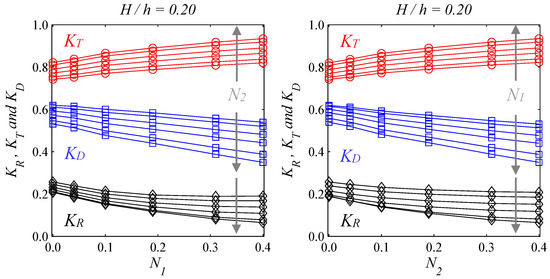
Figure 11.
Effects of N1 with respect to N2 (left column) and N2 with respect to N1 (right column) on the hydraulic performance, for the case of H/h = 0.20. Black, red and blue colors represent KR, KT and KD, respectively.
Figure 12 shows all numerical results obtained from 180 simulations (i.e., 36 combinations of two slotted barriers with, respectively, six different porosities for both barriers and five various wave heights) on the energy coefficients. We attempt to make fitting curves using a 2nd order polynomial regression based on all numerical simulation results, and thus three fitting curves on the RTD energy coefficients are formulated in Equation (1):
where X = [(h1 + h2)/h] × (h/H)0.1, h1 = h − a × N1 and h2 = h − a × N2. The best fitting curve relies on the goodness of the energy transmission coefficients with correlation coefficient being 0.90.
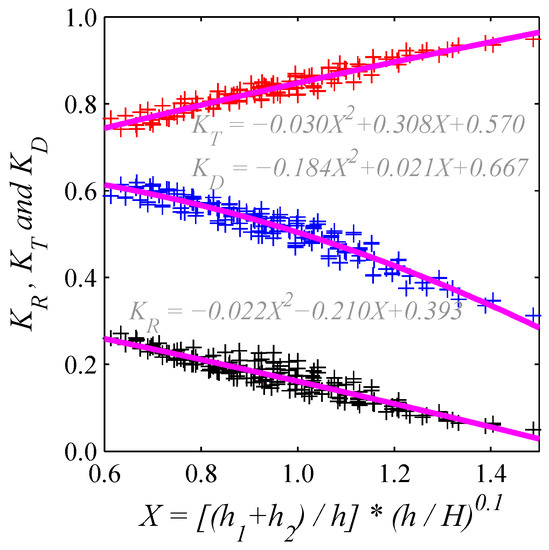
Figure 12.
Regression analyses based on all simulations in terms of the hydraulic performance (h1 = h − a × N1, h2 = h − a × N2). Symbols in black, red and blue colors represent KR, KT and KD, respectively, where the purple lines indicate the associated fitting curves for each energy coefficient.
4. Conclusions
This paper presents the analyses in terms of wave hydrodynamics and hydraulic performance of a submerged dual-barrier configuration under solitary waves with various wave heights in the same water depth. Two barriers are vertically mounted on the seafloor parallel to each other. Due to the lack of experimental data for dual-barrier under solitary waves, we therefore conduct new experiments to provide data for numerical model validation. Numerical results are calculated using a two-dimensional depth- and phase-resolving viscous numerical wave tank, based on the Reynolds-Averaged Navier–Stokes equations with the non-linear k-ɛ turbulence closure model [16,17]. Experiments and numerical simulations were used not only to confirm the model accuracy but also to find out an optimal distance between two neighboring barriers by means of the lowest energy transmission coefficient.
Our experimental as well as numerical results support the following conclusions. Model–data comparisons show satisfactory agreements in terms of free surface fluctuations time series. The optimal distance between two barriers was found to be 2.5 times the still water depth based on the model scale in terms of wave conditions and obstacle configurations as we designed in this study. The best hydraulic performance of the energy transmission coefficient is around 0.72 for the wave-height-to-water-depth ratio being 0.20. In addition, the largest energy dissipation coefficient is approximately 0.65 under the same wave condition.
As ongoing work, the interaction of multi-barrier system and different waveforms of non-linear long waves is desirable to investigate their variations to find an optimal design for the possible applications of tsunami mitigation.
Acknowledgments
This study was financially supported by the Ministry of Science and Technology, Taiwan (MOST 106-2911-I-006-301 to IWDRC of NCKU, 105-2221-E-006-121, 105-2221-E-006-131 and 106-2221-E-006-111). The authors gratefully thank the staffs of Tainan Hydraulics Laboratory of NCKU for their support and assistance on the experiments.
Author Contributions
Yun-Ta Wu and Shih-Chun Hsiao conceived the research topic; Yun-Ta Wu performed the experiments, numerical simulations and data analyses; and Yun-Ta Wu and Shih-Chun Hsiao wrote the paper.
Conflicts of Interest
The authors declare no conflict of interest.
References
- Lara, J.L.; Garcia, N.; Losada, I.J. Rans modelling applied to random wave interaction with submerged permeable structures. Coast. Eng. 2006, 53, 395–417. [Google Scholar] [CrossRef]
- Kobayashi, N.; Meigs, L.; Ota, T.; Melby, J. Irregular breaking wave transmission over submerged porous breakwater. J. Waterw. Port Coast. Ocean Eng. 2007, 133, 104–116. [Google Scholar] [CrossRef]
- Losada, M.A.; Losada, I.J.; Roldán, A.J. Propagation of oblique incident modulated waves past rigid, vertical thin barriers. Appl. Ocean Res. 1993, 15, 305–310. [Google Scholar] [CrossRef]
- Meringolo, D.D.; Aristodemo, F.; Veltri, P. SPH numerical modeling of wave—perforated breakwater interaction. Coast. Eng. 2015, 101, 48–68. [Google Scholar] [CrossRef]
- Liu, P.L.-F.; Abbaspour, M. Wave scattering by a rigid thin barrier. J. Waterw. Port Coast. Div. 1982, 108, 479–491. [Google Scholar]
- Losada, I.J.; Losada, M.A.; Roldán, A.J. Propagation of oblique incident waves past rigid vertical thin barriers. Appl. Ocean Res. 1992, 14, 191–199. [Google Scholar] [CrossRef]
- Isaacson, M.; Premasiri, S.; Yang, G. Wave interactions with vertical slotted barrier. J. Waterw. Port Coast. Ocean Eng. 1998, 124, 118–126. [Google Scholar] [CrossRef]
- Isaacson, M.; Baldwin, J.; Premasiri, S.; Yang, G. Wave interactions with double slotted barriers. Appl. Ocean Res. 1999, 21, 81–91. [Google Scholar] [CrossRef]
- Huang, Z. Wave interaction with one or two rows of closely spaced rectangular cylinders. Ocean Eng. 2007, 34, 1584–1591. [Google Scholar] [CrossRef]
- Huang, Z.; Li, Y.; Liu, Y. Hydraulic performance and wave loadings of perforated/slotted coastal structures: A review. Ocean Eng. 2011, 38, 1031–1053. [Google Scholar] [CrossRef]
- Hsiao, S.-C.; Hsu, T.-W.; Lin, T.-C.; Chang, Y.-H. On the evolution and run-up of breaking solitary waves on a mild sloping beach. Coast. Eng. 2008, 55, 975–988. [Google Scholar] [CrossRef]
- Hsiao, S.-C.; Lin, T.-C. Tsunami-like solitary waves impinging and overtopping an impermeable seawall: Experiment and rans modeling. Coast. Eng. 2010, 57, 1–18. [Google Scholar] [CrossRef]
- Oumeraci, H.; Koether, G. Hydraulic performance of a submerged wave absorber for coastal protection. In Non-Linear Wave Dynamics; Lynett, P., Ed.; World Scientific Publishing: Singapore, 2009; pp. 31–65. [Google Scholar]
- Liu, P.L.-F.; Al-Banaa, K. Solitary wave runup and force on a vertical barrier. J. Fluid Mech. 2004, 505, 225–233. [Google Scholar] [CrossRef]
- Wu, Y.-T.; Hsiao, S.-C.; Huang, Z.-C.; Hwang, K.-S. Propagation of solitary waves over a bottom-mounted barrier. Coast. Eng. 2012, 62, 31–47. [Google Scholar] [CrossRef]
- Lin, P.; Liu, P.L.-F. A numerical study of breaking waves in the surf zone. J. Fluid Mech. 1998, 359, 239–264. [Google Scholar] [CrossRef]
- Lin, P.; Liu, P.L.-F. Turbulence transport, vorticity dynamics, and solute mixing under plunging breaking waves in surf zone. J. Geophys. Res. 1998, 103, 15677–15694. [Google Scholar] [CrossRef]
- Lin, P. A numerical study of solitary wave interaction with rectangular obstacles. Coast. Eng. 2004, 51, 35–51. [Google Scholar] [CrossRef]
- Goring, D.G. Tsunamis-the Propagation of Long Waves onto a Shelf. Ph.D. Thesis, California Institute of Technology, Pasadena, CA, USA, 1978. [Google Scholar]
- Wu, Y.-T. Long Waves Interaction with Coastal Structures. Ph.D. Thesis, National Cheng-Kung University, Tainan, Taiwan, 2015. [Google Scholar]
- Wu, N.-J.; Hsiao, S.-C.; Chen, H.-H.; Yang, R.-Y. The study on solitary waves generated by a piston-type wave maker. Ocean Eng. 2016, 117, 114–129. [Google Scholar] [CrossRef]
- Hirt, C.W.; Nichols, B.D. Volume of fluid (vof) method for the dynamics of free boundaries. J. Comput. Phys. 1981, 39, 201–225. [Google Scholar] [CrossRef]
- Wu, Y.-T.; Hsiao, S.-C. Propagation of solitary waves over a submerged permeable breakwater. Coast. Eng. 2013, 81, 1–18. [Google Scholar] [CrossRef]
- Cooker, M.J.; Peregrine, D.H.; Vidal, C.; Dold, J.W. The interaction between a solitary wave and a submerged semicircular cylinder. J. Fluid Mech. 1990, 215, 1–22. [Google Scholar] [CrossRef]
- Zhang, Q.; Liu, P.L.-F. A numerical study of swash flows generated by bores. Coast. Eng. 2008, 55, 1113–1134. [Google Scholar] [CrossRef]
- Liu, P.L.-F.; Cheng, Y. A numerical study of the evolution of a solitary wave over a shelf. Phys. Fluids 2001, 13. [Google Scholar] [CrossRef]
- Lin, P.; Karunarathna, S. Numerical study of solitary wave interaction with porous breakwaters. J. Waterw. Port Coast. Ocean Eng. 2007, 133, 352–363. [Google Scholar] [CrossRef]
- Wu, Y.-T.; Yeh, C.-L.; Hsiao, S.-C. Three-dimensional numerical simulation on the interaction of solitary waves and porous breakwaters. Coast. Eng. 2014, 85, 12–29. [Google Scholar] [CrossRef]
© 2017 by the authors. Licensee MDPI, Basel, Switzerland. This article is an open access article distributed under the terms and conditions of the Creative Commons Attribution (CC BY) license (http://creativecommons.org/licenses/by/4.0/).