Impact of Combined Sewer Overflow on Wastewater Treatment and Microbiological Quality of Rivers for Recreation

 and
and
Abstract
: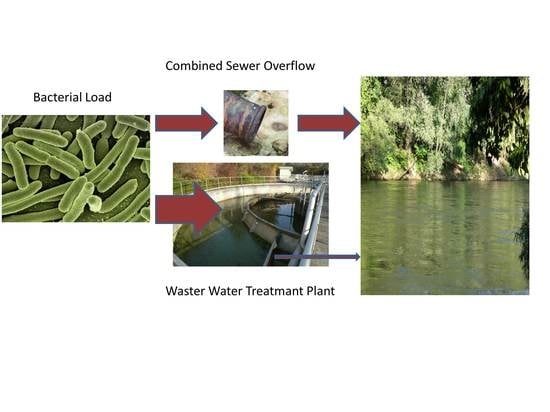
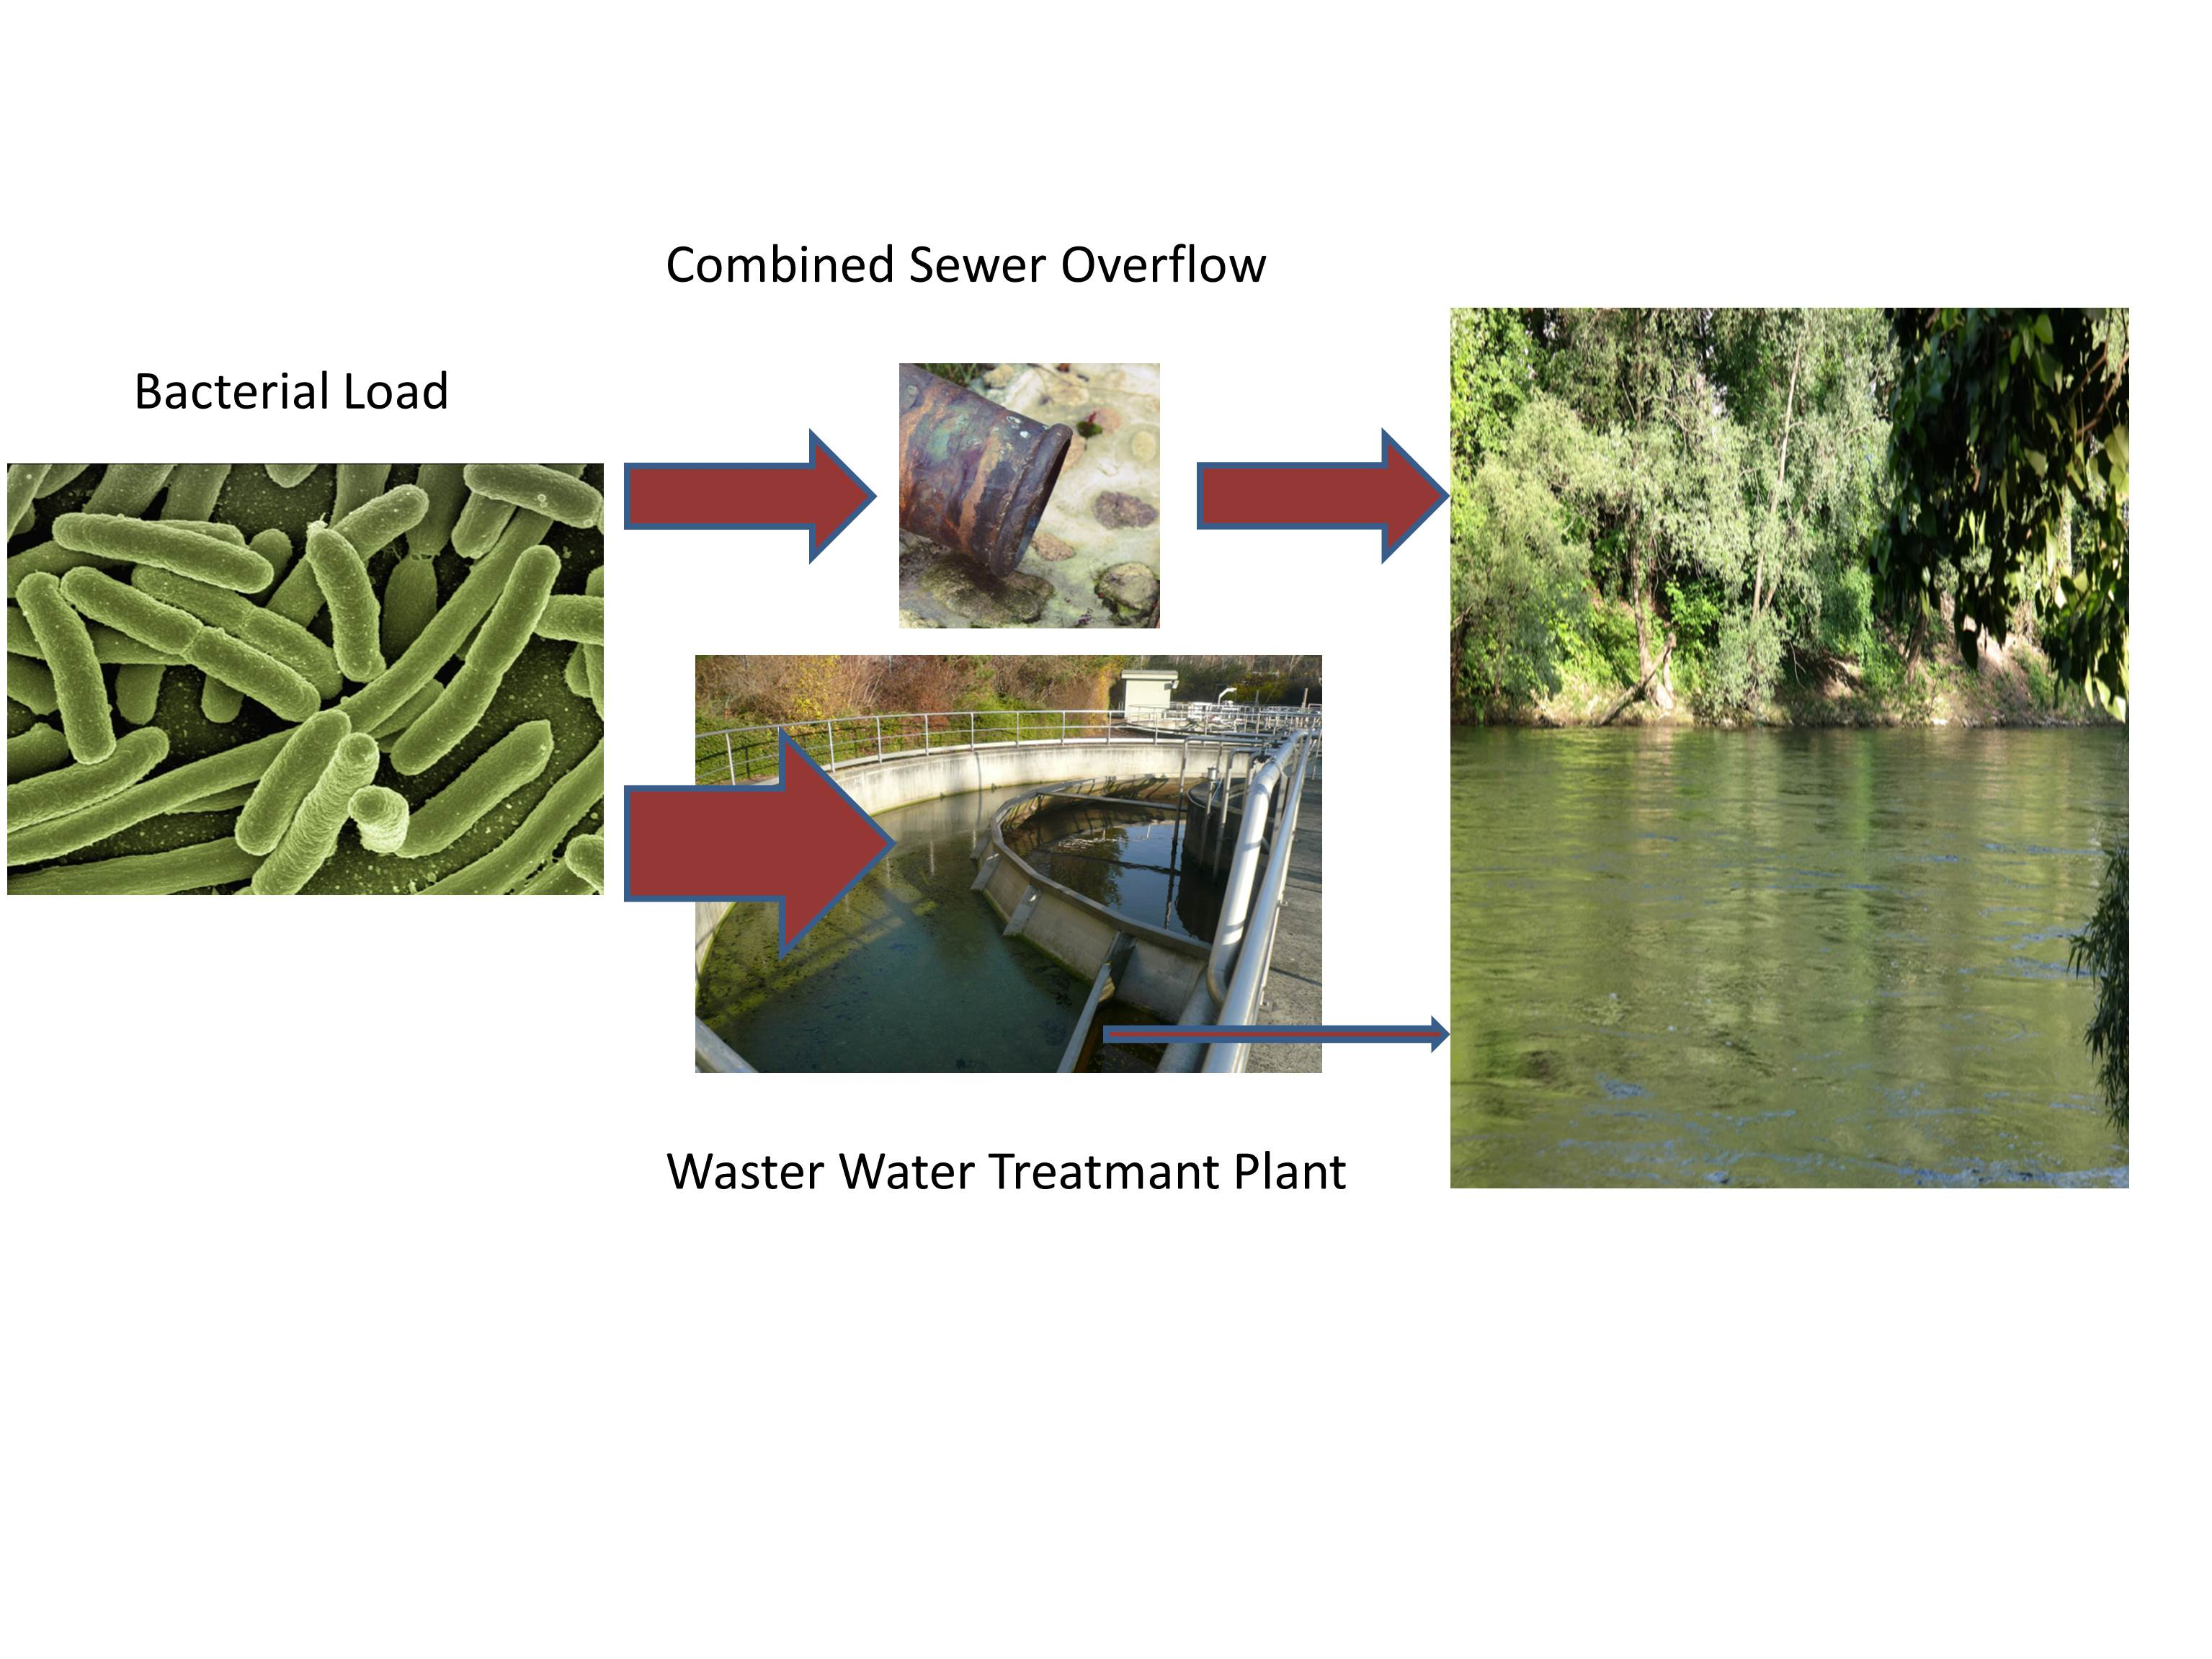
1. Introduction
2. Material and Methods
2.1. Description of the Wastewater Treatment Plant (WWTP)
- Coarse gravel, combined sewage basin (3000 m3)
- Influent lifting: Archimedean screws (three aggregates with 140 L/s max. capacity each)
- Rake system: Two lines (3 mm gap size) 280 L/s each
- Sand washing plant, sewage take-up, fecal, foreign sludge/mud and grease take-up
- Sand and grease catchment; two lines
- Two primary clarifiers with 126 m3 each, and a distribution building
- Aeration basins (two lines) for single-step activated sludge processing, with combined pre-installed and simultaneous denitrification, as well as biological phosphor elimination; Vtot. = 5.100 m3
- Two rectangular, secondary clarification basins with vertical flow-through: Vtot. = 4.032 m3 each
- Precipitation station: iron-aluminum combination
- Filter system: disc filter system for solid retention, three units of 60 m2 each and with a max. load of 1000 m3/h.
- Pre-thickener of the sewage sludge
- Sludge mixing container for transfer to the digestion tower (100 m3)
- Digestion tower: V = 1500 m3
- High-performance centrifuge for sludge dewatering, and a belt thickener for surplus sludge 30 m3/h, sludge storage
- Sewer gas unit consisting of a digesting tower (anaerobic treatment), condensation dryer, active-carbon plant, measuring unit, gas desulphurization, gas tank, gas flare, heating boiler and a gas power station.
2.2. Sample Collection and Investigated Parameters
3. Results
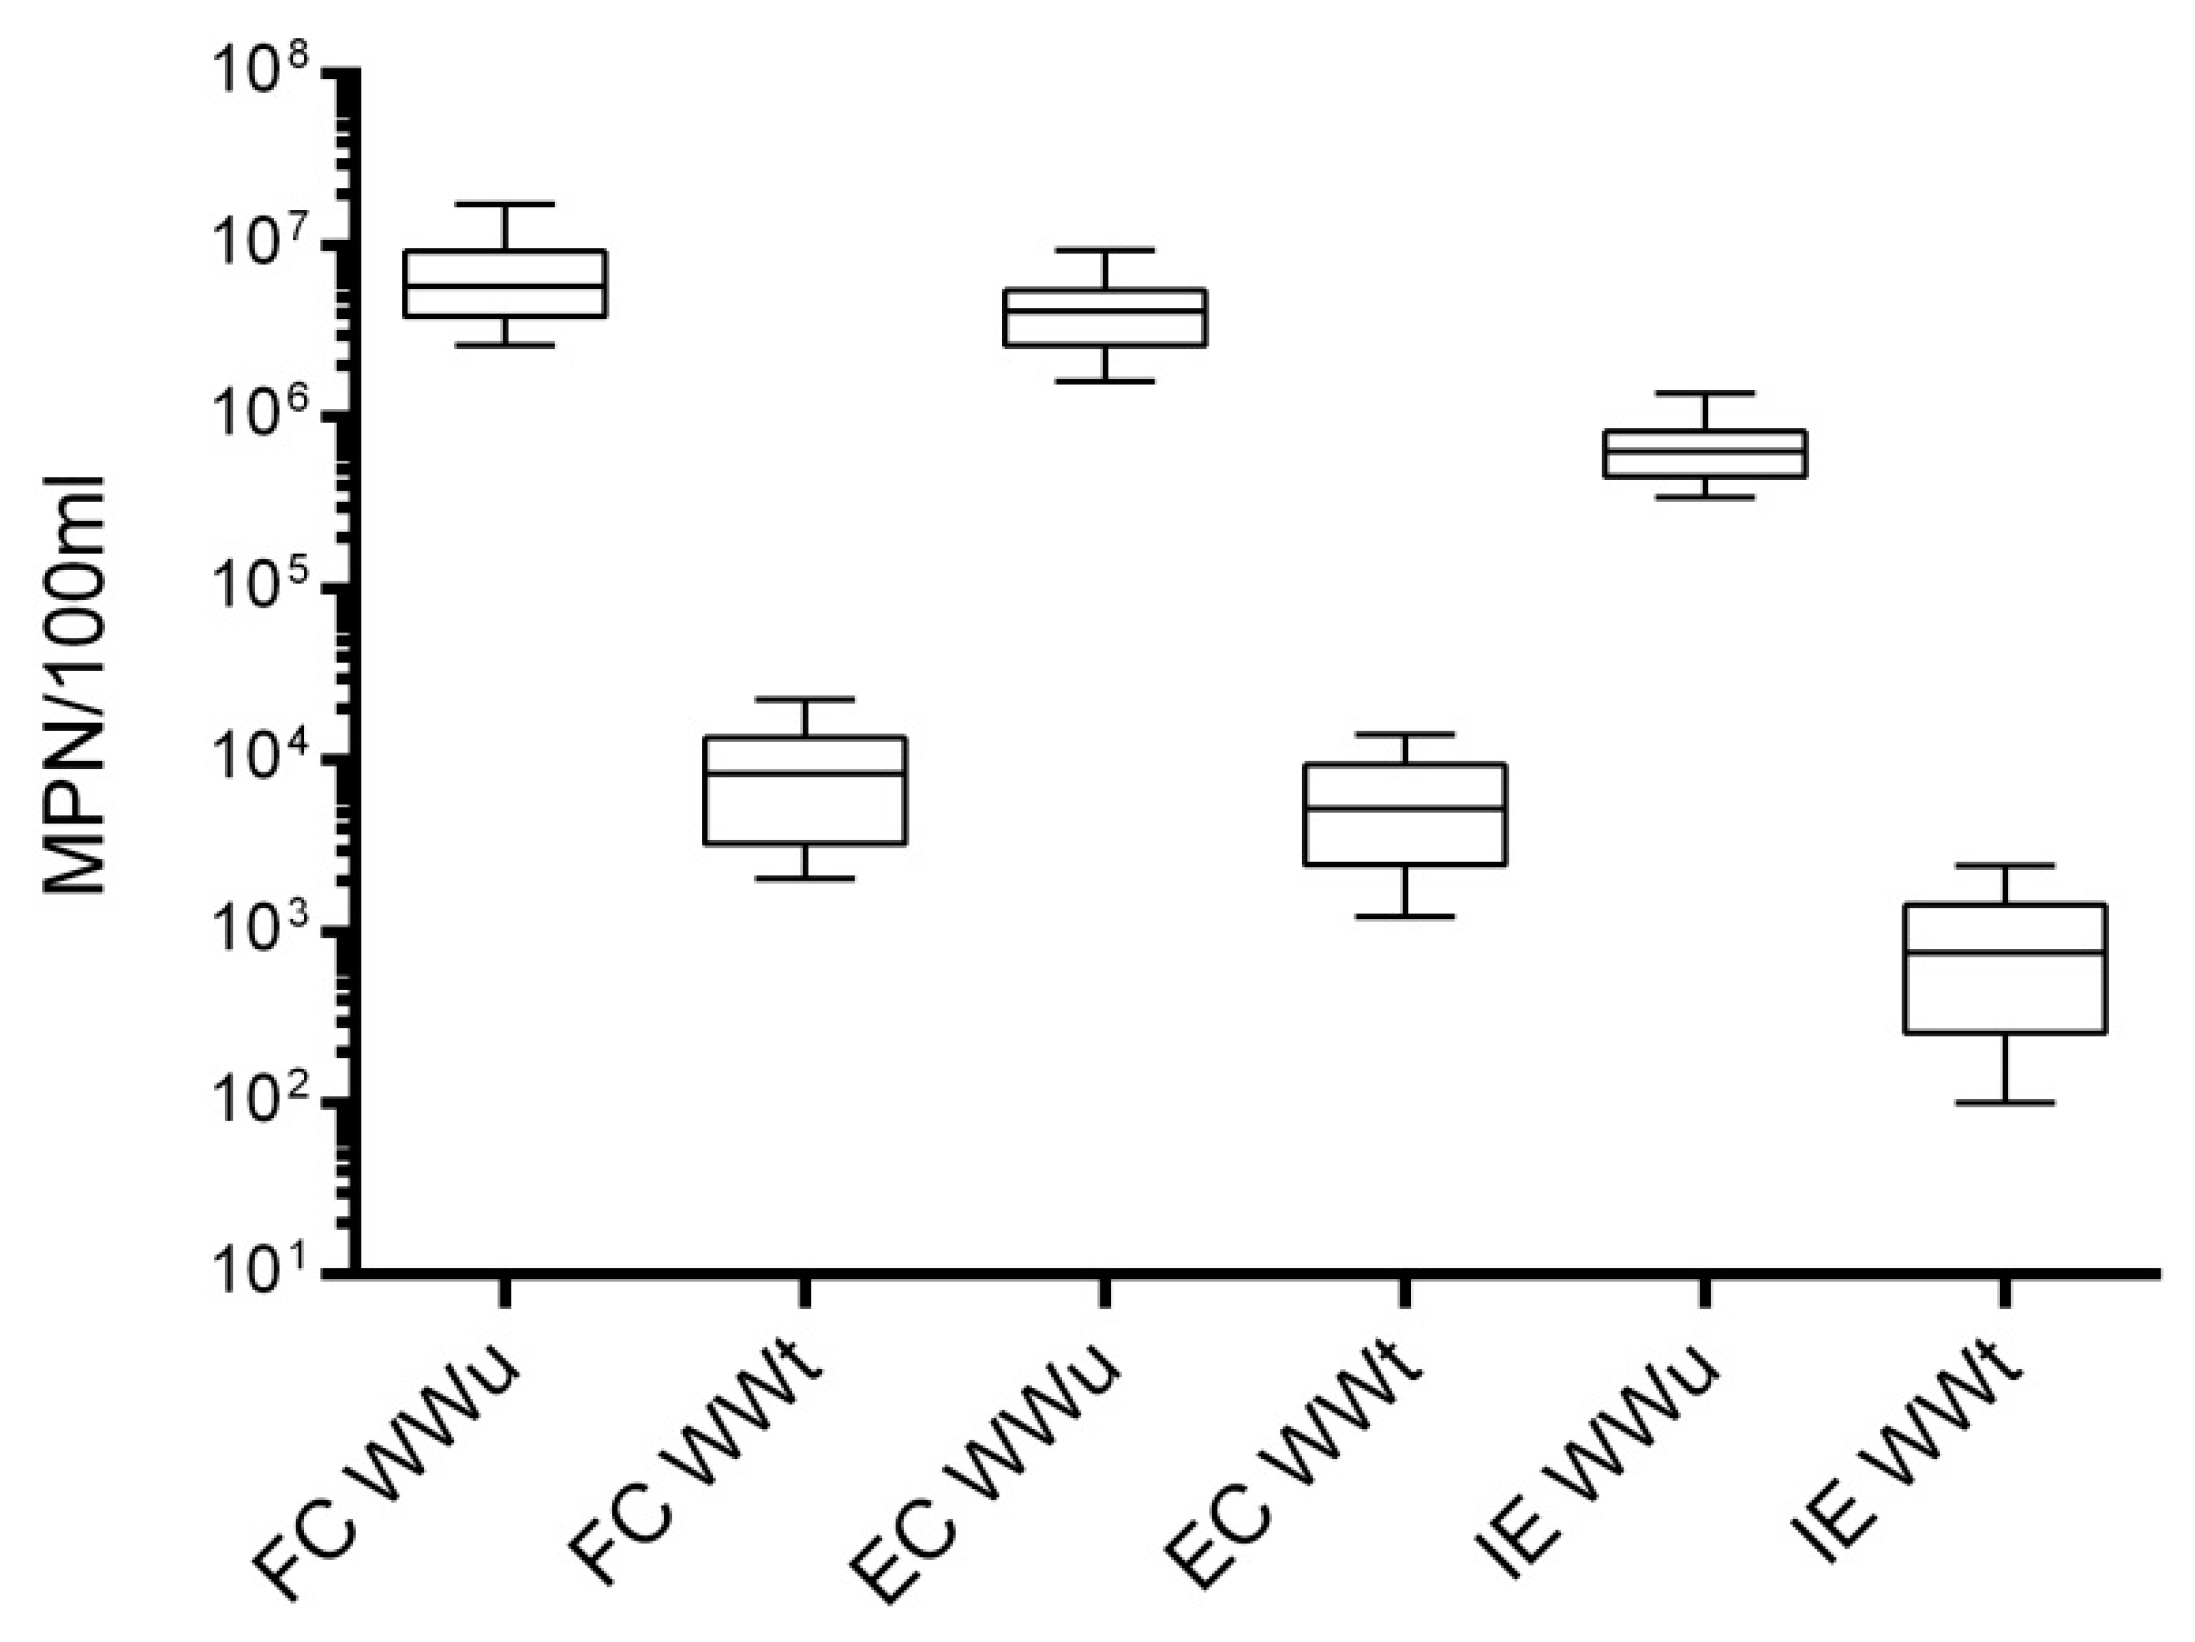
3.1. Bacterial Load and Reduction Rate of the Wastewater
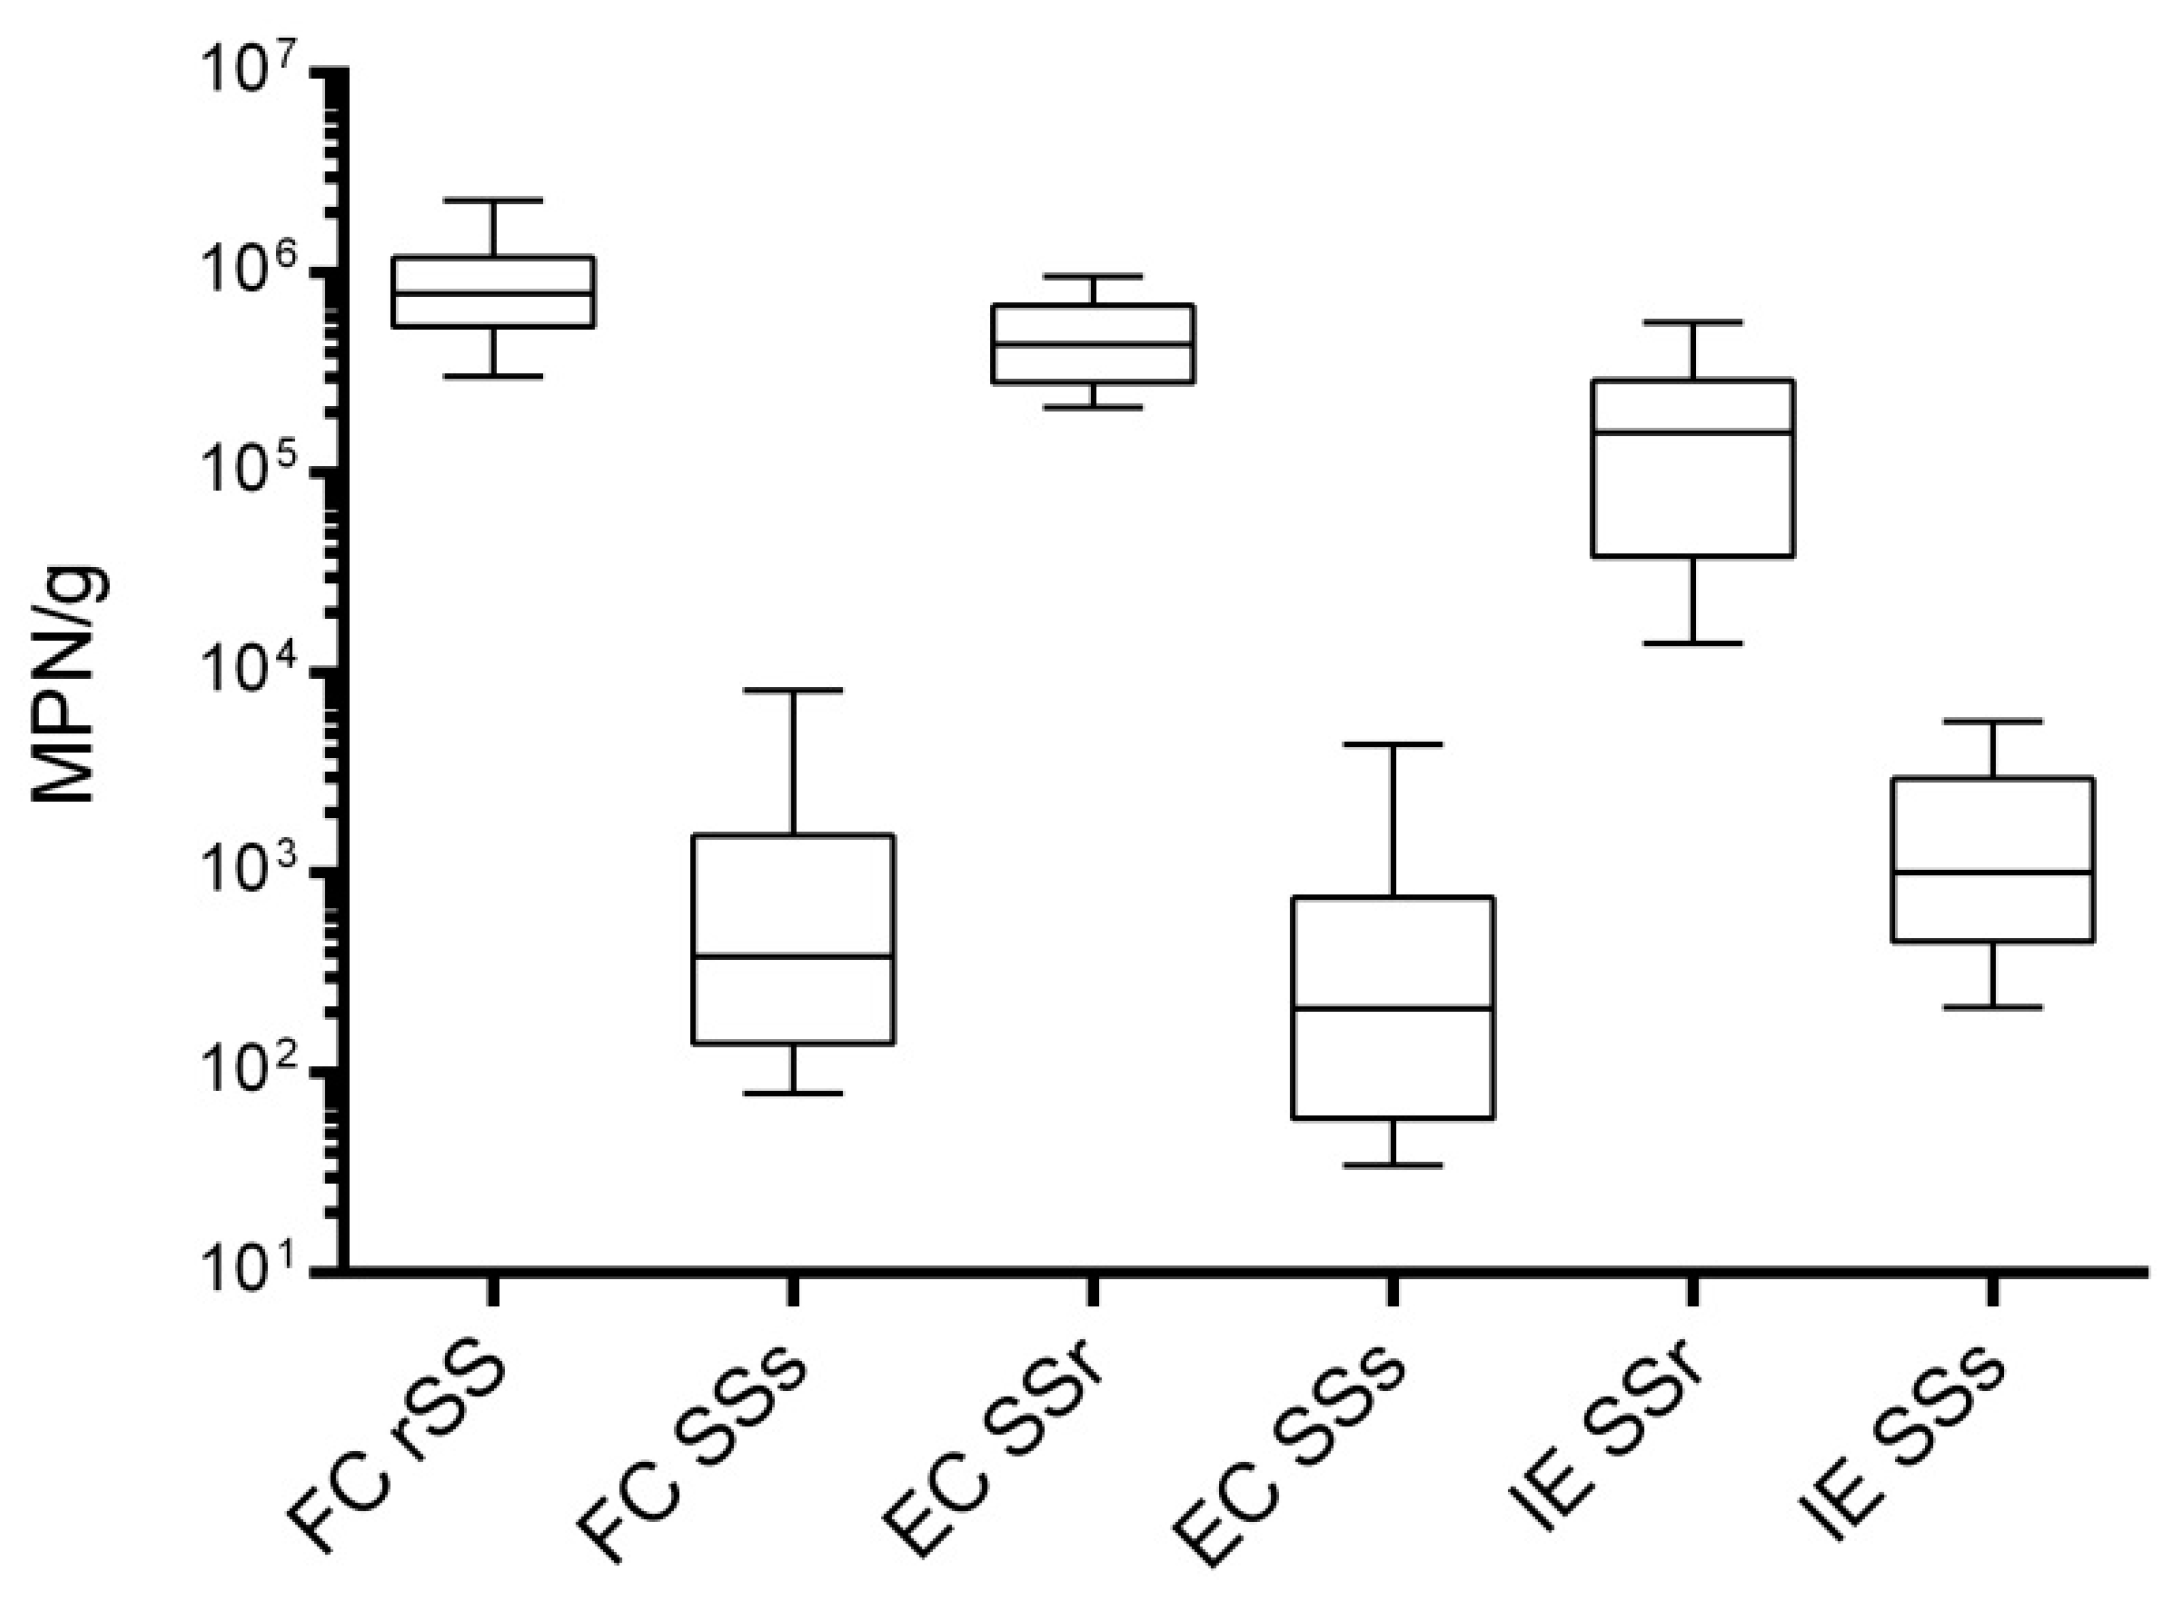
3.2. Bacterial Load and Reduction Rate of the Sewage Sludge
3.3. Calculation of FIB Increase in the Recipient on the Basis of WWt and Combined Sewer Overlfow (CSO)
- CR (MPN/100 mL): Increase of FIB in the recipient as a result of influent of treated and untreated WW
- CWWt (MPN/100 mL): Concentration of FIB in treated waste water WW
- CWWu (MPN/100 mL): Concentration of FIB in untreated WW
- WWV (m3/t): total volume of WW per time in the WWTP
- RV (m3/t): discharge of the recipient per time
- X: Clearance ratio regarding treated and untreated WW; value between 0 and 1
3.4. WWTP Purification Efficiency and Its Influence on the Recipient
3.5. Combined Sewer Overflow (CSO) and Its Influence on the Recipient
3.6. Anaerobic Sludge-Stabilization
4. Discussion and Conclusions
Author Contributions
Conflicts of Interest
References
- The Austrian Federal Ministry of Agriculture, Forestry Environment and Water Management. National Water Management Plan 2009—NWMP 2009; Federal Ministry of Agriculture, Forestry, Environment and Water Management: Vienna, Austria, 2009.
- European Community. Directive 2000/60/EC of the European Parliament and of the Council of 23 October 2000 Establishing a Framework for Community Action in the Field of Water Policy; European Community: Copenhagen, Denmark, 2000. [Google Scholar]
- Mose, J.R.; Thiel, W. Evidence of Salmonellae in the Mur River; Comparison 1969–1981. Zentralbl. Bakteriol. Mikrobiol. Hyg. B 1982, 176, 562–570. [Google Scholar] [PubMed]
- Kittinger, C.; Marth, E.; Reinthaler, F.F.; Zarfel, G.; Pichler-Semmelrock, F.; Mascher, W.; Mascher, G.; Mascher, F. Water Quality Assessment of a Central European River—Does the Directive 2000/60/EC Cover all the Needs for a Comprehensive Classification? Sci. Total Environ. 2013, 447, 424–429. [Google Scholar] [CrossRef] [PubMed]
- European Community. Directive 2006/7/EC OF the European Parliament and of the Council of 15 February 2006 Concerning the Management of Bathing Water Quality and Repealing Directive 76/160/EEC; European Community: Copenhagen, Denmark, 2006. [Google Scholar]
- Schindler, P.R. Hygiene of Bathing Waters. Gesundheitswesen 2001, 63 (Suppl. 2), S142–S150. [Google Scholar] [CrossRef] [PubMed]
- Servais, P.; Garcia-Armisen, T.; George, I.; Billen, G. Fecal Bacteria in the Rivers of the Seine Drainage Network (France): Sources, Fate and Modelling. Sci. Total Environ. 2007, 375, 152–167. [Google Scholar] [CrossRef] [PubMed]
- Kistemann, T.; Rind, E.; Koch, C.; Classen, T.; Lengen, C.; Exner, M.; Rechenburg, A. Effect of Sewage Treatment Plants and Diffuse Pollution on the Occurrence of Protozoal Parasites in the Course of a Small River. Int. J. Hyg. Environ. Health 2012, 215, 577–583. [Google Scholar] [CrossRef] [PubMed]
- Morgan, J.; Bornstein, S.L.; Karpati, A.M.; Bruce, M.; Bolin, C.A.; Austin, C.C.; Woods, C.W.; Lingappa, J.; Langkop, C.; Davis, B.; et al. Outbreak of Leptospirosis among Triathlon Participants and Community Residents in Springfield, Illinois, 1998. Clin. Infect. Dis. 2002, 34, 1593–1599. [Google Scholar] [CrossRef] [PubMed]
- Radl, C.; Muller, M.; Revilla-Fernandez, S.; Karner-Zuser, S.; de Martin, A.; Schauer, U.; Karner, F.; Stanek, G.; Balcke, P.; Hallas, A.; et al. Outbreak of Leptospirosis among Triathlon Participants in Langau, Austria, 2010. Wien. Klin. Wochenschr. 2011, 123, 751–755. [Google Scholar] [CrossRef] [PubMed]
- Zarfel, G.; Lipp, M.; Gurtl, E.; Folli, B.; Baumert, R.; Kittinger, C. Troubled Water Under the Bridge: Screening of River Mur Water Reveals Dominance of CTX-M Harboring Escherichia Coli and for the First Time an Environmental VIM-1 Producer in Austria. Sci. Total Environ. 2017, 593, 399–405. [Google Scholar] [CrossRef] [PubMed]
- Water Quality—Enumeration of Escherichia coli and Coliform Bacteria—Part 2: Most Probable Number Method (ISO 9308-2); International Organization for Standardization: Geneva, Switzerland, 2012.
- Water Quality—Detection and Enumeration of Intestinal Enterococci—Part 2: Membrane Filtration Method (ISO 7899-2); International Organization for Standardization: Geneva, Switzerland, 2000.
- Water Quality—Detection of Salmonella spp., ISO 19250; International Organization for Standardization: Geneva, Switzerland, 2010.
- Kistemann, T.; Rind, E.; Rechenburg, A.; Koch, C.; Classen, T.; Herbst, S.; Wienand, I.; Exner, M. A Comparison of Efficiencies of Microbiological Pollution Removal in Six Sewage Treatment Plants with Different Treatment Systems. Int. J. Hyg. Environ. Health 2008, 211, 534–545. [Google Scholar] [CrossRef] [PubMed]
- Ministry for Agriculture, Forestry, Environment and Water Management. Hydrographical Annual of Austria; Ministry for Agriculture, Forestry, Environment and Water Management: Vienna, Austria, 2013.
- Styrian Government. The Legal Information System of the Republic of Austria 2007; Styrian Government: Styria, Austria, 2007.
- Kistemann, T.; Schmidt, A.; Flemming, H.C. Post-Industrial River Water Quality-Fit for Bathing again? Int. J. Hyg. Environ. Health 2016, 219, 629–642. [Google Scholar] [CrossRef] [PubMed]
- Rechenburg, A.; Koch, C.; Classen, T.; Kistemann, T. Impact of Sewage Treatment Plants and Combined Sewer Overflow Basins on the Microbiological Quality of Surface Water. Water Sci. Technol. 2006, 54, 95–99. [Google Scholar] [CrossRef] [PubMed]
- Rechenburg, A.; Kistemann, T. Sewage Effluent as a Source of Campylobacter Sp. in a Surface Water Catchment. Int. J. Environ. Health Res. 2009, 19, 239–249. [Google Scholar] [CrossRef] [PubMed]
- Strathmann, M.; Horstkott, M.; Koch, C.; Gayer, U.; Wingender, J. The River Ruhr—An Urban River under Particular Interest for Recreational use and as a Raw Water Source for Drinking Water: The Collaborative Research Project “Safe Ruhr”—Microbiological Aspects. Int. J. Hyg. Environ. Health 2016, 219, 643–661. [Google Scholar] [CrossRef] [PubMed]
- Deller, S.; Mascher, F.; Platzer, S.; Reinthaler, F.F.; Marth, E. Effect of Solar Radiation on Survival of Indicator Bacteria in Bathing Waters. Cent. Eur. J. Public Health 2006, 14, 133–137. [Google Scholar] [PubMed]
- Kim, G.; Hur, J. Mortality Rates of Pathogen Indicator Microorganisms Discharged from Point and Non-Point Sources in an Urban Area. J. Environ. Sci. 2010, 22, 929–933. [Google Scholar] [CrossRef]
- Chigbu, P.; Gordon, S.; Strange, T. Influence of Inter-Annual Variations in Climatic Factors on Fecal Coliform Levels in Mississippi Sound. Water Res. 2004, 38, 4341–4352. [Google Scholar] [CrossRef] [PubMed]
- Menon, P.; Billen, G.; Servais, P. Mortality Rates of Autochthonous and Fecal Bacteria in Natural Aquatic Ecosystems. Water Res. 2003, 37, 4151–4158. [Google Scholar] [CrossRef]
- Ibekwe, A.M.; Ma, J.; Murinda, S.E. Bacterial Community Composition and Structure in an Urban River Impacted by Different Pollutant Sources. Sci. Total Environ. 2016, 566, 1176–1185. [Google Scholar] [CrossRef] [PubMed]
- Franke, C.; Rechenburg, A.; Baumanns, S.; Willkomm, M.; Christoffels, E.; Exner, M.; Kistemann, T. The Emission Potential of Different Land Use Patterns for the Occurrence of Coliphages in Surface Water. Int. J. Hyg. Environ. Health 2009, 212, 338–345. [Google Scholar] [CrossRef] [PubMed]
- George, I.; Anzil, A.; Servais, P. Quantification of Fecal Coliform Inputs to Aquatic Systems through Soil Leaching. Water Res. 2004, 38, 611–618. [Google Scholar] [CrossRef] [PubMed]
- Touron, A.; Berthe, T.; Gargala, G.; Fournier, M.; Ratajczak, M.; Servais, P.; Petit, F. Assessment of Faecal Contamination and the Relationship between Pathogens and Faecal Bacterial Indicators in an Estuarine Environment (Seine, France). Mar. Pollut. Bull. 2007, 54, 1441–1450. [Google Scholar] [CrossRef] [PubMed]
- Kirschner, A.K.; Kavka, G.G.; Velimirov, B.; Mach, R.L.; Sommer, R.; Farnleitner, A.H. Microbiological Water Quality Along the Danube River: Integrating Data from Two Whole-River Surveys and a Transnational Monitoring Network. Water Res. 2009, 43, 3673–3684. [Google Scholar] [CrossRef] [PubMed]
- Brockmann, S.; Piechotowski, I.; Bock-Hensley, O.; Winter, C.; Oehme, R.; Zimmermann, S.; Hartelt, K.; Luge, E.; Nockler, K.; Schneider, T.; et al. Outbreak of Leptospirosis among Triathlon Participants in Germany, 2006. BMC Infect. Dis. 2010, 10, 91. [Google Scholar] [CrossRef] [PubMed]
- Huber, S.; Popp, W. Reduction Rates of Pathogenes and Faecal Indicators after UV Disinfection at Bad Tölz Waste Water Treatment Plant; IUVA news: Bethesda, MD, USA, 2003; Volume 3. [Google Scholar]


| Parameters | Detail Information |
|---|---|
| Connected Inhabitants | 50,000 |
| Hydraulic load QDW | 8000 m3/day |
| Hydraulic load QRW | 16,000 m3/day |
| Max. QDW | 140 L/s |
| Max.QRW (total input activation reservoir) | 280 L/s |
| BOD5 load | 3000 kg/day |
| COD load | 6000 kg/day |
| Ntot. load | 550 kg/day |
| Ptot. load | 75 kg/day |
| Investigated Parametere | WWu (10–90/25–75) | WWt (10–90/25–75) | RR (log) |
|---|---|---|---|
| FC | 0.82/0.38 | 1.05/0.62 | 2.84 |
| EC | 0.76/0.32 | 1.07/0.58 | 2.90 |
| IE | 061/0.26 | 1.39/0.75 | 2.93 |
| Investigated Parameter | SSr (10–90/25–75) | SSs (10–90/25–75) | RR (log) |
|---|---|---|---|
| FC | 0.88/0.35 | 2.01/1.04 | 3.32 |
| EC | 0.66/0.39 | 2.11/1.11 | 3.32 |
| IE | 1.61/0.88 | 1.43/0.82 | 2.20 |
| Flow Rate | FC (Median/90th Percentile) | EC (Median/90th Percentile) | IE (Median/90th Percentile) |
|---|---|---|---|
| QM | 5.8/15.5 | 3.6/9.8 | 0.5/1.7 |
| Q95% | 13.1/35.2 | 8.2/22.1 | 1.2/3.8 |
| Flow Rate | FC (Median/90th Percentile) | EC (Median/90th Percentile) | IE (Median/90th Percentile) |
|---|---|---|---|
| QM | 4004/11,964 | 2835/6420 | 436/947 |
| Q95% | 9075/27,116 | 6426/14,551 | 989/2147 |
| Annual Load | FC | EC | IE |
|---|---|---|---|
| WWt | 2.6 × 10¹⁴ | 1.6 × 10¹⁴ | 2.3 × 10¹³ |
| CSO | 7.8 × 10¹⁵ | 5.5 × 10¹⁵ | 8.5 × 10¹⁴ |
| Factor (CSO/WWt) | 30 | 34 | 37 |
| Wastewater Treatment | EC (MPN/100 mL) | IE (MPN/100 mL) | ||
|---|---|---|---|---|
| WWTP | ∑ WWTP | WWTP | ∑ WWTP | |
| Treated WW (95.7%) CSO (4.3%) | 1.2 × 10² | 3.8 × 10³ | 1.8 × 101 | 5.8 × 10² |
| CSO (0%) Treated WW (100%) | 3.5 × 100 | 1.1 × 10² | 0.5 × 100 | 1.2 × 101 |
| CSO (100%) Treated WW (0%) | 2.8 × 10³ | 8.7 × 10⁴ | 4.3 × 10² | 1.3 × 10⁴ |
© 2017 by the authors. Licensee MDPI, Basel, Switzerland. This article is an open access article distributed under the terms and conditions of the Creative Commons Attribution (CC BY) license (http://creativecommons.org/licenses/by/4.0/).
Share and Cite
Mascher, F.; Mascher, W.; Pichler-Semmelrock, F.; Reinthaler, F.F.; Zarfel, G.E.; Kittinger, C. Impact of Combined Sewer Overflow on Wastewater Treatment and Microbiological Quality of Rivers for Recreation. Water 2017, 9, 906. https://doi.org/10.3390/w9110906
Mascher F, Mascher W, Pichler-Semmelrock F, Reinthaler FF, Zarfel GE, Kittinger C. Impact of Combined Sewer Overflow on Wastewater Treatment and Microbiological Quality of Rivers for Recreation. Water. 2017; 9(11):906. https://doi.org/10.3390/w9110906
Chicago/Turabian StyleMascher, Franz, Wolfgang Mascher, Franz Pichler-Semmelrock, Franz F. Reinthaler, Gernot E. Zarfel, and Clemens Kittinger. 2017. "Impact of Combined Sewer Overflow on Wastewater Treatment and Microbiological Quality of Rivers for Recreation" Water 9, no. 11: 906. https://doi.org/10.3390/w9110906
APA StyleMascher, F., Mascher, W., Pichler-Semmelrock, F., Reinthaler, F. F., Zarfel, G. E., & Kittinger, C. (2017). Impact of Combined Sewer Overflow on Wastewater Treatment and Microbiological Quality of Rivers for Recreation. Water, 9(11), 906. https://doi.org/10.3390/w9110906