1. Introduction
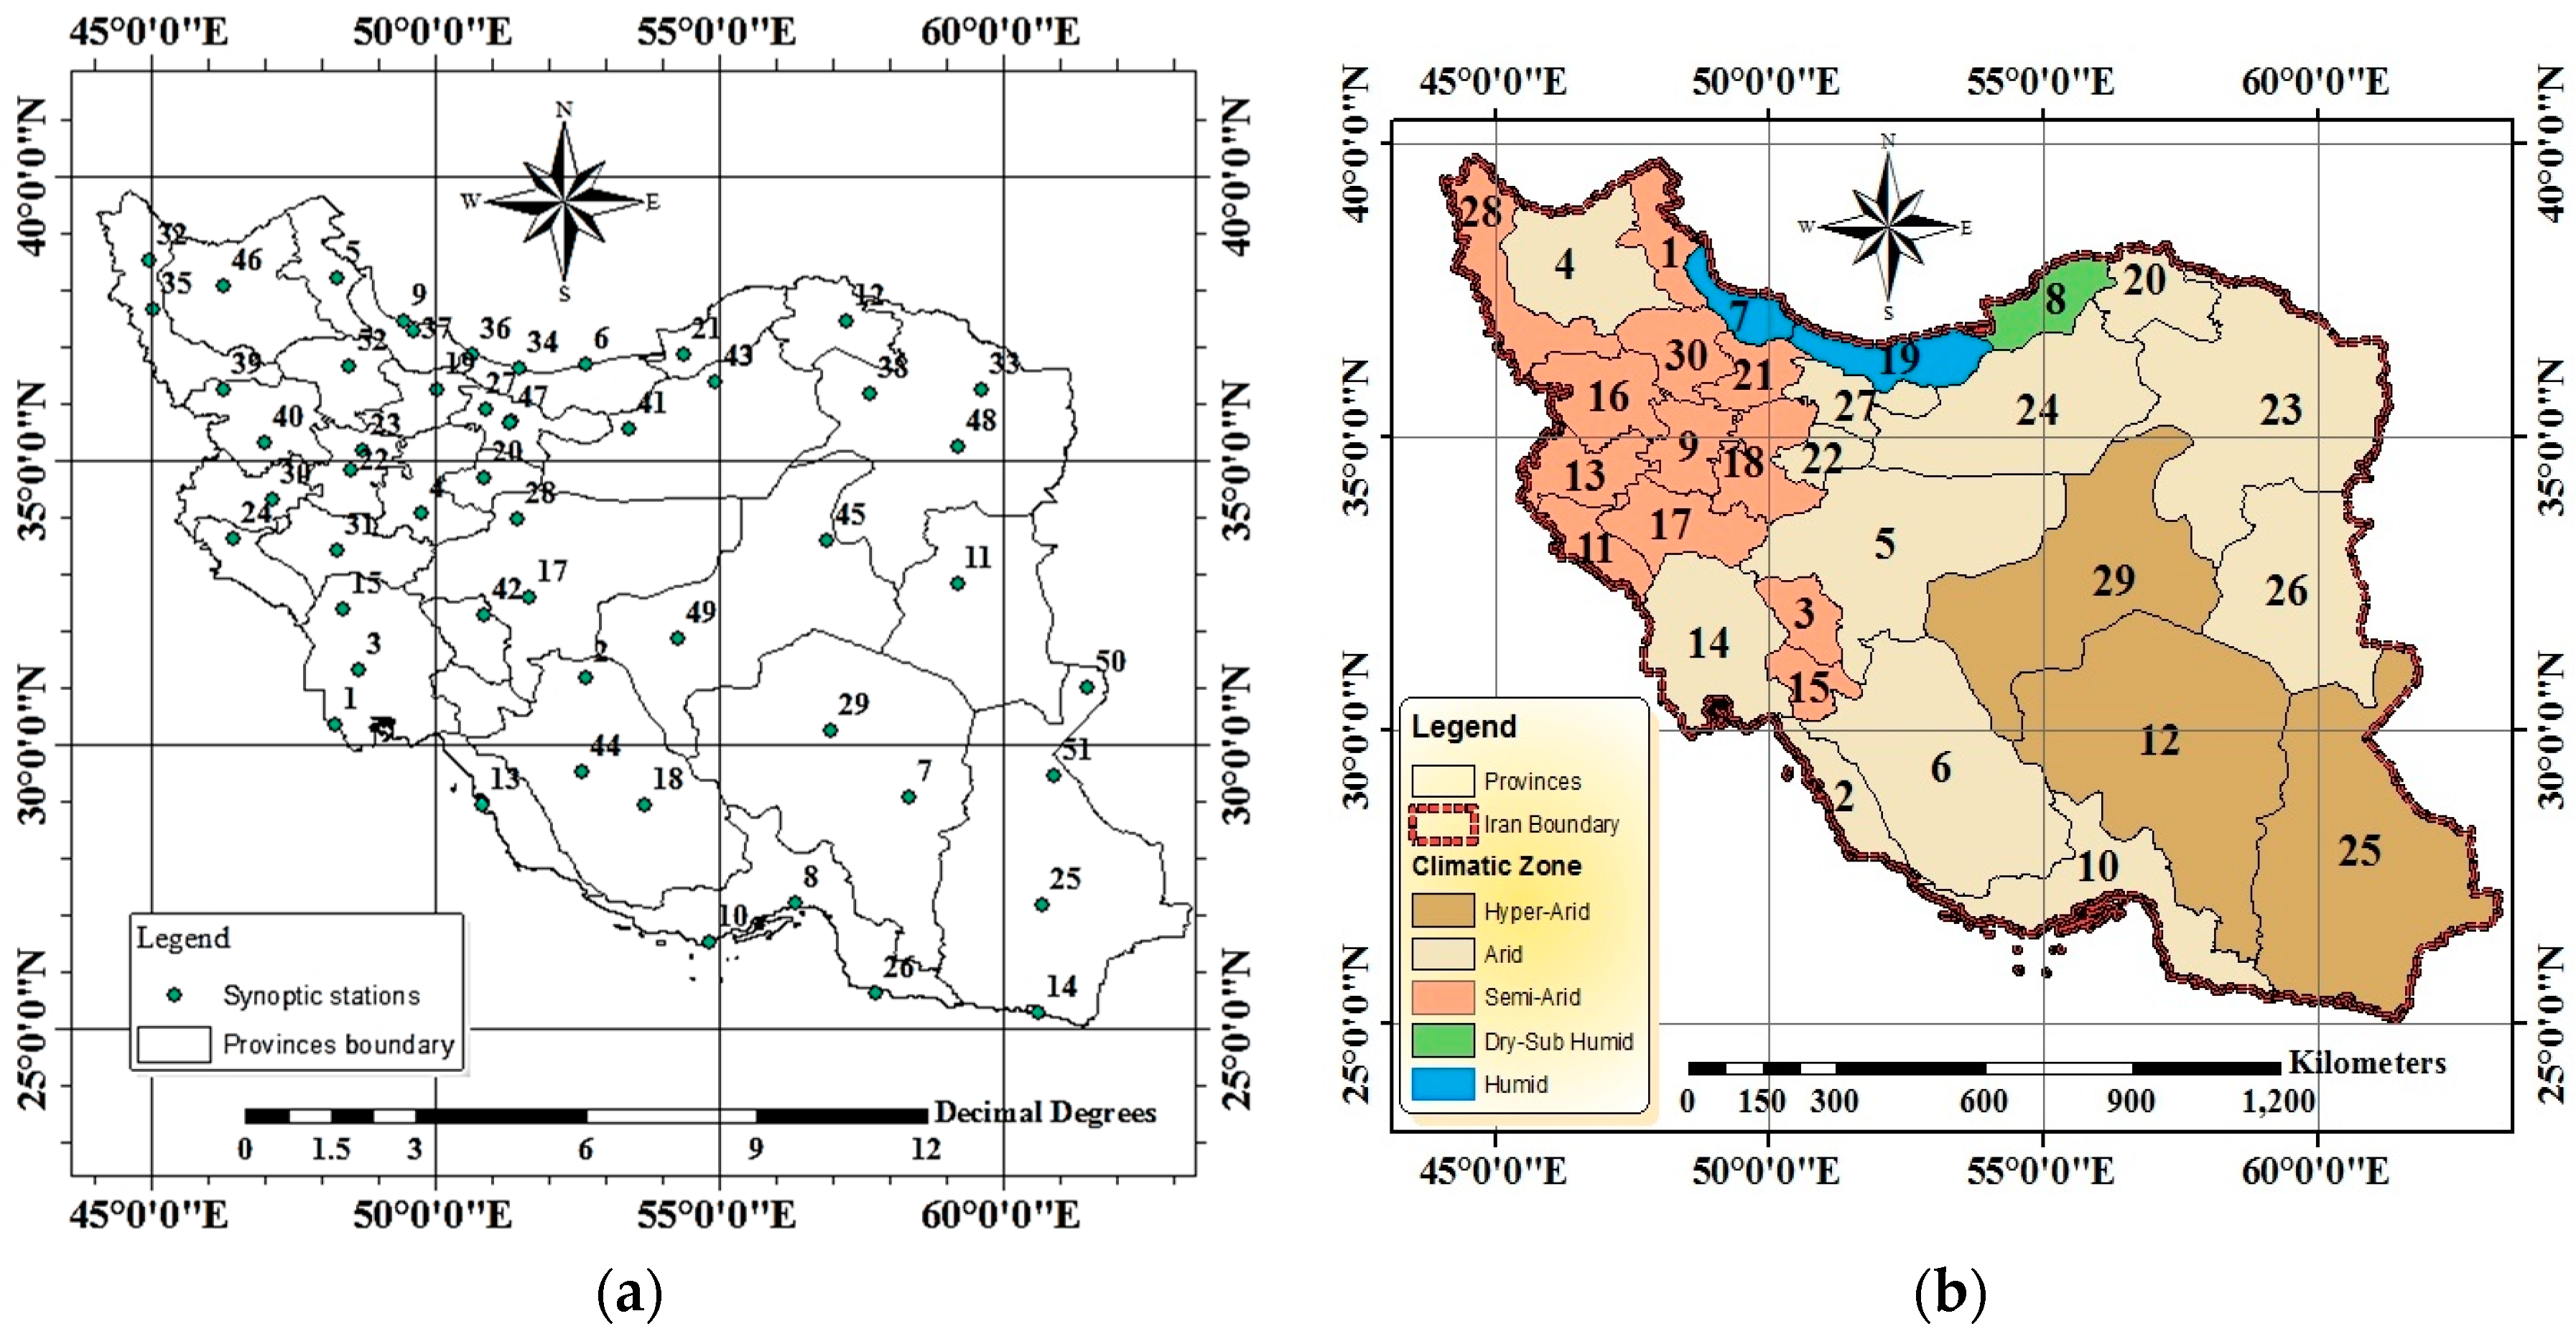
Iran, the second largest country in the Middle East, is facing great water scarcity, which becomes manifest in drying lakes and rivers, dropping groundwater tables, land subsidence, the increasing contamination of water, water supply rationing and disruptions, crop losses, salt and sand storms, the increasing migration of people away from the hardest hit areas, and damage to ecosystems. Iran is mostly arid to semi-arid (
Figure 1), with an average annual precipitation of 228 mm (72% less than the global average of 814 mm), and internal renewable water resources of 129 × 10
9 m
3·y
−1 (0.32% of the global renewable water resources) [
1]. Precipitation ranges from less than 50 mm in central Iran to about 1000 mm at the Caspian coast. Most regions receive less than 100 mm of precipitation per year, and 75% of the country’s precipitation falls over only 25% of the country’s area. About 75% of the precipitation is offseason, i.e., it falls when not needed by the agricultural sector [
2]. Over the last 20 years, the per capita renewable water resources in the country decreased by 29.1% and reached 1732 m
3·y
−1 in 2014 [
1], which is well below the global average of 7000 m
3·cap
−1·y
−1. The population grew from 38.9 billion in 1980 to 74.5 billion in 2010, and is expected to further increase to 88.5 billion in 2030 [
3], which will translate into increasing food and water demands.
In addition to the physical water scarcity, Iran faces a poor management of its water resources. Major infrastructure works are developed without sufficient concern for their long-term impacts, the water governance structure is weak, water management is done based on administrative instead of watershed boundaries, there is insufficient attention to the linkage between development and environment, different government sectors fail to coordinate, and groundwater abstractions are not properly regulated [
2]. The mismanagement of water resources has resulted in the shrinking of Urmia Lake in the western part of the country, which is the largest lake in the Middle East and one of the world’s largest hypersaline lakes [
4]; the disappearance of Hamun Lake in the eastern region [
5,
6]; and the seasonally drying up of the Zayandeh Rud River, which is the backbone of development in central Iran [
7].
Agriculture is the biggest freshwater user in Iran, accounting for 92% of gross blue water abstractions [
1], and 97% of net blue water abstractions [
8]. Inefficient water management in this sector is thus a main source of the water shortage in the country. In 2004, about 68% of the total renewable water resources was withdrawn [
1]. Even though this may look sustainable at first sight, it is far from so, because a substantial percentage of the flow needs to be maintained to protect ecosystems and the livelihoods that depend on them [
9,
10,
11,
12]. Issues in agricultural policy that require critical attention are the country’s aim to achieve food self-sufficiency, the mismatch between the spatial cropping pattern and the geographic spread of water availability, the heavy reliance on irrigation, the low water use efficiency, the low share of rain-fed agriculture in total crop production, the low water and energy prices, the overdraft of aquifers, and the low income level of farmers and their associated inability to adopt better farming practices. The role of the agricultural sector in alleviating the current water scarcity in Iran also gets clear when considering the historical development of the harvested irrigated crop area. The irrigated land area grew by 117% in the period 1980–2010, while the total harvested area, including both rain-fed and irrigated lands, increased only slightly. The growth in irrigation was introduced to meet the increasing food demand of the rapidly increasing population and keep a high food self-sufficiency level. Based on the national statistics, total crop production within the country grew by 175% over the period 1980–2010. With continued population growth as predicted, food demand will keep increasing, as well as the associated water demand when sticking to the food self-sufficiency policy, which again will further aggravate the existing overexploitation of water resources in the country.
As a consequence of Iran’s focus on food self-sufficiency, the emphasis has been on increasing the water volume available for irrigation. Little attention has been paid to water use efficiency, and no attention at all has been paid to the role of consumption and trade. In order to better understand the historical development of the relation between food production, consumption, trade, and water consumption, we carried out the first comprehensive water footprint assessment (WFA) for Iran, for the period 1980–2010. In addition, we estimated the water saving per province associated with interprovincial and international crop trade. The water footprint (WF) is a spatially–temporally explicit measure of freshwater used directly or indirectly by a producer or a consumer [
13], and could facilitate the analysis of how patterns of consumption, production, and trade relate to patterns of water consumption [
14]. The WF of producing a crop comprises a consumptive component, measuring water consumption, and a degradative component, measuring water pollution. In this paper, we focus on the consumptive WF, which again includes two components: the green WF, which refers to the consumption of rainwater, and the blue WF, which refers to the consumption of irrigation water [
15]. The WF related to human consumption within a specific region will include an internal and an external component. The former refers to the amount of water consumed within the region for producing products that are consumed within the region; the latter refers to the amount of water consumed in the other regions to produce products that are imported and consumed within the considered region [
15]. The trade of food between regions implies a virtual water (VW) flow, which refers to the water consumed in the region of the food origin.
This is the first comprehensive research on the water footprint and virtual water trade for Iran, whereby we also assess the added value of the water footprint assessment for informing Iran’s food and water security policy. The main focus in this paper is water use and scarcity, which means that we do not consider other economic, social, and environmental factors that are relevant in policy making, such as labour and land prices, the competitive advantages of different provinces for certain crops, employment, soil degradation, water quality deterioration, and climate change.
2. Results
2.1. Harvested Area and Crop Production
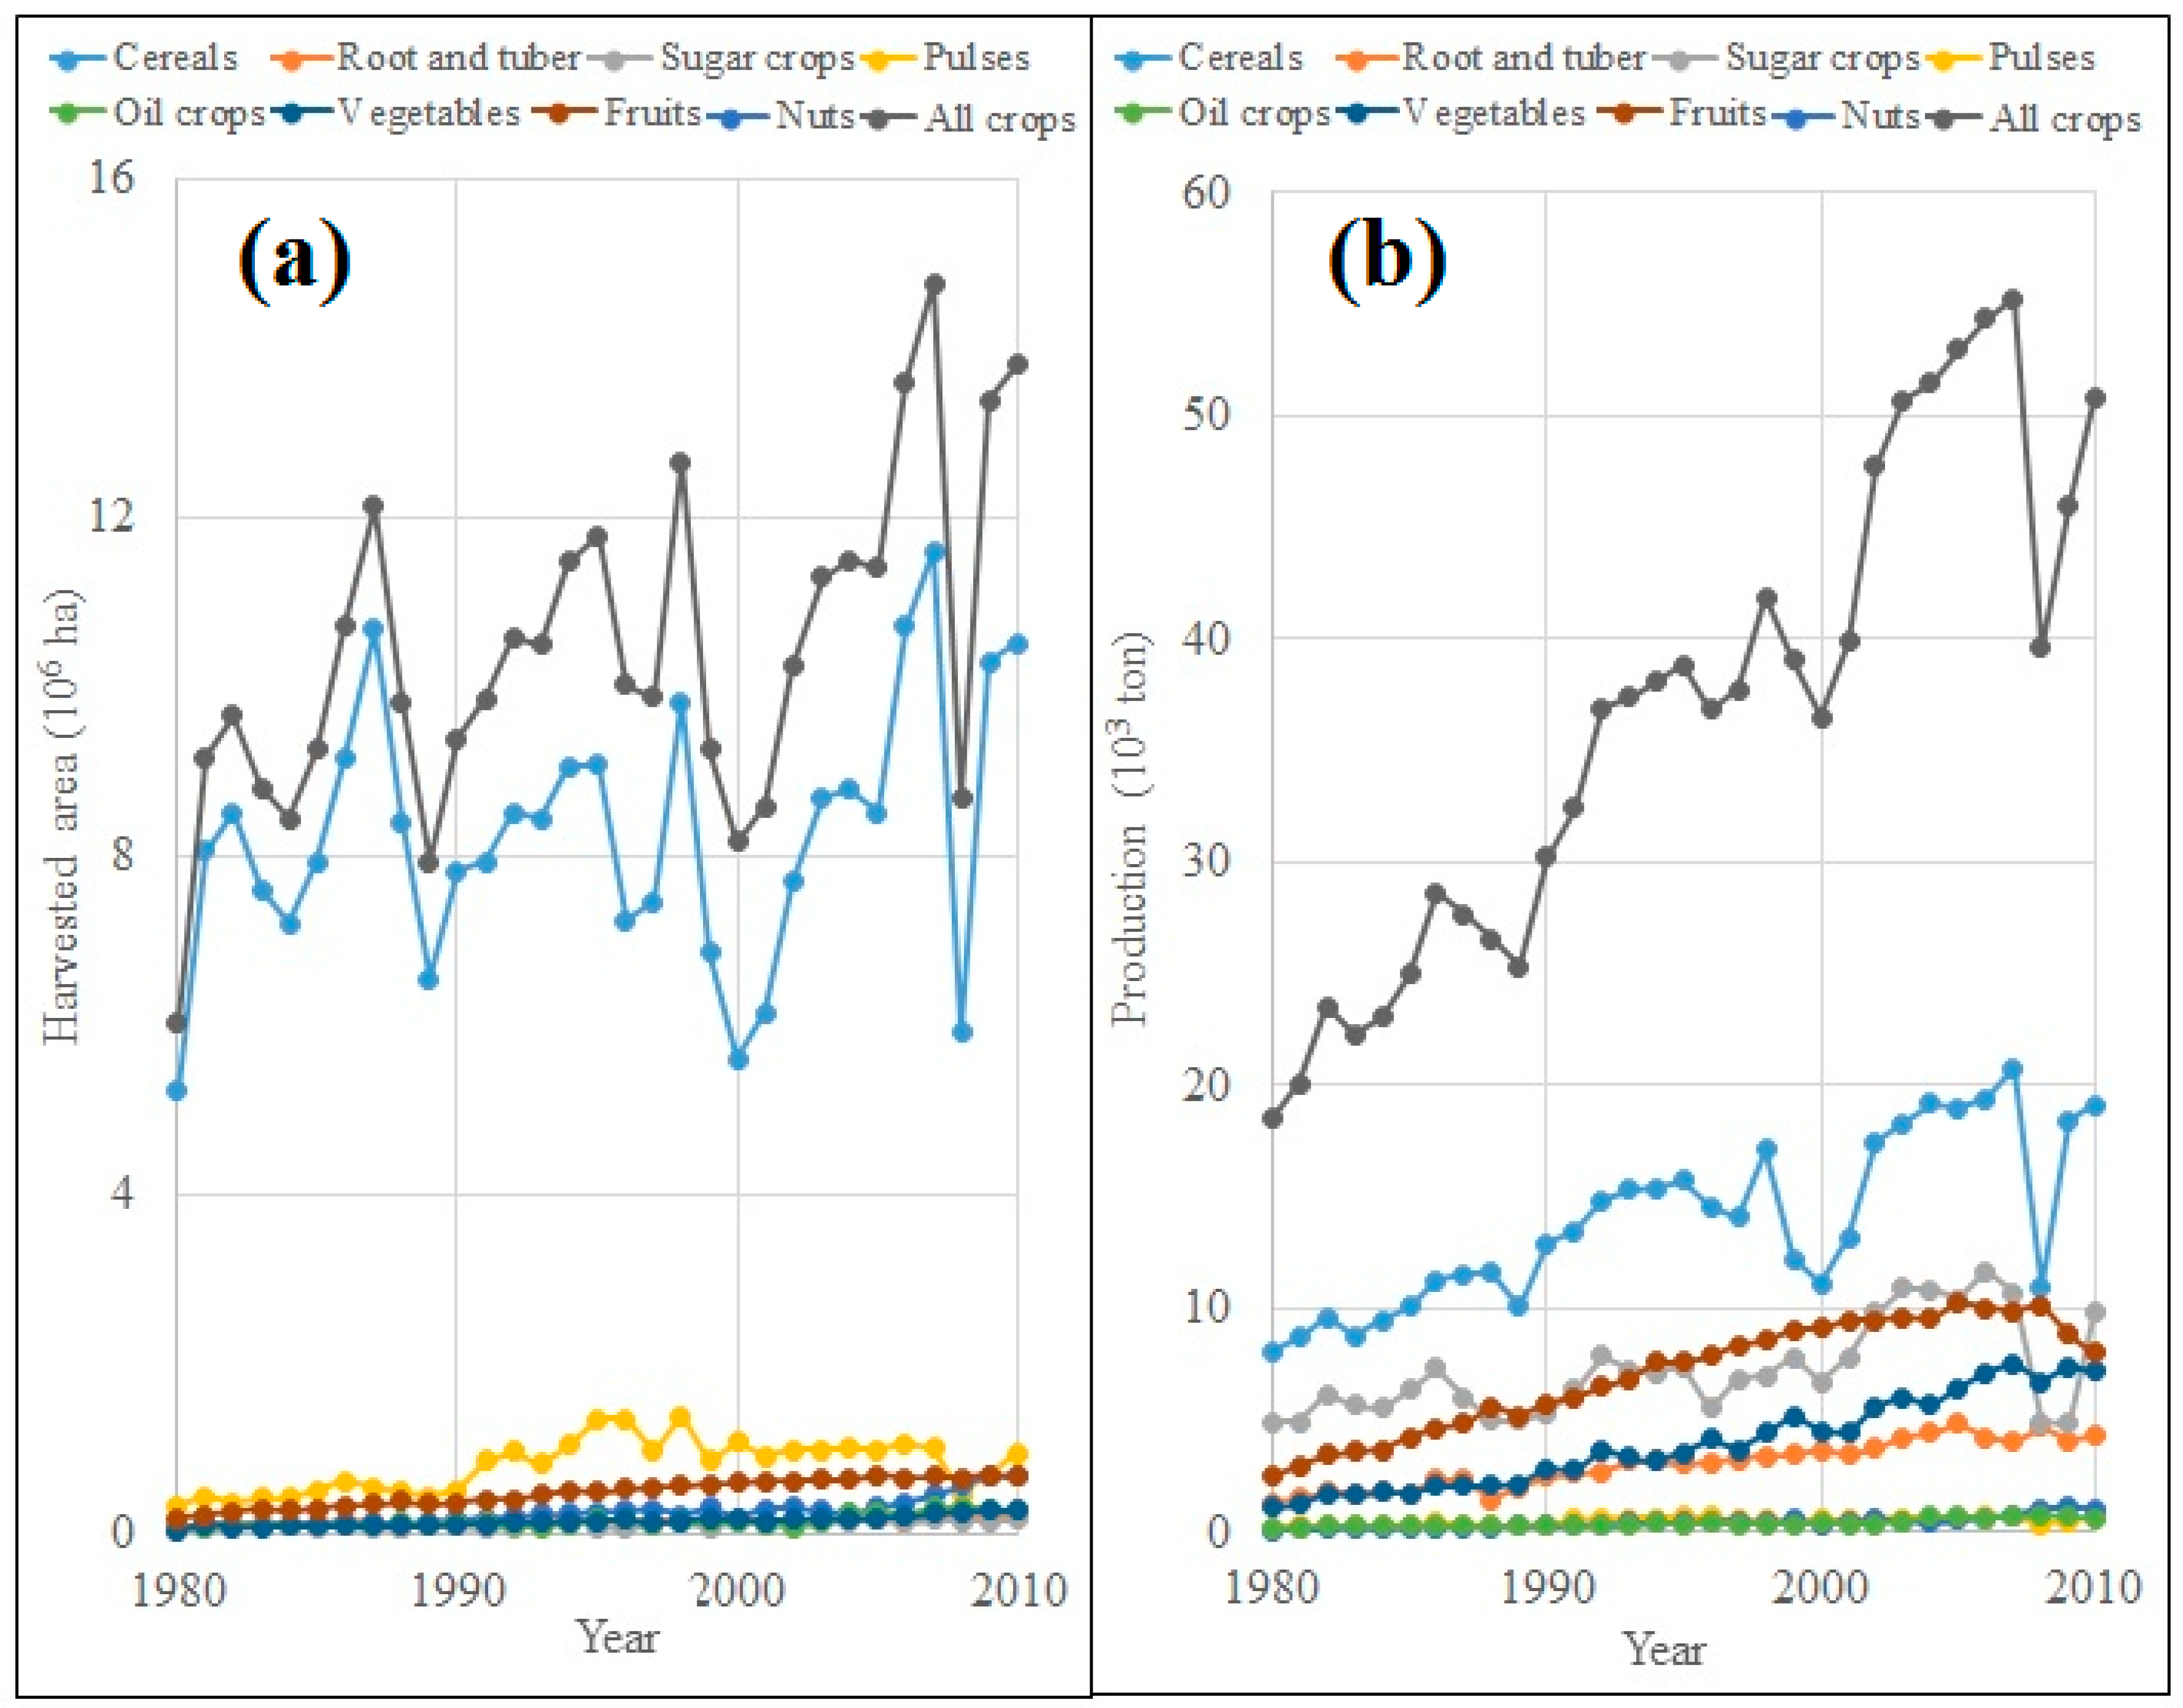
Over the period 1980–2010, the population in Iran grew by 91.5%, but the total harvested area (HA) for the eight crop categories increased by 129%, and total crop production (CP) by 175% (
Figure 2). CP grew faster than HA because crop yields increased (by 20% as a weighted average over all crops). Increased crop yields could be attributed to improved field management practices over the period, including better irrigation and soil management practices, and a higher application rates of fertilizers. The percentage of HA irrigated reduced slightly, from 57% in 1980 to 54% in 2010 (with the most pronounced decrease for cereals, but an increase for oil crops). Even though the irrigated percentage in HA decreased, irrigated HA in absolute terms increased by 117%, which aggravated the pressure on the available blue water resources.
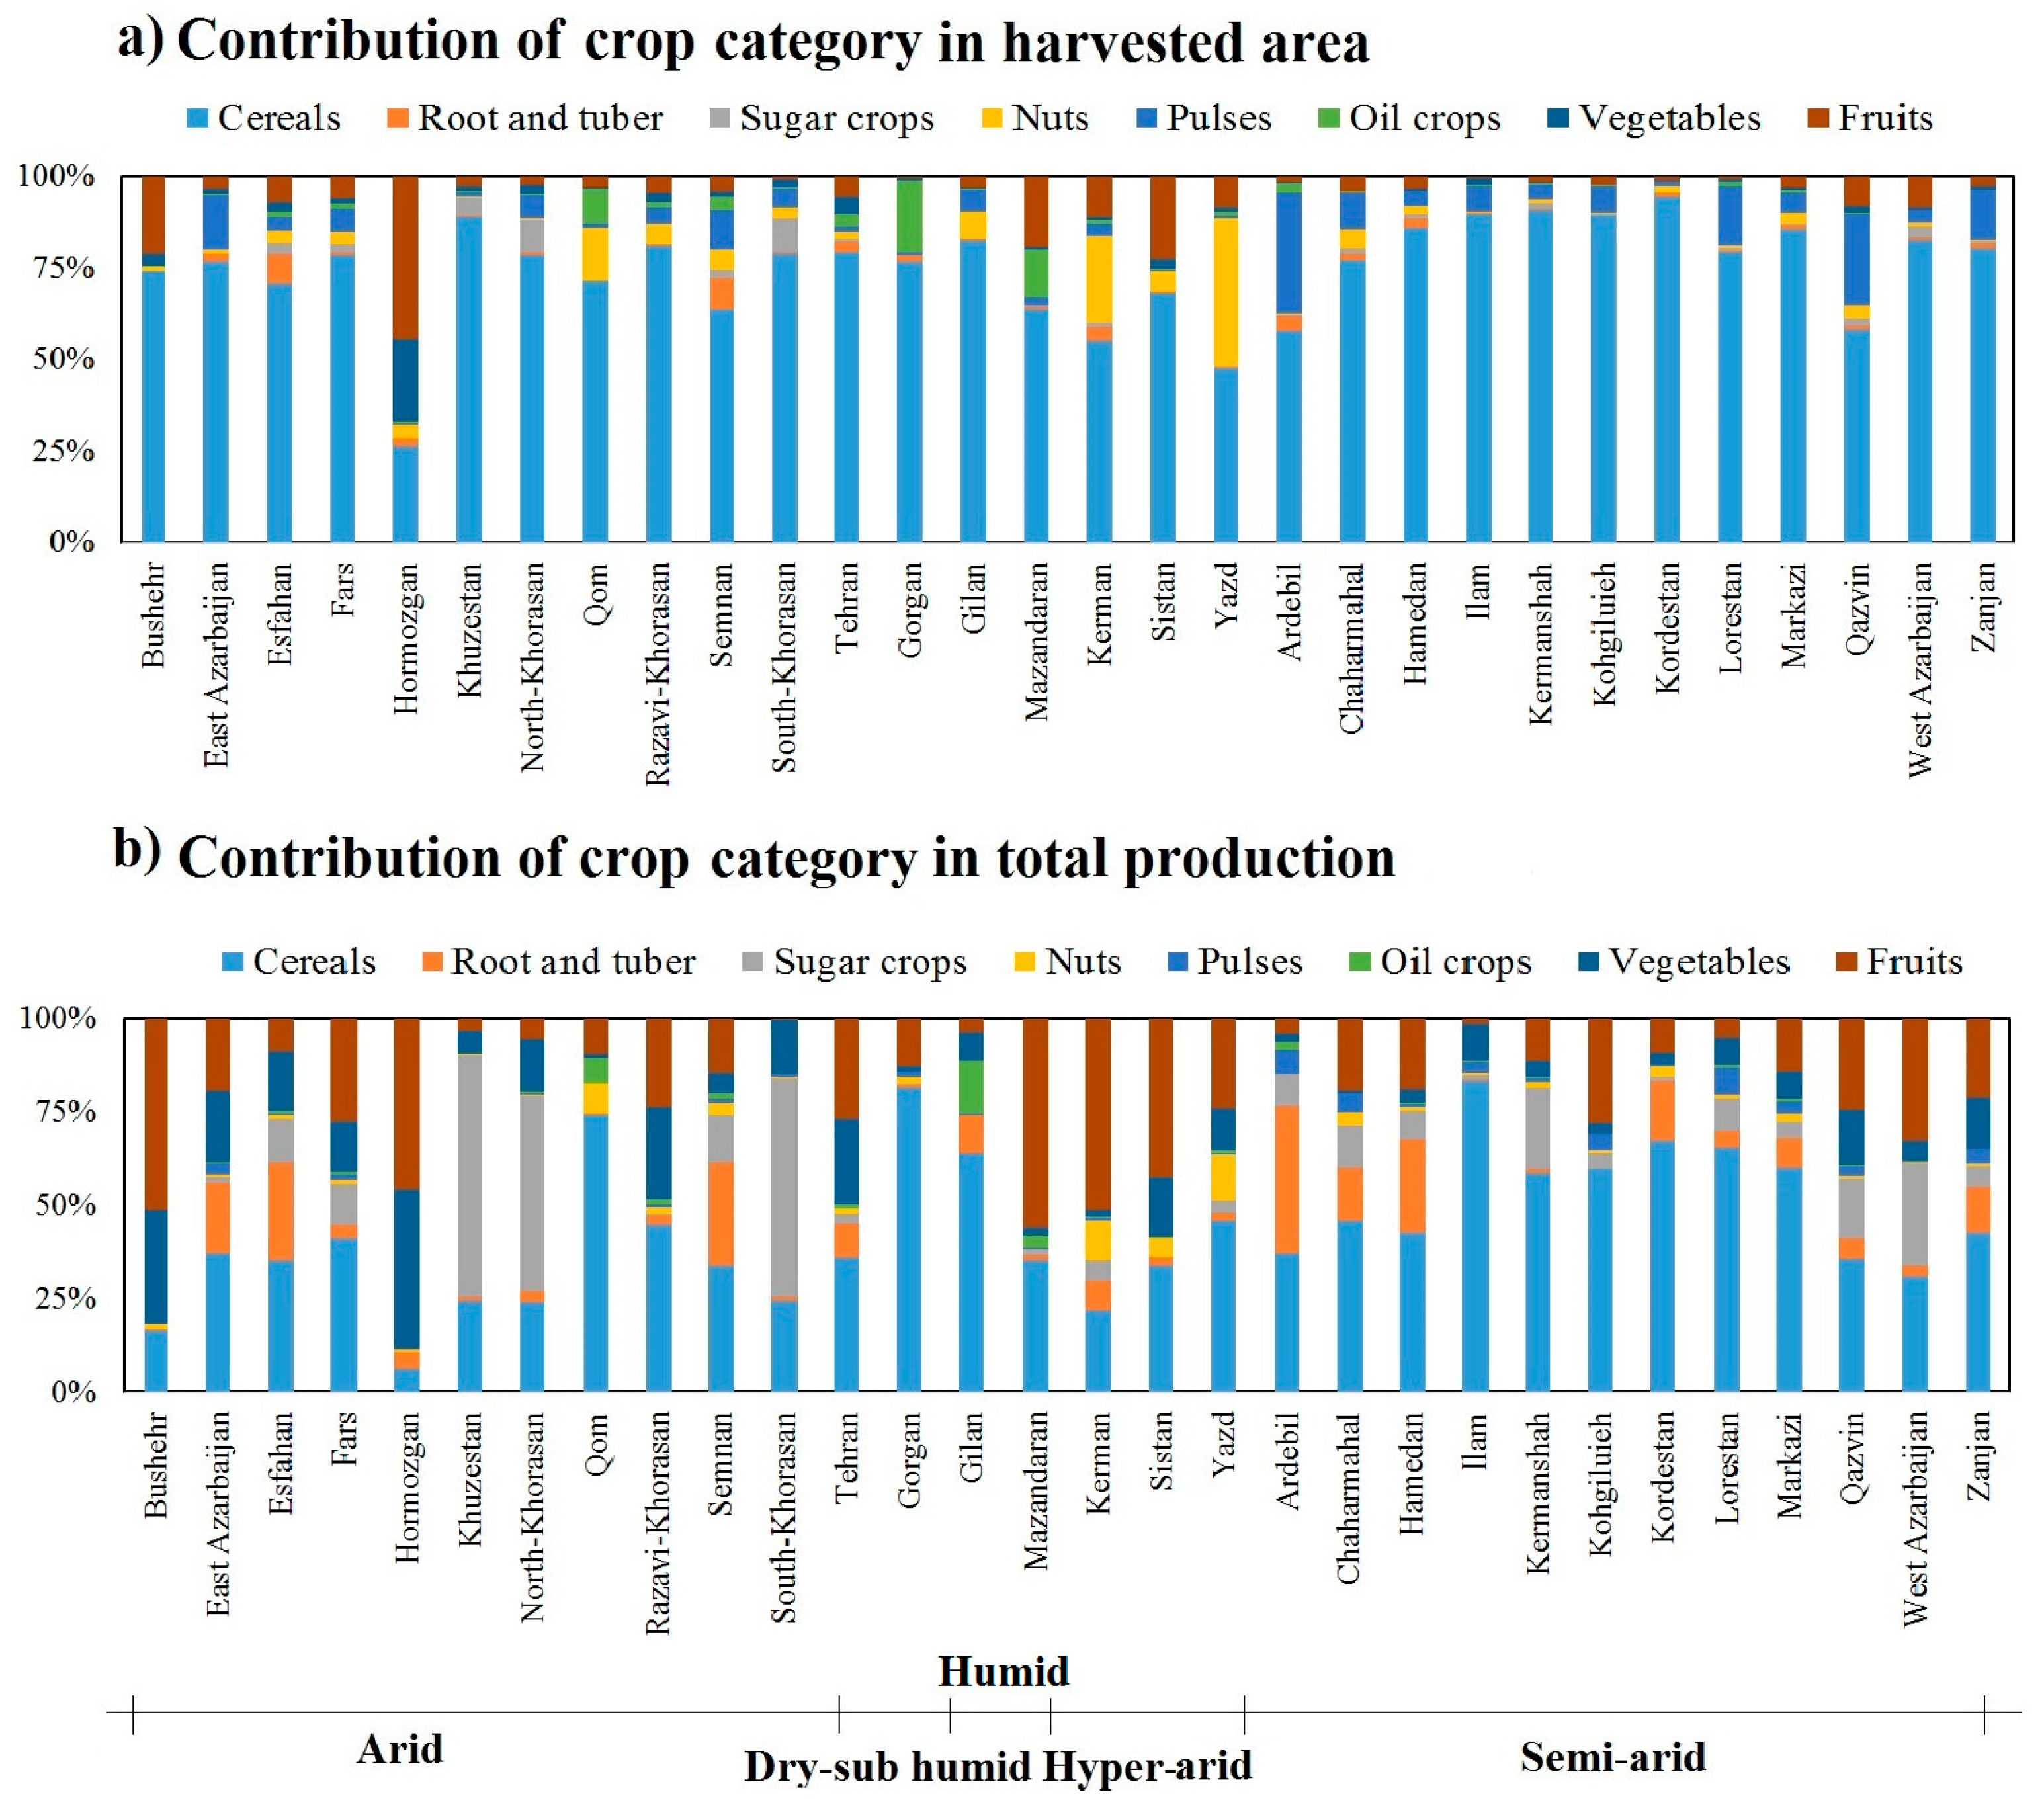
Figure 3 shows the contribution of the different crop categories to HA and CP, per province, as averages over the period 1980–2010. At the national level, cereals were the main crop category over the whole period, but its importance decreased. The contribution of cereals to total HA reduced from 87% in 1980 to 76% in 2010 (with an average of 79% over the period), while the cereal contribution in CP reduced from 44 to 38% (with an average of 39% over the period). Regarding CP at the national level, sugar crops and fruits ranked next to cereals over the whole period, with an average share over the period of 20% and 19%, respectively (but with an overall contribution of 1% and 4.7% to HA, respectively). Regarding HA at the national level, pulses ranked next to cereals over the whole period, with an average share over the period of 7.6% (and an overall contribution of 1.4% to CP). The quickest growth in both HA and CP over the period 1980–2010 was for nuts.
At the national level, the highest crop yields were observed for sugar crops (28 tonne/ha on average), followed by vegetables (27 tonne/ha) and roots and tubers (21 tonne/ha), while the lowest yields were found for nuts (1.8 tonne/ha), cereals (1.7 tonne/ha), and pulses (0.6 tonne/ha). Although cropping patterns are different across provinces, cereals usually dominate HA. Only in the arid province of Hormozgan do fruits take up most of the HA.
2.2. WF of Crop Production
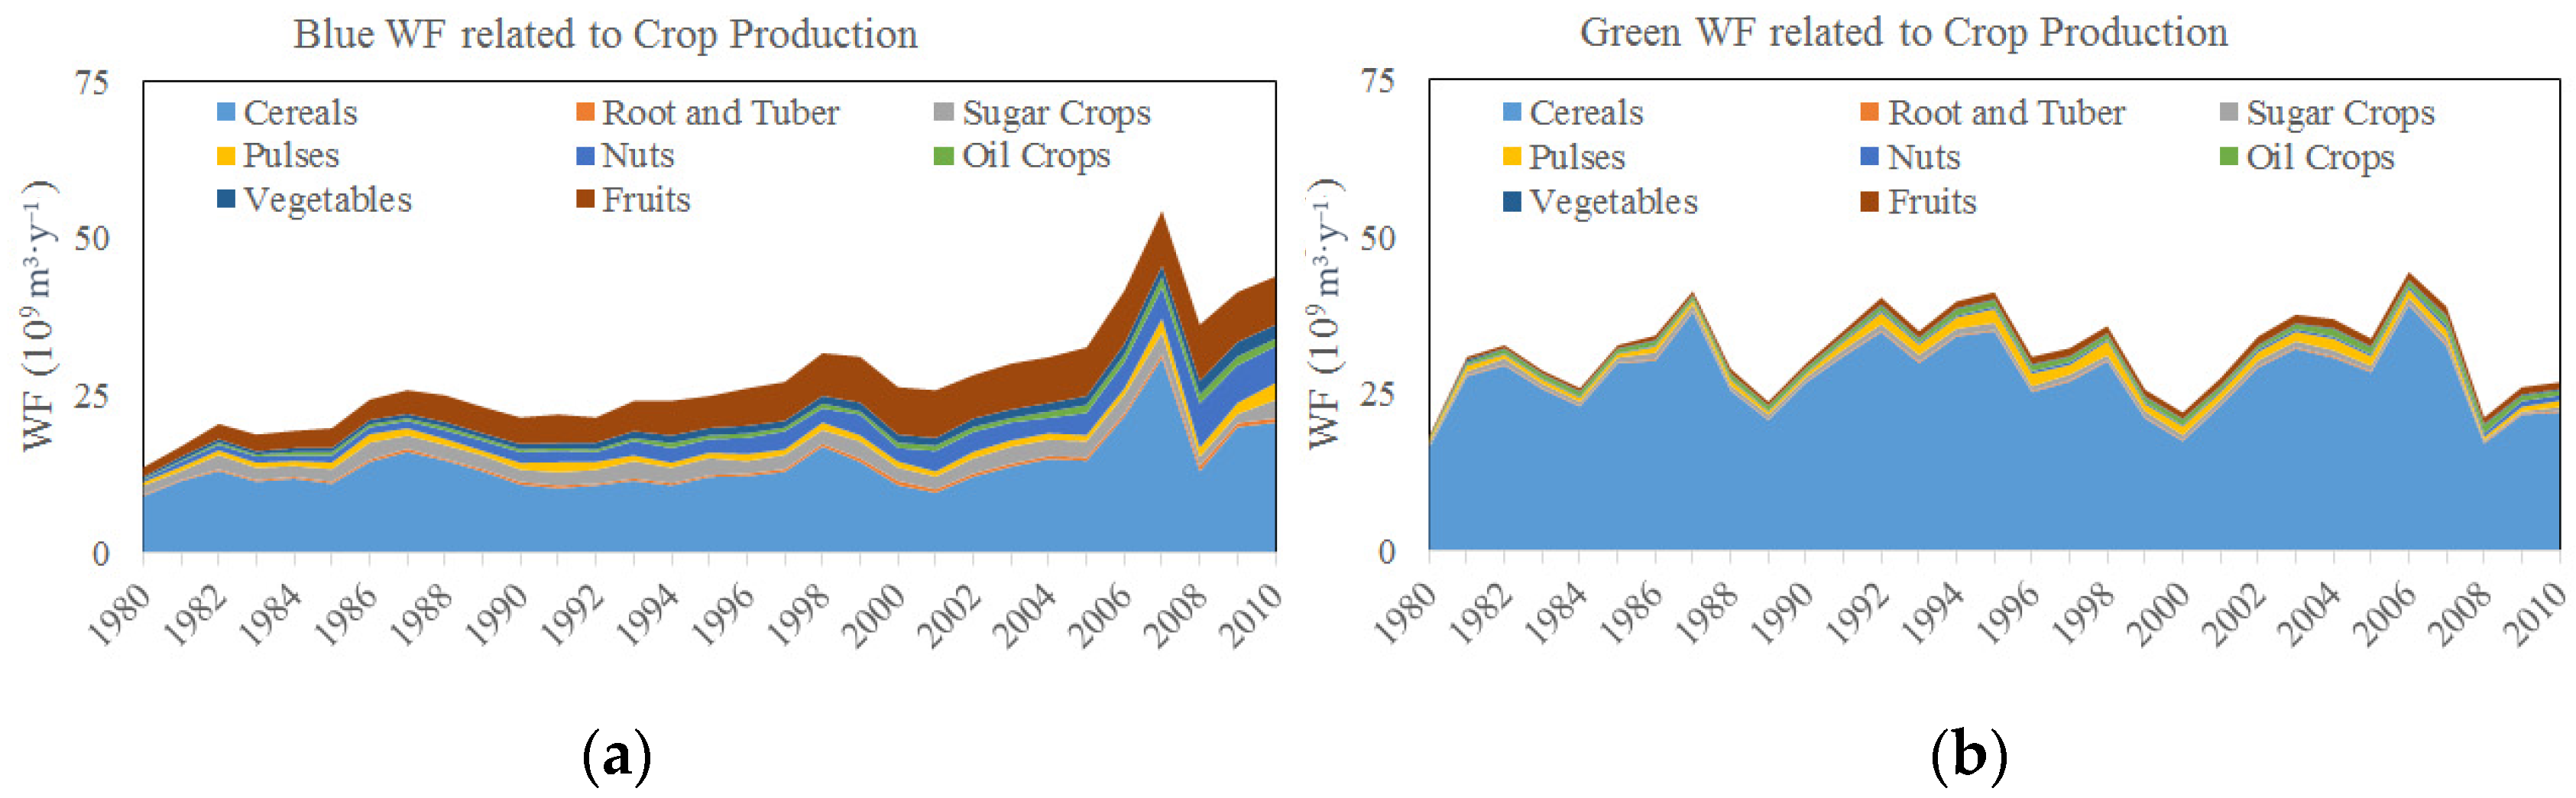
The 175% growth in crop production over the period 1980–2010 led to a 122% increase in total WF, from 31.9 × 10
9 m
3·y
−1 in 1980 (42.5% blue) to 70.8 × 10
9 m
3·y
−1 in 2010 (62.1% blue) (
Figure 4). The growth in total WF at the national level holds for all crop categories. For cereals and sugar crops, the total WF in the country increased, despite the fact that the national average WF per tonne for cereals and sugar crops decreased by 29% and 18%, respectively (
Table 1), which was mainly due to the increase in crops yields. The national average WF per tonne for oil crops, pulses, nuts, vegetables, roots and tubers, and fruits increased by 14%, 17%, 18%, 23%, 23% and 50%, respectively. The considerable increase in the WF per tonne for fruits was partly due to a national average reduction of 10% in fruit yield.
Table 1 shows that WFs per tonne differ across climatic regions. In general, WFs per tonne are significantly higher in the hyper-arid, arid, and semi-arid regions compared with the dry sub-humid and humid regions. When considering a specific crop category in a specific region, many of the differences between 1980 and 2010 are due to changes in what were the dominant crops per crop category; for instance, rice replaced wheat as the dominant cereal crop in the dry sub-humid region. Differences were also due to changes in the fractions of the land irrigated (for instance, a 420% increase in the irrigated HA in a dry sub-humid region), in changes in yields (for instance, 23%, 12%, and 6.5% reductions in crop yield in semi-arid, arid, and humid regions, respectively), and in changes in climate (as demonstrated by Karandish et al. [
16]).
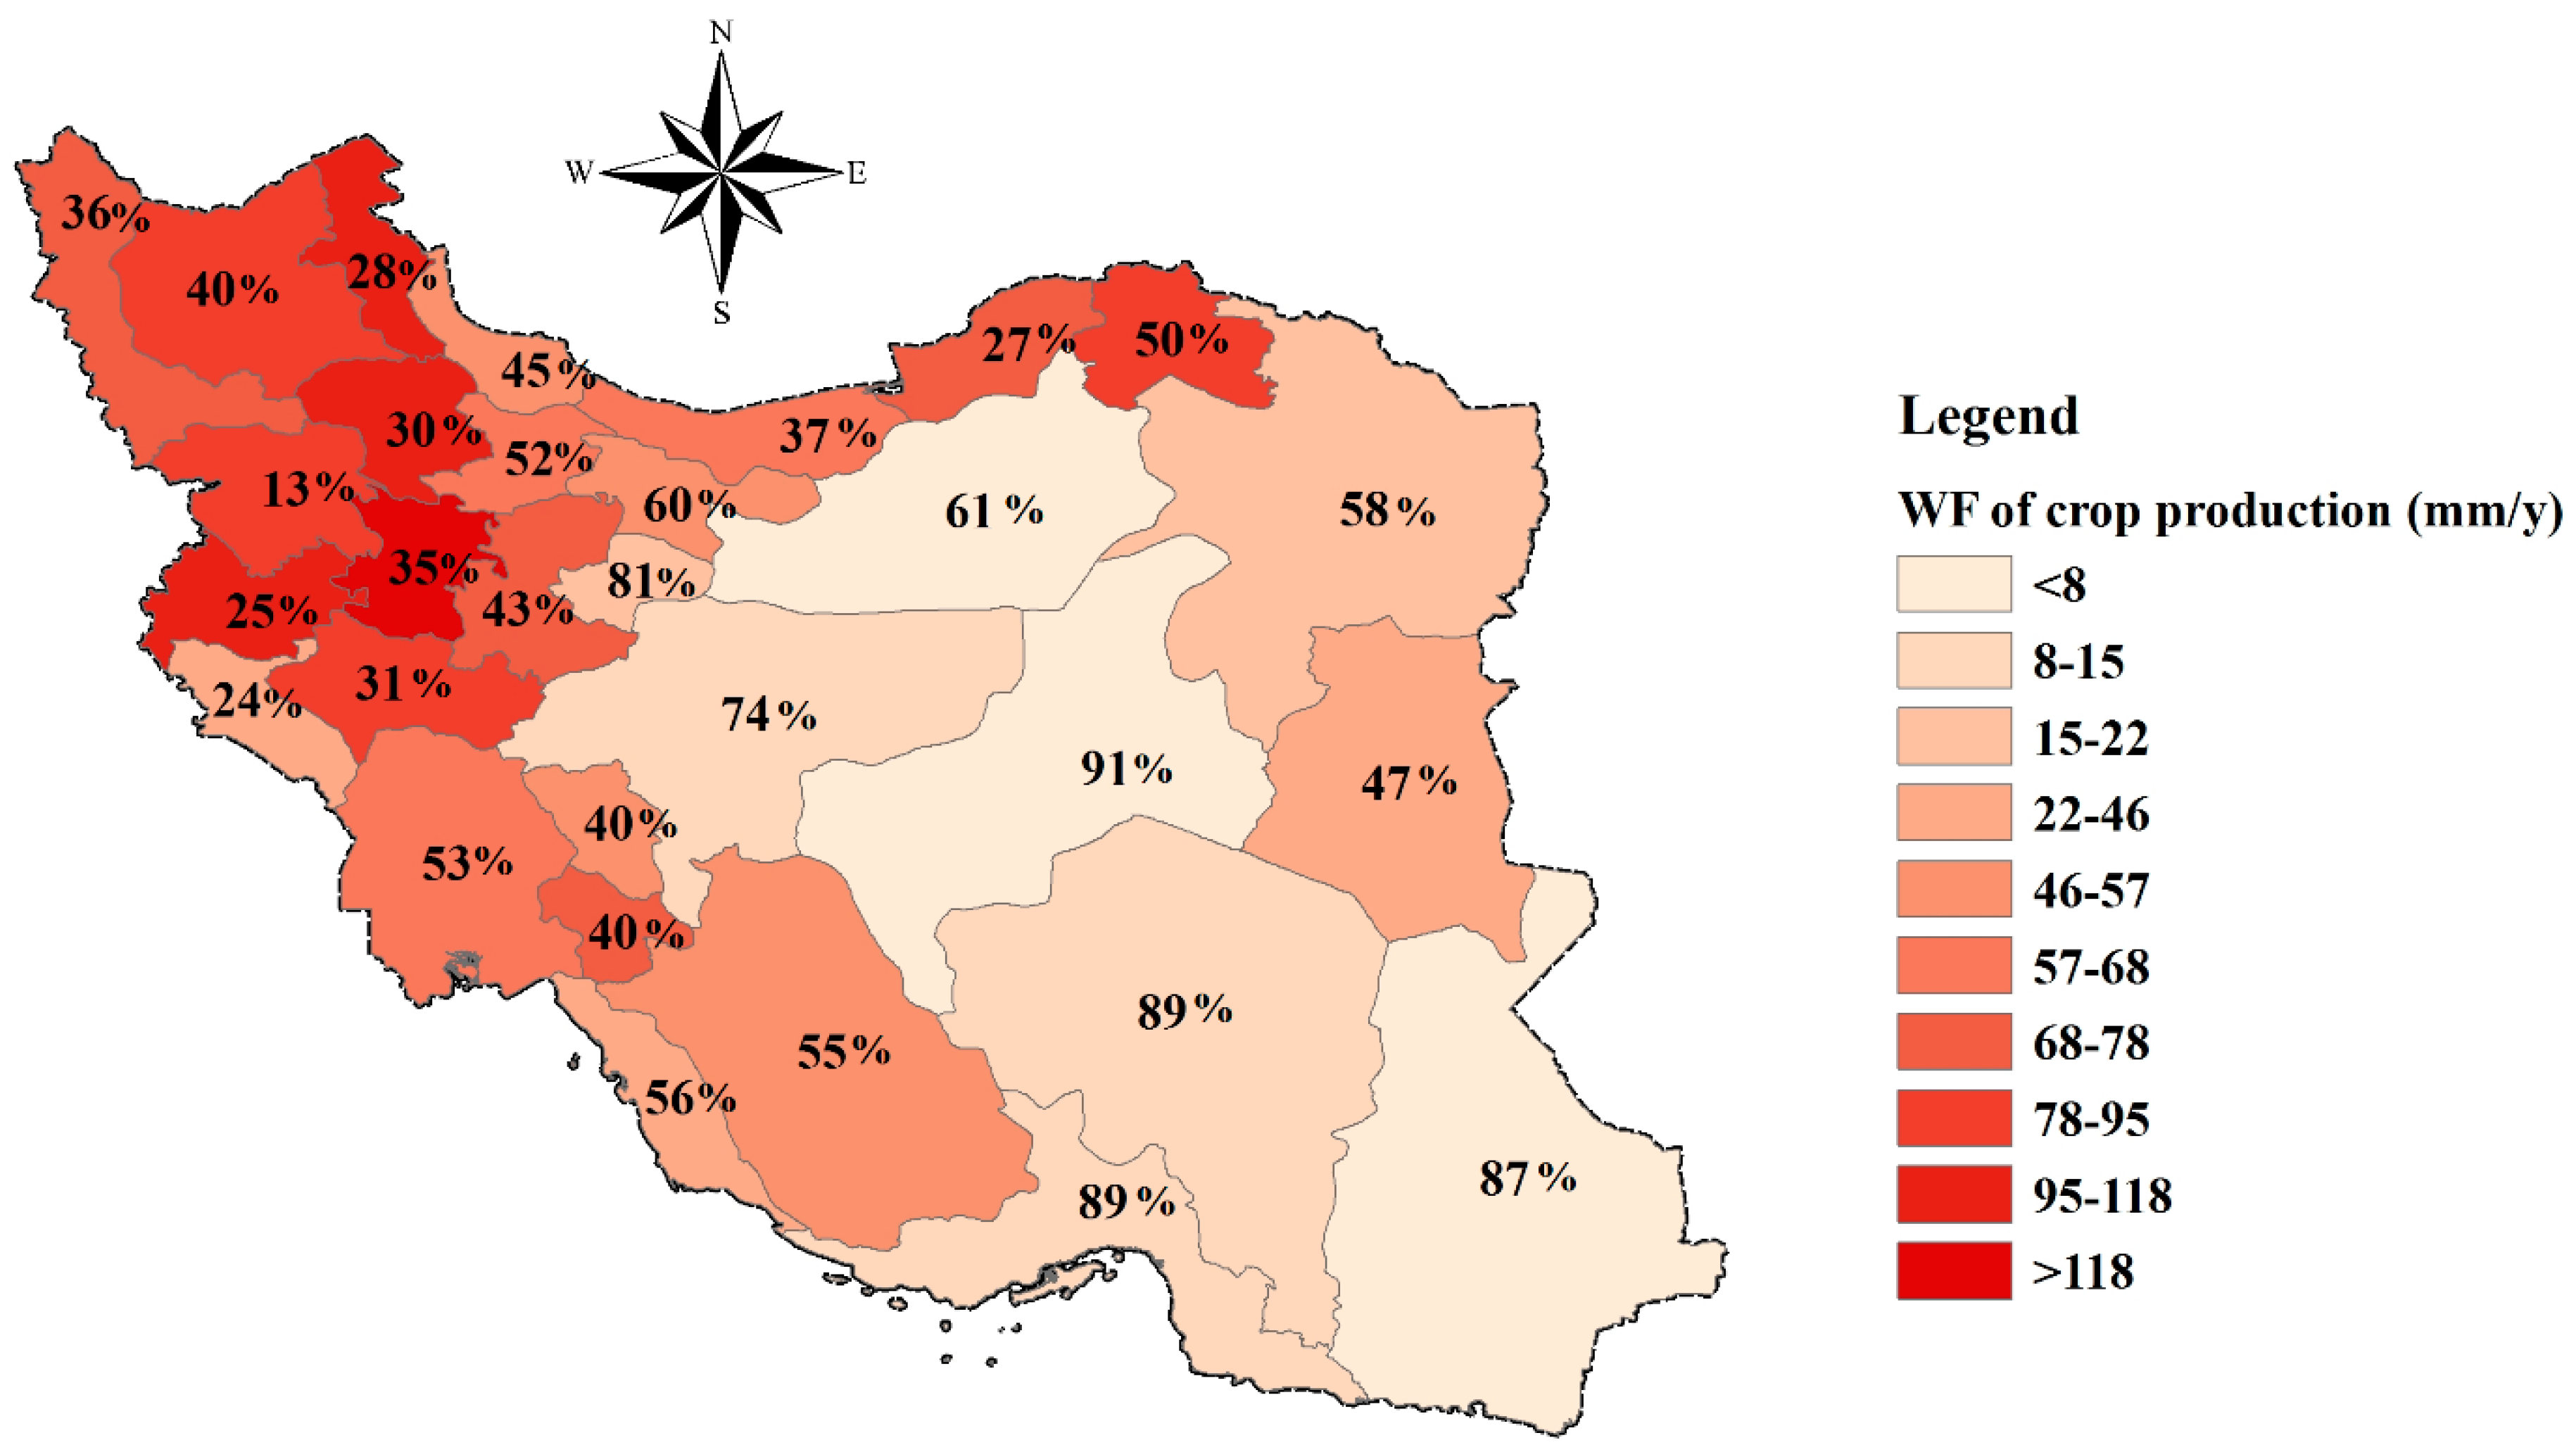
The spatial distribution of the 30-year average total WF of crop production and the blue fraction in the total is shown in
Figure 5. The highest WFs, when measured as the total WF in a province divided by the area of the province (expressed in mm·y
−1), are found in the semi-arid climatic region, because this region has the highest cropland density, while water consumption per unit of cultivated land is also high (at least relative to the humid and dry sub-humid regions). The largest shares of blue WF in the total are found in the provinces where irrigated agriculture dominates over rain-fed agriculture, which is obviously particularly the case in the hyper-arid region, where 93% of the harvested land was irrigated (as an average over 1980–2010).
The 30-year total WF (m
3·y
−1) of crop production, per province, is summarized in
Table 2. The provinces located in the arid and semi-arid regions, the water-scarce regions of the country, are responsible for 87% of the total WF of Iranian crop production of 59.6 billion m
3·y
−1. The hyper-arid region ranked next to arid and semi-arid regions, with a contribution of 6.5% to the national WF of crop production over the period.
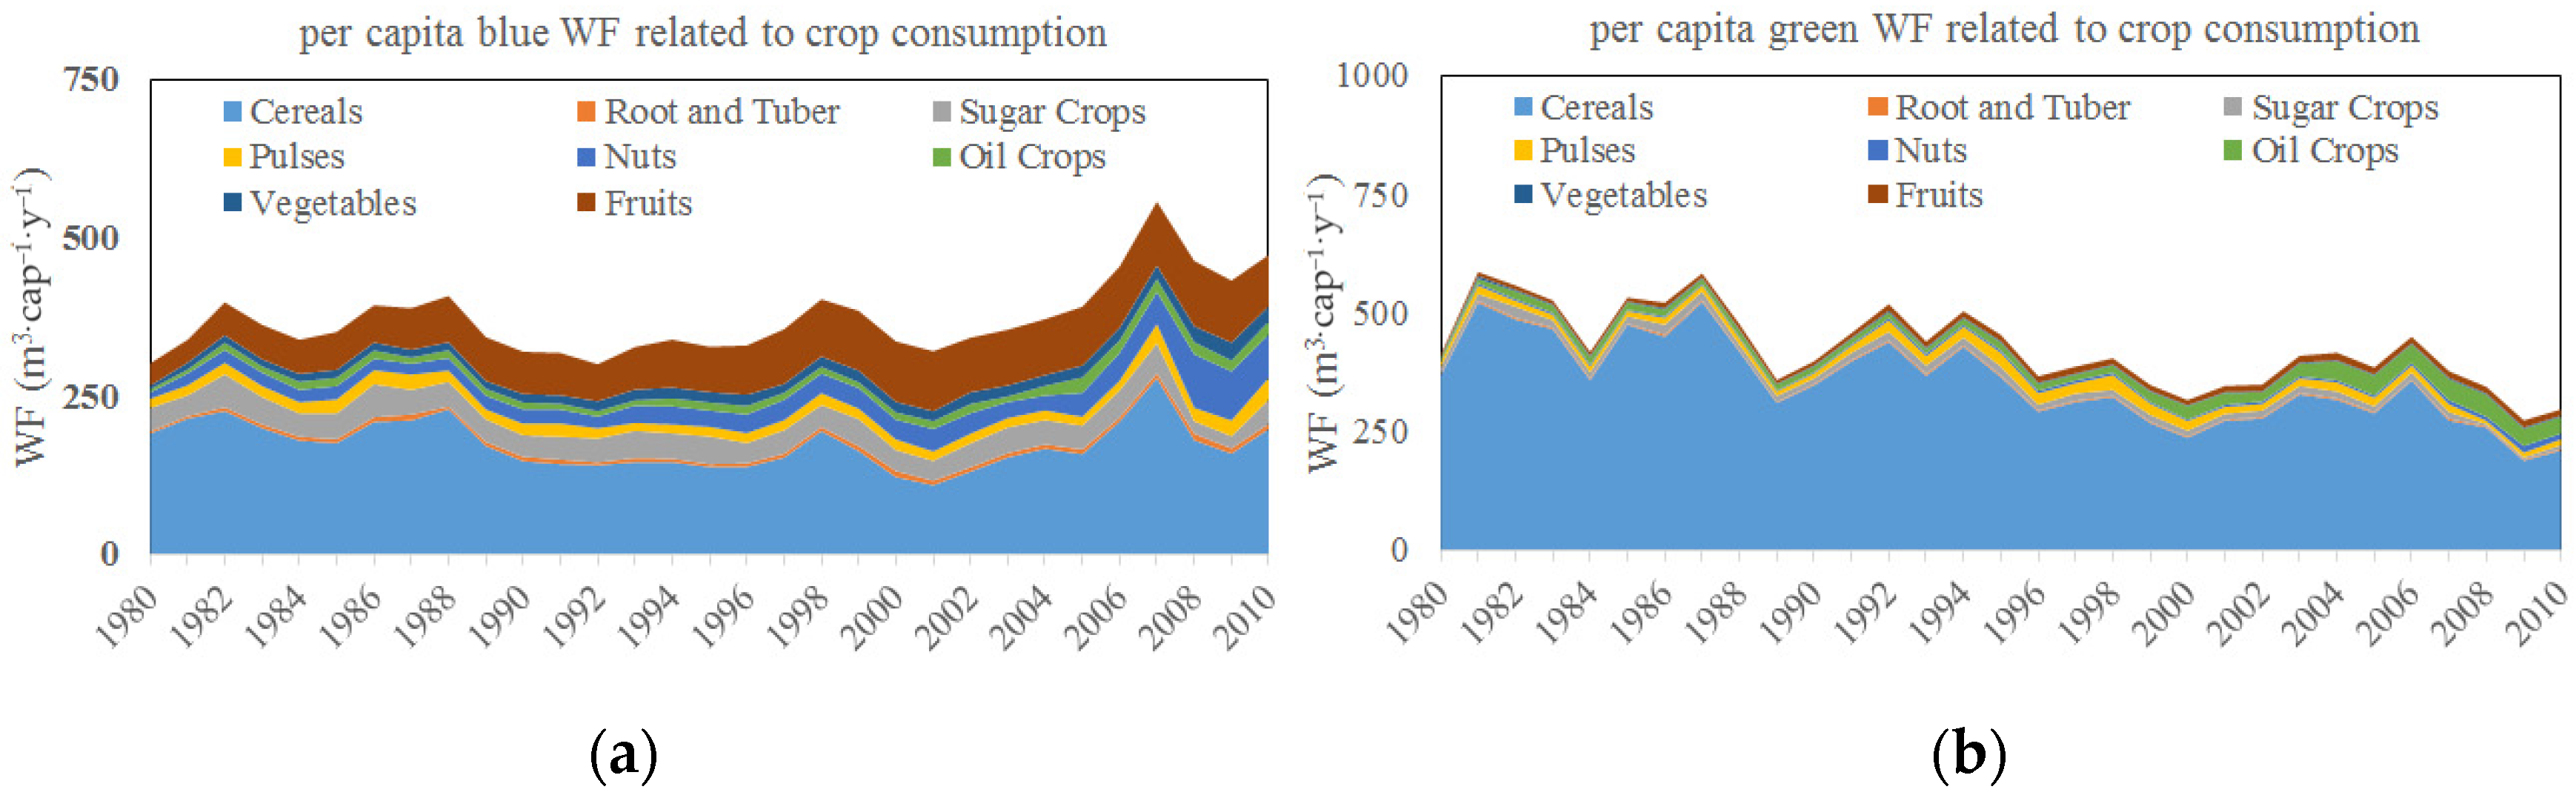
2.3. WF of Crop Consumption
The Iranian crop consumption per capita (considering the 26 crops studied) increased by 20% in the period 1980–2010, from 460 to 552 kg·cap
−1·y
−1. Given the 92% population growth over this period, total crop consumption (again considering the 26 crops studied) increased by 130%, from 17.9 to 23.7 million t·y
−1. The total WF of crop consumption increased by 110%, from 27.7 × 10
9 m
3·y
−1 in 1980 to 57.3 × 10
9 m
3·y
−1 in 2010 (
Table 3). The blue water fraction increased from 42% to 62% (
Figure 6). The increasing WF of consumption per capita is the net result of the growing consumption volume per capita, the changed diet composition, and changes in the WFs per tonne of crop (a decrease for cereals and sugar crops, and an increase for the other crop categories). The contribution of different crops to the WF of consumption considerably changed over the study period. The contribution of cereals to the total WF of crop consumption decreased from 78% in 1980 to 53% in 2010. The contribution of sugar crops decreased as well, from 7.6% to 6.1%. The contributions of all of the other crop categories to the WF of consumption increased. Growing from 1.7% in 1980 to 11% in 2010, the share of the WF related to the consumption of nuts showed the highest increase, followed by oil crops (from 1.7% in 1980 to 7.1% in 2010) and fruits (from 5.8% to 12%), mainly due to the increased proportion of these crops in Iranian consumption and/or increase in WF per tonne of crops in some climatic regions (
Table 1).
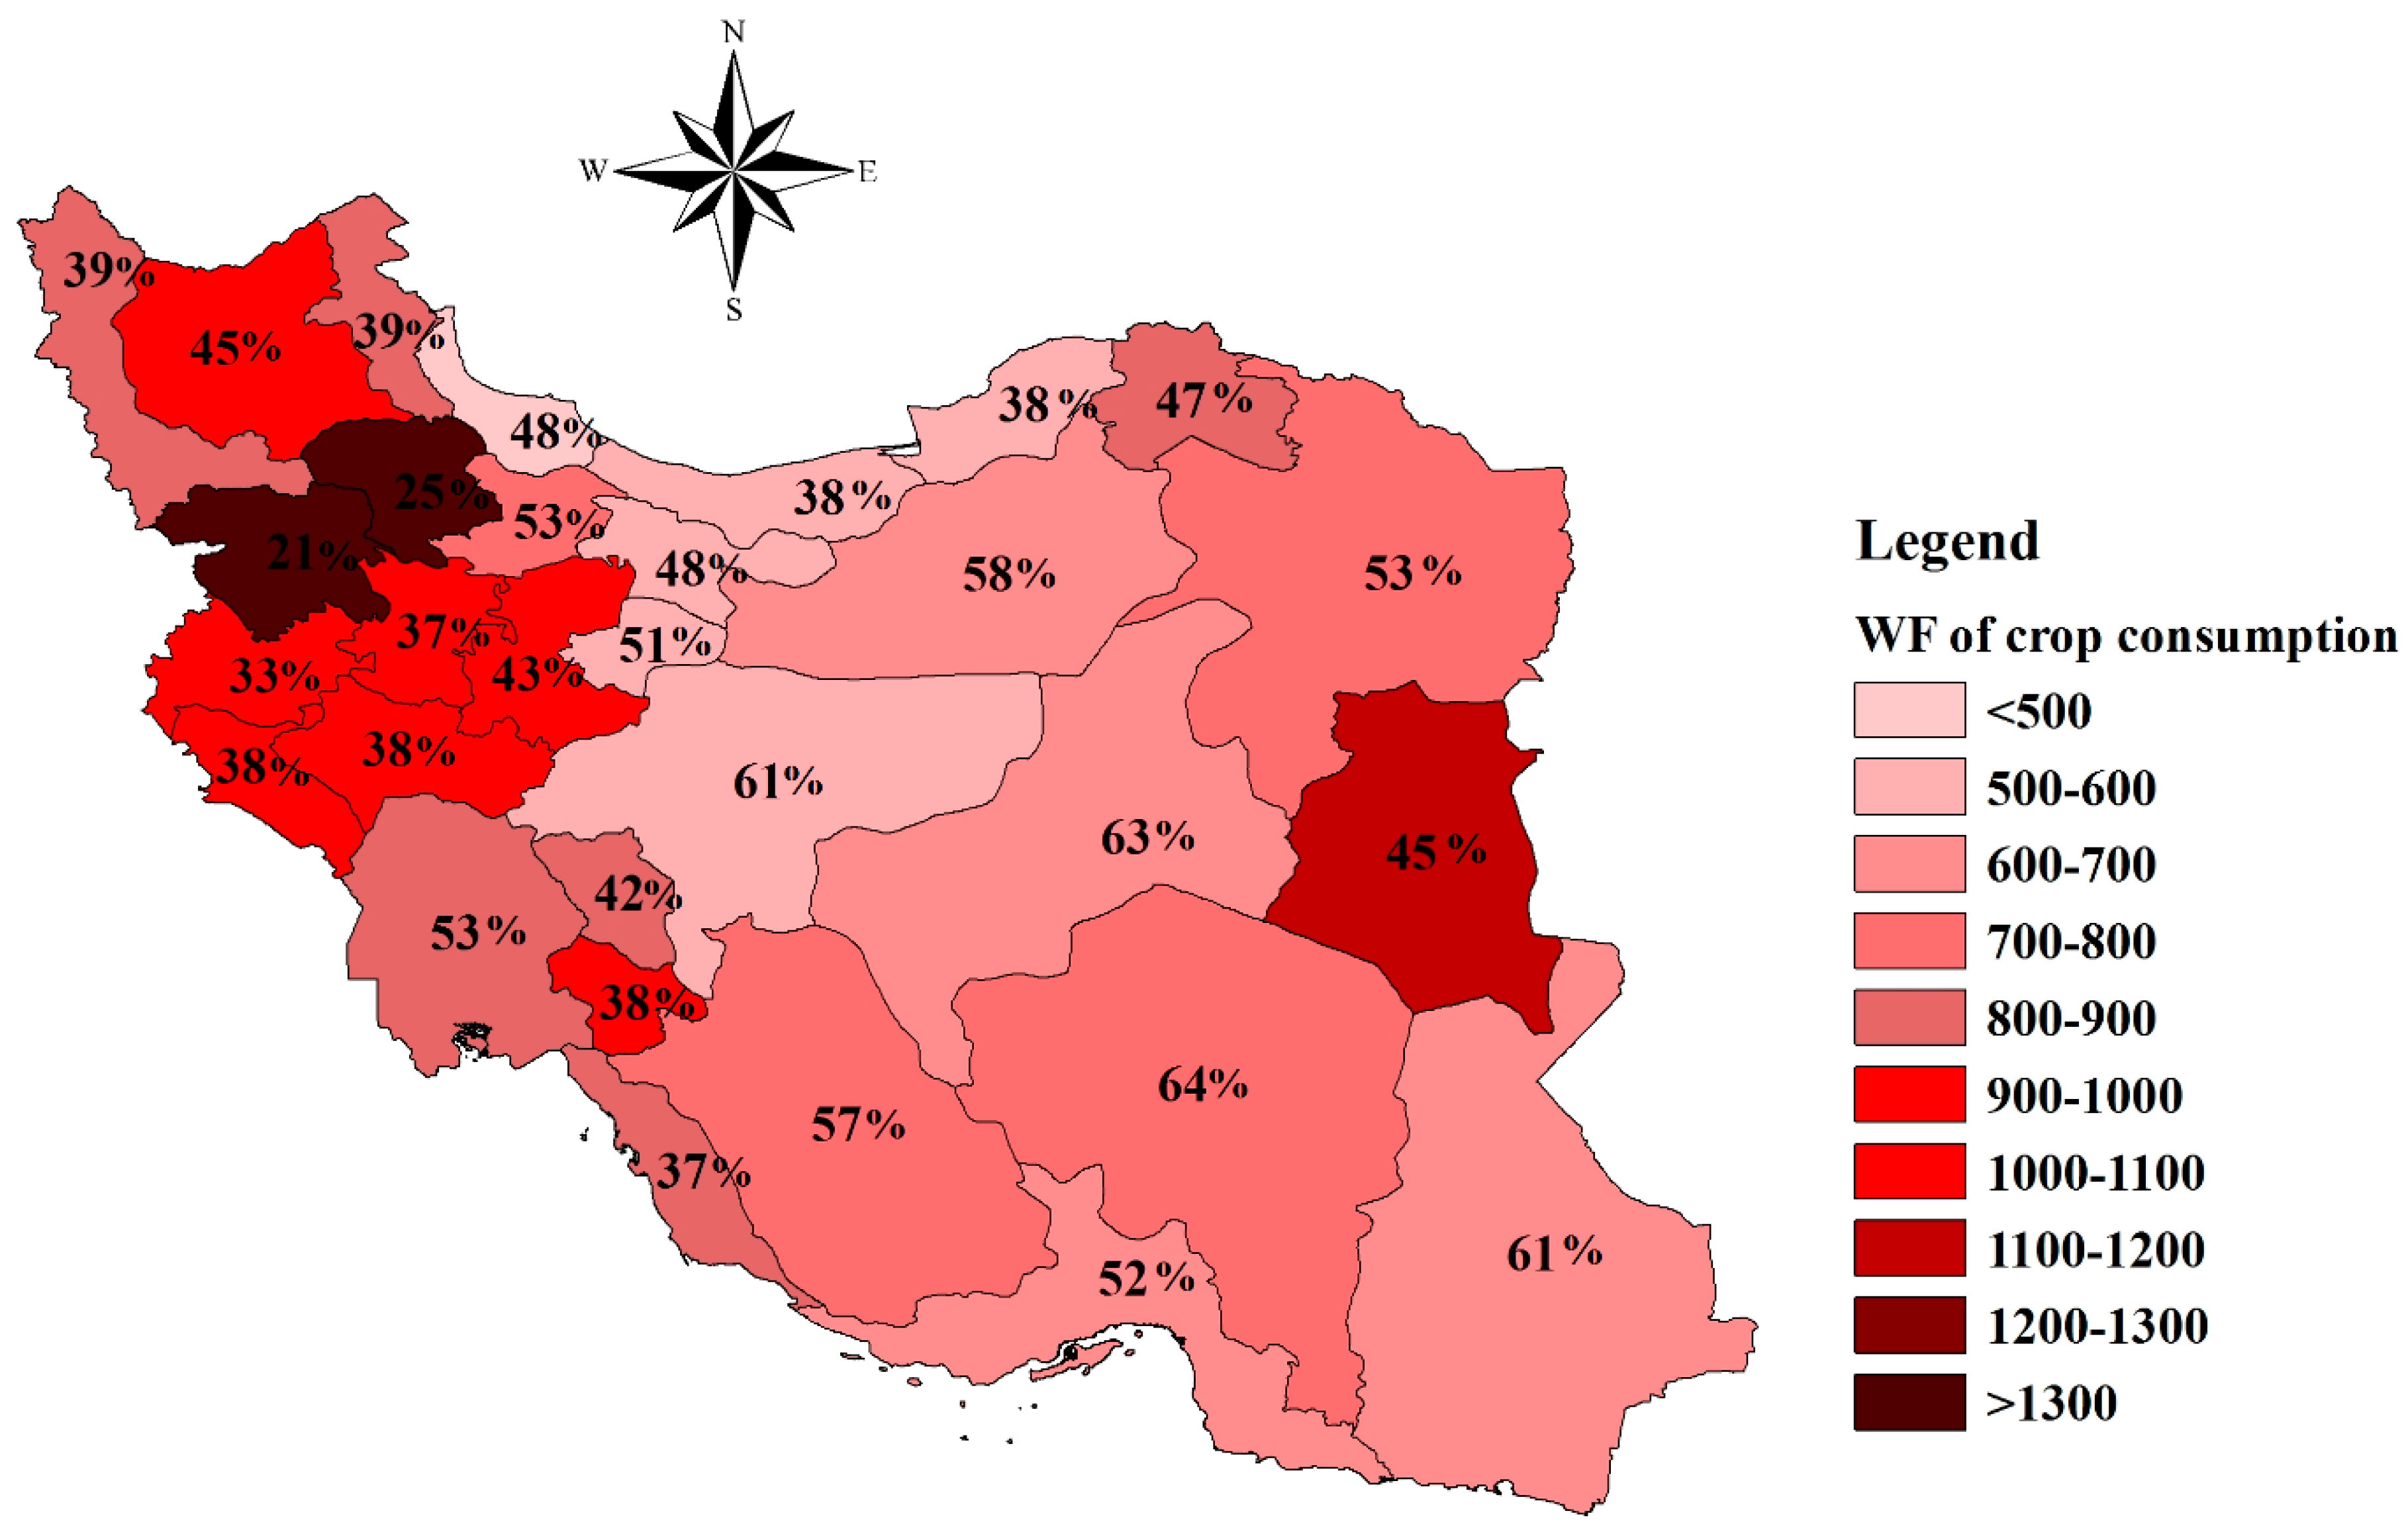
The WF of consumption per capita varies across the provinces and climatic regions (
Figure 7 and
Table 4) as a result of provincial differences in the WF per tonne of crop (
Table 1). The 30-year average WF of consumption per capita varies across provinces, in the range of 212–1061 m
3·cap
−1·y
−1 for cereals (10–54% blue), 7–14 m
3·cap
−1·y
−1 for roots and tubers (17–80% blue), 31–67 m
3·cap
−1·y
−1 for sugar crops (61–80% blue), 19–83 m
3·cap
−1·y
−1 for nuts (51–96% blue), 25–51 m
3·cap
−1·y
−1 for pulses (31–78% blue), 30–52 m
3·cap
−1·y
−1 for oil crops (11–54% blue), 14–26 m
3·cap
−1·y
−1 for vegetables (73–93% blue), and 76–124 m
3·cap
−1·y
−1 for fruits (77–98% blue). The largest WFs of crop consumption per capita are mainly found in the provinces located in the hyper-arid and semi-arid regions, followed by those located in the arid region.
The hyper-arid region, in which crops usually have the largest WF per tonne, had the highest population growth (2.4-fold over 1980–2010), followed by the arid region (2.0-fold). The humid region, which had the smallest WF per tonne of crops, also had the lowest population growth (1.6-fold).
2.4. Crop and Virtual Water Trade
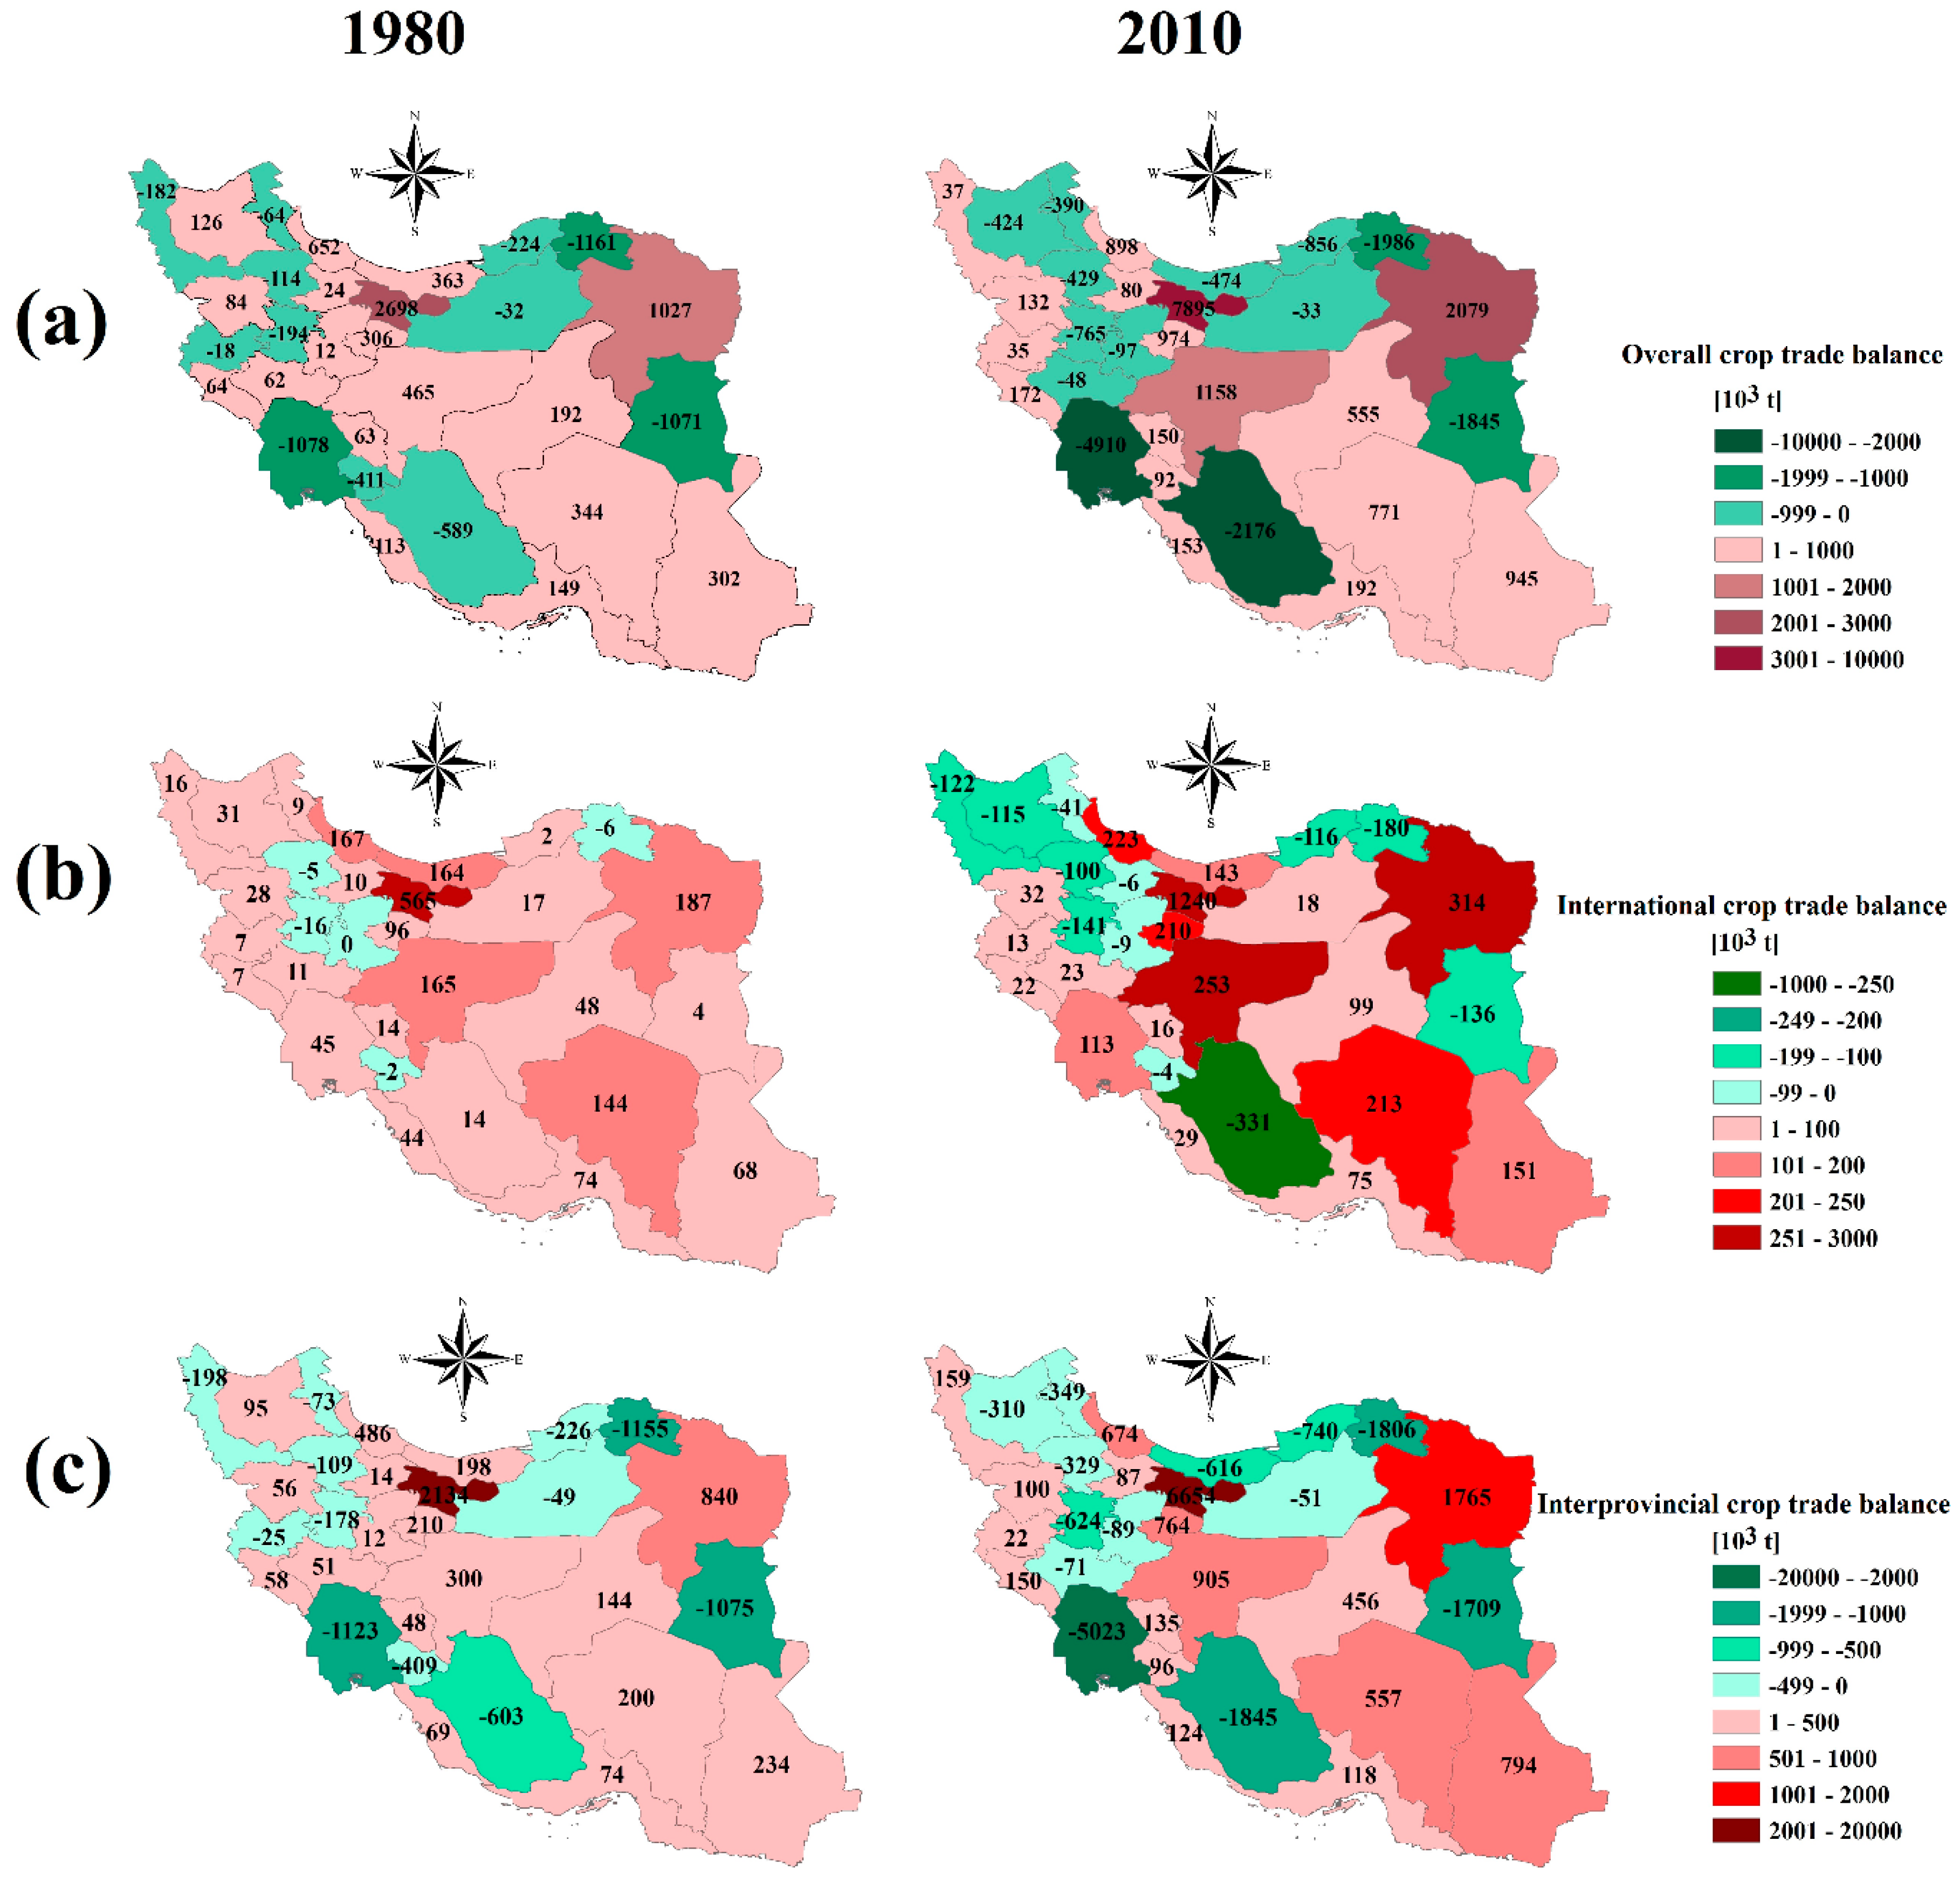
Crop trade balance per province. While Iran on the whole was a net crop importer over the whole period of 1980–2010, most provinces in the semi-arid and dry-sub humid regions were net crop exporters, due to a large export of cereals to other provinces (
Figure 8). Mazandaran province in the humid region was the largest rice-producing province in the country throughout the period. However, upon considering all crops and the whole humid region—which consists of Mazandaran and Gilan provinces—we observe that the region was a crop importer throughout the period. The provinces in the hyper-arid region, which includes Sistan-Baluchestan, Kerman and Yazd provinces, were always the largest net crop-importing provinces, with the crop trade balance (CTB) of the region as a whole increasing from 0.84 million tonnes in 1980 to 2.27 million tonnes in 2010. However, these provinces remained net exporters of fruits and nuts over the period. While most provinces in the arid region were a net crop importer, with an overall regional CTB of 0.84 in 1980 and 2.27 million tonnes in 2010, they had a large contribution in vegetable and fruit exports over the period.
International crop trade. In 1980, the CTB of the country as a whole was 1.91 million tonnes, resulting from a crop import of 1.94 million tonnes and a crop export of 0.03 million tonnes. In 2010, the CTB had not changed, even though both imports and exports increased considerably. CTB was 1.89 million tonnes in 2010, resulting from 3.19 million tonnes of crop import, and 1.30 million tonnes of crop export. Expressed per capita, the national CTB reduced by 49%, from 49.1 to 25.3 kg·cap−1·y−1 over the period 1980–2010, which reflects the increased self-sufficiency of the country. Cereals were dominant in the national CTB, both in 1980 (imports of 2.07 million tonnes) and 2010 (imports of 2.31 million tonnes). Oil seeds import grew by 0.86 million tonnes and took second place in the CTB in 2010. The import of pulses increased from 0.004 million tonnes in 1980 to 0.14 million tonnes in 2010. For sugar crops, the CTB changed from zero trade in 1980 to an import of 0.014 million tonnes in 2010. A considerable increase occurred in exporting vegetables and roots and tubers, reaching total exports of 0.002 million tonnes and 0.71 million tonnes in 2010, respectively. The CTB for nuts changed from an export of 0.005 million tonnes in 1980 to an export of 0.16 million tonnes in 2010, respectively.
Interprovincial crop trade. The interprovincial crop trade increased from 5.22 million tonnes in 1980 to 13.6 million tonnes in 2010, which was mainly due to increases in sugar crop and cereal trade (increases of 4.0 and 3.0 million tonnes, respectively). Fruits also experienced a considerable trade increase over the period (of 1.9 million tonnes).
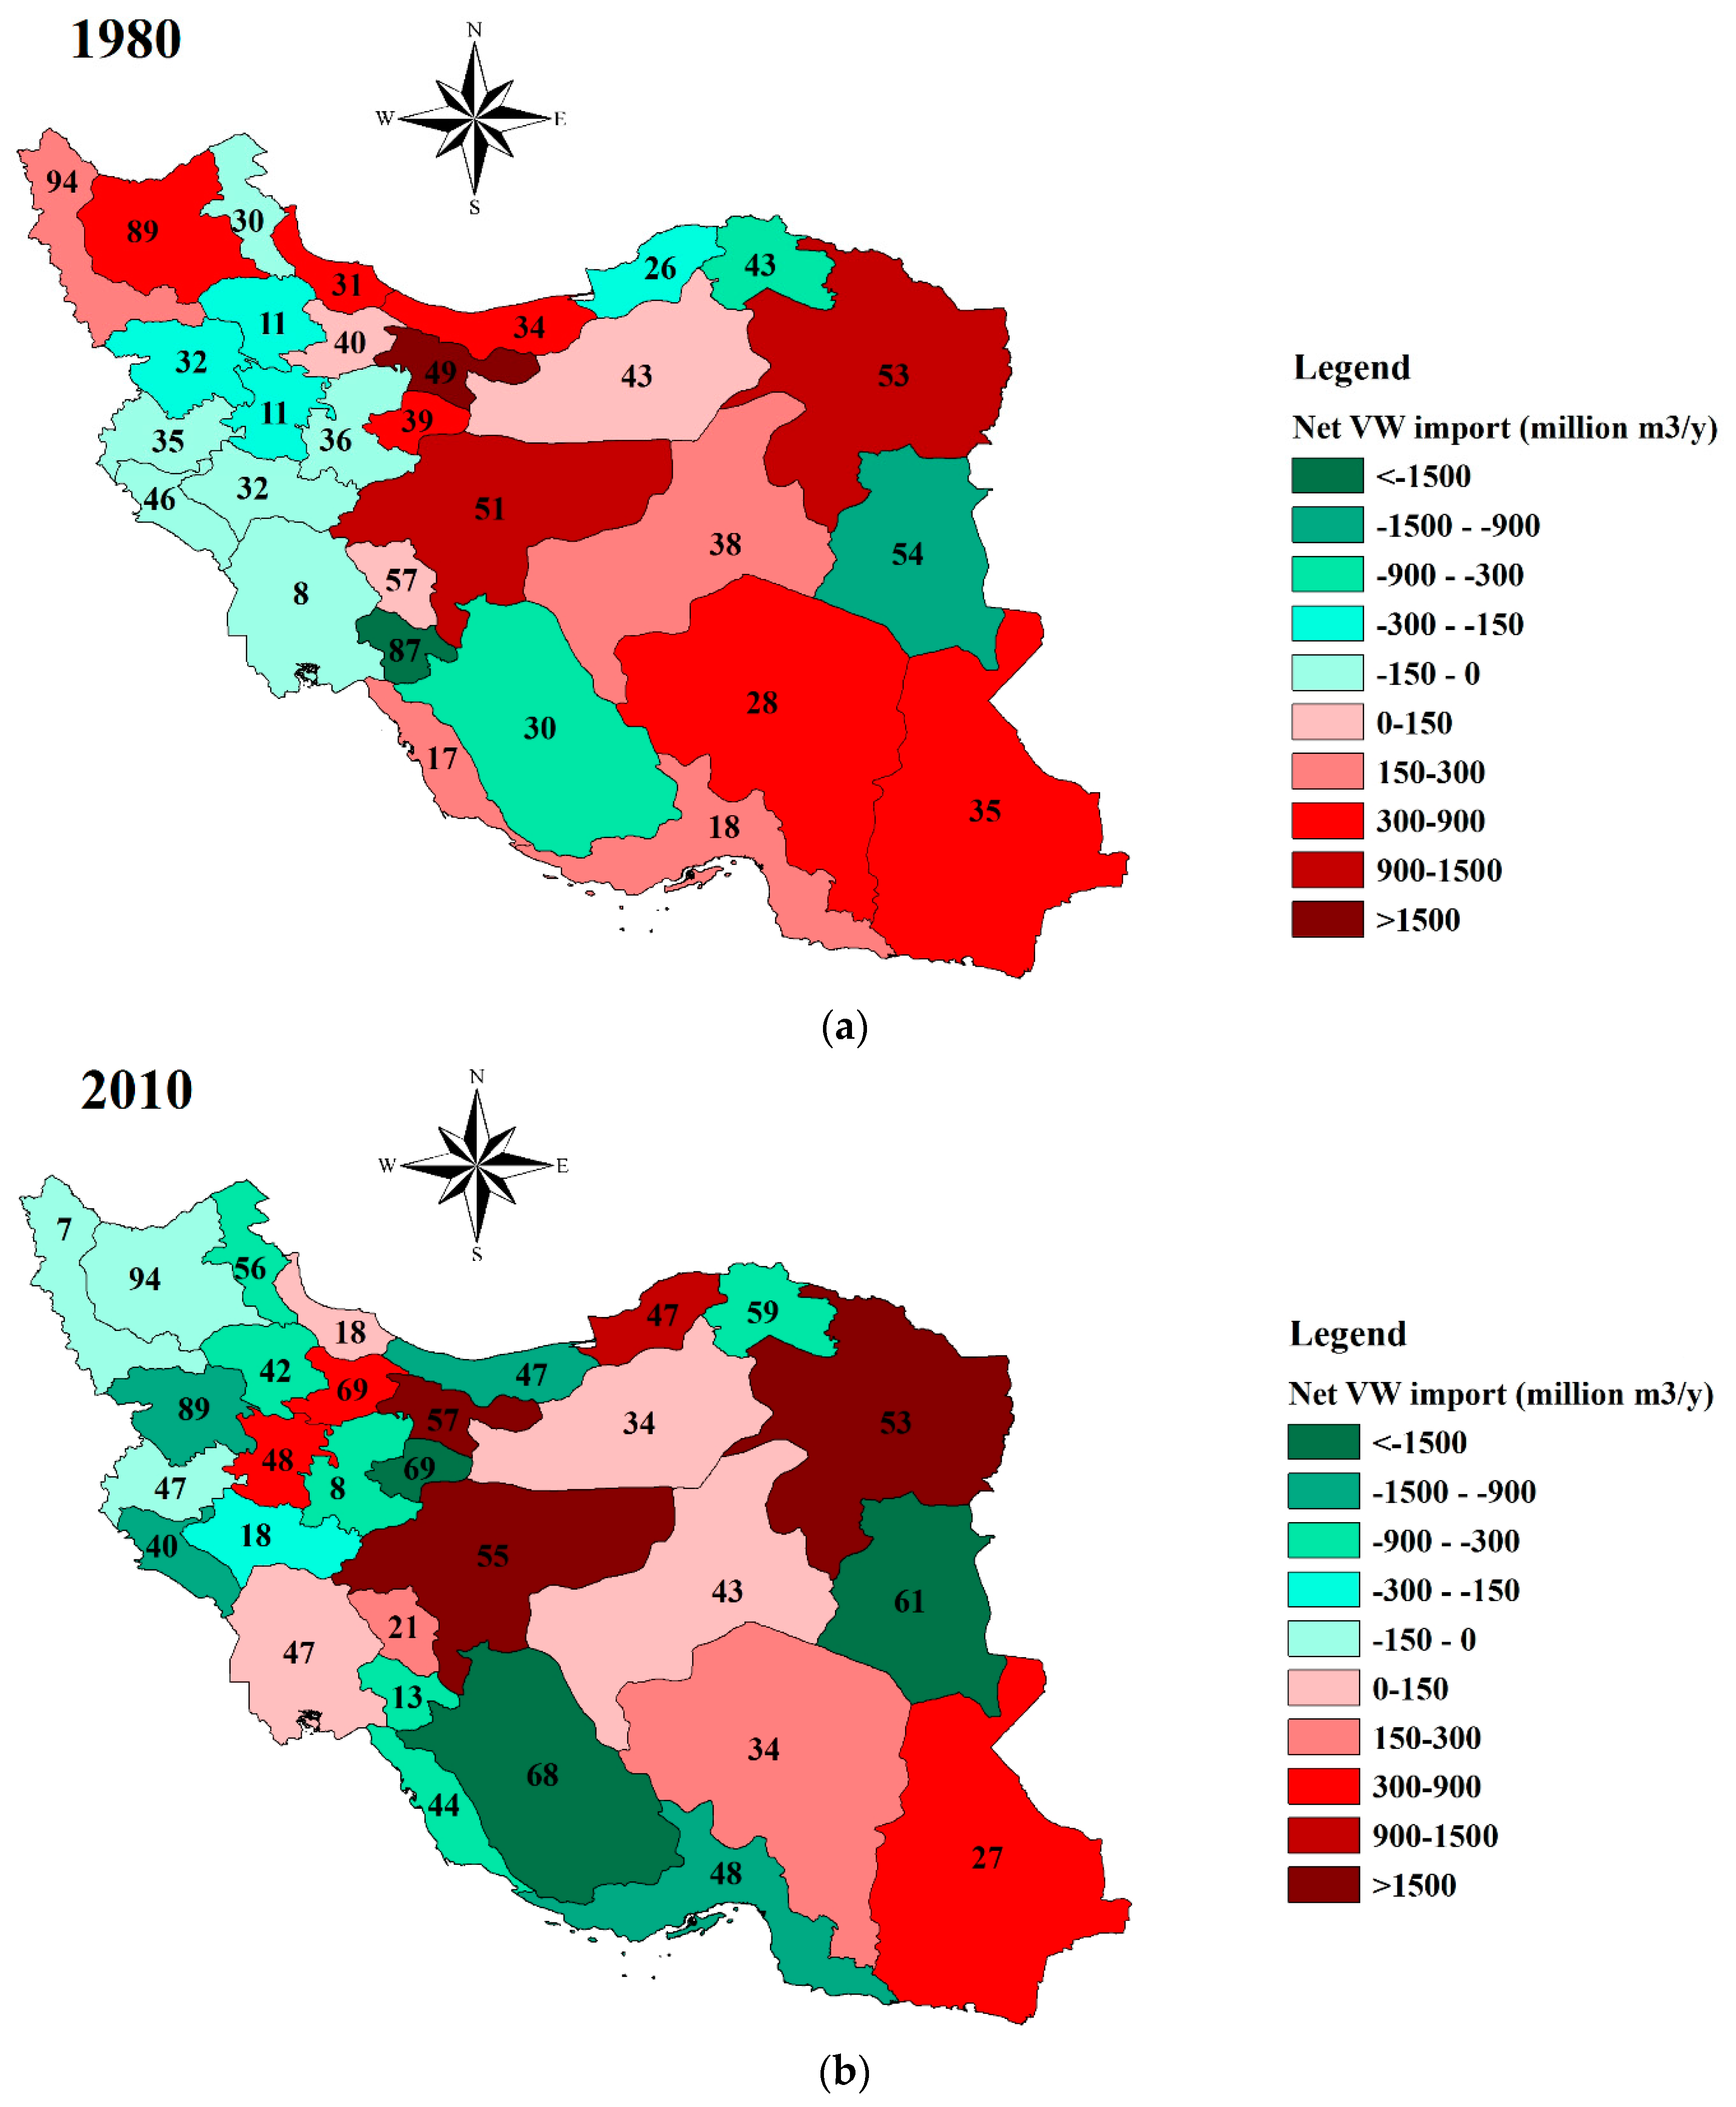
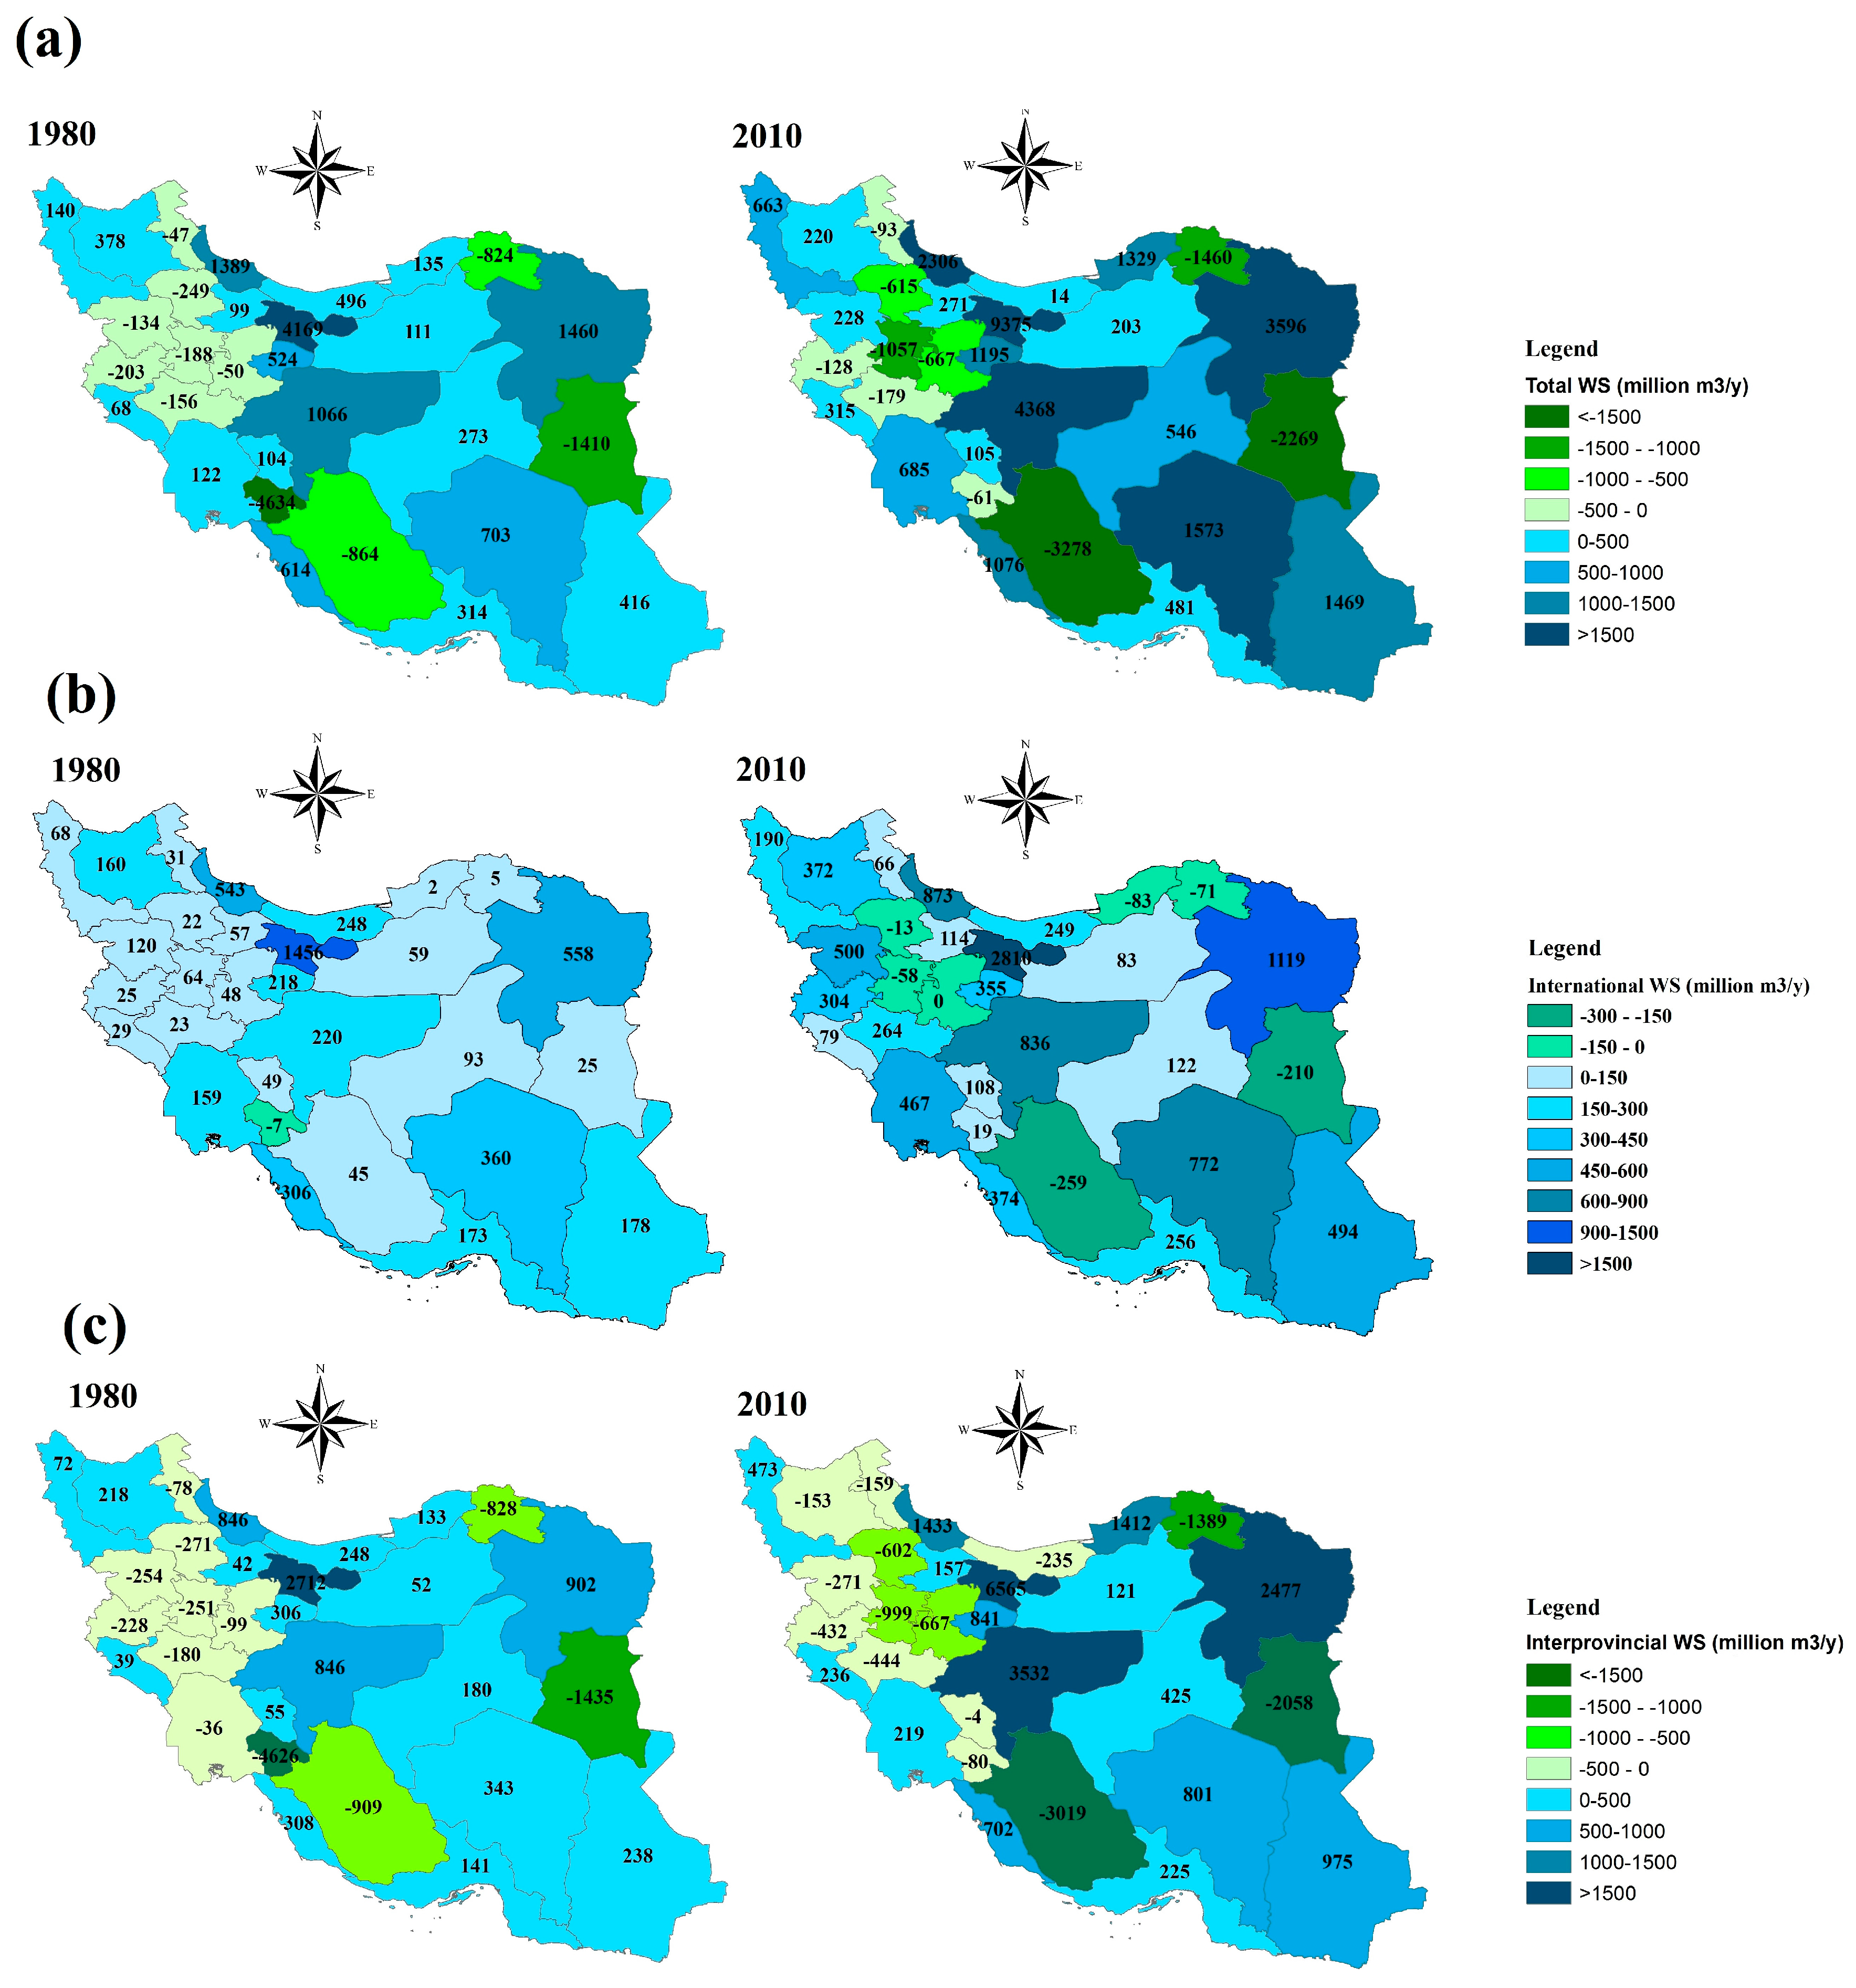
Virtual water (VW) trade balance per province. Net VW import per province for the years 1980 and 2010 is shown in
Figure 9. Most of the provinces located in the semi-arid region were VW exporters over the period 1980–2010 (
Figure 10). The arid region as a whole was a VW importer over the whole period, although some of the provinces in the arid region had VW exports. In 1980, the largest VW export was from Kohgiluieh-Boyerahmad province in the semi-arid region (4.6 billion m
3·y
−1 of which 87% was blue water), while in 2010 the largest VW export came from Fars province in the arid region (3.1 billion m
3·y
−1 of which 68% blue water). In both cases, this was the result of the relatively large VW export related to cereal exports from these provinces. In 2010, 26% of the total water consumption in the semi-arid region served the production of crops for export to other regions (mainly cereals) or internationally (mainly fruits and nuts).
The changes in crop trade patterns over the period 1980–2010 led to a change in the VW trade pattern as well. Three provinces, namely Golestan (in the dry sub-humid region), Khuzestan (in the arid region) and Kohgiluieh-Boyerahmad (in the semi-arid region), changed from net VW exporters in 1980 to net VW importers in 2010. Vice versa, five provinces in the arid and semi-arid regions, namely Tehran, Qom, Bushehr, East Azarbaijan, and West Azarbaijan, changed from net VW importers in 1980 to net VW exporters in 2010. Besides, Mazandaran province in the humid region changed from a net VW importer to a net VW exporter.
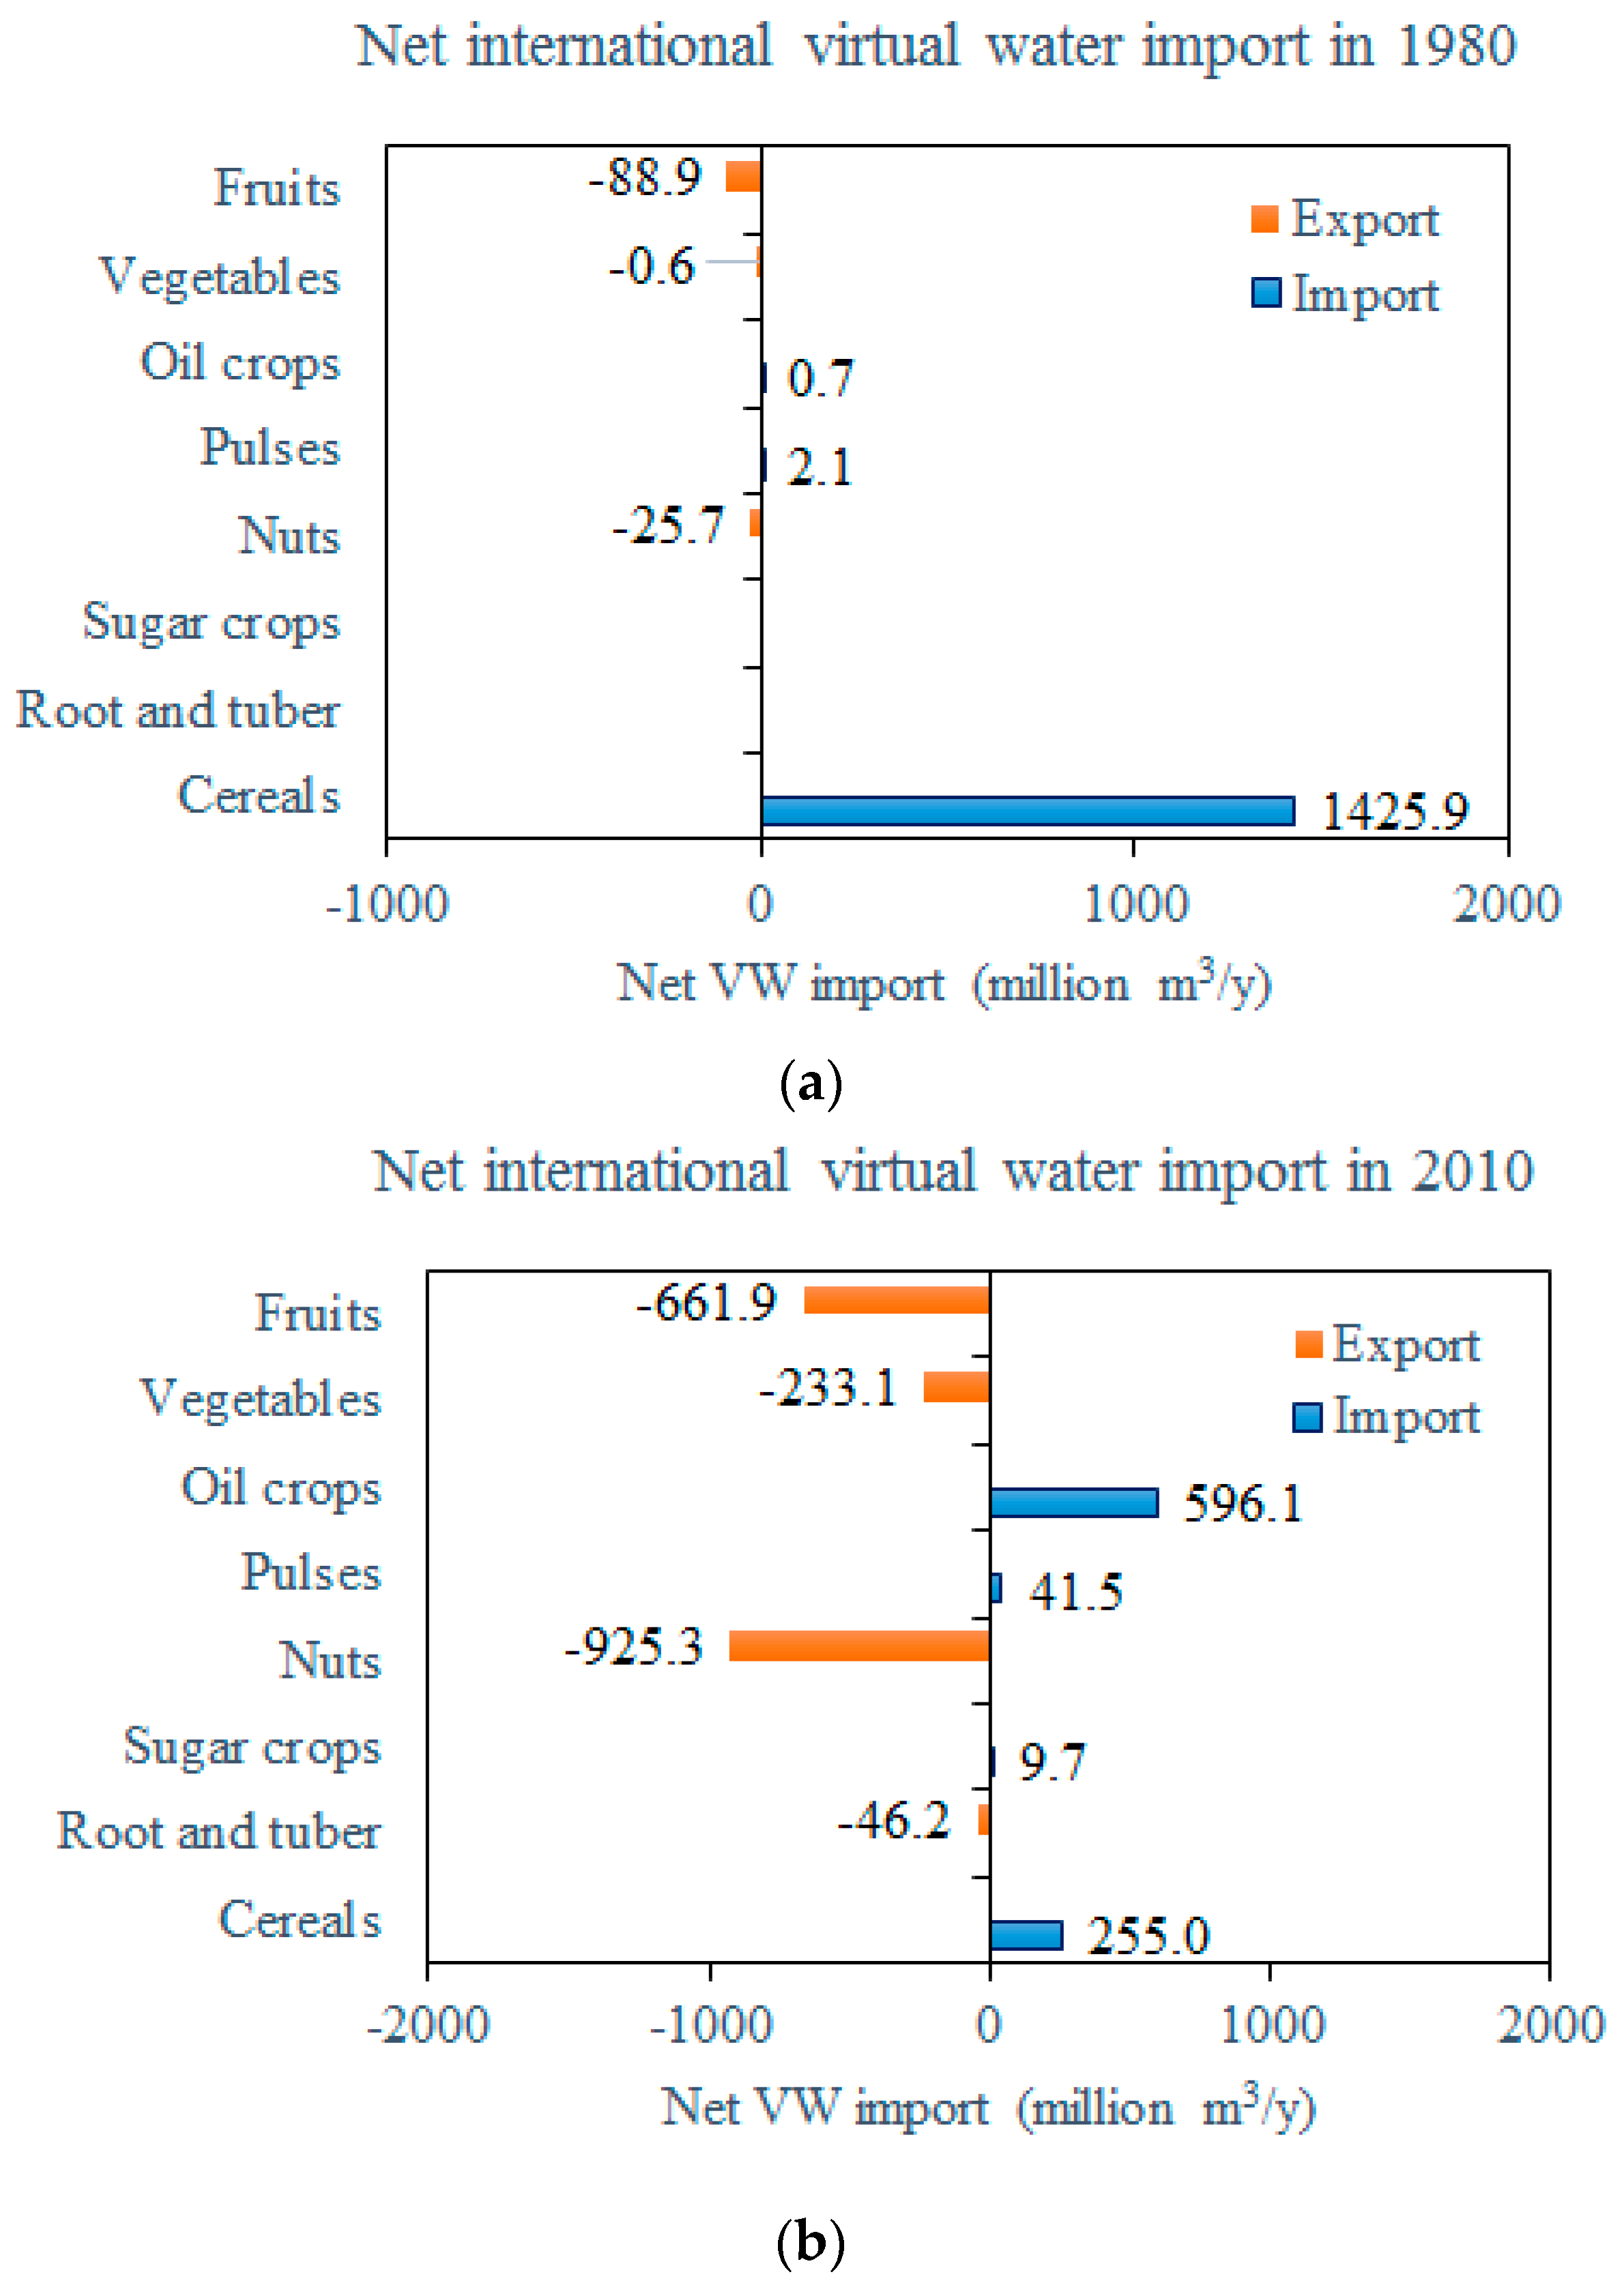
International virtual water trade. In 1980, the international VW trade of the country as a whole was 1.34 billion m
3·y
−1 (with a blue water share of 12.6%), which resulted from a VW import of 1.33 billion m
3·y
−1 and a VW export of 0.01 billion m
3·y
−1 (
Figure 11). In 2010, international VW trade was −0.96 billion m
3·y
−1, which resulted from a VW export of 2.68 billion m
3·y
−1 and a VW import of 1.72 billion m
3·y
−1. While international import in cereals had the largest contribution to the overall VW import in 1980, the import of oil seeds took the first place in 2010. Internationally, Iran exported 0.17 billion m
3·y
−1 of blue VW in 1980, and 2.40 billion m
3·y
−1 in 2010. The dramatic increase was mainly due to a significant increase in exporting irrigated nuts and fruits in 2010, which are mainly exported from the semi-arid and hyper-arid regions (
Figure 12).
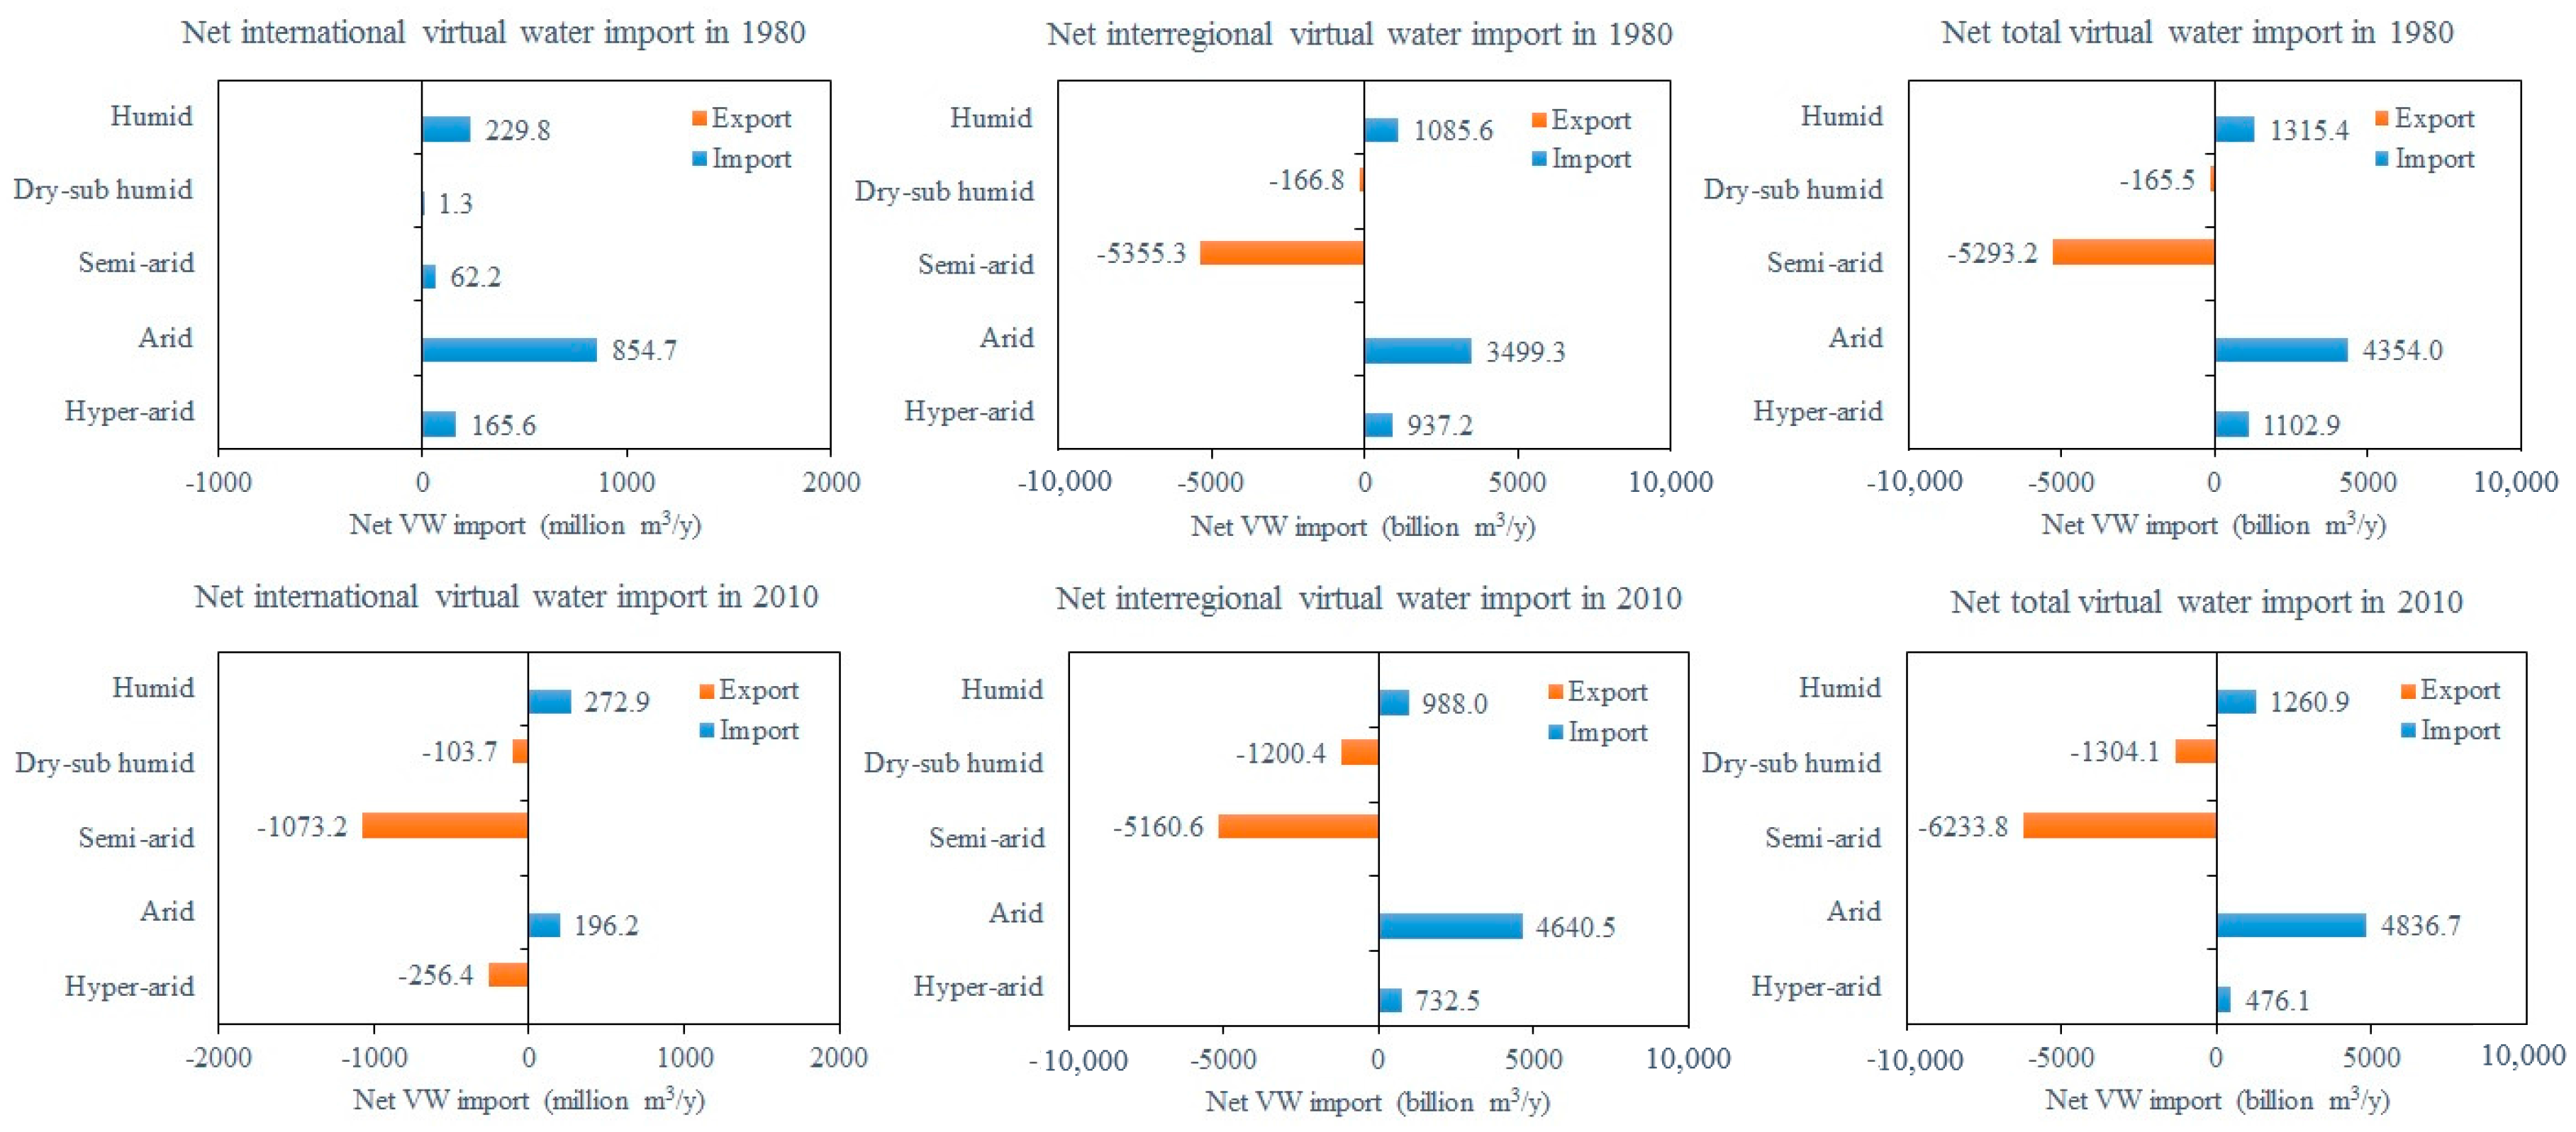
Interprovincial virtual water trade. The interprovincial VW trade grew from 9.1 billion m
3·y
−1 (59% blue water) in 1980 to 14.8 billion m
3·y
−1 (57% blue water) in 2010, which was mainly due to increased interprovincial trade in cereals, nuts, and fruits. The spatial pattern of interprovincial VW trade within the country remained more or less the same over the period, with the semi-arid region responsible for the largest VW export, and the arid region responsible for the largest VW import (
Figure 12).
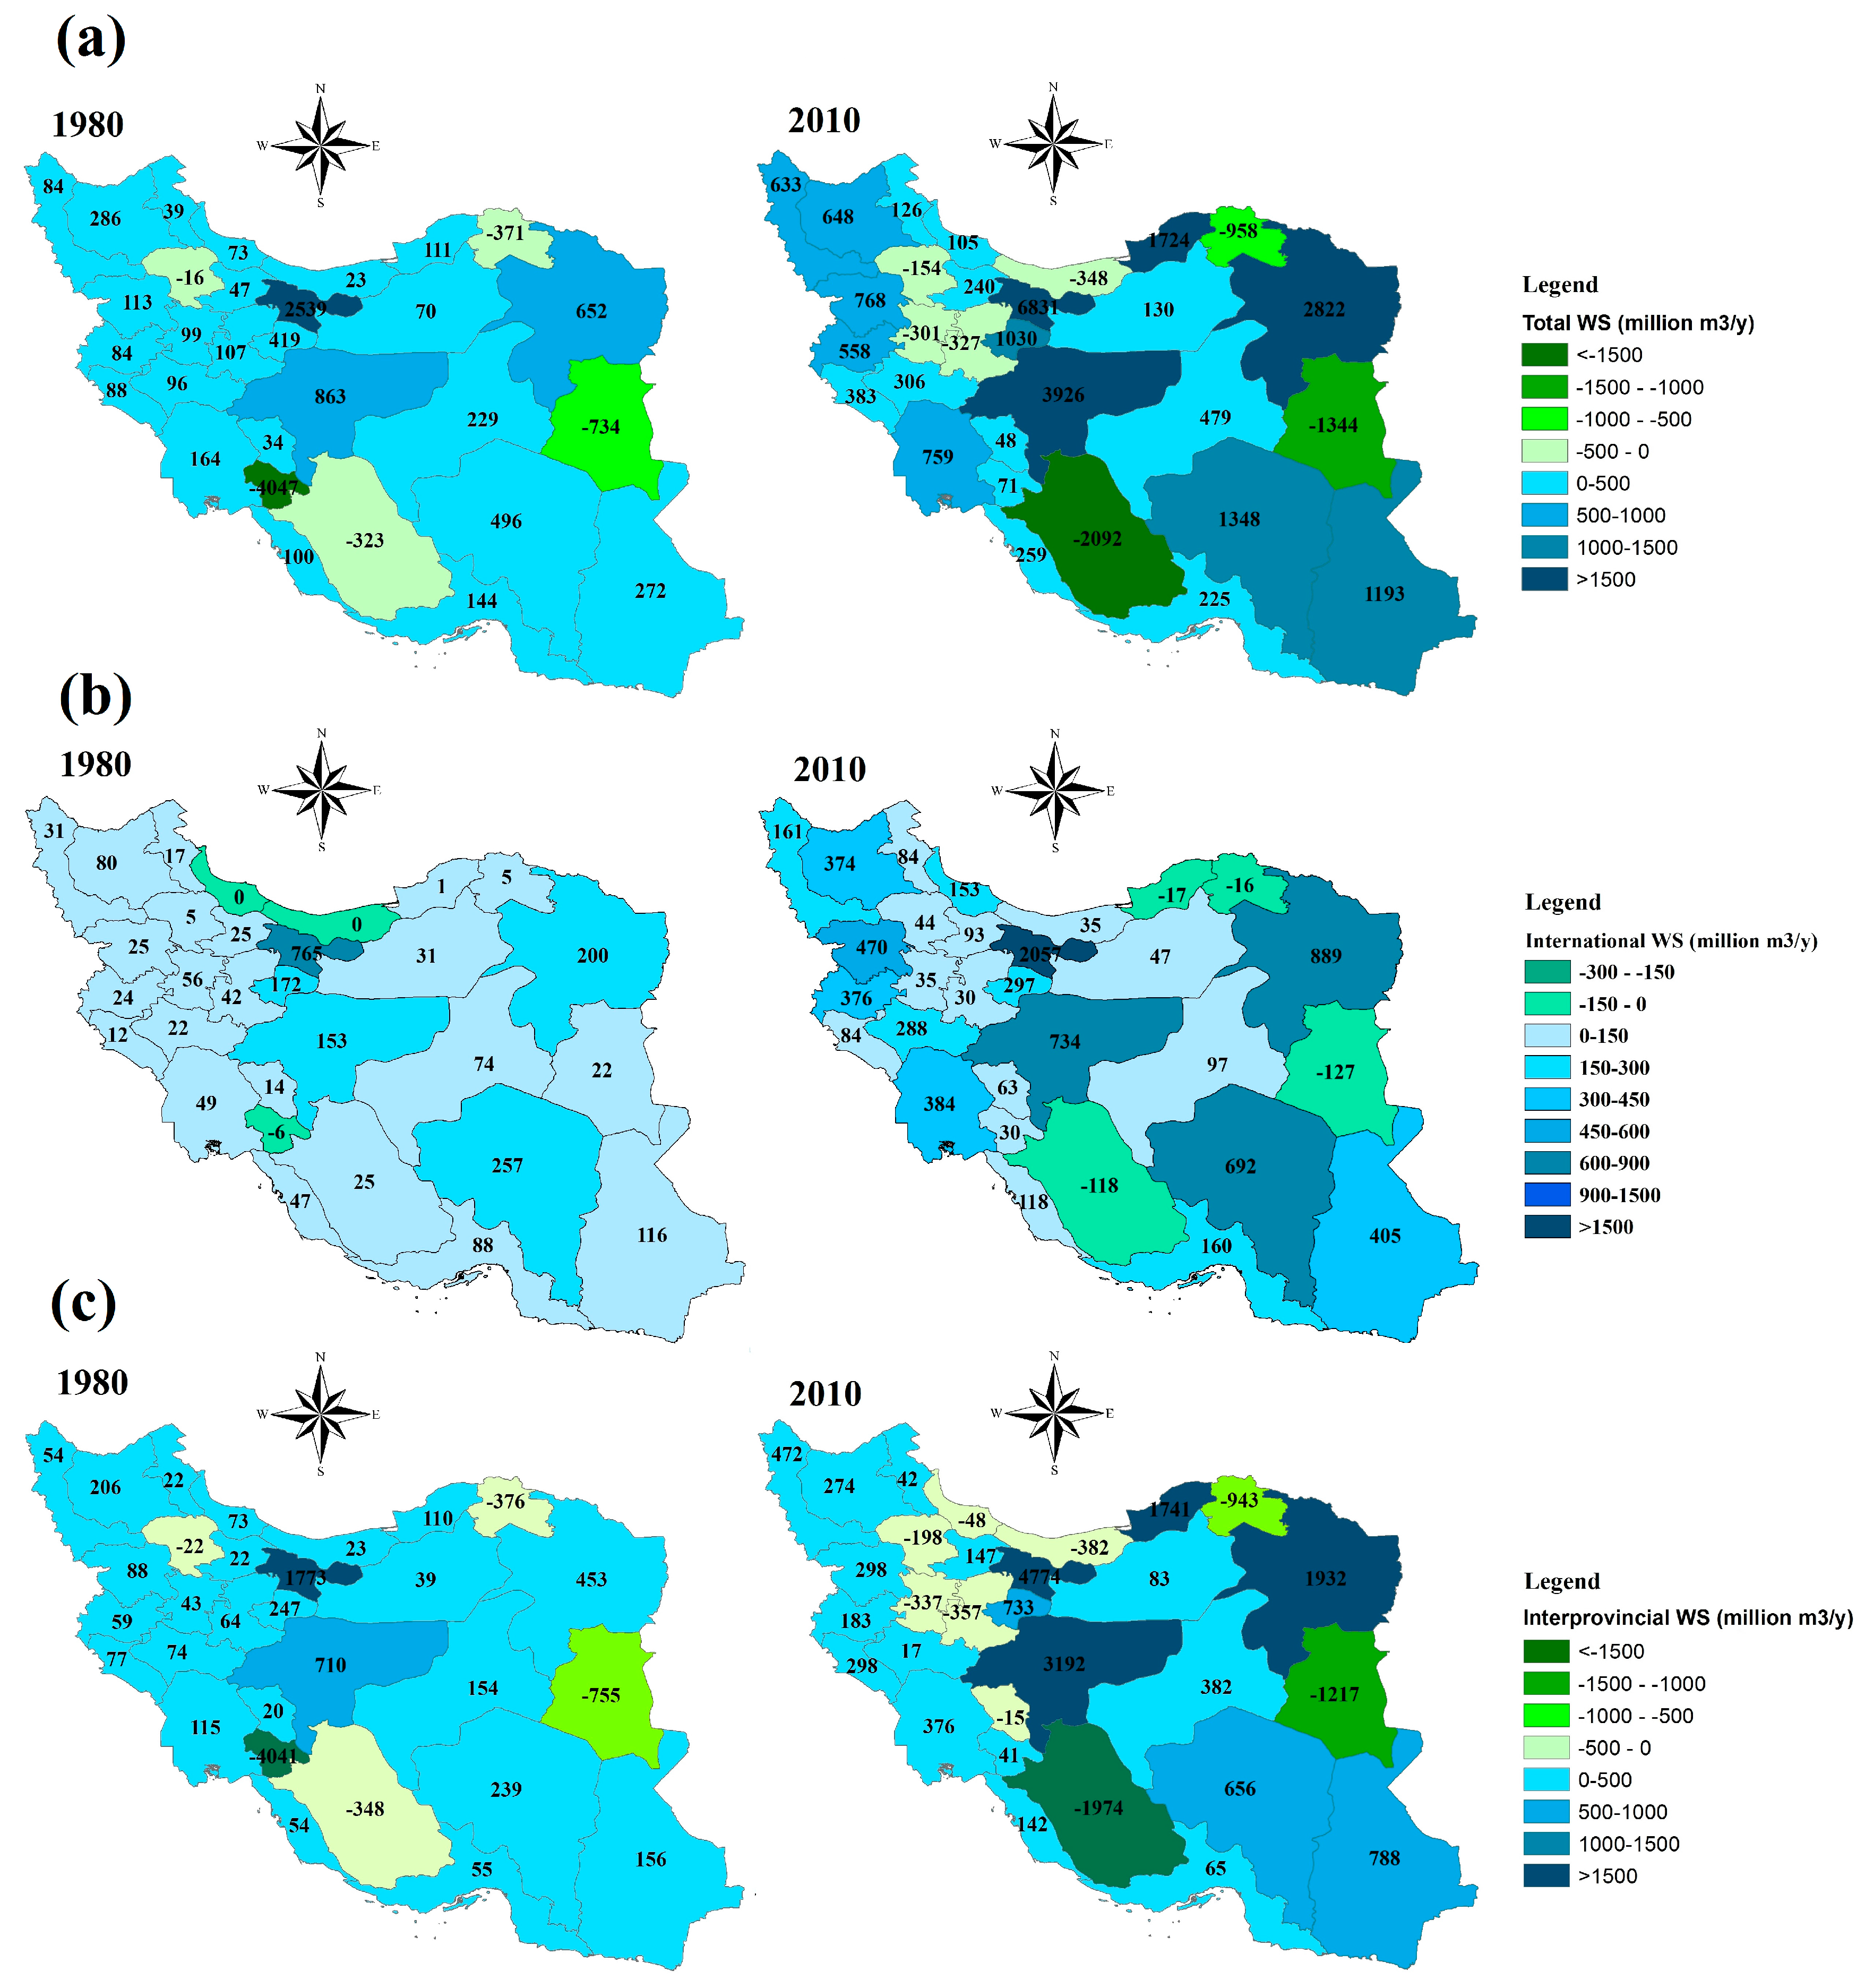
2.5. Water Saving through Crop Trade
Water saving per province. The largest water savings due to trade in the country are found in some provinces in the arid region, most notably Razavi Khorasan and Esfahan (
Figure 13). Total water saving in the arid region increased from 5.05 billion m
3·y
−1 in 1980 to 13.1 billion m
3·y
−1 in 2010. Blue water saving in the arid region increased from 3.71 billion m
3·y
−1 in 1980 to 12.0 billion m
3·y
−1 in 2010 (
Figure 14). However, within the arid region, there are also provinces with water losses due to trade, namely Fars, South Khorasan, and North Khorasan. Most of the provinces in the semi-arid region saved water in relation to international crop trades over the period, but experienced water losses in relation to interprovincial crop trade. The net result of international and interprovincial crop trade for the semi-arid region is an overall water loss of 5.25 billion m
3·y
−1 in 1980, and 1.49 billion m
3·y
−1 in 2010. For the semi-arid region as a whole, the 3.27 billion m
3·y
−1 of blue water loss in 1980 had become 2.35 billion m
3·y
−1 in blue water saving in 2010. All three provinces in the hyper-arid region had considerable water saving related to their crop trade, with an increasing trend over time. The two provinces in the humid region, and the one province in the dry sub-humid region, had water savings due to crop trade as well, with again an increasing trend except for Mazandaran province. In 1980, Mazandaran still had a blue water saving due to trade, but in 2010, it had a blue water loss due to the export of irrigated rice.
Water saving related to international crop trade. While in 1980, Iran’s international crop trade led to a total (green plus blue) water saving of 5.0 billion m3·y−1 (46% blue), this had grown to 9.8 billion m3·y−1 by 2010 (80% blue). However, there was also large variability within this period, which related to the variability in traded crops and their volumes. Cereal imports played the biggest role in the national water saving of Iran through international crop trade, followed by oil crop imports. Overall, the international export of nuts, vegetables, fruits, and root and tubers resulted in water losses through 1980–2010.
Water saving related to interprovincial crop trade. In 1980, interprovincial crop trade was still associated with a total water loss of 1.5 billion m3·y−1, but this turned into a water saving from 1982 onwards. The water saving related to interprovincial crop trade steadily grew until 2010, when the total water saving amounted to 10.1 billion m3·y−1. Looking at blue water, we find a blue water loss as a result of interprovincial crop trade of 0.6 billion m3·y−1 in 1980, and a blue water saving of 11.2 billion m3·y−1 in 2010. The water savings due to interprovincial trade refer to most crop categories, but not for cereals and sugar crops, which are traded from provinces with a relatively large WF per tonne (e.g., Fars province in the arid region, with an average WF of 2288 m3 per tonne of cereals in 2010) to provinces with a smaller WF per tonne (e.g., Tehran, also in the arid region, with a WF of 1731 m3 per tonne of cereals in 2010).
3. Added Value of WF Assessment for Iran’s Food and Water Security Policy
After the 1979 revolution in Iran, the government implemented agricultural policies aimed at achieving food self-sufficiency. The main current policy frameworks governing agriculture and economic development in Iran are [
17]: Vision 2025 (adopted in January 2009), Broad Policies for Agriculture (adopted in July 2005), and the fifth Five-Year National Economic, Social and Cultural Development Plan (FYNDP). While the latter plan refers to the period 2011–2016, the sixth Five-Year Plan is still under debate. One of the main objectives of the Iranian government is to achieve national food security through higher agricultural productivity and self-sufficiency in staple crops. In 1999, the government initiated the self-sufficiency strategy for wheat by adopting different policies, which caused Iran to become the 12th largest producer of wheat in the world by 2012 [
17]. Thereafter, a guaranteed purchase price was provided for more than 20 crops, with wheat and rice being the most important, which caused a considerable increase in national agricultural production.
Since water availability has direct bearing on food self-sufficiency, the Iranian policy makers implemented ambitious long-term water management plans in the third Five-Year Development Plan of the country (third FYDP) to address the growing gap between demand and supply. Water policies in Iran during this period mainly focused on increasing the amount of water physically available without considering the long-term consequences of this strategy. One of the quantitative goals that have been accomplished after the third FYDP was the increase of total crop production through changing Iran’s agricultural system. About 140,000 hectares of irrigation and drainage networks were constructed during the past two decades. To rapidly expand the irrigated lands, the planners and policy makers focused on increasing water availability through constructing dams and the associated infrastructures. During the third FYDP, 12 new dams were constructed, providing an additional water supply of about 3.7 × 10
9 m
3·y
−1. Globally, Iran ranks third in dam building, with most dams constructed in the period of 1960–1990 [
18]. Currently, about 500 dams are operating in Iran, and 100 more dams are under construction. Moreover, the government considers constructing 400 more dams, which are now in the design or feasibility stages [
19]. Based on the reported value in 2016, a volume of 40 billion m
3·y
−1 of water is currently stored in the Iranian reservoirs [
20]. Damming has caused serious environmental problems, such as deteriorating water quality and increasing land desertification and salinization. It has been reported that over two-thirds of Iran’s land is rapidly turning into desert as a consequence of environmentally unmanaged damming projects [
21].
The expansion of irrigation beyond regional capacity levels caused a dramatic overexploitation of groundwater resources. Now, farmers operate about 500,000 wells in Iran [
18], and there is no license or permission for many of them. This has led to the salinization of farmland wells and reduced groundwater access. According to the Institute for Forest and Pasture Research, groundwater levels have dropped by two meters in recent years across 70 plains, affecting as much as 100 million hectares. With little to no metering to ensure that withdrawal limits are not breached, groundwater extraction within Iran has led to a 50% reduction in groundwater availability and significant issues with salinity, as water tables continue to fall [
18].
Implementing major interbasin water transfer projects was the other achievement of the third FYDP, mitigating regional water shortages. Transferring desalinated water from the Caspian Sea, and from the Persian Gulf and Sea of Oman to support the dehydrated megacities and parched farmlands within the country are the most recent high-profile projects considered by the Iranian policy makers. While the interbasin water transfer projects are likely to be continued, these plans are unlikely to address water shortages in the long term due to the significant environmental impact these transfers cause. The government also considered the use of unconventional water resources, but as of yet, wastewater use in Iran’s agriculture is mostly uncontrolled. There are many local farmers using raw wastewater directly for irrigation without caring about its adverse effects on human health or the environment.
Iran’s policy on food self-sufficiency caused a significant increase in total production through increasing water supplies and expanding the irrigated land area, but evaporation losses are large due to the inefficiency of the irrigation systems. Over 70% of the irrigated land is under surface irrigation, with an average irrigation efficiency of 33%, according to the Food and Agriculture Organization of the United Nations (FAO), leaving significant room for water saving through efficiency improvements. Inefficient irrigation can increase the incidence of salinization and waterlogging of agricultural land, and lead to reduced productivity and long-term problems with sustainable land use. In fact, during the past decades, Iran’s water problems have mostly been addressed by increasing water availability, while water demand management options have less been considered by the Iranian water authorities.
The water footprint assessment carried out here provides several new insights and management solutions that are currently not considered by the national water strategy of Iran. First, the study shows new insights in how to possibly diminish water consumption in crop production. Our WF assessment demonstrates that the WF per tonne for a specific crop hugely varies within the country, and even within climatic regions. It raises the question of why certain crops are produced in certain provinces, but also why some provinces do better than others. The assessment made here invites the development of benchmarks for the WFs of crops, per crop and per climate region (see for instance Hoekstra [
14], Mekonnen and Hoekstra [
22], and Zhuo et al. [
23]), and for further exploration of what water savings could be achieved when reducing the WF for all crop production in a region to a certain reasonable benchmark level (see for instance Chukalla et al. [
24]). WFs can be reduced by diminishing the no beneficial component of evapotranspiration from crop fields, by mulching and better irrigation practices [
25]. Adjustments in crop planting dates and selecting appropriate crop varieties that yield more crop per drop are other possible ways to increase water productivity and reduce WFs per tonne of crop [
26,
27]. In addition, knowledge on the water requirements per unit of crop under certain climatic conditions may result in a reconsideration of the crop production pattern in the country. As we show, for example, oil crops produced in the hyper-arid region have a relatively large WF per tonne of crop, while roots and tubers have a much smaller WF per tonne. Besides, as shown earlier by Karandish et al. [
28], roots and tubers also have a smaller WF per hectare, and would give higher economic profit. The question, therefore, is why governmental policies promote planting oil crops in the hyper-arid region.
Second, the study shows how modifying consumption patterns could help to mitigate water scarcity. Iran’s water policy makers fully ignore the significant influence of the consumption pattern on exacerbating the water scarcity. Our WF assessment in relation to crop consumption demonstrates the significant influence of diet on water requirements. For example, rice is a common element in the Iranian diet, especially in the northern part of the country, while rice has a much larger WF per tonne compared with alternatives such as wheat or roots and tubers. Besides, even though rice is mostly produced in the humid region, it is mostly irrigated, thus aggravating blue water demands, while wheat and roots and tubers can be produced in the same region under rain-fed conditions.
Third, the analysis in this paper shows that the existing pattern of interprovincial crop trade within the country is counter logical. Although it is the most water-abundant region of the country, the humid region has a net virtual water import through crop trade, due to the relatively small share in total crop production and the decreasing trend in the per capita arable land availability. Economic incentives have encouraged many farmers in northern Iran to change their farms to urban areas. As a consequence, the humid region is a net VW importer, despite being fertile for crop production with a relatively small WF per tonne of crop. On the other hand, the water-scarce semi-arid region, and some provinces in the arid region, produce crops for export to other regions within Iran. Interestingly, the findings here for Iran—of virtual water transfers from water-scarce to more water-abundant regions within a country—is similar to findings for other countries, such as China [
29] and India [
30]. In recent years, the government has implemented plans for interbasin water transfers, by which water is conveyed from the more water-abundant to the water-scarce regions of Iran. Undoubtedly, this will result in the continued expansion of irrigated agriculture in the arid and semi-arid regions of Iran, where crops have the relatively high WF per tonne. During the few past decades, a strong motivation has been created among local farmers to replace their rain-fed practices with irrigation systems in order to achieve higher annual income through the increased yield. Our findings indeed show that the expansion of the irrigated area has led to a considerable increase in the proportion of the blue WF in the total WF.
Finally, the study demonstrates that Iran’s food self-sufficiency policy may be detrimental to maintaining food security in the long run. It has promoted the export of water-intensive products from water-scarce regions, such as cereals from Fars province in the arid region for export to other provinces, which results in groundwater level decline, aquifer depletion, soil salinization, and groundwater quality deterioration. Another example is the promotion of growing cereals, fruits, and sugar crops in West Azarbaijan for export to other provinces, which leads to increased water consumption and contributes to the drying of Urmia Lake. Therefore, knowledge about the virtual water flows entering or leaving a province or climatic region can cast a completely new light on how trade mitigates or aggravates the water scarcity of the province or region.
4. Conclusions
Our analysis shows that food self-sufficiency increased in line with Iranian policy. Besides, the water savings related to international and interprovincial trade increased over time. However, the WF of production substantially increased, particularly within the semi-arid region and some provinces in the arid region that are mostly responsible for feeding the country, which resulted in a strong growth of blue WFs and the overexploitation of water resources in these regions. Besides, our analysis shows that consumption increased because of population growth and an increase in consumption per capita. Current Iranian food and water policy could be enriched by reducing the WFs of crop production to certain benchmark levels per crop and climatic region, aligning cropping patterns to spatial differences in water availability and productivities, and reconsidering interbasin water transfer plans to bring water to water-scarce places with relatively high WFs per unit of crop to produce food for export. Furthermore, Iranian food and water policy could be supplemented by paying due attention to the increasing food consumption per capita in Iran. Finally, the country may have to reconsider its food self-sufficiency and food trade policy. Roots and tubers, nuts, vegetables, and fruits were the most exported crops internationally in 2010. Iran may benefit from the international export of vegetables and roots and tubers due to their relatively low WF per tonne, but exporting nuts and fruits, especially from the drier parts of the country to abroad, leads to a significant national water loss. Furthermore, while importing cereals instead of producing them domestically could save a lot of water, our findings indicate that the per capita international cereals import reduced by 42% over 1980–2010, mainly due to Iran's Wheat Self-sufficiency Project over the past decades.
We acknowledge that adapting Iran’s food and water policy is a challenge given the conflicts of interests involved, particularly between the short and long term, and between the goal of food self-sufficiency and the need for sustainable water use. Choices that need to be made will need to consider all of the relevant economic, social, and environmental factors, but will include a political component as well, given the trade-offs to be made. While current Iranian food and water policy narrowly focuses on measures to enhance domestic food production through increased water supply, our research suggests that it could be beneficial to additionally consider the potential of measures to improve water productivity, adapt spatial cropping patterns, shift to diets that are less water intensive, and promote forms of trade that save the scarce domestic water resources. Future research will be necessary to quantify the full potential and implications of these alternative measures.


