Article

Melting Characteristics of Snow Cover on Tidewater Glaciers in Hornsund Fjord, Svalbard

1
Faculty of Earth Sciences, University of Silesia in Katowice, Będzińska 60, 41-200 Sosnowiec, Poland
2
Institute of Geophysics, Polish Academy of Sciences, Księcia Janusza 64, 01-452 Warsaw, Poland
*
Author to whom correspondence should be addressed.
Water 2017, 9(10), 804; https://doi.org/10.3390/w9100804
Submission received: 16 August 2017 / Revised: 13 October 2017 / Accepted: 16 October 2017 / Published: 19 October 2017

Abstract

:
In recent years, the Svalbard area, especially its southern section, has been characterised by an exceptionally thin snow cover, which has a significant impact of the annual mass balance of glaciers. The objective of this study was to determine melting processes of the snow cover deposited on 11 glaciers that terminate into Hornsund Fjord during the melting period of 2014. The study included analyses of snow pits and snow cores, meteorological data collected from automatic weather stations and Polish Polar Station Hornsund, and supervised classification of six Landsat 8 images for assessing the progress of snow cover melting. The calculated Snow-Covered Area (SCA) varied from 98% at the beginning of the melting season to 43% at the end of August. The melting vertical gradient on Hansbreen was −0.34 m 100 m−1, leading to surface melting of −1.4 cm water equivalent (w.e.) day−1 in the ablation zone (c. 200 m a.s.l. (above sea level)) and −0.7 cm w.e. day−1 in the accumulation zone (c. 400 m a.s.l.). Furthermore, the study identified several observed features such as low snow depth in the accumulation zone of the Hornsund glaciers, a large proportion of the snow layers (12–27%) produced by rain-on-snow events, and a frequent occurrence of summer thermal inversions (80% annually), indicating that the area is experiencing intensive climate changes.

1. Introduction

Snow cover plays a significant role in shaping the global climate system. It forms a highly-insulating layer, reflecting up to 90% of the solar energy [1]. In Polar Regions, intensive surface melting processes, and thus also radical changes in the albedo, may occur over just a few days, during the late-spring melt. Recent decades have seen noticeable changes in the climate worldwide, with the most pronounced transformations of the geographic environment observed in the Arctic, especially in its glacierized areas [2]. Given the high sensitivity of the European sector of the Arctic to meteorological conditions, the area is extremely important for understanding the climate processes that are taking place on a global scale.
At present, most glaciers worldwide experience mass loss [3]. Existing models used to determine the mass balance, retention and meltwater runoff into the ocean clearly lack precise and regular spatial measurements of the snow cover melting [4,5]. A majority of hydro-glaciological studies focus on small and medium-size glaciers [6], which have a greater contribution to feeding the ocean with freshwater than the Antarctic and Greenland ice sheets [7].
Increased ablation results in an intensified supply of meltwater, which has strong implications for the entire Arctic environment, for example, by increasing the basal sliding layer of glaciers, transporting mineral and organic matter beyond the basin boundaries, and locally changing the thermal and chemical properties of sea water, thus having an effect on sea ice formation. Therefore, estimating changes in the runoff of meltwater becomes important in broad, multidisciplinary terms.
The main aim of this study is to characterise snow cover melting processes throughout the melting period and reveal differences in snow-covered area and melt rates between selected glaciers terminating into Hornsund Fjord, based on supervised classification of Landsat 8 images, validated with in situ measurements and meteorological data. Additionally, we estimated the range of surface melting, and thus also the potential outflow of freshwater from the individual glacial systems into the sea, in relation to local conditions.
This is the first such comprehensive study, covering a vast glacierized area of southern Spitsbergen, which allowed us to identify the properties and spatial conditions of the snow melt. Błaszczyk [8] emphasises that the shrinking of glacierized areas in the Hornsund region is advancing much more rapidly than on average for Svalbard as a whole. Therefore, this area requires individual analysis, assuming that the melt rates will be greater here [9,10,11].
Remote sensing is currently one of the most rapidly developing branch of methods used in modern glaciology. The progress of space technologies in recent decades has provided a rapidly growing number of satellite platforms, which can be used to study complex physical Earth-atmosphere processes, also occurring on and within the snow cover on the glaciers. Thus, these technologies provide simultaneous analyses of large-scale areas which are inaccessible or too dangerous for fieldwork [12,13].
The first remote sensing measurements in southern Spitsbergen occurred in the 1970s and were based on vertical aerial photographs from the early 1960s, performed during a cartographic campaign. The data collected were widely discussed with regard to the applicability of aerial images in the classification of glacial facies; however, the time resolution of such studies was limited [14]. In subsequent years, remote sensing measurements on the studied area mainly focused on the mass balance of selected glaciers [15], elevation changes [16,17] and the decrease in the glacierized surface [8,18,19,20]. Satellite images were also used to measure the fluctuation of sea ice cover in Hornsund [21].
Existing literature related to the scientific problem lacks large-scale observational analyses with remote sensing methods concerning melting processes of snow cover, and instead, researchers largely rely on point measurements taken on individual glaciers [22,23,24,25,26]. Furthermore, the accurate interpretation of the results of those studies is also burdened with serious error due to the fast changes in the glacial environment of the Arctic and its local conditions. Consequently, more in-depth understanding of the melting processes seems reasonable and necessary.

2. Study Area

The study area comprises the glaciers terminating directly into Hornsund Fjord (Figure 1). They were delimited on the basis of a study [18], with later changes [8]. On account of the spatial resolution of the remote sensing data used, glaciers with a surface area of more than 9 km2 were selected for the study. The key morphometric properties of the glaciers are shown in Table 1.
Hornsund is the southernmost Fjord of the Spitsbergen Island, with West–East (W–E) orientation. The drainage basin covers c. 1200 km2, of which 67% (802 km2) is covered by glaciers belonging to the three land areas: Wedel Jarlsberg Land (north-western section), Torell Land (north-eastern section), and Sørkapp Land (southern section). As a result of the gradual retreat of the tidewater glaciers, its surface area and length have increased considerably: 188 km2 and 24 km (1936); 303 km2 and 34 km (2010). Hornsund has very diverse coastline with five main bays, cutting deeply into the land: Vestre and Austre Burgerbukta, Adriabukta, Brepollen and Samarinvågen [8].
Most of the glaciers of southern Spitsbergen are valley and cirque glaciers. Their shape and orientation reflect in the system of valleys. The main tectonic structures and mountain ridges, and thus also the glaciers, have a North-West–South-East (NW–SE) orientation, reaching a surface elevation of 600–700 m a.s.l. in the eastern part of the area, 700–930 m a.s.l. in the western part, and up to 1200 m a.s.l. in the southern part, where the highest peaks of southern Spitsbergen are located, with Hornsundtind rising up to 1431 m a.s.l. The surface area of the glaciers increases eastwards. The medium-sized and large tidewater glaciers have a small inclination, ranging from 1.3° (Hornbreen, Storbreen) to 2.2° (Mühlbacherbreen). The value increases for small glaciers, with 7.2° for Körberbreen [8].
The Hornsund region has an oceanic climate, with precipitation prevailing over evaporation. From the west, local climate is influenced by the warm West Spitsbergen Current, increasing the amount of precipitation and reducing the annual amplitudes of air temperature. The east coast remains under the influence of cold sea currents from the north, resulting in local cooling [27]. The multi-annual (1979–2009) mean air temperature at the WMO (World Meteorological Organization) 01003 (the Polish Polar Station Hornsund) was −4.3 °C [28], while the mean precipitation totals in the same period was 434.4 mm, with a prevalence of liquid forms (44%), occurring mainly in summer months—July and August [29]. The increased air temperature in winter months and the frequency of rain-on-snow (RoS) events are an important indicator of ongoing local climate change [24,30]. For the years 1979–2010, the positive air temperature trend was 0.97 °C per decade [31].

3. Materials and Methods

Meteorological data: the study is based on air temperature measurements (mean diurnal and maximum diurnal) for the period between 1 May 2014 and 31 October 2014 from the WMO 01003 Hornsund station (77°00′ N; 15°33′ E, 10 m a.s.l.) and automatic weather stations (AWS) located on Hansbreen: ablation zone, H4 (187 m a.s.l.); equilibrium-line region, H6 (278 m a.s.l.); accumulation zone, H9 (424 m a.s.l.).
Glaciological data: among the glaciers terminating into Hornsund, continuous mass balance monitoring is only conducted on Hansbreen. The data include measurements from six mass-balance stakes corresponding to the elevation zones: 50, 100, 200, 300, 400 and 500 m a.s.l., located along the central axis of the glacier. The measurements were taken c. once a month. In further surface melt calculations, both snow melt (variable density) and ice melt (constant density, ρ = 917 kg m−3) were distinguished. Changes of snow density for wet snow conditions have been estimated based on summer snow pits [24,32].
Determination of the general physical properties of the snow cover: A total of seven snow pits were completed in accordance with the International Classification for Seasonal Snow on the Ground [33]. Three were located in the ablation zone: Hansbreen (H4), Storbreen (SG), Flatbreen—the upper section of Hornbreen (FJ); three in the equilibrium-line region: Hansbreen (H6), Storbreen (SG), Flatbreen (FK); and one in the accumulation zone: Hansbreen (H9). The study mainly relied on snow depth, mean density, snow water equivalent (SWE), and a contribution of dense layers: Melt-Freeze Crusts (MFcr) and Ice Formations (IF). Bulk snow density was measured by means of a simple weight gauge (cross-section area: 50 cm2, length of tube: 60 cm, weight scale: 0.005 kg).
Additionally, snow cores were sampled in the accumulation zones of Storbreen (SI) and Flatbreen (FL), providing information about seasonal snow depth, mean density of snow cover and SWE. The coring system had a core diameter: 7 ± 0.2 cm. The samples were weighed using a spring weight scale with an accuracy of ±0.3%.
All the snow studies were carried out for dry snow cover in April–May 2014, at the end of the accumulation season.
Satellite data: detailed remote sensing analysis included six Landsat 8 satellite images covering the melting period of 2014. Selected spectral bands (1–5) of the Operational Land Imager sensor, with a wavelength range of 433–885 nm, were used for further analysis. The spatial resolution was 30 m per pixel.
Remote sensing in measuring snow cover surface classification: Satellite data allowed a comparison of the temporary Snow-Covered Area (SCA) at successive melting stages on the selected glaciers. The images were subjected to Top of Atmosphere (ToA) reflectance correction [34], and the glacierized areas were delimited. Detailed analyses were performed using colour compositions: in natural colour (bands 1, 2, 3) and false colour (bands 2, 3, 4).
In order to map the glacier surface, supervised classification was performed using the Maximum Likelihood algorithm [35]. For a better visualisation and interpretation purposes, a pan-sharpening function was applied, which increased the spatial resolution of the multispectral image bands from 30 m to c. 15 m. The output images showed six classes: snow, ice, shadowed snow, shadowed ice, debris and water. A cloud mask was applied for images with clouds impeding proper interpretation [36]. Mask was obtained from band 6 and any artefacts caused by similar intensity of the cloud pixels and the individual classes were corrected manually in the last stage of the post-processing.

4. Results

4.1. Microclimate and Topographic Determinants of the Structure of the Snow Cover on Hornsund Glaciers and Its Melting Characteristics

The year 2014 was the second warmest year, after 2012, in the entire observation history in Hornsund, with a mean annual air temperature of −1.3 °C. The monthly average temperature for all months of the year was significantly higher than multi-annual records. This was particularly clear in winter, from January to March, with the deviation reaching 9.5 °C in February. It was also a dry year, with annual precipitation of 410 mm, which represented 90.6% of the multi-annual 1979–2013. The lowest precipitation was recorded in winter months, which are particularly important for snow cover formation. The monthly precipitation in February (7.6 mm) represented only 26.7% of the mean long-term values for this month [37]. This resulted in lower than average snow depth, notably in the accumulation zones of investigated glaciers.
The local thermal conditions are strongly determined by the character of the surface. This is particularly evident in the summer, when tundra, which is not insulated by snow, is strongly heated and undergoes intensive evaporation. This causes the number of positive degree days (PDD) to vary significantly from site to site (Table 2). The accumulated total of PDD ranged from 164.3 (H9) to 585.4 (HOR), and positive mean diurnal air temperature was recorded nearly twice as frequently in Hornsund (47% of the year) as in the accumulation zone of Hansbreen (25% of the year). On account of continuing low air temperature in April caused by northerly and north-easterly cyclonic and anticyclonic situations, April was the only month without a PDD at any of the measuring stations.
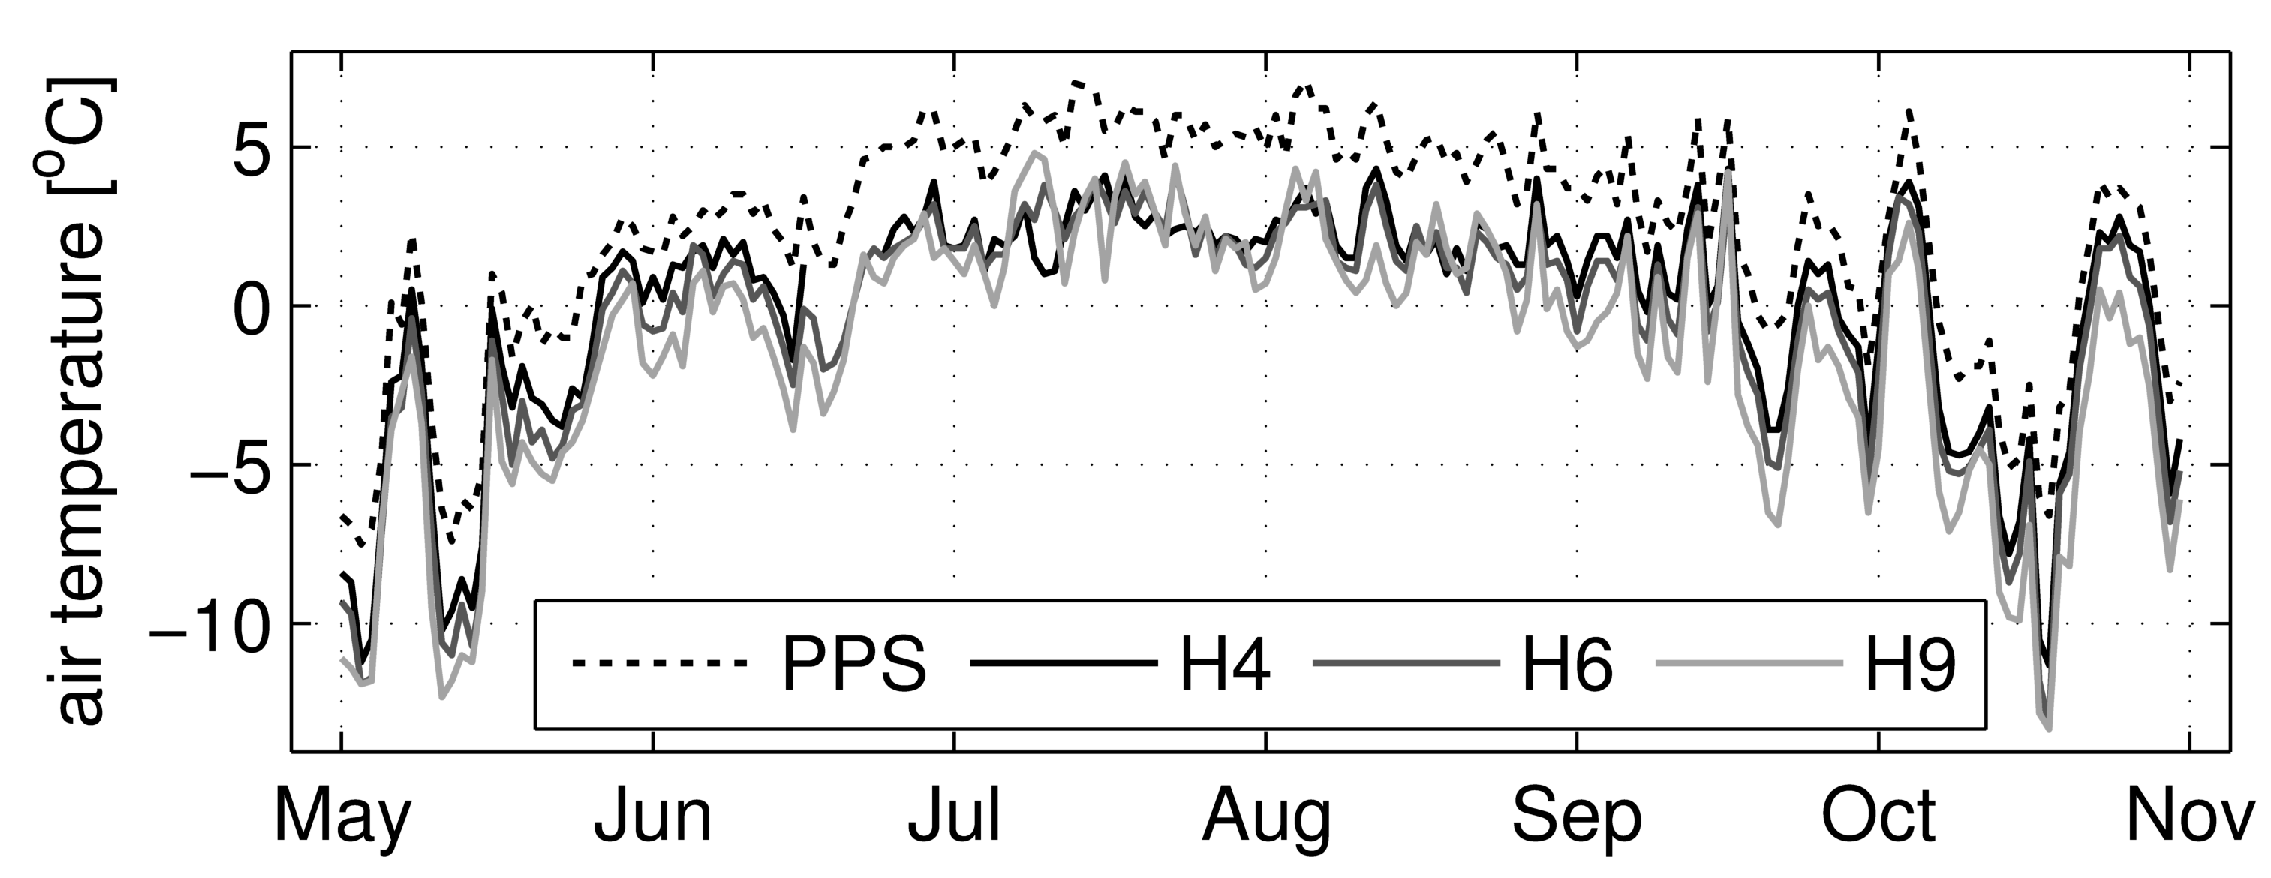
The melting period in the glacierized area started relatively late, i.e., only towards the end of the second half of May, and lasted until the beginning of October. An unusual meteorological situation was observed in the summer months, especially in July (on 16 days), when strong thermal inversions occurred, with the mean diurnal air temperature in the accumulation zone 3.6 °C higher than the temperature in the ablation zone (Figure 2).
In recent years, warm spells during winter months have been occurring more frequently, accompanied by liquid precipitation, so-called rain-on-snow events [29]. They are an important indicator of on-going climate change in the polar regions [38,39]. Occasionally, they even occur in highly elevated glacierized zones, and producing very compact layers in the snowpack—Melt-Freeze crusts (MFcr) and Ice Formations (IF), which slows down the meltwater percolation processes. This was the case on Hansbreen, where the share of these layers in the total snow depth exceeded 27% in the ablation zone, 20% at the equilibrium-line, and 12% in the accumulation zone (Table 3). The mean snow density was similar across the sites and amounted to c. 400 kg m−3. A noteworthy finding was the very low snow depth in the accumulation zones of the glaciers, on which the physical characteristics of the snow cover were measured in more detail.
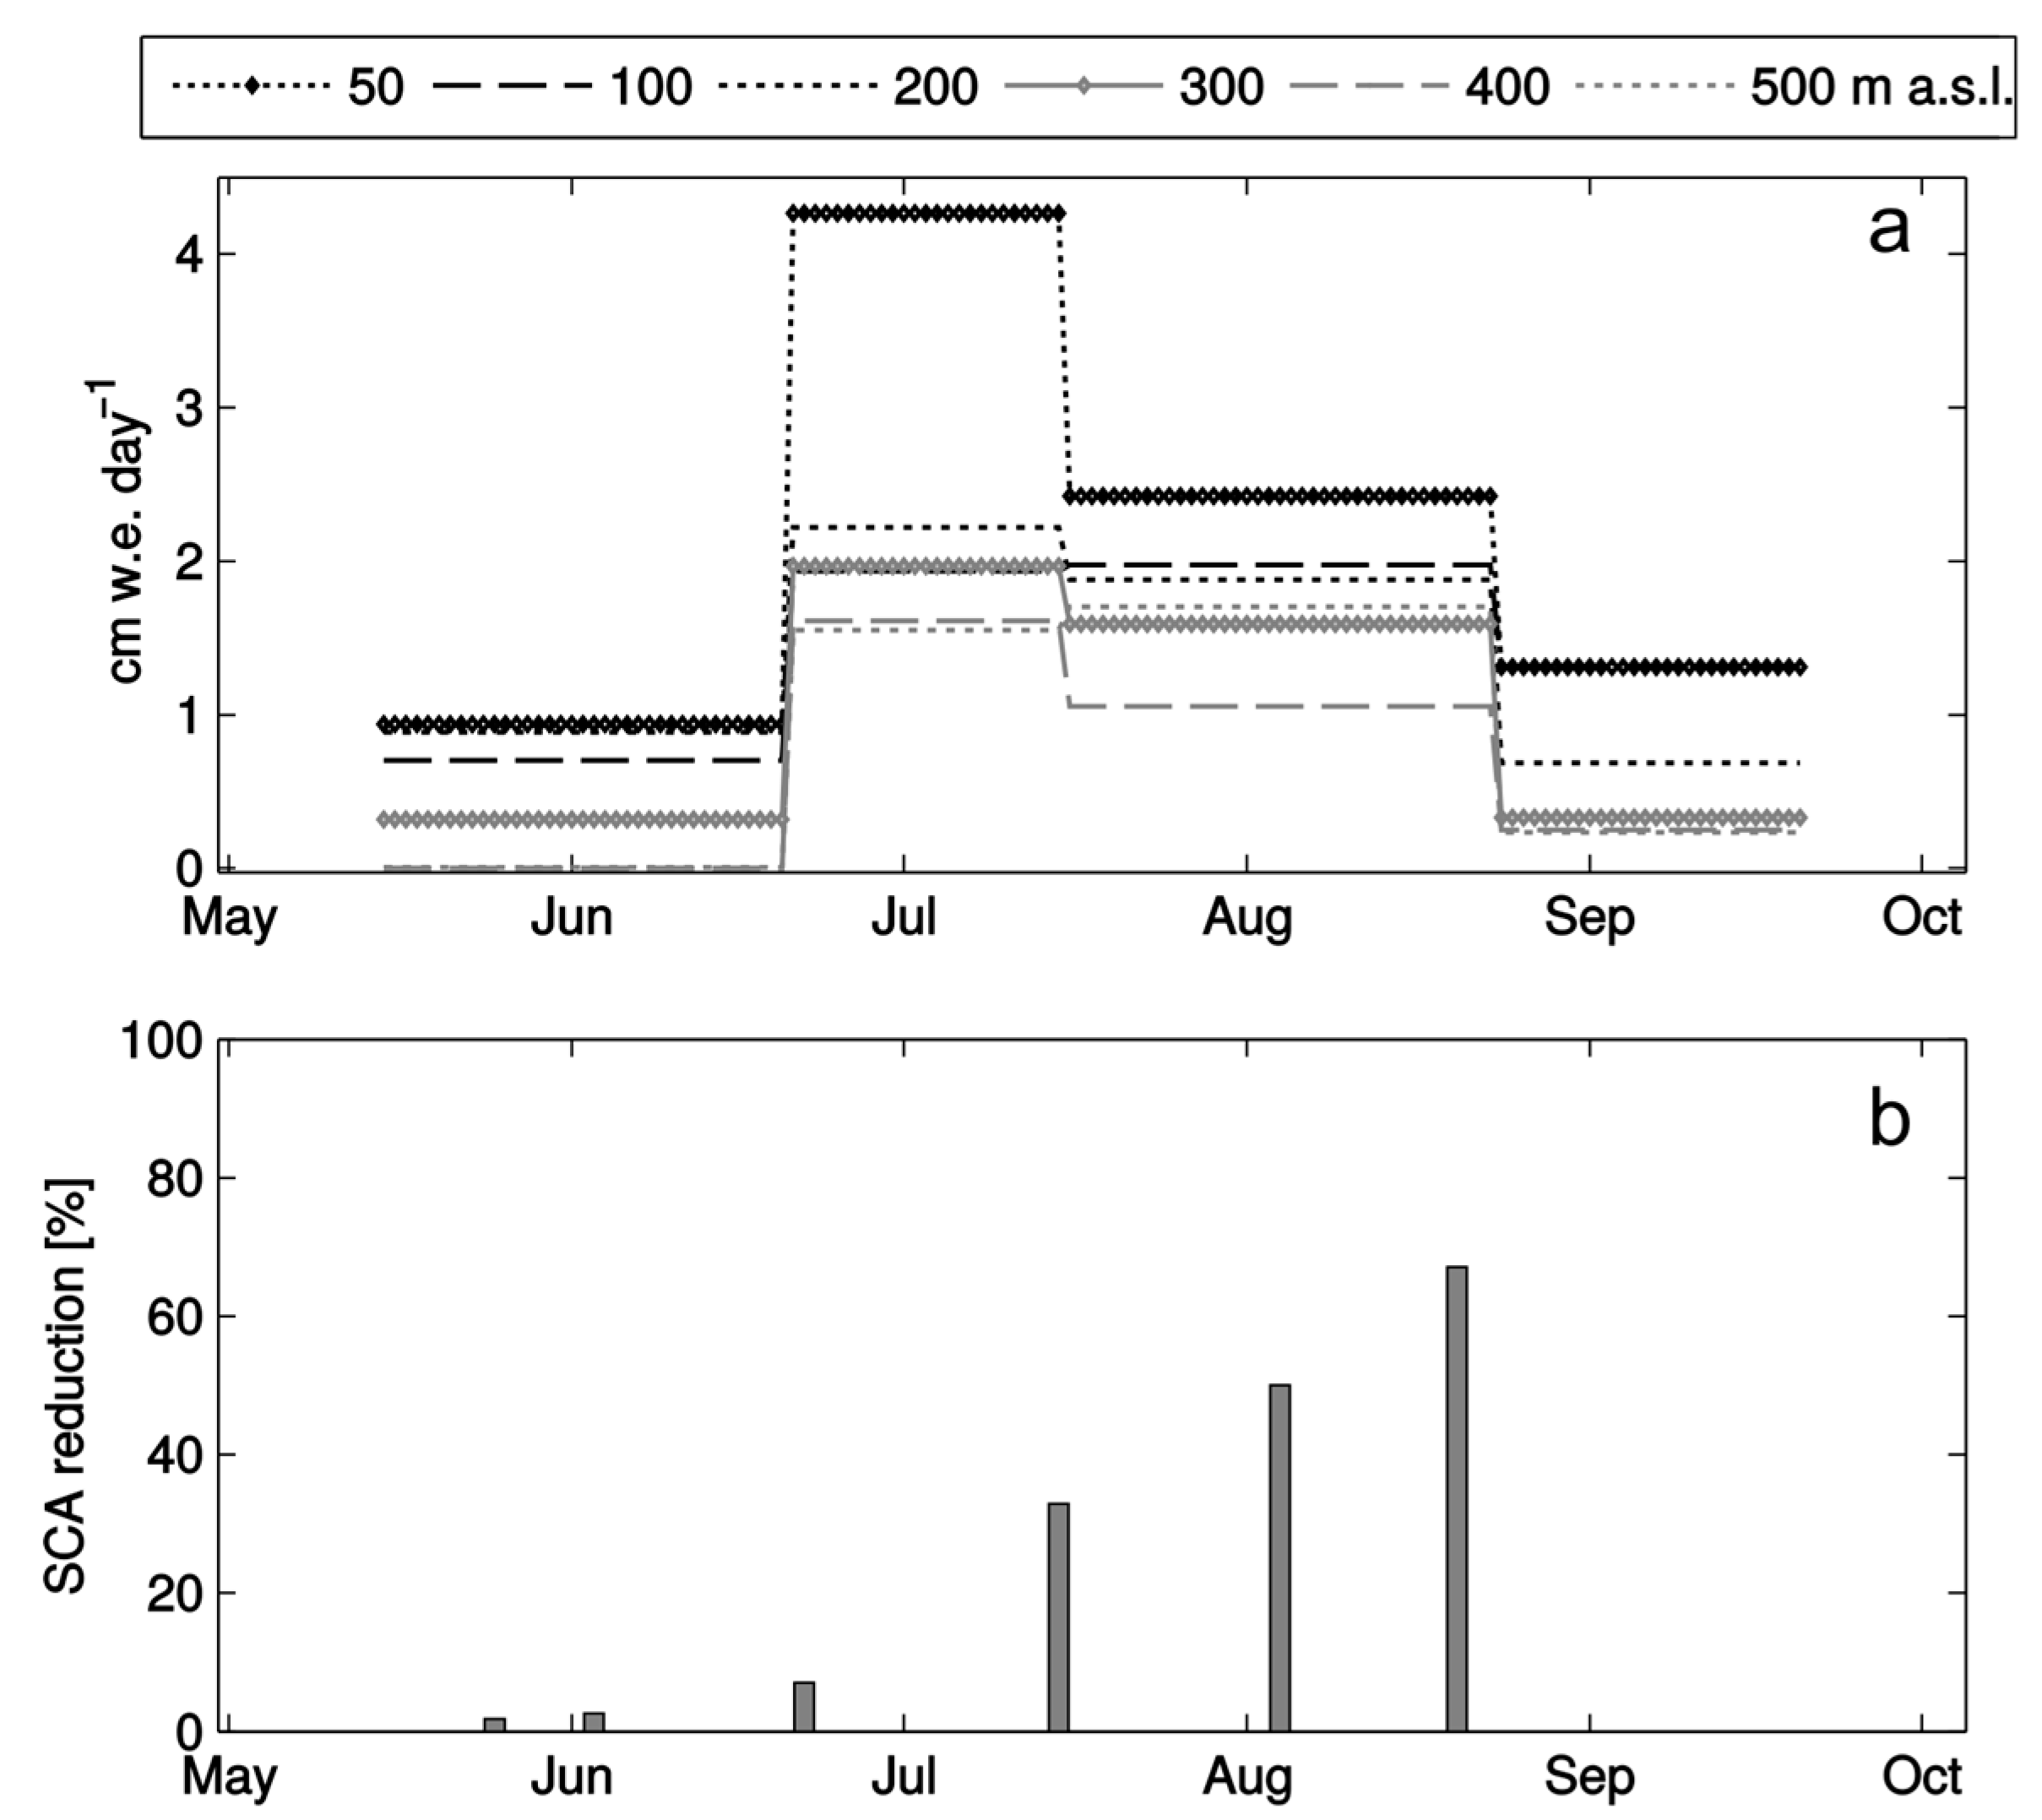
The measurements taken at the mass-balance stakes in 2014 show that the melting vertical gradient along the Hansbreen axis depends on the elevation, reaching c. −0.34 m w.e. 100 m−1. Figure 3 presents mean values of the surface melt rate per day, calculated for periods between observations. The melt rate at the lowermost ablation zone was three times higher than in the upper areas of the glacier, resulting in the lowering of the glacier by c. 2.44 m at the terminus. The highest melt rate was recorded in July, when most of the ablation zone lost its snow cover, which protects the glacier surface against increased absorption of shortwave solar radiation, due to higher albedo. In July and August, the snow cover melt rate in the uppermost part of Hansbreen (500 m a.s.l.) was higher than in the 400 m a.s.l. zone, which can be attributed to frequent thermal inversions and wind activity. The measuring point is located at the ice divide, whereby the air masses moving southwards cause snow transfer and reduce the snow cover. The summer balance 2014 at the individual sites on Hansbreen ranged between −0.88 m w.e. (400 m a.s.l.) and −2.72 m w.e. (50 m a.s.l.), amounting to −1.21 m. w.e. for the glacier as a whole, while the Equilibrium-Line Altitude (ELA) ran at 342 m. a.s.l. For the other glaciers, it ranged between 231 m a.s.l. (Mendelejevbreen) and 400 m a.s.l. (Paierlbreen), with an average of 345 m a.s.l. for Hornsund region.

4.2. Snow Cover Melting Characteristics of Hornsund Glaciers Based on Satellite Data

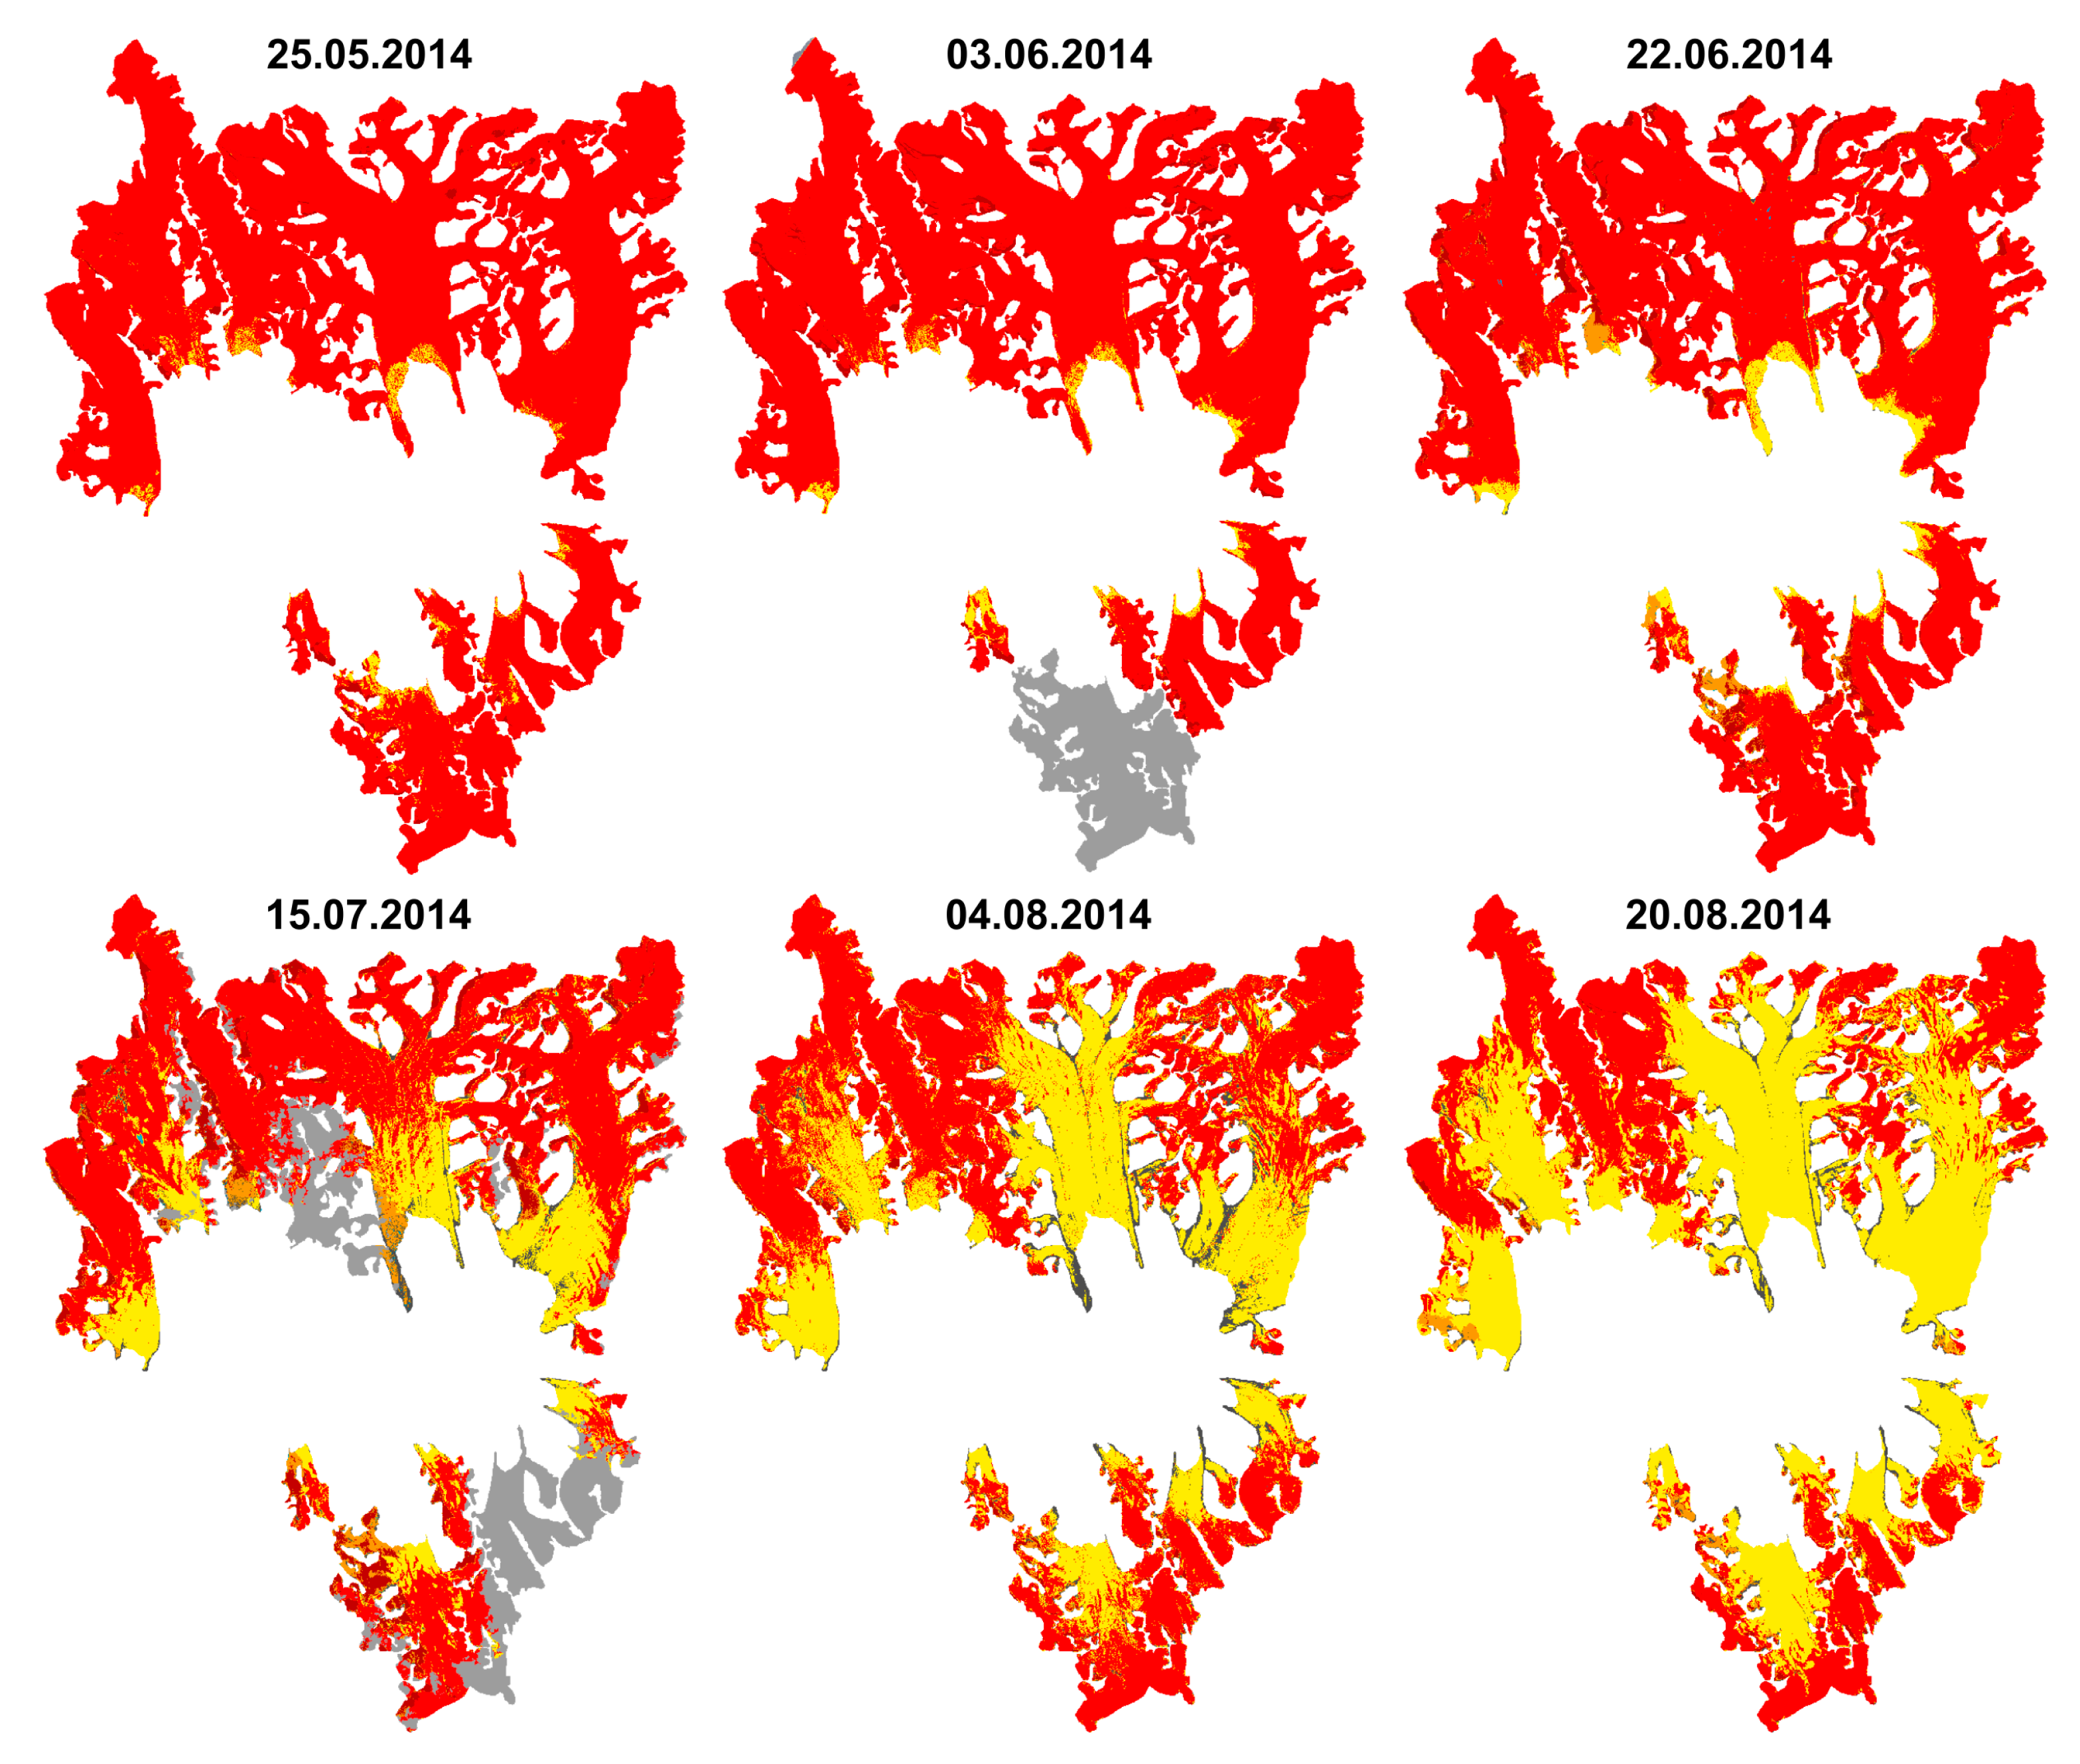
According to the field measurements and meteorological data, the accumulation period lasted until mid-May (see: Section 4.1). The first satellite image used in the analysis was from the end of May, when the surface melting processes had begun. At that time, the contribution of snow on the overall glacier surface reached 98%. The areas assigned to the ice class (2%) mainly include the highly crevassed termini (Figure 4).
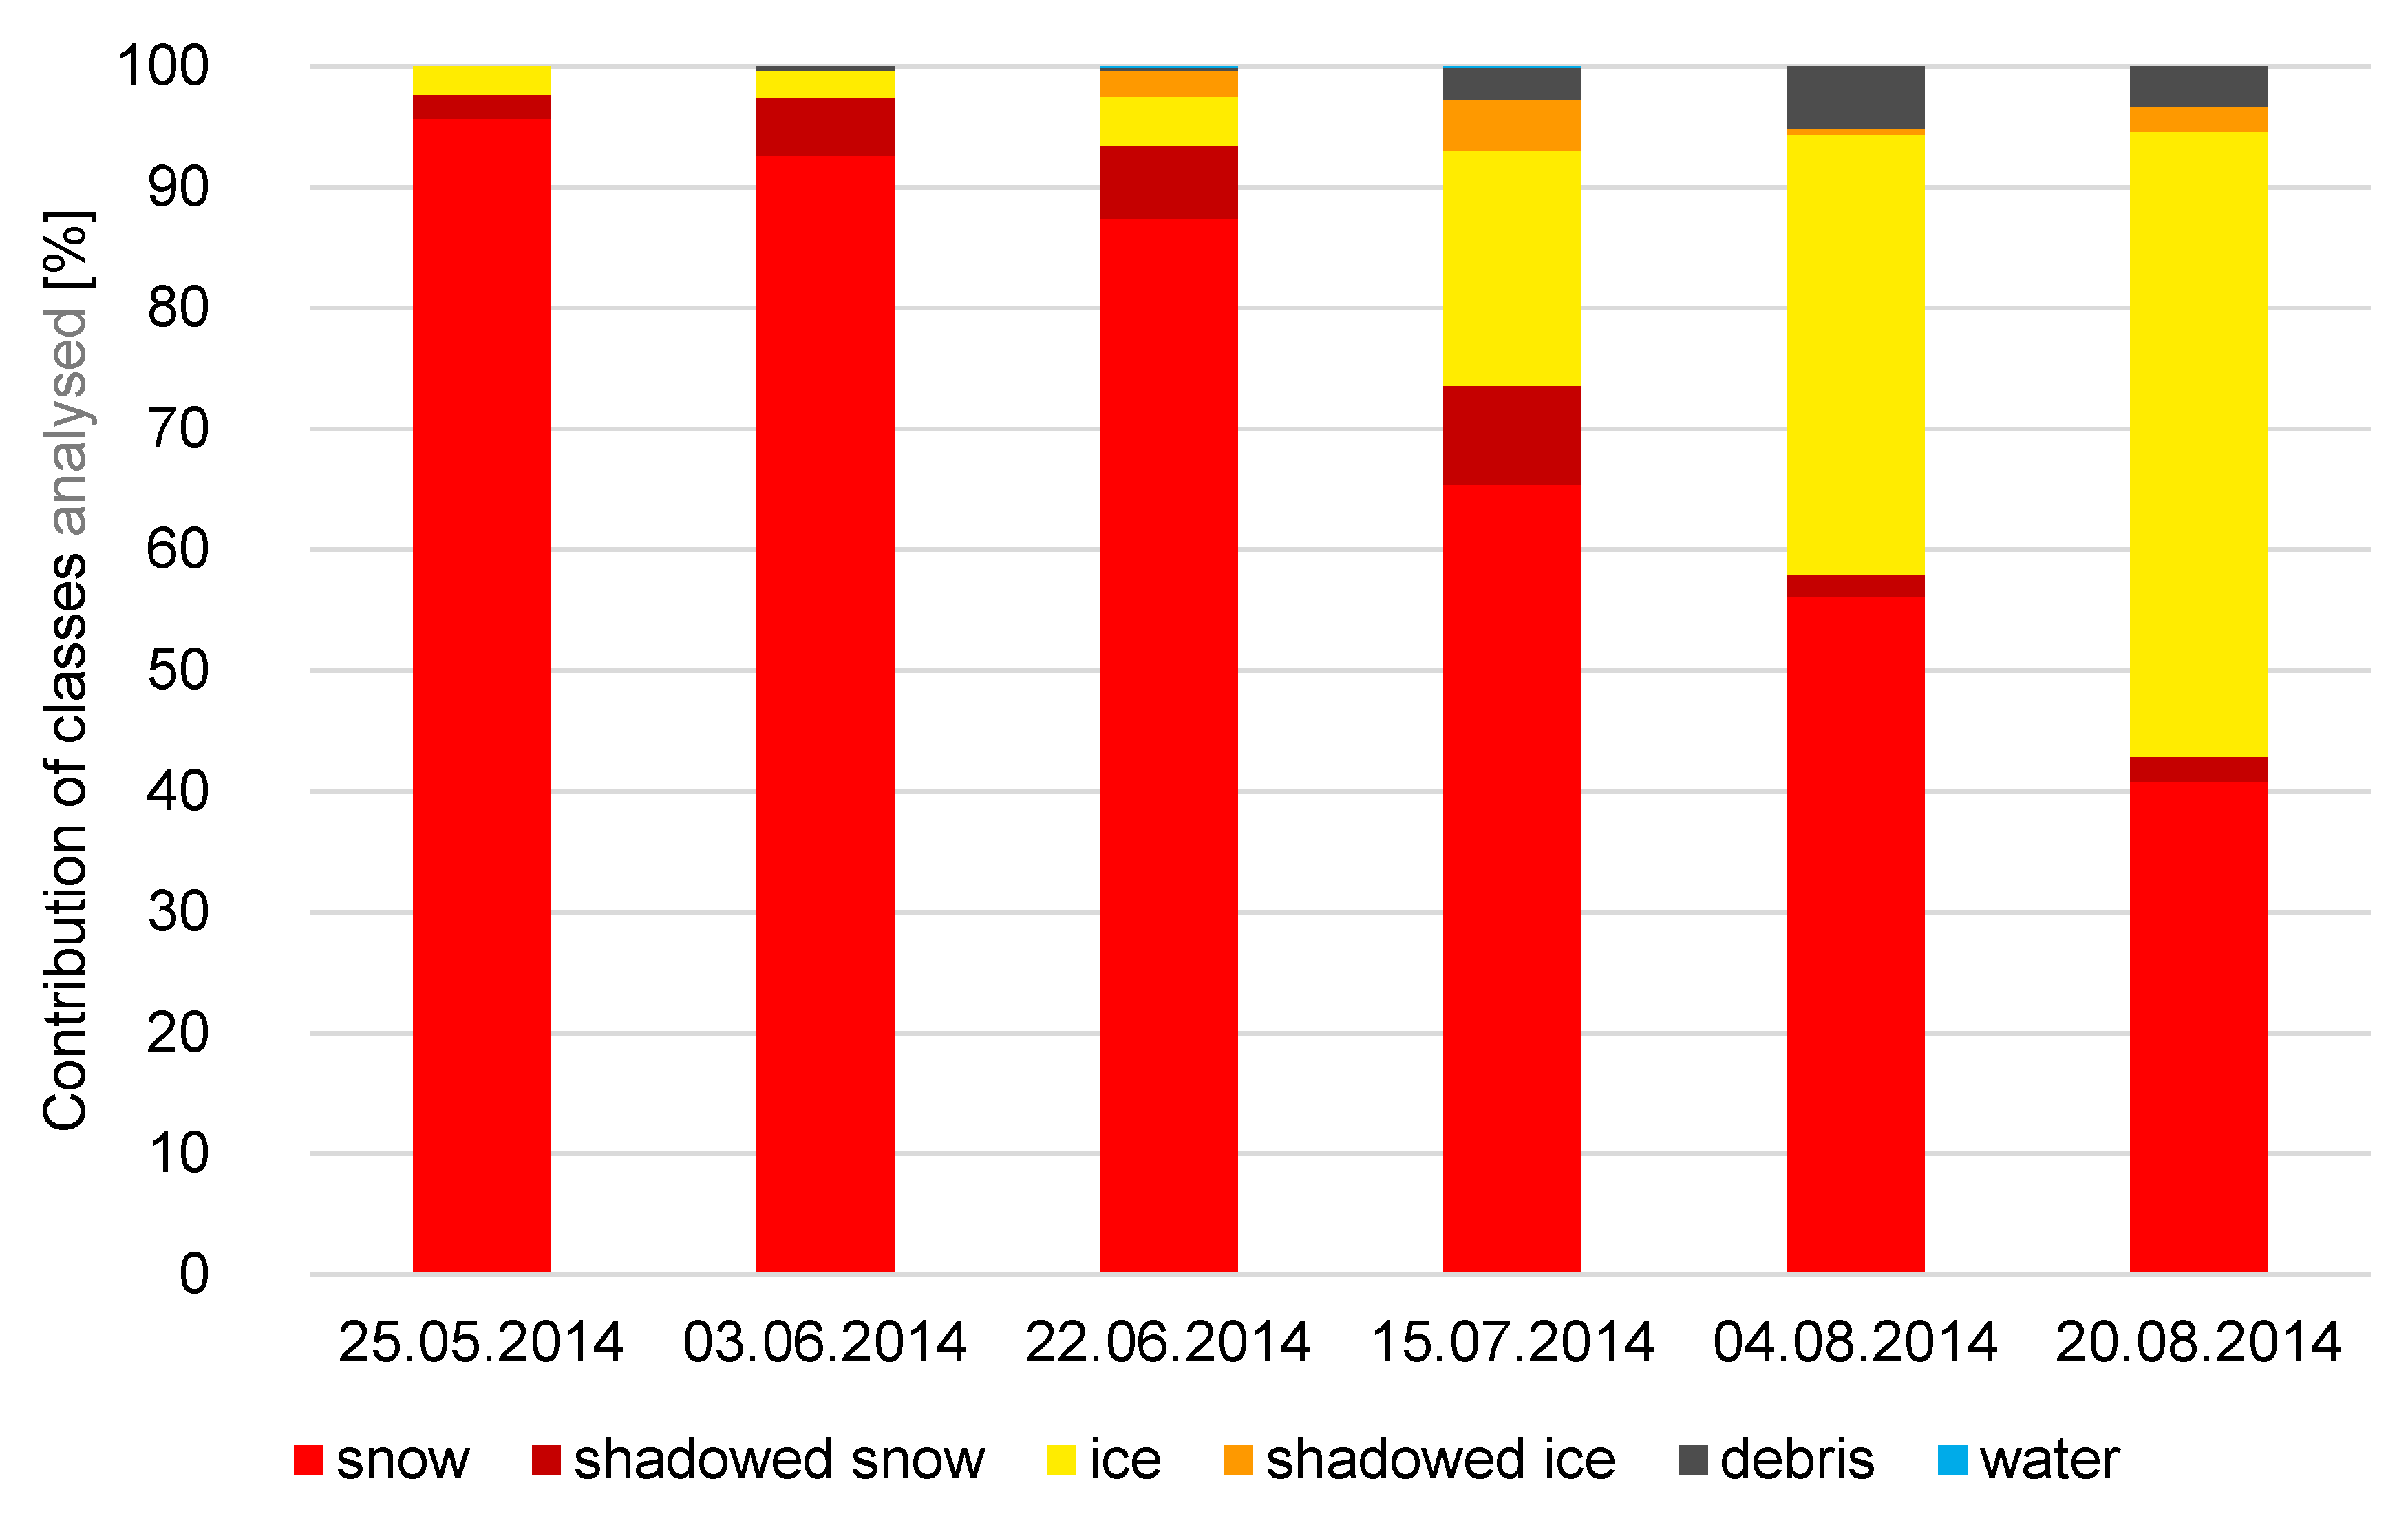
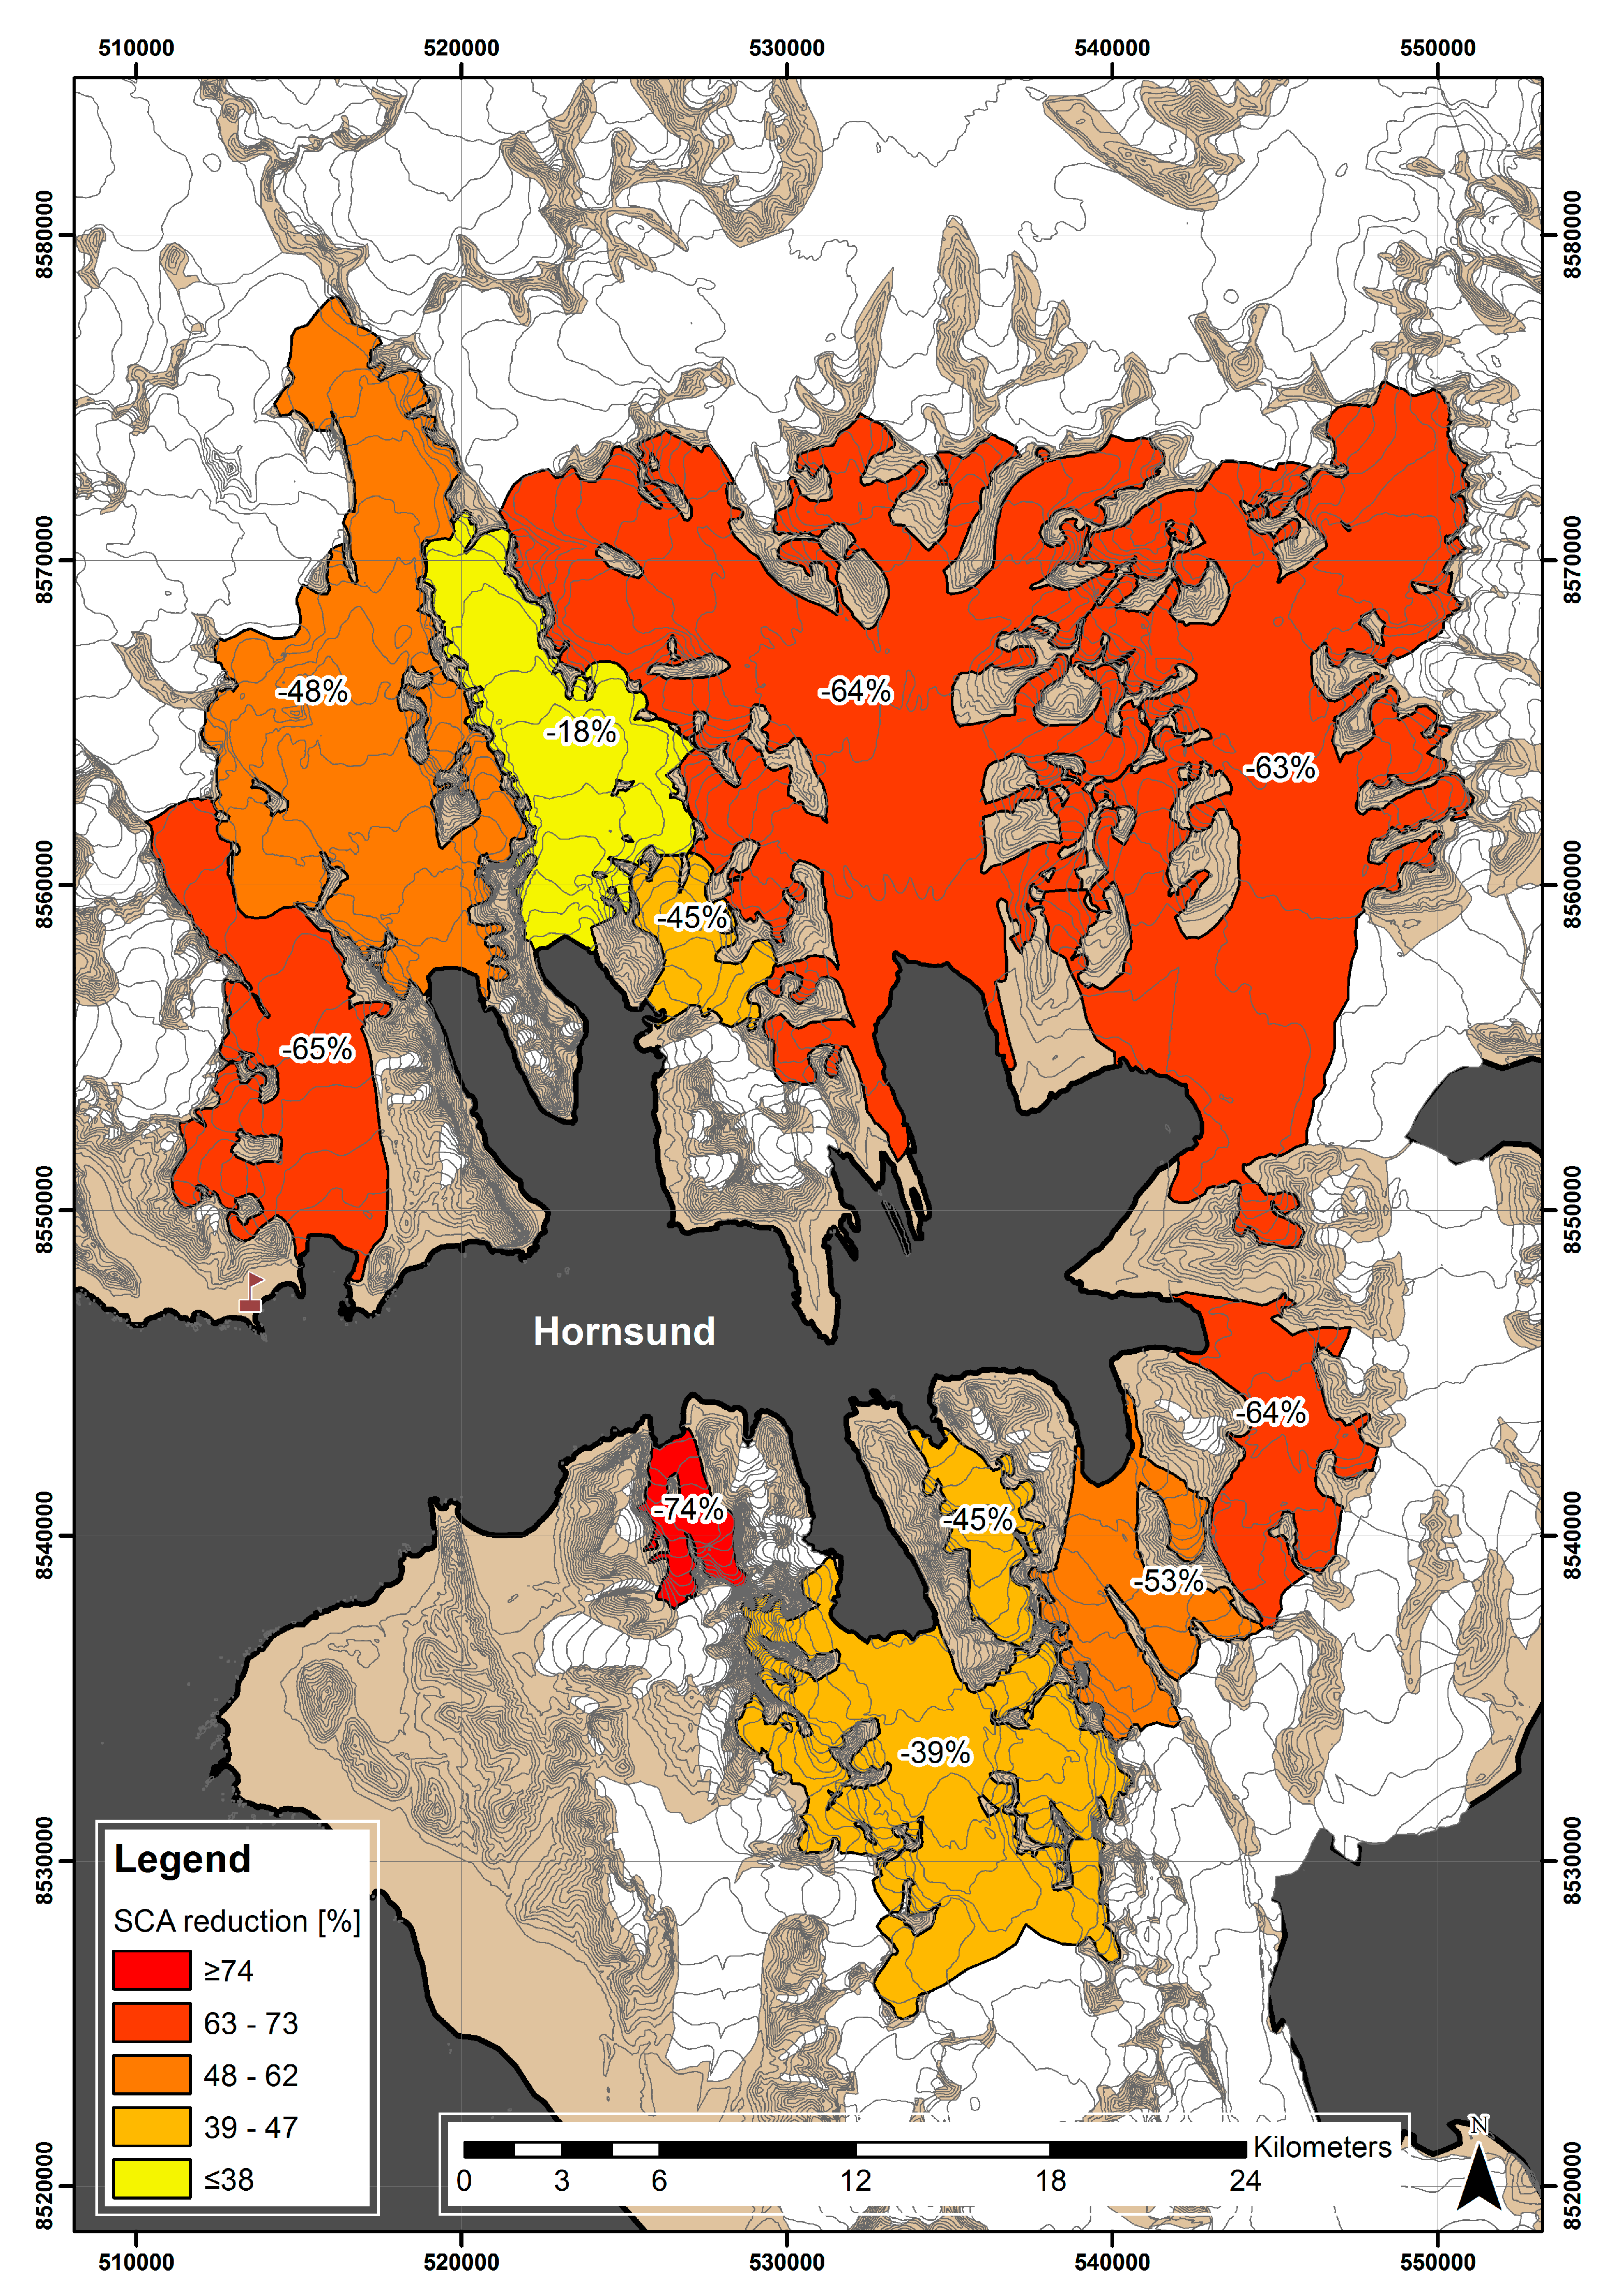
A noticeable reduction in the Snow-Covered Area (SCA) was seen at end of June, when the SCA was changing at a rate of −0.86% day−1. Consequently, the ice-covered area was gradually expanding, and by the end of August, the percentage of the ice class was 11% higher than that of the snow class (Figure 5). The total SCA reduction during the studied period equalled −0.56% day−1. When comparing the individual glaciers, the reduction of SCA varied considerably, ranging from −18% (Mühlbacherbreen) to −74% (Körberbreen) with an average of −52%. Mühlbacherbreen was the only glacier with insignificant SCA reduction. Previous papers focusing on snow distribution on Svalbard glaciers highlighted that interior areas are characterized by the local continental microclimate, where lower air temperature persists throughout the year [30,40,41]. This dependency is visible both on the northern and southern coasts of the Hornsund Fjord (Figure 6). The melting of the snow cover on Hornsund glaciers continued for several more weeks. However, the lack of later satellite data made further analysis impossible. The latest satellite image that was available, dated 21 September, had already been taken after the first snowfall episode.
From the beginning of August, a superimposed ice zone can be distinguished on the surface of some glaciers. During the classification, it was usually assigned to the accumulation zone (the snow class), with certain exceptions. However, it must be pointed out that separating superimposed ice exclusively by means of indirect methods is a highly subjective operation, requiring great interpretative experience and suitable in situ verification.
The setting that significantly improved the separation of snow from ice was the rejection of shortwave infrared bands (SWIR, band 6 and 7), even though they are widely used for the separation of cloud and snow [9]. In addition, band 9 (Cirrus), which is mainly used for cloud detection [34,42,43], was also disregarded in the classification since it generated an increased number of artefacts in areas characterised by low amount of clouds. However, rejecting the SWIR bands had a negative effect on automatic detection of the debris class—fortunately, the class was relatively infrequent, and the number of pixels which represented it was strictly controlled by decreasing the bias for the class and its threshold.
All the material available was characterised by a low value of sun elevation (Table 4), which highlighted the local topographic features of the glaciers, causing significant differences in the lighting of the surface and producing a high proportion of shadowed areas, reaching 12.5% in mid-July. Nevertheless, the classification allowed us to identify the type of the surface within those areas. Although, in general, shadowed snow was classified correctly, shadowed ice often included the debris class, and differentiating them was a major challenge in the classification process.
The earliest discernible loose moraine material on the surface of glaciers (debris) appeared in early June. Throughout the melting period, the contribution of debris class was only several percent, but it contributed to melting in a significant way. The class consists of gravel and rocks that heat easily and have the lowest albedo in the study area. This generates positive feedback which accelerates the melting of the adjacent snow and ice cover. The largest accumulation of debris was observed in early August. However, debris is difficult to classify at times of advanced melting because areas of glacier ice with low image tonality, like wide glacier crevasses, were often included in the class.
During the melting period, temporary supraglacial water bodies may appear on the surface of the glaciers. Most of them are small melt ponds (<0.005 km2), only occasionally reaching larger sizes. The largest supraglacial pond was located on the surface of Paierlbreen (0.21 km2) and was formed after the snow cover started to melt intensively. The lifetime of such melt ponds mainly depends on the timing at which the glacial drainage system opens, followed by feeding with meltwater from the glacier surface. Small ponds were seen from the beginning of June until the end of August. Of all the glaciers, the greatest number of such water bodies was observed on Storbreen, where the unique relief of the glacier, i.e., a vast flat area with a small inclination, a low crevasse level, and numerous depressions, is favourable to their seasonal formation. The extra water class was added to the images dated 22 June and 15 July, when the supraglacial ponds were distinct and filled with meltwater, even though their share of the overall area was negligible (0.09%).
With a suitable image quality (no clouds, higher pixel intensity) and length of the glacier terminus, Landsat imagery can also be used for observing the evolution of subglacial drainage systems and for identifying the meltwater outflows, where the water, rich in mineral material, leaves the glacial basins. Such points are present in all Hornsund glaciers, most often at the side parts of their termini. Large amounts of suspended sediment are discernible through their much lighter image tone on the surface of the fjord. The earliest signs of the sediment in its initial form were observed at the beginning of June in front of the Mühlbacherbreen, Storbreen, and Hornbreen. As the melting advanced, the drainage channels were unsealed, and the migration of meltwater became even more noticeable. The greatest turbidity of Hornsund waters was observed in mid-July, especially in the bays facing the termini of the largest glaciers (Storbreen and Hornbreen). This could be seen in all images until the end of August. The largest amounts of sediment are transported from the glaciers in Brepollen, which can be explained by the presence of the long capes of Treskelodden and Meranpynten (in the north and south, respectively), which divide the fjord, preventing the Hornsund waters from mixing. Towards the end of September, the bays facing the termini of the glaciers slowly started to freeze over.
Clouds were a natural factor hindering correct identification of classes. In the summer, considerable cloudiness is typical for the Hornsund area [27]. This is the factor that most significantly affects the quality of satellite data used in remote sensing analyses. For some glaciers, a cloud mask was applied: at the beginning of July (Samarinbreen) and in mid-July (Mendelejevbreen and Kvalfangarbreen). Due to extensive cloudiness, the remote sensing analyses in 2014 had to be discontinued in late August.
Of all the glaciers under study, the greatest problems with accurate classification were posed by those located on the southern side of the Hornsund Fjord. We assume that morphometric differences have an important effect on the quality of classification. The southern glaciers cut strongly into narrow valleys and landforms that are surrounded by higher mountain ranges, which generate more surface shadowing, and produce local cloudiness. In addition, they have a much smaller surface area. All this caused major interpretation difficulties, decreasing the accuracy of the classification results of those glaciers. However, the final results of each Landsat image have a very high kappa coefficient [44] and overall accuracy of over 95% [35], see: Table 4.

5. Discussion

The natural Arctic environment is undergoing radical transformation, which is mainly caused by increasing air temperature. The highest rate of warming in Europe, amounting to 3.9 °C per century, has been recorded on Svalbard [45], and out of the 35 years of meteorological observations in Hornsund, the investigated period has been the second warmest. Changes in temperature lead to increased frequency and intensity of warm spells and extension of the melting period [46,47]. The highest standard deviation from monthly mean values was seen in the winter months, which are crucial for the evolution of snow cover, corresponding with earlier studies [24,30,31]. Consequently, the snow depth in the accumulation zones of the glaciers in southern Spitsbergen, was lower in 2014, but not as low as in 2013 [30].
Winter warm spells are often accompanied by intensive rainfall, which freezes on the snow surface or just below it, creating layers of increased density, slowing down the percolation processes and further runoff of meltwater. Increased frequency of the rain-on-snow in recent years across the southern Spitsbergen is an important indicator of on-going climate change, also in other sectors of the Arctic [38,39,48]. RoS events started to be the indirectly investigated in the Hornsund area as early as the 1980s [49]. On Hansbreen, the contribution of the layers formed by those events to the snowpack is high, remaining above 25% in the ablation zone [24,30]. This translates into increased density of snow cover, which is c. 400 kg m−3 compared to the average for Svalbard of 370 kg m−3 [40].
Surface-based inversions, during which air temperature in the troposphere rises with height from the surface, are a frequent atmospheric phenomenon in high latitude climate, but are more characteristic for winters than summers [50,51]. Also, the inversion strength was much greater at that time [52]. In 2014, Hansbreen saw a reverse situation, with summer inversions accounting for 80% of the annual cases. In July, i.e., the warmest month, the phenomenon displayed the highest diurnal frequency, accelerating intensive melting processes in the upper areas of the glacial zones. A similar dependency was observed, e.g., in the Canadian Arctic [53].
The melting rate not only depends on air temperature, the energy balance of the surface, rain-on-snow events, or surface-based inversions, but also on surface reflectance. As a result of the differences between the albedo of snow and ice, the melt rate is lower during spells with the presence of continuous snow cover than in its absence, which means that the snowpack also plays the role of a natural protective layer against the intensification of melting processes [54]. Of all the glaciers in southern Spitsbergen, the longest series of glacial environment monitoring data is available for Hansbreen (since 1989), where several attempts have been already made to determine the snow cover melt rate in different seasons, using both statistical models based on positive-degree days [26], SR50 ultrasonic rangers [24,25], and mass-balance stake measurements [24]. In the above studies, the melt rate in the ablation zone (c. 200 m a.s.l.) ranged between 0.6 cm w.e. d−1 and 0.8 cm w.e. d−1, which is half the value calculated in this paper. As a result, one can assume that in 2014, the other glaciers of the Hornsund area were also characterised by above-average melting compared to previous years.
Snow cover is also a key element determining the glacial mass balance [55]. In recent years, the declining accumulation of snow cover on the Hornsund glaciers has not been able to compensate for the losses caused by its melting, which results in negative mass balance [30,31]. Similar trends are also observed in other Arctic areas [3]. Apart from surface ablation, ice calving significantly contributes to overall mass loss and represents on average 21% of the summer balance of the Svalbard glaciers [19].
The boundaries of the glacial basins were compared to the most recent measurements [8]. This was used to calculate the changes in the geometry of the glaciers terminating in the Hornsund Fjord, which were caused by calving and terminus retreat. In the years 2004–2014, the surface area of the glaciers decreased by a total of 19.53 km2 (−2.55% of the surface). The greatest changes were observed on Mendelejevbreen (−5.97%), and the least pronounced ones on Paierlbreen (−1.63%). Earlier studies in Sørkappland demonstrated a decrease in the areal extent by c. 18% between 1936 and 1991 [56]. In the scale of entire Svalbard, glaciers of Wedel Jarlsberg Land and Sørkappland are characterised by the lowest values of geodetic mass balance, −0.6–0.8 m w.e. y−1 [16], and are retreating faster, at c. 70 m y−1 [8], which implies that this area is among the fastest changing ones in the Arctic.
Another good indicator of the condition of glaciers in the context of recent climate change is the fluctuation of Equilibrium-Line Altitude [18]. The results obtained in this study were compared to the glaciological measurements from 1980 [18]. In 1980–2014, all the glaciers under study saw an increase in ELA, which averaged 78 m. Considering that the last satellite image available for 2014 was from the end of August, i.e., before the end of the melting period, the value is likely to be underestimated, even though the melt rate in September was rather low (see: Figure 3). Based on the final results of snow balance modelling, Uszczyk et al. [57] calculated a 71.5% SCA reduction on Hansbreen at the real end of melting season in 2014. The mentioned underestimation equalled c. 6.1% and might adequately represent other glaciers under study.
Remote sensing data supported by direct glaciological measurements provide valuable material, giving a better insight into the general spatial patterns of the melting processes on Svalbard glaciers, e.g., [15,16,17,58,59]. Attempts were made to use common automated snow identification methods, such as the Normalised Difference Snow Index, NDSI [36,60] and the Normalised Difference Snow and Ice Index, NDSII [61,62] as part of the work in order to compare the data with the results of the supervised classification. However, the attempts failed. In accordance with the studies cited above, the threshold value for snow cover detection is considered to be 0.4 (low probability of snow). Below this value, many non-snow pixels are identified as snow [60]. The indices calculated in the present study showed much higher values, also for ice-covered areas (>0.95). In our opinion, both snow indices display serious limitations when it comes to estimation of the melting characteristics of the snow cover present on glaciers because they fail to identify the transition between snow and glacier ice. A similar problem was raised by [63]. Mapping the extent of the temporary snow line and its position relative to the advance of melting was also abandoned. The highly non-continuous character of the snow line requires far-fetched generalisation and could lead to a significant error.

6. Conclusions

The year 2014 was the second warmest year since 1978. The low precipitation recorded in winter months and the high standard deviation from monthly mean air temperature resulted in reduced snow depth, which was observable in particular in the accumulation zones of the Hornsund glaciers. A noteworthy phenomenon was the presence of deep thermal inversions in the summer. Their share of the overall number of inversions during the year was 80%. July, which was the warmest month, saw the highest frequency of the inversions, adding to the intensive melting processes in the upper areas of the glaciers.
One of the factors slowing down the meltwater percolation and runoff processes is the internal structure of the snow cover, in particular the presence of very compact layers, such as Melt-Freeze Crusts and Ice Formations. In recent years, the winter months have seen a growing frequency of warm spells, with rain-on-snow events, which reach even highly elevated glacial zones, resulting in the presence of the above layers in the snowpack. Their share of the overall snow depth has been high in recent seasons, increasing the mean snow density.
The melting vertical gradient on Hansbreen amounted to −0.34 m w.e. 100 m−1, and the melt rate of the lowermost ablation zone was three times higher than in the upper parts of the glacier, causing significant surface lowering. The highest melt rate was observed in July, when most of the ablation zone had lost the snow cover which protects the surface of the glacier against increased absorption of short-wave solar radiation.
Landsat 8 data allowed for an effective analysis of the snow cover melting characteristics on Hornsund glaciers and the changes in their geometry, the mapping of the Equilibrium-Line Altitude, the evolution of supraglacial ponds, and the intensity of the outflow of meltwater with suspended organic matter into the fjord. The Snow-Covered Area, calculated for the entire study area, varied from 98% at the beginning of the melting season to 43% at the end of August, and was reduced considerably at a rate of −0.56% day−1 during the period under study. When comparing the individual glaciers, the total SCA reduction showed noticeable spatial diversity, which is related to local microclimatic and topographic conditions.
Very intensive surface melting continuing over longer periods leads to gradual transformation of entire glacial systems. In the years 1980–2014, all the glaciers terminating in the Hornsund Fjord saw an increase in ELA, while as a result of glacier calving and terminus retreat, their geometry also changed. In 2004–2014, the surface area of the glaciers reduced overall, i.e., by −2.55%. The greatest changes in the period were observed on Mendelejevbreen, and the least pronounced on Paierlbreen. The results indicate the future evolution of the natural environment of the Hornsund region.

Acknowledgments

The authors would like to thank the members of the 36th Expedition of the Institute of Geophysics, Polish Academy of Sciences and the participants in the spring expeditions to Hornsund for their help in preparing and carrying out field studies. Special thanks go to Bogdan Gądek, Jacek Jania, Ewa Łupikasza and Marta Bystrowska for their creative ideas and valuable comments. We are grateful to Małgorzata Błaszczyk, Mariusz Grabiec and Dariusz Ignatiuk for additional cartographical and glaciological data. The meteorological data used were obtained from Tomasz Budzik (AWS) and the Polish Polar Station Hornsund database (WMO 01003). This paper was supported by the following projects: Research Council of Norway Arctic Field Grant 2013: Spatial distribution of snow cover and drainage systems on the glaciers on Wedel Jarlsberg Land (RiS ID 6158); the National Science Centre PRELUDIUM 4: Role of meltwater from snow cover for supplying drainage systems of the Spitsbergen glaciers (2012/07/N/ST10/03784); National Centre for Research and Development within the Polish-Norwegian Research Cooperation Programme: AWAKE 2: Arctic climate system study of ocean, sea ice and glaciers interactions in the Svalbard area (Pol-Nor/198675/17/2013); statutory activities of the Ministry of Science and Higher Education of Poland (3841/E-41/S/2017). The publication has been financed from the funds of the Leading National Research Centre (KNOW) received by the Centre for Polar Studies for the period 2014–2018.

Author Contributions

Michał Laska designed the manuscript, performed snow studies and remote sensing measurements, analysed fieldwork results, supervised and wrote the paper. Barbara Barzycka improved the remote sensing analysis. Bartłomiej Luks prepared the mass balance data.

Conflicts of Interest

The authors declare no conflict of interest. The founding sponsors had no role in the design of the study; in the collection, analyses, or interpretation of data; in the writing of the manuscript, and in the decision to publish the results.

References

  1. Jonsell, U.; Hock, R.; Holmgren, B. Spatial and temporal variations in albedo on Storglaciären, Sweden. J. Glaciol. 2003, 49, 59–68. [Google Scholar] [CrossRef]
  2. Stocker, T.F.; Qin, D.; Plattner, G.-K.; Tignor, M.; Allen, S.K.; Boschung, J.; Nauels, A.; Xia, Y.; Bex, V.; Midgley, P.M. Climate Change 2013: The Physical Science Basis. Contribution of Working Group I to the Fifth Assessment Report of the Intergovernmental Panel on Climate Change (IPCC); Cambridge University: Cambridge, UK; New York, NY, USA, 2013; p. 1535. [Google Scholar]
  3. Zemp, M.; Gärtner-Roer, I.; Nussbaumer, S.U.; Hüsler, F.; Machguth, H.; Mölg, N.; Paul, F.; Hoelzle, M. Global Glacier Change Bulletin No. 1 (2012–2013); ICSU (WDS)/IUGG (IACS)/UNEP/UNESCO/WMO: Zürich, Switzerland, 2015; p. 230. [Google Scholar]
  4. Hanna, E.; Huybrechts, P.; Steffen, K.; Cappelen, J.; Huff, R.; Shuman, C.; Irvine-Fynn, T.; Wise, S.; Griffiths, M. Increased Runoff from Melt from the Greenland Ice Sheet: A Response to Global Warming. J. Clim. 2008, 21, 331–341. [Google Scholar] [CrossRef] [Green Version]
  5. Harper, J.; Humphrey, N.; Pfeffer, W.T.; Brown, J.; Fettweis, X. Greenland ice-sheet contribution to sea-level rise buffered by meltwater storage in firn. Nature 2012, 491, 240–243. [Google Scholar] [CrossRef] [PubMed]
  6. Dowdeswell, J.A.; Hagen, J.O. Arctic ice caps and glaciers. In Mass Balance of the Cryosphere: Observations and Modelling of Contemporary and Future Changes; Payne, A.J., Bamber, J.L., Eds.; Cambridge University Press: Cambridge, UK, 2004; pp. 527–558. [Google Scholar]
  7. Shepherd, A.; Ivins, E.R.; Geruo, A.; Barletta, V.R.; Bentley, M.J.; Bettadpur, S.; Briggs, K.H.; Bromwich, D.H.; Forsberg, R.; Galin, N.; et al. A reconciled estimate of ice-sheet mass balance. Science 2012, 338, 1183–1189. [Google Scholar] [CrossRef] [PubMed]
  8. Błaszczyk, M.; Jania, J.A.; Kolondra, L. Fluctuations of tidewater glaciers in Hornsund Fjord (southern Svalbard) since the beginning of the 20th century. Pol. Polar Res. 2013, 34, 327–352. [Google Scholar] [CrossRef]
  9. Lang, C.; Fettweis, X.; Erpicum, M. Stable climate and surface mass balance in Svalbard over 1979–2013 despite the arctic warming. Cryosphere 2015, 9, 83–101. [Google Scholar] [CrossRef]
  10. Aas, K.S.; Dunse, T.; Collier, E.; Schuler, T.V.; Berntsen, T.K.; Kohler, J.; Luks, B. The climatic mass balance of Svalbard glaciers: A 10-year simulation with a coupled atmosphere-glacier mass balance model. Cryosphere 2016, 10, 1089–1104. [Google Scholar] [CrossRef]
  11. Østby, T.I.; Schuler, T.V.; Hagen, J.O.; Hock, R.; Kohler, J.; Reijmer, C.H. Diagnosing the decline in climatic mass balance of glaciers in Svalbard over 1957–2014. Cryosphere 2017, 11, 191–215. [Google Scholar] [CrossRef]
  12. König, M.; Winther, J.-G.; Isaksson, E. Measuring snow and glacier ice properties from satellite. Rev. Geophys. 2001, 39, 1–27. [Google Scholar] [CrossRef]
  13. Nolin, A.W. Recent advances in remote sensing of seasonal snow. J. Glaciol. 2010, 56, 1141–1150. [Google Scholar] [CrossRef]
  14. Jania, J. Dynamiczne Procesy Glacjalne na Południowym Spitsbergenie (w Świetle Badań Fotointerpretacyjnych i Fotogrametrycznych) [Dynamic Glacial Processes in South Spitsbergen (in the Light of Photointerpretation and Photogrammetric Research)]. Habilitation Thesis, University of Silesia, Katowice, Poland, 1988. [Google Scholar]
  15. Greuell, W.; Kohler, J.; Obleitner, F.; Głowacki, P.; Melvold, K.; Bernsen, E.; Oerlemans, J. Assessment of interannual variations in the surface mass balance of 18 Svalbard glaciers from the Moderate Resolution Imaging Spectroradiometer/Terra albedo product. J. Geophys. Res. Atmos. 2007, 112, D07105. [Google Scholar] [CrossRef]
  16. Moholdt, G.; Nuth, C.; Hagen, J.O.; Kohler, J. Recent elevation changes of Svalbard glaciers derived from icesat laser altimetry. Remote Sens. Environ. 2010, 114, 2756–2767. [Google Scholar] [CrossRef]
  17. Nuth, C.; Moholdt, G.; Kohler, J.; Hagen, J.O.; Kääb, A. Svalbard glacier elevation changes and contribution to sea level rise. J. Geophys. Res. Earth Surf. 2010, 115, F01008. [Google Scholar] [CrossRef]
  18. Hagen, J.O.; Olav, L.; Roland, E.; Jørgensen, T. Glacier Atlas of Svalbard and Jan Mayen; Norsk Polarinstitutt: Oslo, Norway, 1993; p. 141. [Google Scholar]
  19. Błaszczyk, M.; Jania, J.; Hagen, J.O. Tidewater glaciers of Svalbard: Recent changes and estimates of calving fluxes. Pol. Polar Res. 2009, 30, 85–142. [Google Scholar]
  20. Nuth, C.; Kohler, J.; König, M.; von Deschwanden, A.; Hagen, J.O.; Kääb, A.; Moholdt, G.; Pettersson, R. Decadal changes from a multi-temporal glacier inventory of Svalbard. Cryosphere 2013, 7, 1603–1621. [Google Scholar] [CrossRef] [Green Version]
  21. Muckenhuber, S.; Nilsen, F.; Korosov, A.; Sandven, S. Sea ice cover in Isfjorden and Hornsund, Svalbard (2000–2014) from remote sensing data. Cryosphere 2016, 10, 149–158. [Google Scholar] [CrossRef]
  22. Baranowski, S. The Subpolar Glaciers of Spitsbergen Seen Against the Climate of This Region; No. 410; Acta Universitatis Wratislaviensis: Wrocław, Poland, 1977; p. 93. [Google Scholar]
  23. Głowicki, B. Snow and firn patches between Hornsund and Werenskiold Glacier. Acta Univ. Wratislav. 1975, 251, 139–146. [Google Scholar]
  24. Laska, M.; Luks, B.; Budzik, T. Influence of snowpack internal structure on snow metamorphism and melting intensity on Hansbreen, Svalbard. Pol. Polar Res. 2016, 37, 193–218. [Google Scholar] [CrossRef]
  25. Migała, K.; Piwowar, B.A.; Puczko, D. A meteorological study of the ablation process on Hans Glacier, SW Spitsbergen. Pol. Polar Res. 2006, 27, 243–258. [Google Scholar]
  26. Szafraniec, J. Influence of positive degree-days and sunshine duration on the surface ablation of Hansbreen, Spitsbergen glacier. Pol. Polar Res. 2002, 23, 227–240. [Google Scholar]
  27. Marsz, A.A.; Styszyńska, A. Climate and Climate Change at Hornsund, Svalbard; Gdynia Maritime University: Gdynia, Poland, 2013. [Google Scholar]
  28. Marsz, A.A. Air temperature. In Climate and Climate Change at Hornsund, Svalbard; Marsz, A.A., Styszyńska, A., Eds.; Gdynia Maritime University: Gdynia, Poland, 2013; pp. 145–187. [Google Scholar]
  29. Łupikasza, E. Atmospheric precipitation. In Climate and Climate Change at Hornsund, Svalbard; Marsz, A.A., Styszyńska, A., Eds.; Gdynia Maritime University: Gdynia, Poland, 2013; pp. 199–211. [Google Scholar]
  30. Laska, M.; Grabiec, M.; Ignatiuk, D.; Budzik, T. Snow deposition patterns on southern Spitsbergen glaciers, Svalbard, in relation to recent meteorological conditions and local topography. Geogr. Ann. Ser. A Phys. Geogr. 2017, 99, 262–287. [Google Scholar]
  31. Grabiec, M.; Jania, J.; Puczko, D.; Kolondra, L.; Budzik, T. Surface and bed morphology of Hansbreen, a tidewater glacier in Spitsbergen. Pol. Polar Res. 2012, 33, 111–138. [Google Scholar] [CrossRef]
  32. Sobota, I. Snow accumulation, melt, mass loss, and the near-surface ice temperature structure of Irenebreen, Svalbard. Polar Sci. 2011, 5, 327–336. [Google Scholar] [CrossRef]
  33. Fierz, C.; Armstrong, R.L.; Durand, Y.; Etchevers, P.; Greene, E.; Mcclung, D.M.; Nishimura, K.; Satyawali, P.K.; Sokratov, S.A. The International Classification for Seasonal Snow on the Ground; IACS Contribution No. 1; UNESCO-IHP: Paris, France, 2009; p. 90. [Google Scholar]
  34. Department of the Interior U.S. Geological Survey. Landsat 8 (L8) Data Users Handbook; Earth Resources Observation and Science (EROS) Center: Sioux Falls, SD, USA, 2016; p. 106.
  35. Lillesand, T.; Kiefer, R.W.; Chipman, J. Remote Sensing and Image Interpretation, 6th ed.; John Wiley & Sons: New York, NY, USA, 2008. [Google Scholar]
  36. Dozier, J. Spectral signature of alpine snow cover from the Landsat Thematic Mapper. Remote Sens. Environ. 1989, 28, 9–22. [Google Scholar] [CrossRef]
  37. Łaszyca, E.; Perchaluk, J.; Kępski, D.; Górski, Z.; Wawrzyniak, T. Meteorological Bulletin. Spitsbergen–Hornsund. Summary of the Year 2014; Institute of Geophysics, Polish Academy of Sciences: Warsaw, Poland, 2015; p. 20. [Google Scholar]
  38. Cohen, J.; Ye, H.; Jones, J. Trends and variability in rain-on-snow events. Geophys. Res. Lett. 2015, 42, 7115–7122. [Google Scholar] [CrossRef]
  39. Hansen, B.B.; Isaksen, K.; Benestad, R.E.; Kohler, J.; Pedersen, Å.Ø.; Loe, L.E.; Coulson, S.J.; Larsen, J.O.; Varpe, Ø. Warmer and wetter winters: Characteristics and implications of an extreme weather event in the High Arctic. Environ. Res. Lett. 2014, 9, 114021. [Google Scholar] [CrossRef]
  40. Winther, J.G.; Bruland, O.; Sand, K.; Killingtveit, Å.; Marechal, D. Snow accumulation distribution on Spitsbergen, Svalbard, in 1997. Polar Res. 1998, 17, 155–164. [Google Scholar] [CrossRef]
  41. Sand, K.; Winther, J.-G.; Maréchal, D.; Bruland, O.; Melvold, K. Regional variations of snow accumulation on Spitsbergen, Svalbard, 1997–99. Hydrol. Res. 2003, 34, 17–32. [Google Scholar]
  42. Shen, Y.; Wang, Y.; Lv, H.; Qian, J. Removal of thin clouds in Landsat-8 OLI data with independent component analysis. Remote Sens. 2015, 7, 11481–11500. [Google Scholar] [CrossRef]
  43. Xu, M.; Jia, X.; Pickering, M. Automatic cloud removal for Landsat 8 OLI images using cirrus band. In Proceedings of the 2014 IEEE Geoscience and Remote Sensing Symposium, Quebec City, QC, Canada, 13–18 July 2014; pp. 2511–2514. [Google Scholar]
  44. Cohen, J. A coefficient of agreement for nominal scales. Educ. Psychol. Meas. 1960, 20, 37–46. [Google Scholar] [CrossRef]
  45. Nordli, Ø.; Przybylak, R.; Ogilvie, A.E.J.; Isaksen, K. Long-term temperature trends and variability on Spitsbergen: The extended Svalbard Airport temperature series, 1898–2012. Polar Res. 2014, 33, 21349. [Google Scholar] [CrossRef]
  46. McBean, G.; Alekseev, G.; Førland, E.J.; Fyfe, J.; Groisman, P.Y.; King, R.; Melling, H.; Vose, R.; Whitfield, P.H. Arctic Climate: Past and Present; Cambridge University: Cambridge, UK, 2005; pp. 21–60. [Google Scholar]
  47. Vikhamar-Schuler, D.; Isaksen, K.; Haugen, J.E.; Tømmervik, H.; Luks, B.; Schuler, T.V.; Bjerke, J.W. Changes in winter warming events in the Nordic Arctic region. J. Clim. 2016, 29, 6223–6244. [Google Scholar] [CrossRef]
  48. Forbes, B.C.; Kumpula, T.; Meschtyb, N.; Laptander, R.; Macias-Fauria, M.; Zetterberg, P.; Verdonen, M.; Skarin, A.; Kim, K.-Y.; Boisvert, L.N.; et al. Sea ice, rain-on-snow and tundra reindeer nomadism in Arctic Russia. Biol. Lett. 2016, 12. [Google Scholar] [CrossRef] [PubMed]
  49. Leszkiewicz, J.; Pulina, M. Snowfall phases in analysis of a snow cover in Hornsund, Spitsbergen. Pol. Polar Res. 1999, 20, 3–24. [Google Scholar]
  50. Seidel, D.J.; Ao, C.O.; Li, K. Estimating climatological planetary boundary layer heights from radiosonde observations: Comparison of methods and uncertainty analysis. J. Geophys. Res. 2010, 115, D16113. [Google Scholar] [CrossRef]
  51. Zhang, Y.; Seidel, D.J.; Golaz, J.-C.; Deser, C.; Tomas, R.A. Climatological characteristics of Arctic and Antarctic surface-based inversions. J. Clim. 2011, 24, 5167–5186. [Google Scholar] [CrossRef]
  52. Devasthale, A.; Willén, U.; Karlsson, K.G.; Jones, C.G. Quantifying the clear-sky temperature inversion frequency and strength over the Arctic Ocean during summer and winter seasons from airs profiles. Atmos. Chem. Phys. 2010, 10, 5565–5572. [Google Scholar] [CrossRef] [Green Version]
  53. Chutko, K.J.; Lamoureux, S.F. The influence of low-level thermal inversions on estimated melt-season characteristics in the central Canadian Arctic. Int. J. Climatol. 2009, 29, 259–268. [Google Scholar] [CrossRef]
  54. Grabiec, M. Stan I Współczesne Zmiany Systemów Lodowcowych Svalbardu, Południowego Spitsbergenu w Świetle Badań Metodami Radarowymi [The State and Contemporary Changes of Glacial Systems in Svalbard, Southern Spitsbergen in the Light of Radar Methods]. Habilitation Thesis, University of Silesia, Katowice, Poland, 2017. [Google Scholar]
  55. Benn, D.I.; Evans, D.J.A. Glaciers and Glaciation, 2nd ed.; Hodder Education: London, UK, 2010. [Google Scholar]
  56. Ziaja, W. Glacial recession in Sørkappland and central Nordenskiöldland, Spitsbergen, Svalbard, during the 20th century. Arct. Antarct. Alp. Res. 2001, 33, 36–41. [Google Scholar] [CrossRef]
  57. Uszczyk, A.; Grabiec, M.; Laska, M.; Jania, J.; Kuhn, M.; Ignatiuk, D.; Pętlicki, M.; Budzik, T. Distributed water equivalent of snowmelt in an exceptionally warm year on Hansbreen, Svalbard. Pol. Polar Res. In review.
  58. Kääb, A. Glacier volume changes using ASTER satellite stereo and ICESat GLAS laser altimetry. A test study on Edgeøya, Eastern Svalbard. IEEE Trans. Geosci. Remote Sens. 2008, 46, 2823–2830. [Google Scholar] [CrossRef]
  59. Moholdt, G.; Hagen, J.O.; Eiken, T.; Schuler, T.V. Geometric changes and mass balance of the Austfonna ice cap, Svalbard. Cryosphere 2010, 4, 21–34. [Google Scholar] [CrossRef] [Green Version]
  60. Hall, D.K.; Riggs, G.A.; Salomonson, V.V. Development of methods for mapping global snow cover using Moderate Resolution Imaging Spectroradiometer data. Remote Sens. Environ. 1995, 54, 127–140. [Google Scholar] [CrossRef]
  61. Keshri, A.K.; Shukla, A.; Gupta, R.P. ASTER ratio indices for supraglacial terrain mapping. Int. J. Remote Sens. 2009, 30, 519–524. [Google Scholar] [CrossRef]
  62. Xiao, X.; Shen, Z.; Qin, X. Assessing the potential of vegetation sensor data for mapping snow and ice cover: A Normalized Difference Snow and Ice Index. Int. J. Remote Sens. 2001, 22, 2479–2487. [Google Scholar] [CrossRef]
  63. Man, Q.X.; Guo, H.D.; Liu, G.; Dong, P.L. Comparison of different methods for monitoring glacier changes observed by Landsat images. IOP Conf. Ser. Earth Environ. Sci. 2014, 17, 012127. [Google Scholar] [CrossRef]
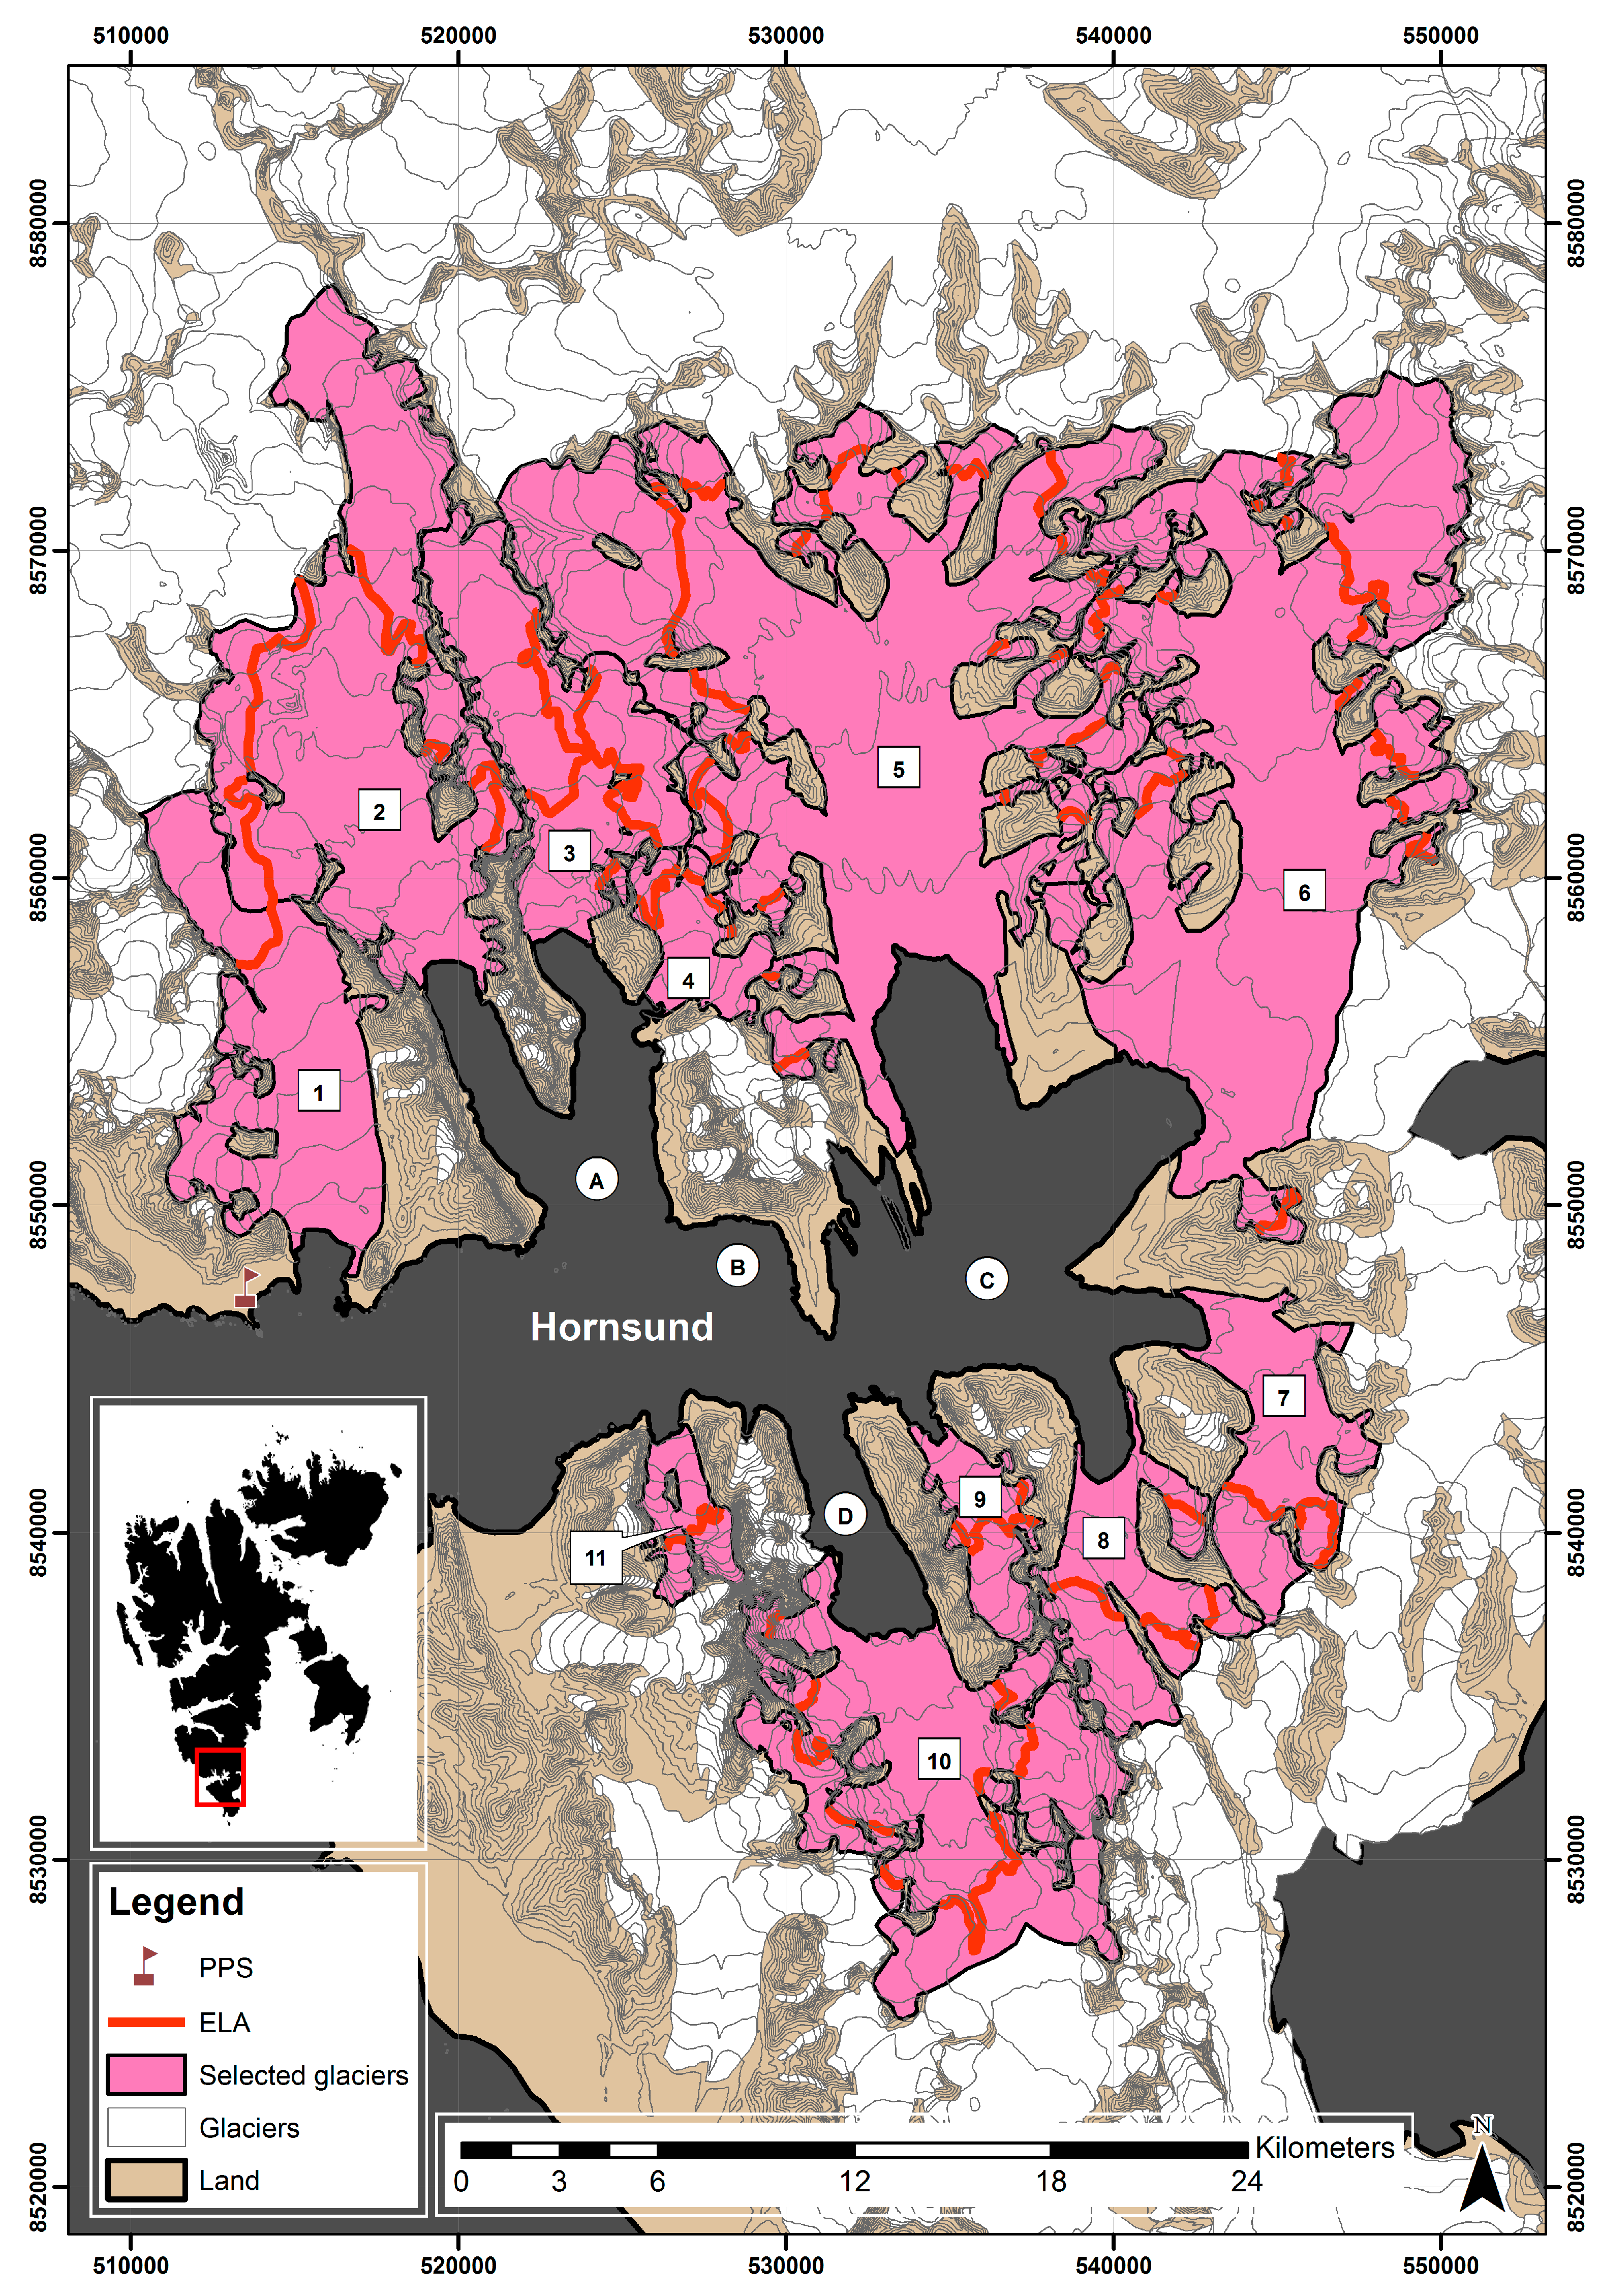
Figure 1. Study area: (PPS) Polish Polar Station Hornsund; (ELA) Equilibrium-Line Altitude in 2014; selected glaciers: (1) Hansbreen; (2) Paierlbreen; (3) Mühlbacherbreen; (4) Kvalfangarbreen; (5) Storbreen; (6) Hornbreen; (7) Svalisbreen; (8) Mendelejevbreen; (9) Chomjakovbreen; (10) Samarinbreen; (11) Körberbreen; selected bays: (A) Burgerbukta; (B) Adriabukta; (C) Brepollen; (D) Samarinvågen. The 50 m contour lines are based on the Digital Terrain Model (2014) published by the Norwegian Polar Institute. The glacier basin boundaries follow [8] with reshaped glacier termini from the end of melting period in 2014.
Water 09 00804 g001
Figure 2. Air temperature changes in the 2014 melting season at the following sites: (PPS) Polish Polar Station Hornsund; (H4, H6, H9) Hansbreen.
Water 09 00804 g002
Figure 3. Variability of the surface melt rate based on mass-balance stake data (a) and Snow-Covered Area reduction based on Landsat 8 images (b) on Hansbreen in the melting period of 2014.
Water 09 00804 g003
Figure 4. Variability of the Snow-Covered Area on Hornsund glaciers at individual stages in the melting period of 2014, based on Landsat 8 images: red—snow cover; yellow—glacier ice; black—debris; grey—cloud mask.
Water 09 00804 g004
Figure 5. Maximum Likelihood supervised classification statistics. Percentage contribution of the classes analysed at the individual stages in the melting period of 2014.
Water 09 00804 g005
Figure 6. Reduction of the Snow-Covered Area (SCA) on the Hornsund glaciers analysed in the melting period of 2014.
Water 09 00804 g006
Table 1. Characteristics of selected glaciers on which field measurements were conducted: (AC) accumulation area; (AB) ablation area; (ELA) Equilibrium-Line Altitude.
ID AGlacierAspect AArea BLength B kmMean Elevation BELA C
ACABkm2GlacierTerminusmm
124 04KörberbreenNN9.45.31.24317
124 07SamarinbreenNWNW84.010.63.96333352
124 08ChomjakovbreenNNW13.17.01.48313318
124 09MendelejevbreenNEN31.19.23.57222231
124 10SvalisbreenNW31.310.22.28232318
124 11HornbreenSSW176.225.55.47289398
124 12StorbreenSS196.521.76.89287383
124 16KvalfangarbreenSWSW13.55.20.63277331
124 17MühlbacherbreenSS51.614.051.82376373
124 18PaierlbreenSESE106.122.02.15370400
124 20HansbreenSES53.915.371.99291342
Notes: A [18]; B [8]; C presented study.
Table 2. Positive degree days (PDD) and their total in successive months of 2014 in Hornsund, on the H4, H6 and H9 Hansbreen sites.
MonthHornsundHansbreen H4Hansbreen H6Hansbreen H9
DaysSumDaysSumDaysSumDaysSum
January53.210.400.0
February1213.544.100.0
March32.000.000.0
April00.000.000.000.0
May1316.565.832.220.9
June3098.72135.21927.11518.3
July31172.93174.63178.83177.4
August31154.83170.83158.82848.3
September2574.41928.11316.8812.4
October1441.41223.7917.867.0
November58.053.421.510.0
December10.000.000.000.0
Year170585.4130246.1108203.091164.3
Table 3. Basic features of the snow cover at the individual study sites: (SWE) snow water equivalent; percentage of total snow depth: (IF) Ice Formations; (MFcr) Melt-Freeze Crusts.
GlacierSiteElevationSnow DepthBulk DensitySWEIFMFcr
m a.s.l.mkg m−3m w.e.%%
FlatbreenF11981.673970.66 ± 0.08
F22842.724171.13 ± 0.14
F33803.844301.65 ± 0.19
HansbreenH41871.603740.60 ± 0.082.225.0
H62782.103990.84 ± 0.114.815.5
H94242.784661.30 ± 0.145.07.9
StorbreenS11661.463760.55 ± 0.07
S22661.633670.60 ± 0.08
S34252.594041.05 ± 0.13
Table 4. Basic characteristics of used Landsat 8 images and supervised classification accuracy.
No.Imagery IDDateCloud Cover [%]Sun Elevation [°]Kappa CoefficientOverall Accuracy
1LC82090052014145LGN0025 May 20147.5533.670.9945899.46
2LC82080052014154LGN003 June 201426.9235.040.9780397.88
3LC80282392014173LGN0022 June 201447.8517.690.9943699.43
4LC80292392014196LGN0015 July 201410.9515.940.9952999.53
5LC82100052014216LGN004 August 201420.3129.990.9605795.95
6LC82100052014232LGN0020 August 201444.0525.160.9979099.80