Aquifer Vulnerability Assessment for Sustainable Groundwater Management Using DRASTIC

Abstract
1. Introduction
2. Materials and Methods
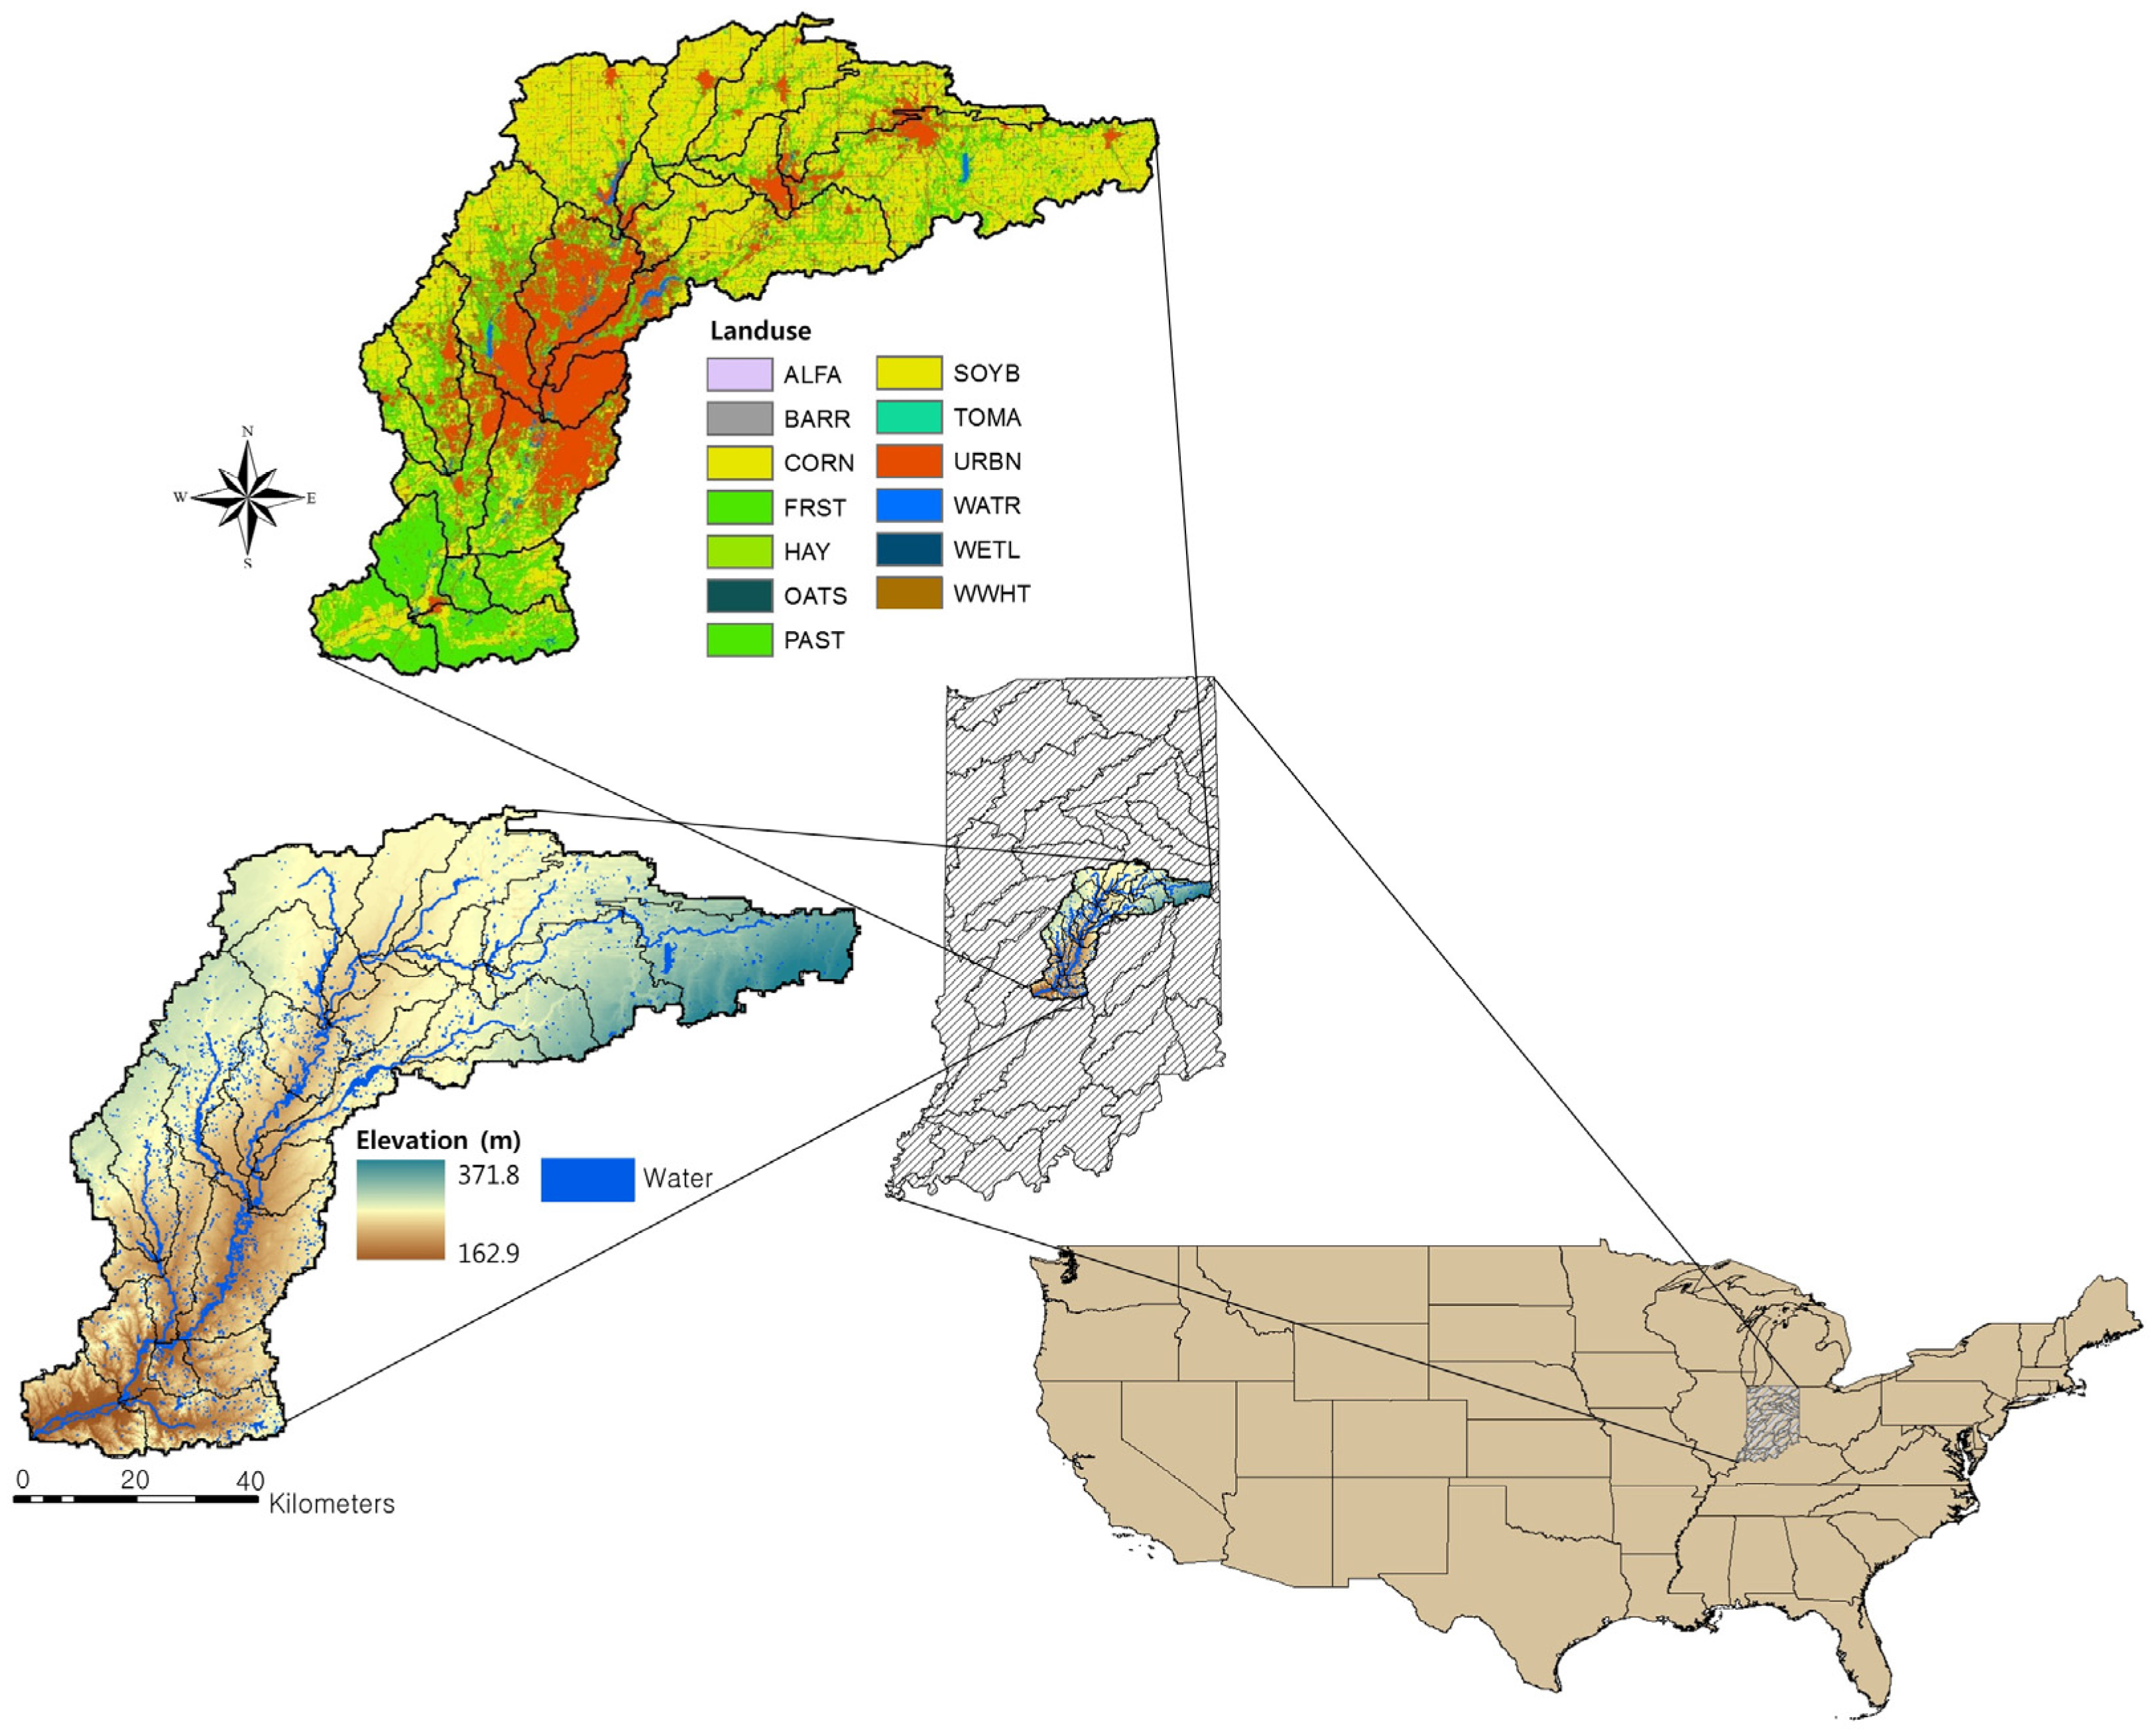
2.1. Study Area
2.2. DRASTIC to Estimate Aquifer Vulnerability
- Dr: Ratings to the depth to water table;
- Dw: Weight assigned to the depth to water table;
- Rr: Ratings for ranges of aquifer recharge;
- Rw: Weight for aquifer recharge;
- Ar: Ratings assigned to aquifer media;
- Aw: Weight assigned to aquifer media;
- Sr: Ratings for soil media;
- Sw: Weight for soil media;
- Tr: Ratings for topography;
- Tw: Weight assigned to topography;
- Ir: Ratings assigned to vadose zone;
- Iw: Weight assigned to vadose zone;
- Cr: Ratings for rates of hydraulic conductivity; and
- Cw: Weight given to hydraulic conductivity.
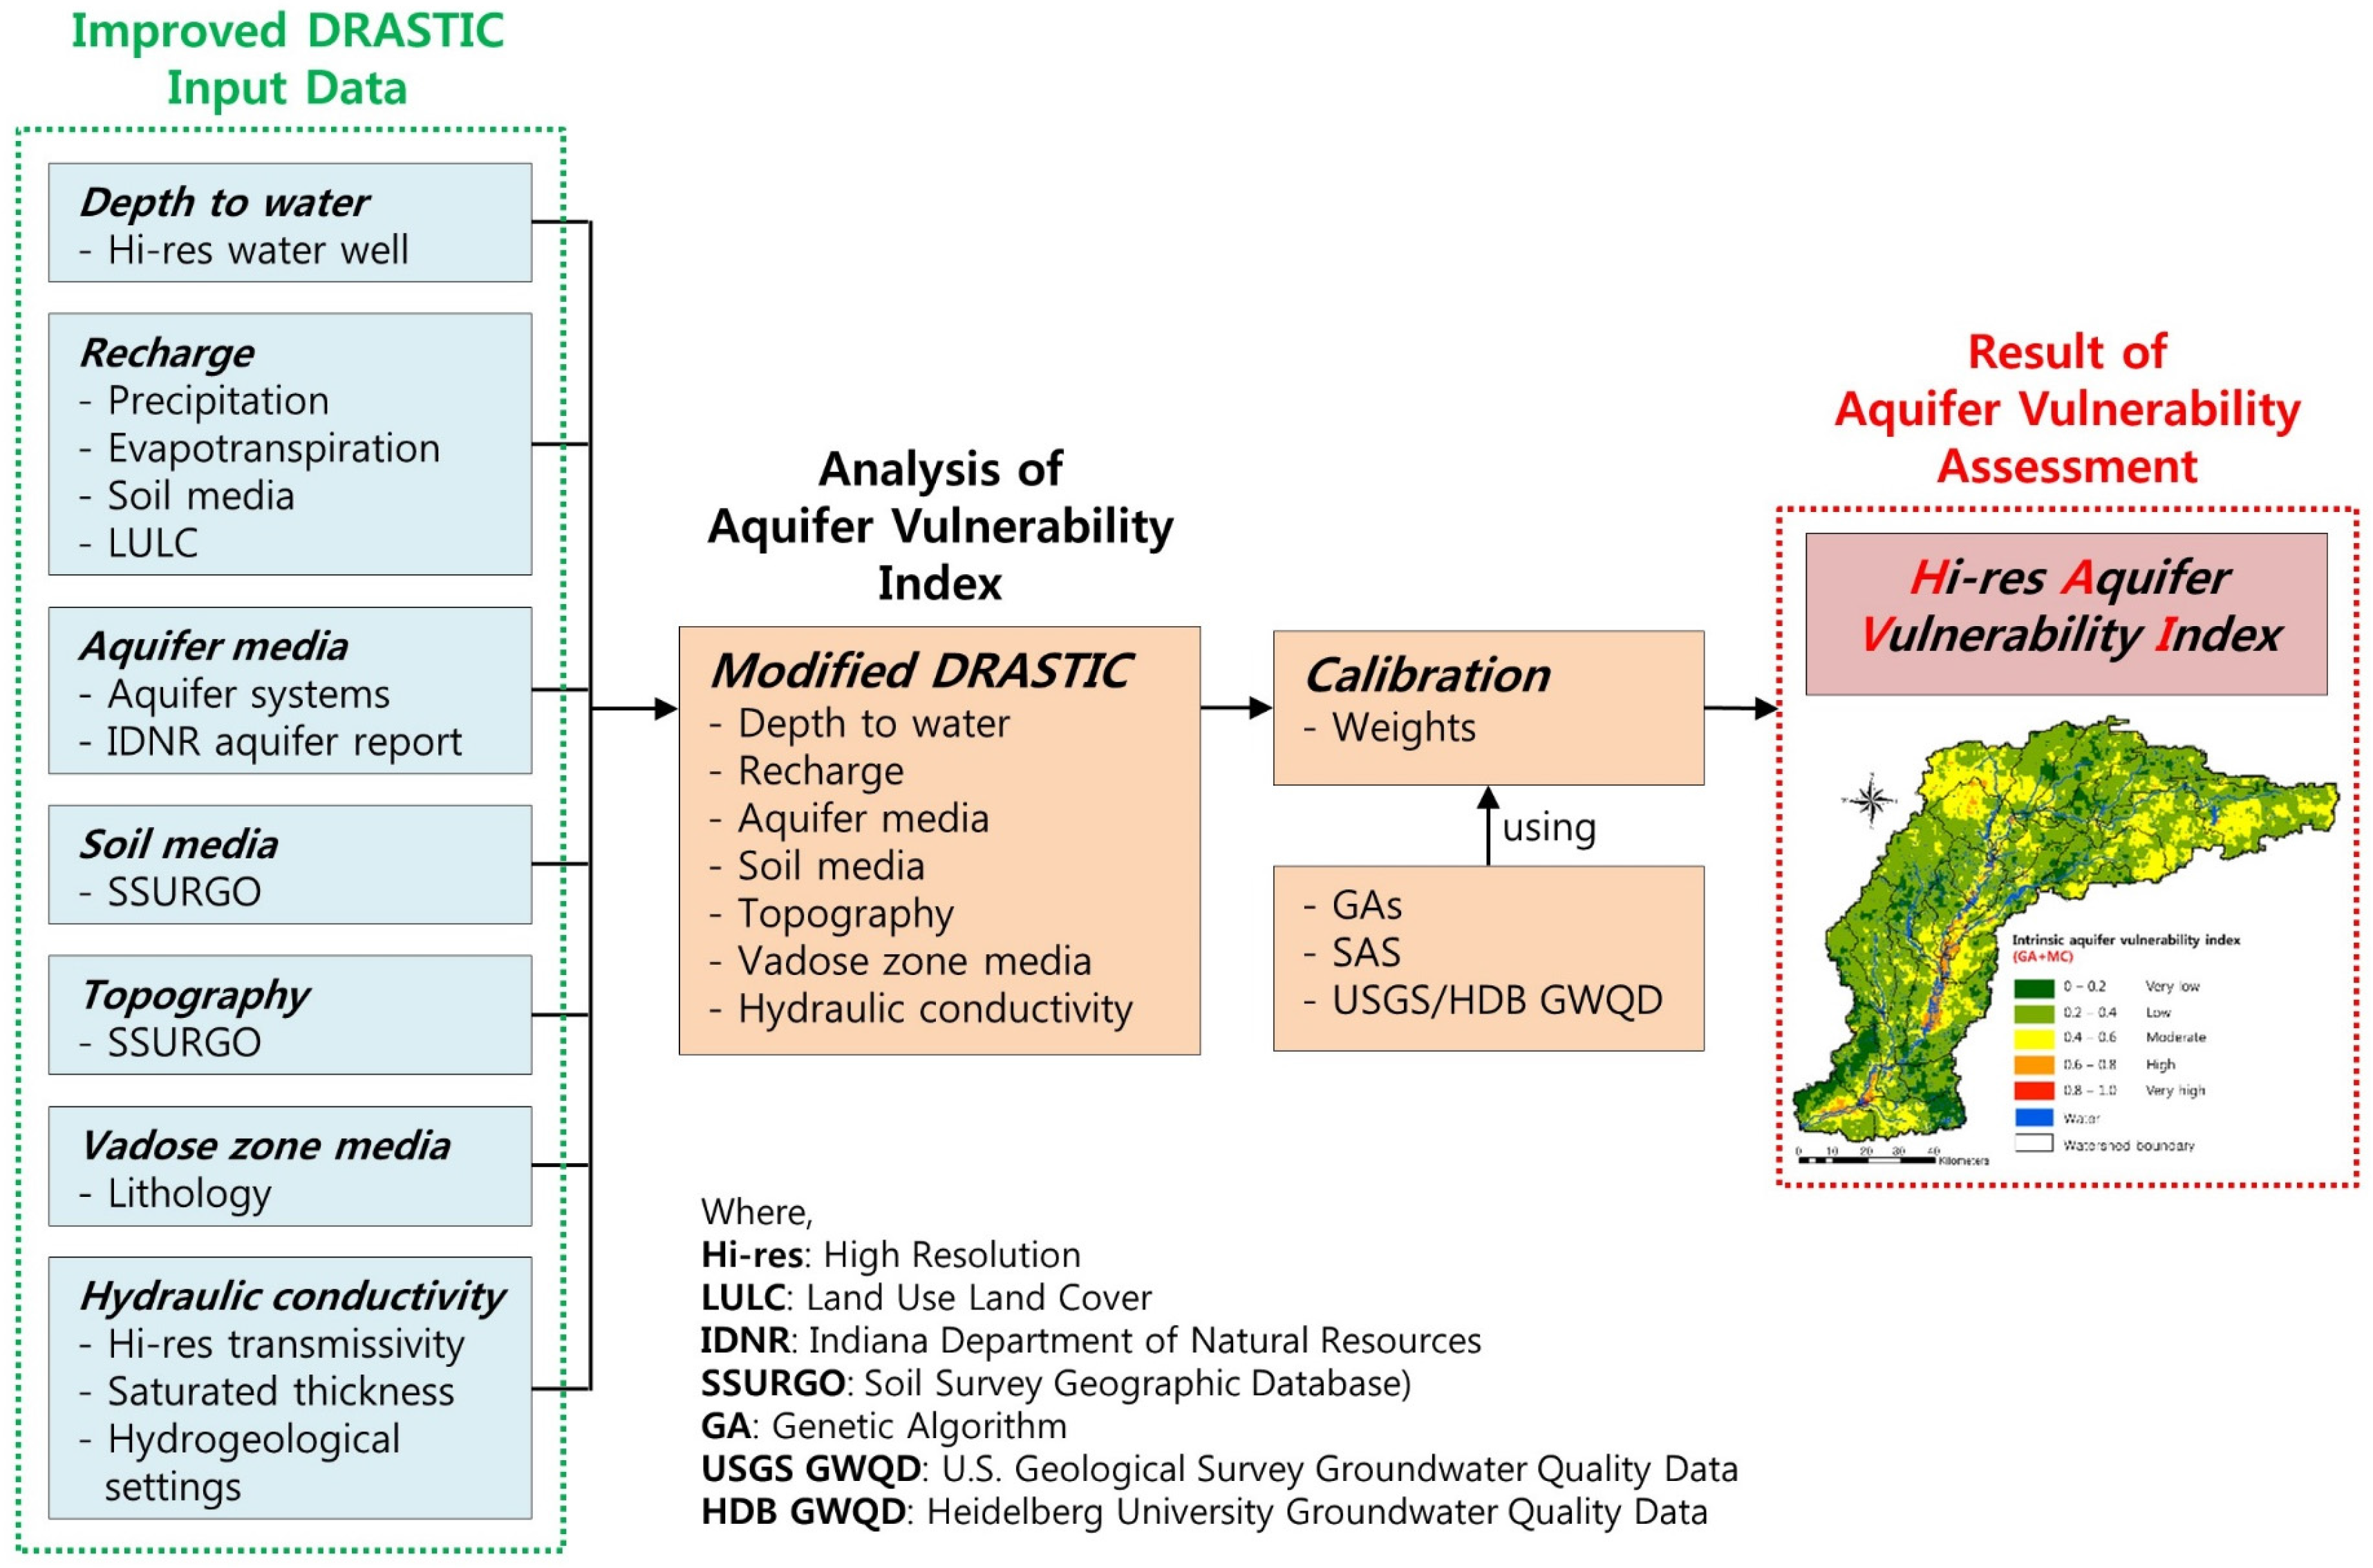
2.3. Sources of Data
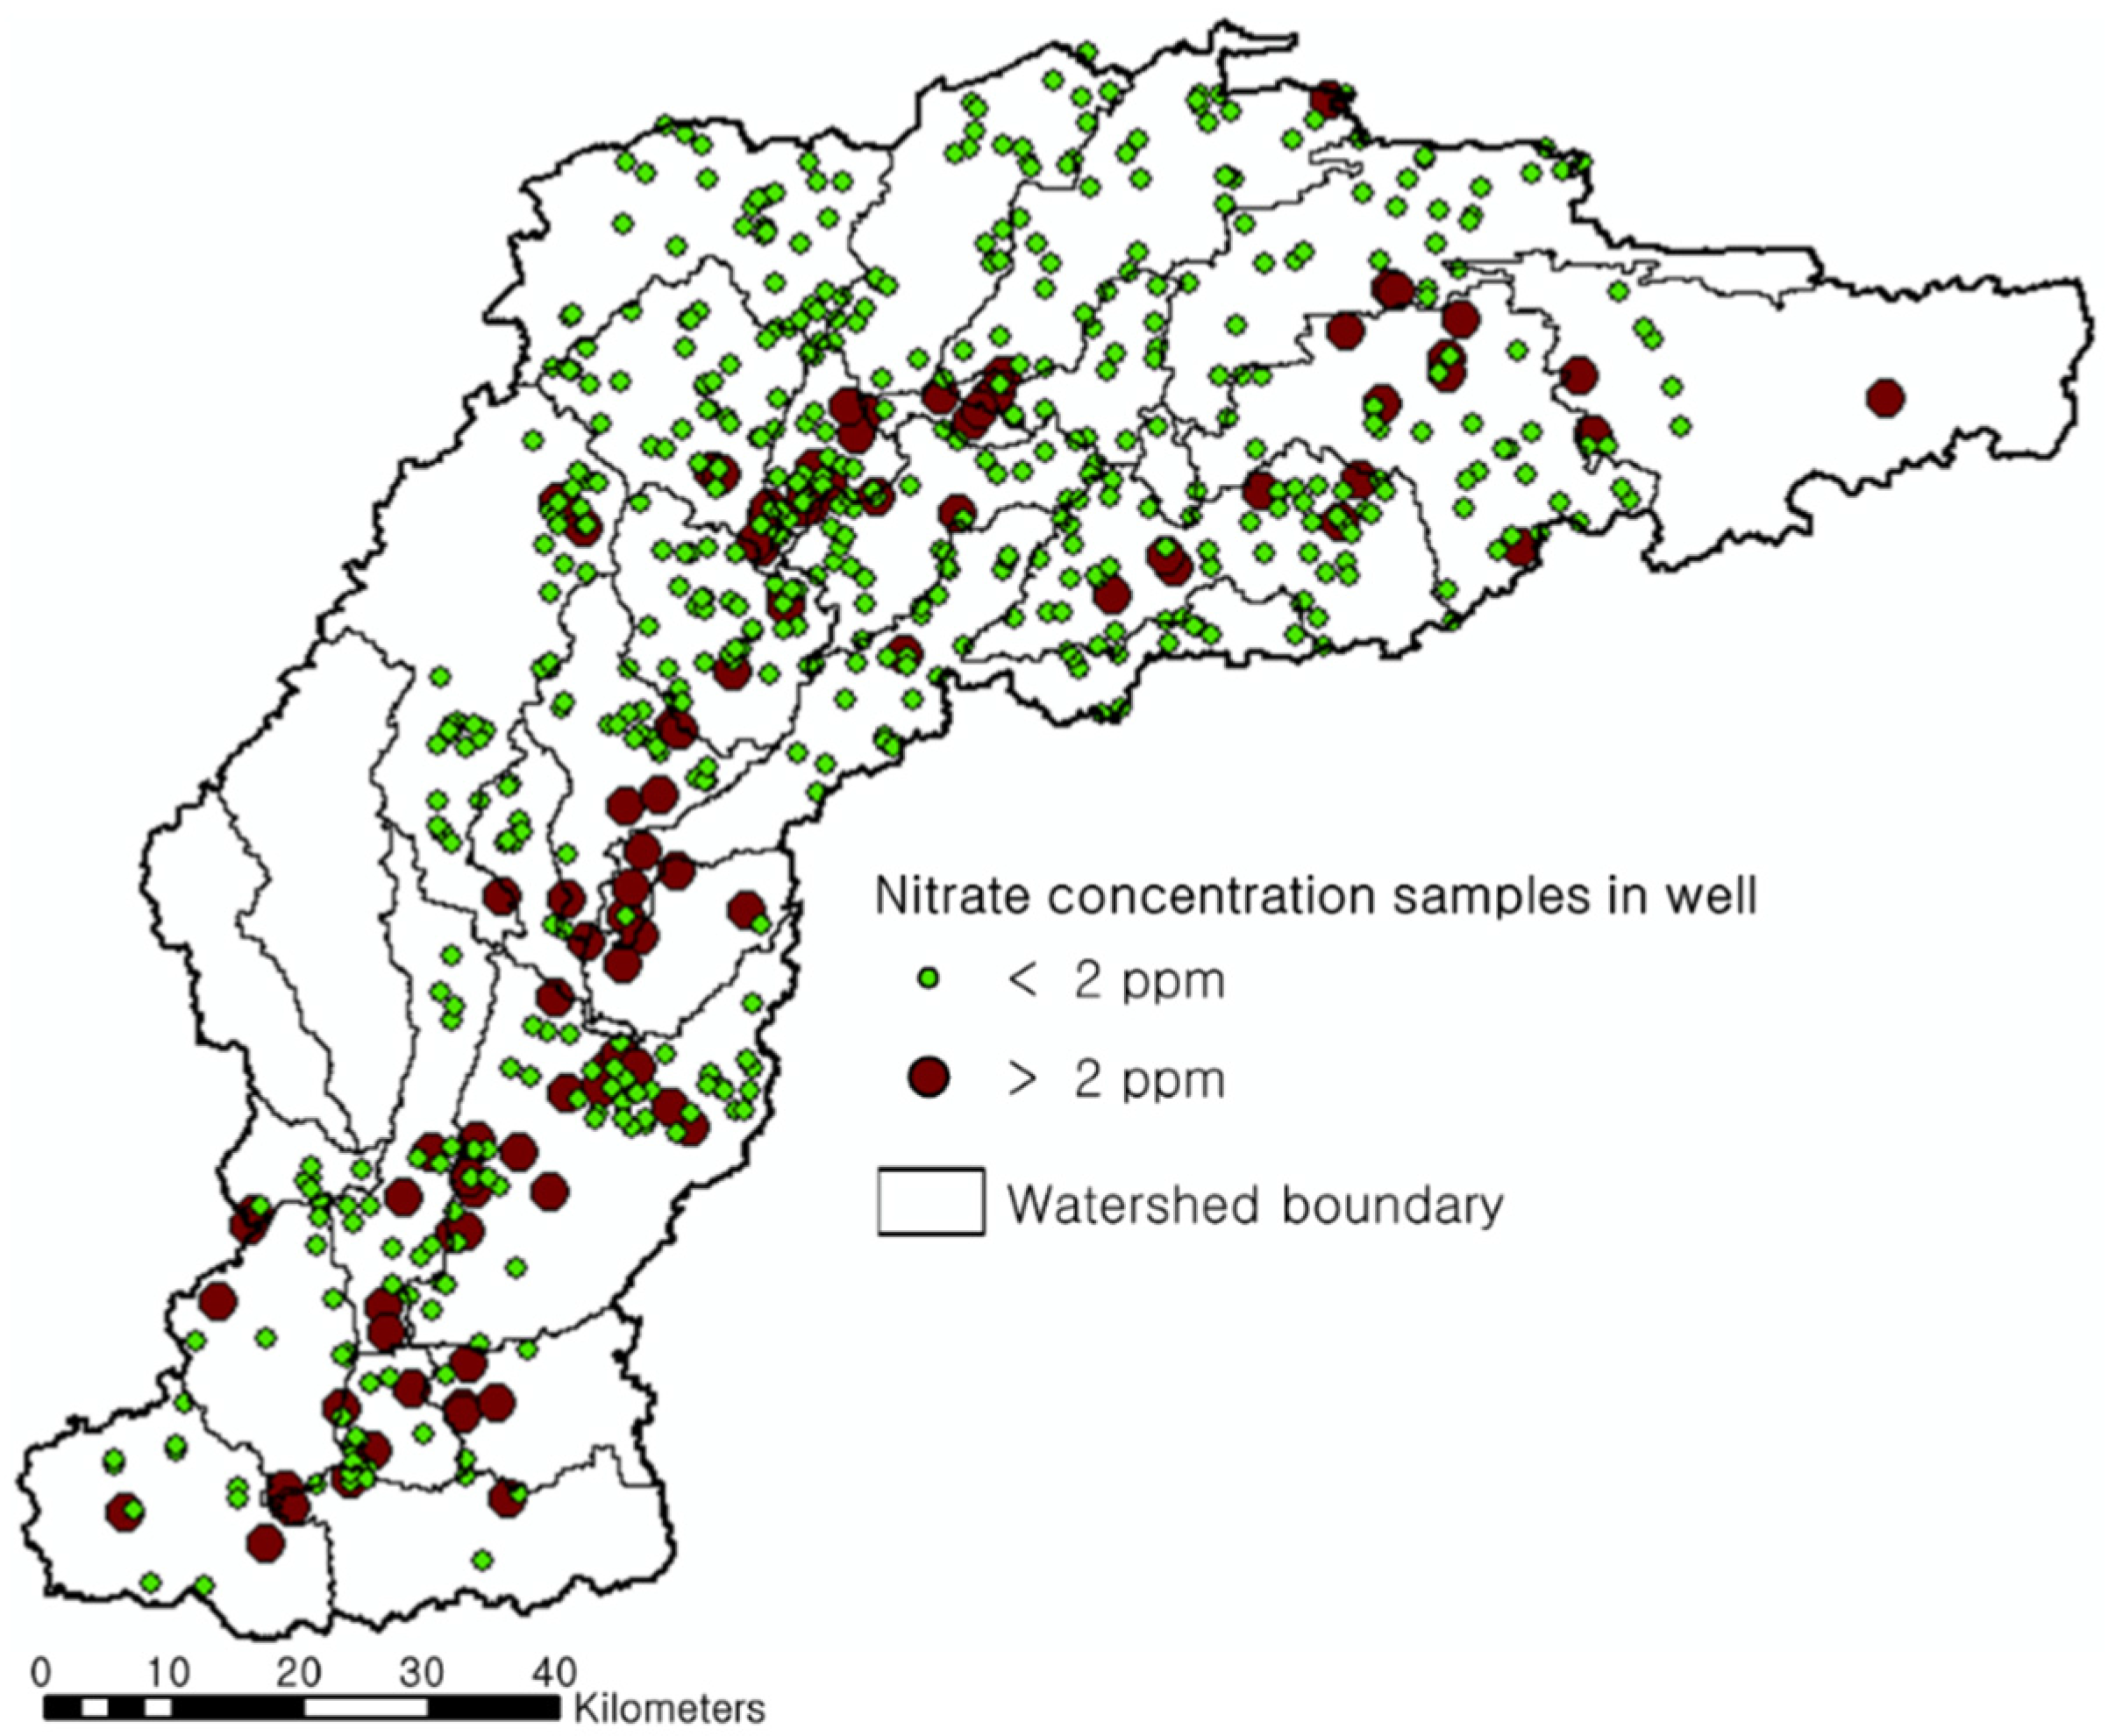
2.4. Nitrate Measurements
2.5. Aquifer Vulnerability Mapping Using DRASTIC
2.5.1. Depth to Water
2.5.2. Recharge
- Qi: Depth of runoff (mm);
- P: Depth of rainfall (mm);
- Ia: Initial abstraction (mm);
- S: Maximum potential retention (mm); and
- CN: Curve number (dimensionless).
2.5.3. Aquifer Media
2.5.4. Soil Media and Topography
2.5.5. Impact of Vadose Zone Media
2.5.6. Hydraulic Conductivity
2.6. Model Calibration and Validation
- : Simulated nitrate concentration DRASTIC binary value; and
- : Observed nitrate concentration binary value.
2.7. Evaluation for Potential Groundwater Monitoring Sites
- : Getis–Ord local statistic;
- : Attribute value for feature j;
- : Spatial weight between feature i and j; and
- : Total number of features.
3. Results and Discussion
3.1. Calibration and Validation of DRASTIC Weights
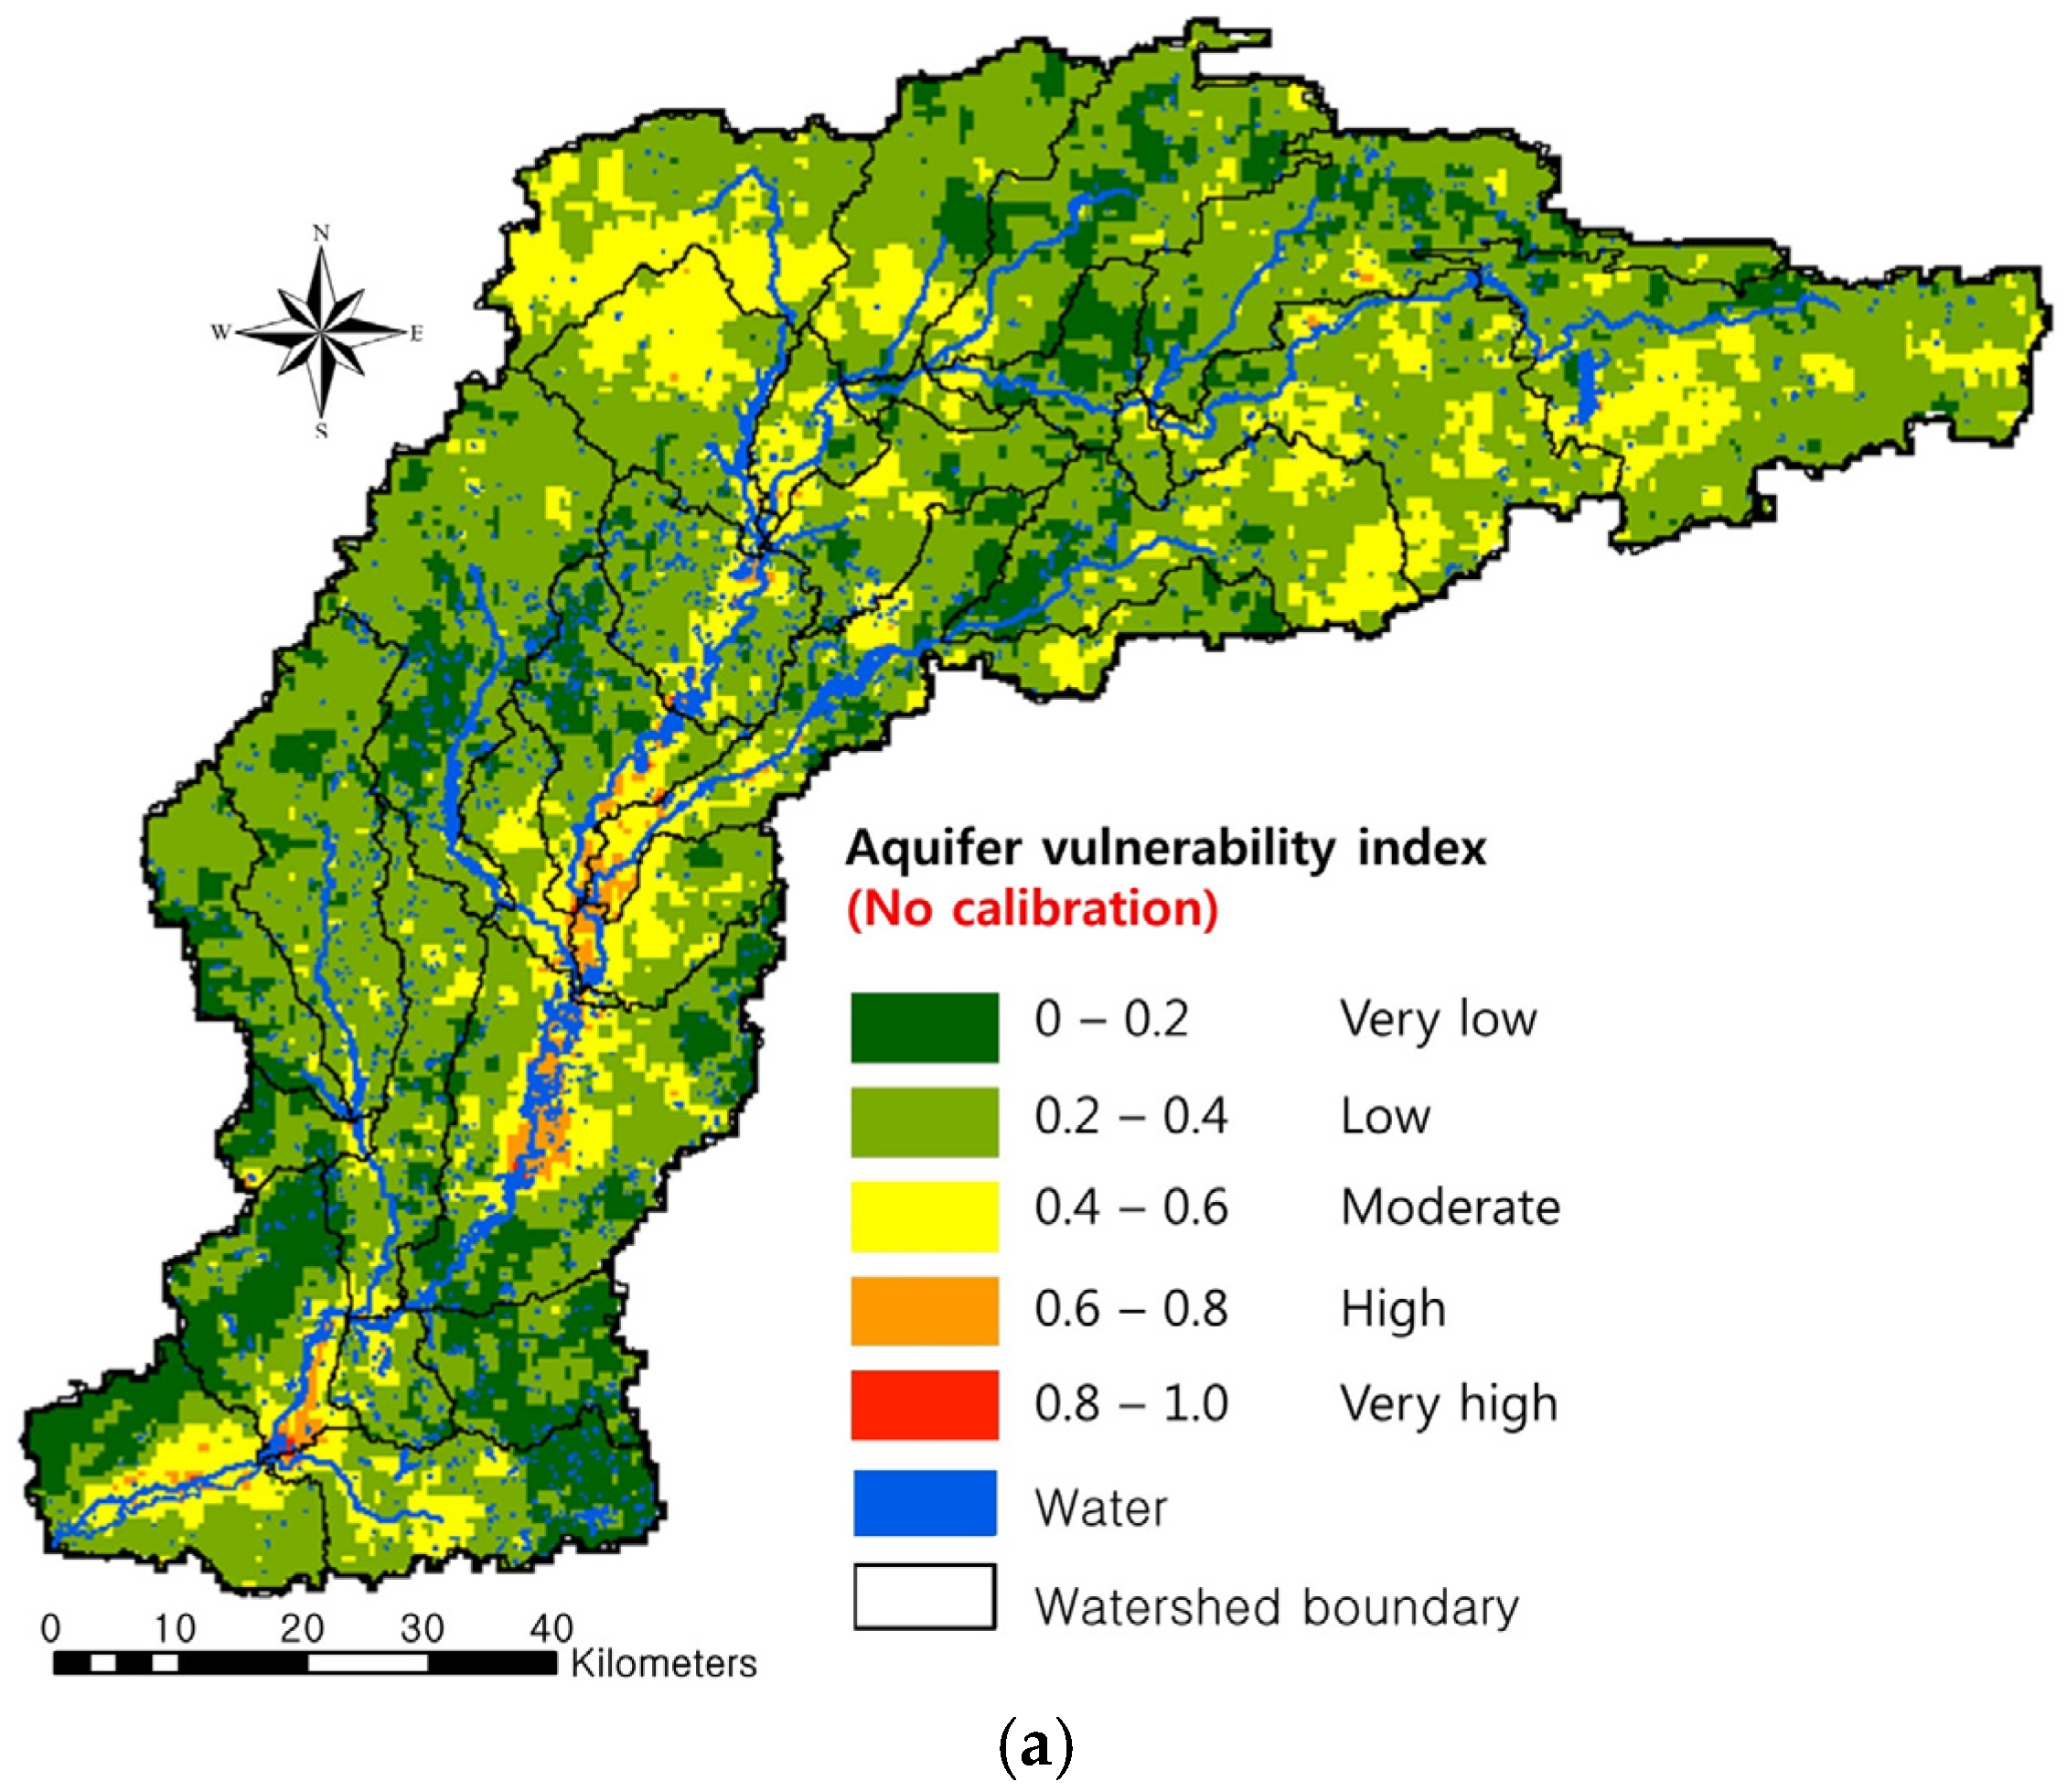
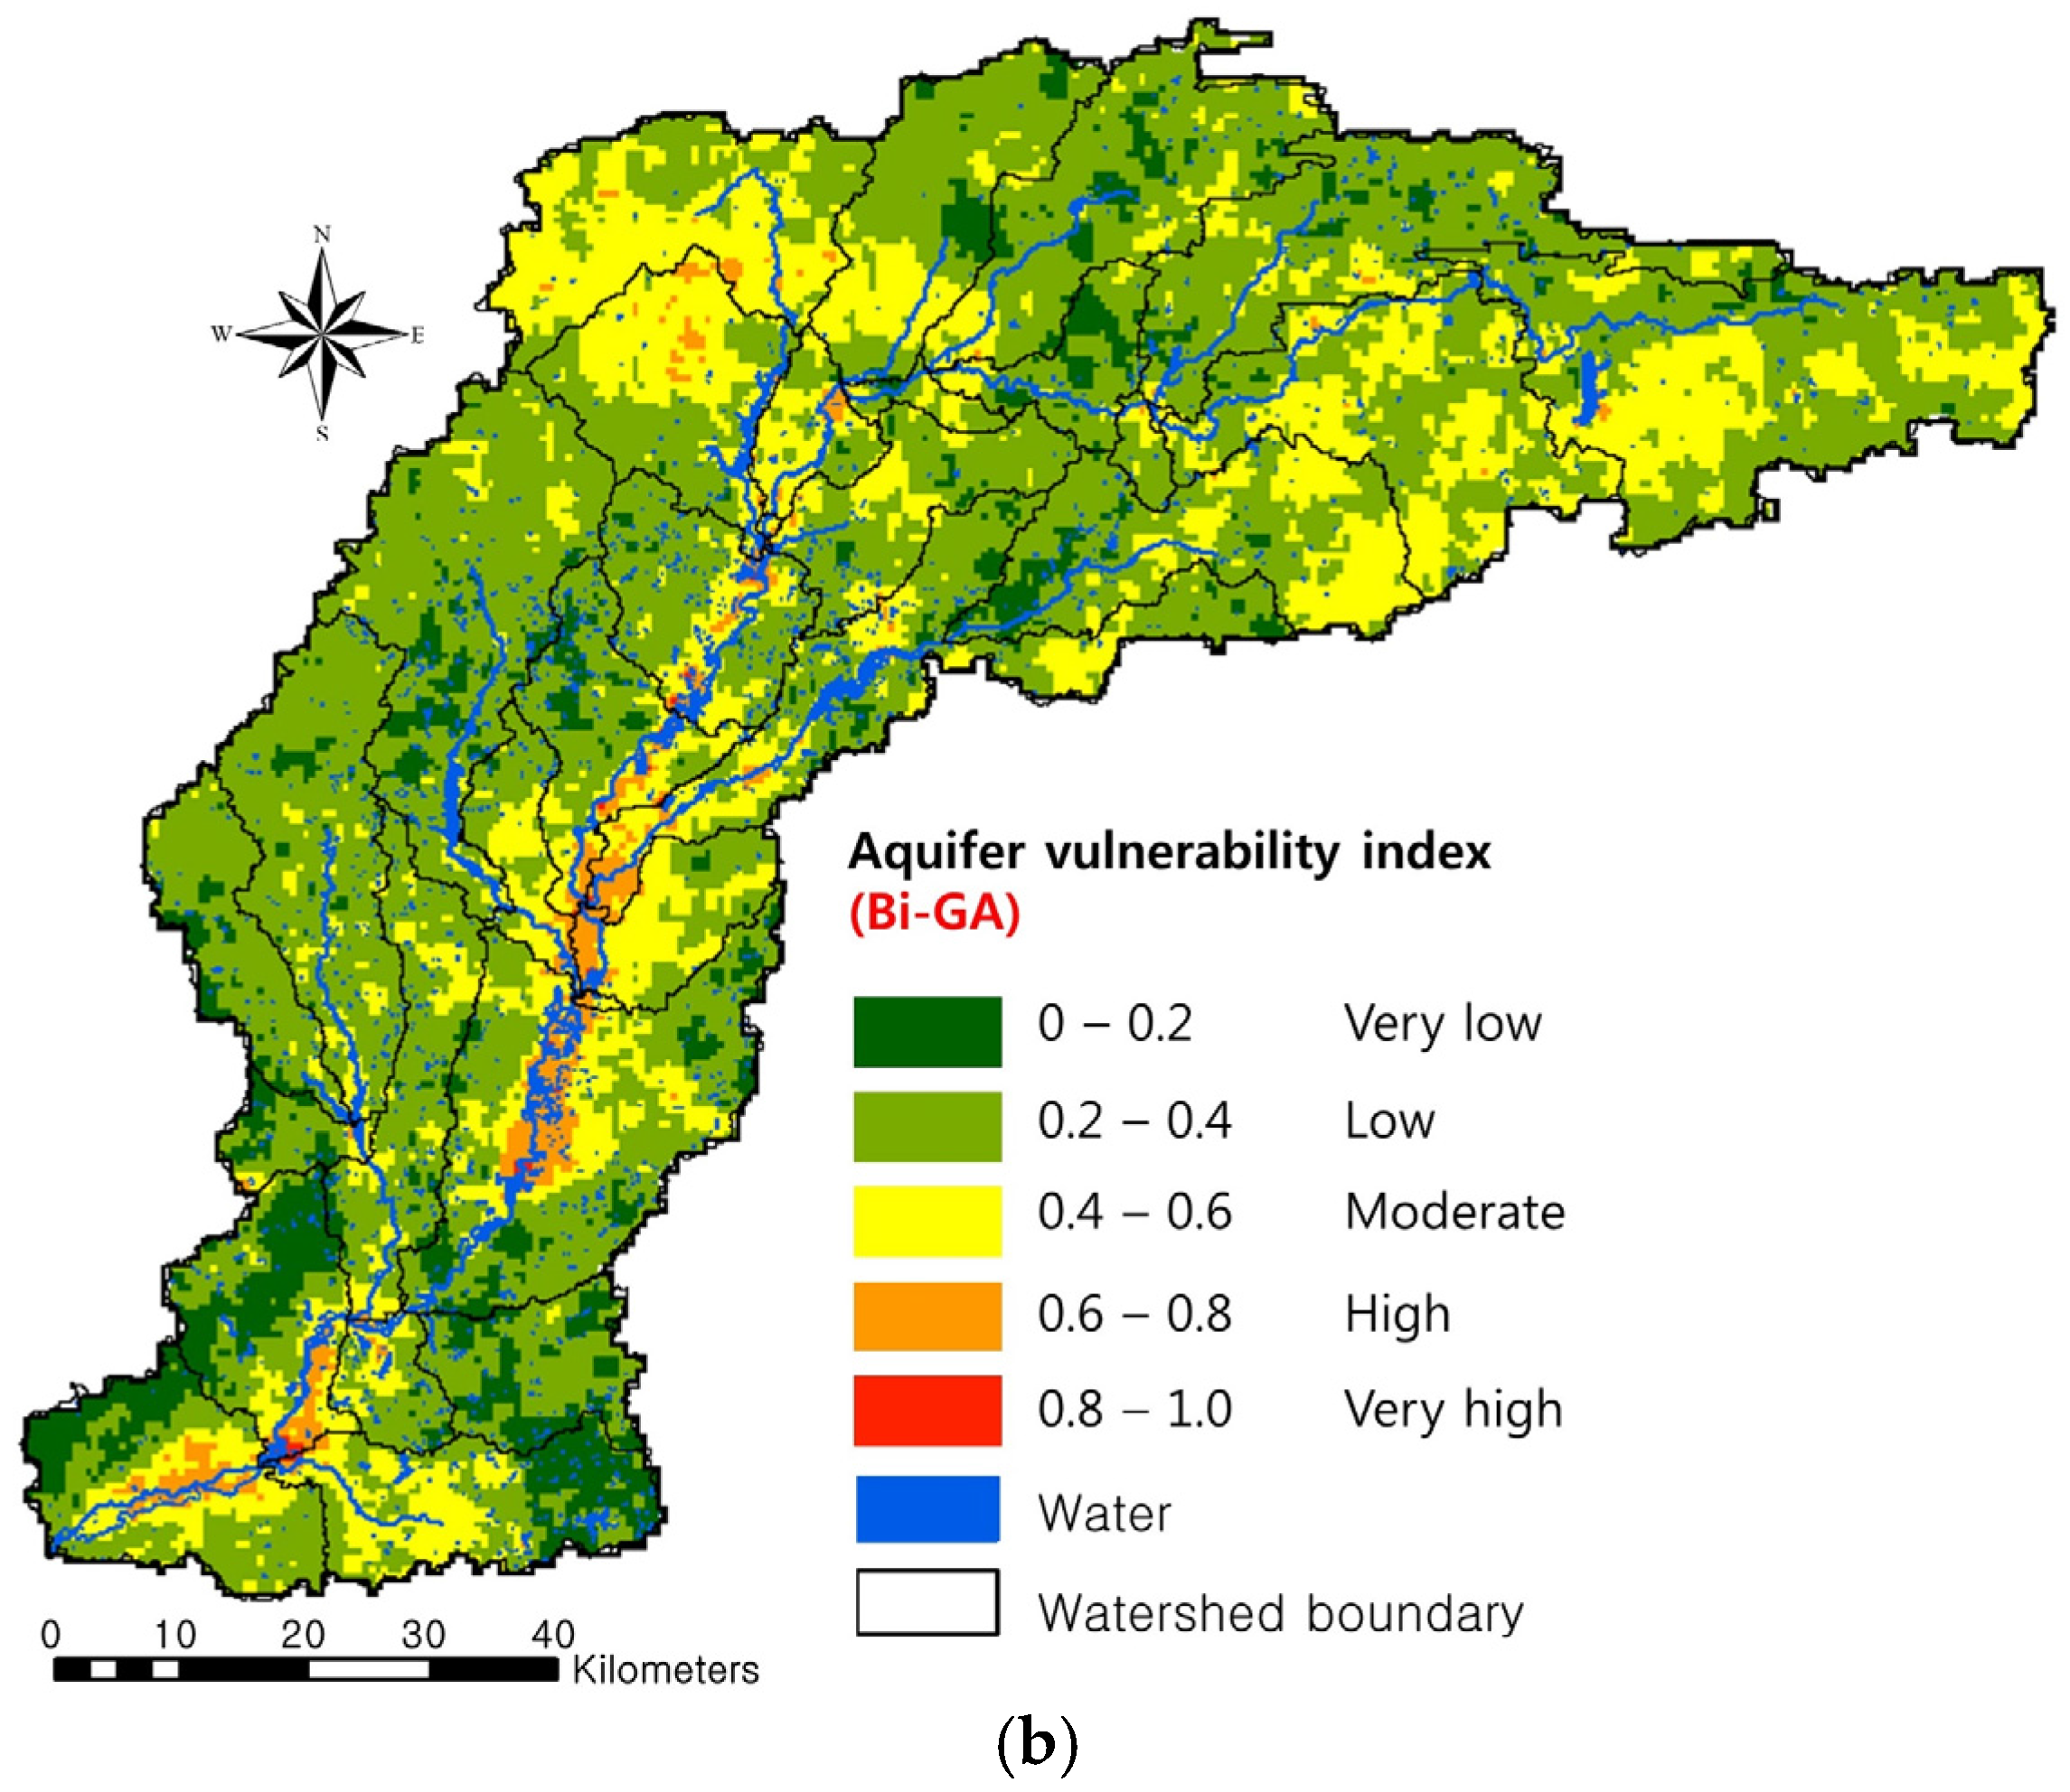
3.2. Aquifer Vulnerability Mapping
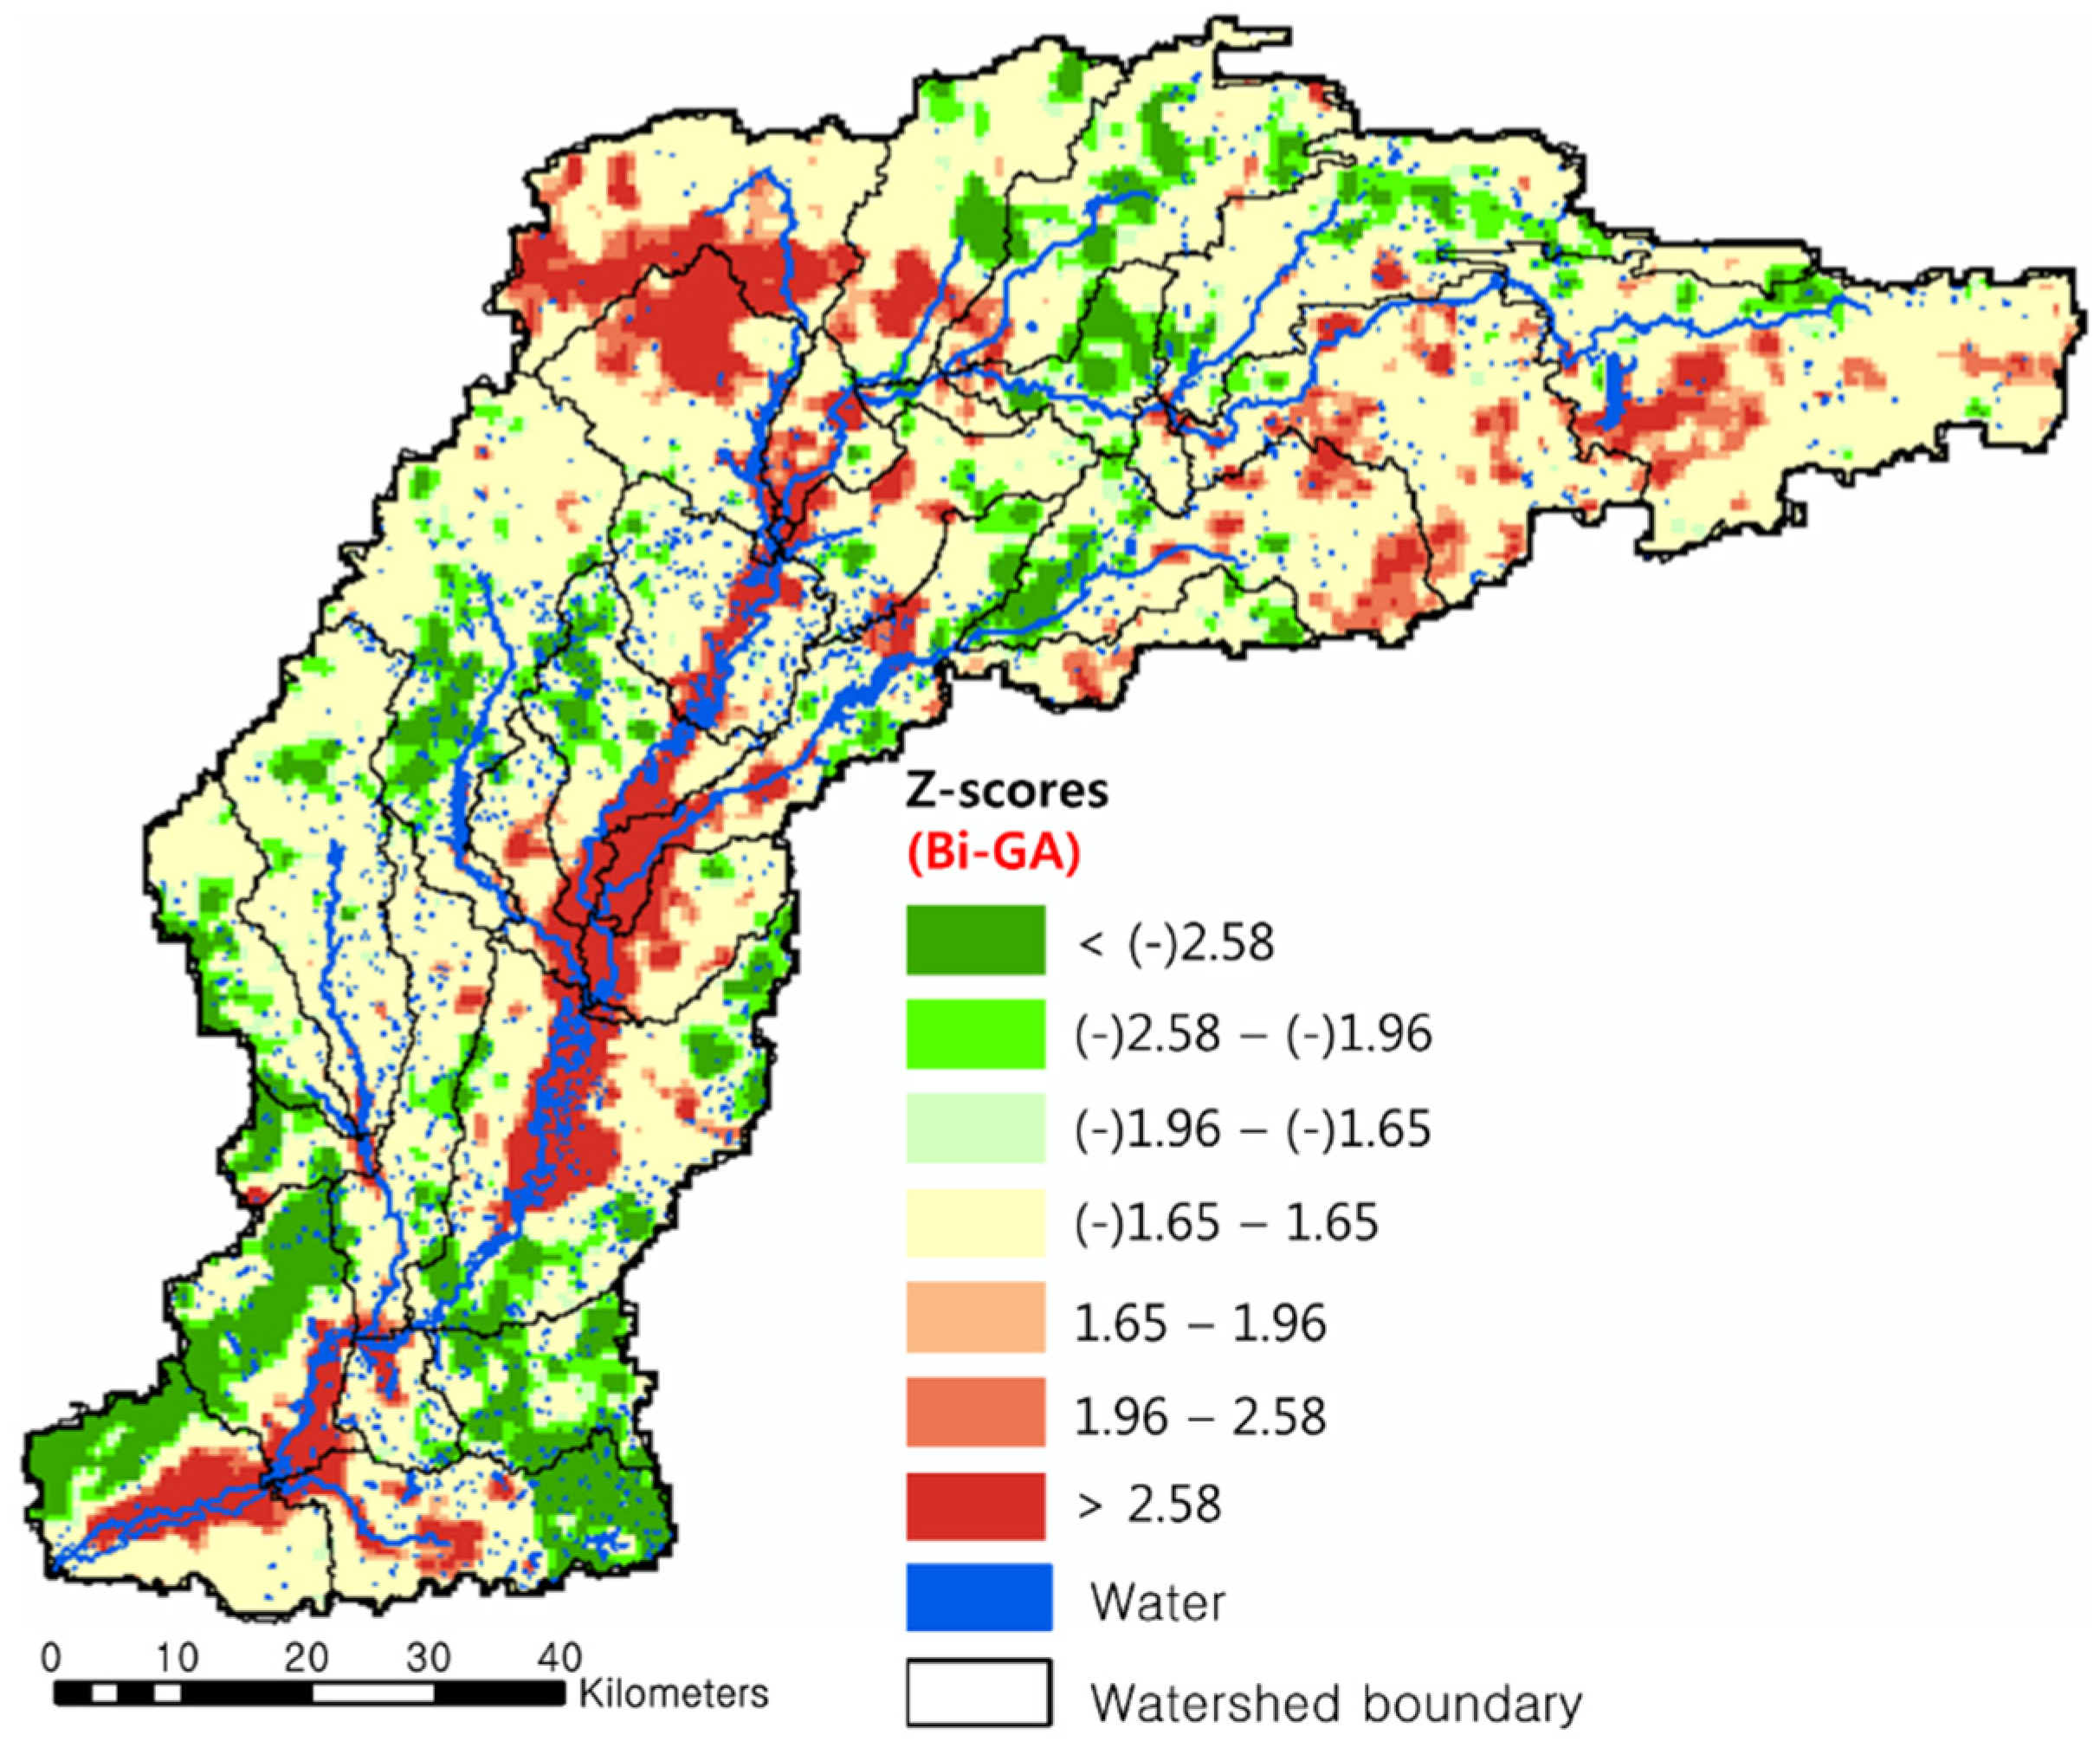
3.3. Potential Groundwater Monitoring and Management Sites
4. Conclusions
- (1)
- About 79% of land uses (45.5% agricultural and 23.5% urban areas) are human-related areas, and most human-related areas cover very high and high vulnerability classes. Thus, DRASTIC in this study describes human impact. For more accurate estimation of human impact by DRASTIC or other overlay and index models, more human-impact-related factors such as land use, population density, and point sources should be considered as input data.
- (2)
- For a detailed vulnerability assessment, the aquifer vulnerability analysis of DRASTIC would need to be combined with predictive models for pollutant transport. This combination is required to evaluate the actual quantitative risk. For example, models such as SWAT which can estimate pollutant transport could be combined with DRASTIC. Further, pollutant transport should be considered beyond that on the land surface and consider subsurface transport. To do this, more detailed soil data that describe various soil components for the surface and subsurface soil layers should be used for future study.
- (3)
- The aquifer vulnerability index is a combination of data. Further, there are many pre-processes and post-processes to generate an aquifer vulnerability index. Thus, an aquifer vulnerability index includes some degree of uncertainty which might come from data, data processing errors by the modeler, and model structure. Future work would benefit from quantification of errors when using an overlay and index model.
Author Contributions
Conflicts of Interest
Appendix A

| Depth to Water (m) | |
| Range | Rating |
| 0–1.5 | 10 |
| 1.5–4.6 | 9 |
| 4.6–6.8 | 8 |
| 6.8–9.1 | 7 |
| 9.1–12.1 | 6 |
| 12.1–15.2 | 5 |
| 15.2–22.9 | 4 |
| 22.9–26.7 | 3 |
| 26.7–30.5 | 2 |
| 30.5+ | 1 |
| Net Recharge (mm/year) | |
| Range | Rating |
| 254+ | 10 |
| 235–254 | 9 |
| 216–235 | 8 |
| 178–216 | 7 |
| 147.6–178 | 6 |
| 117.2–147.6 | 5 |
| 91.8–117.2 | 4 |
| 71.4–91.8 | 3 |
| 51–71.4 | 2 |
| 0–51 | 1 |
| Aquifer Media | |
| Range | Rating |
| Karst limestone | 10 |
| Basalt | 9 |
| Sand and gravel | 8 |
| Massive sandstone Massive limestone | 7 |
| 7 | |
| Bedded sandstone Limestone | 6 |
| 6 | |
| Glacial till | 5 |
| Weathered metamorphic igneous | 4 |
| Metamorphic igneous | 3 |
| Massive shale | 2 |
| Soil Media | |
| Range | Rating |
| Thin or absent/Gravel | 10 |
| Sand | 9 |
| Peat | 8 |
| Shrinking clay | 7 |
| Loamy sand | 6 |
| Sandy loam | 6 |
| Loam | 5 |
| Sandy clay | 4 |
| Sandy clay loam | 4 |
| Silt loam | 4 |
| Silty clay | 3 |
| Clay loam | 3 |
| Silty clay loam | 3 |
| Muck | 2 |
| Non-shrinking clay | 1 |
| Topography (%) | |
| Range | Rating |
| 0–2 | 10 |
| 2–6 | 9 |
| 6–12 | 5 |
| 12–18 | 3 |
| 18+ | 1 |
| Vadose Zone Media | |
| Range | Rating |
| Thin or absent/Gravel | 10 |
| Sand | 9 |
| Peat | 8 |
| Shrinking clay | 7 |
| Loamy sand | 6 |
| Sandy loam | 6 |
| Loam | 5 |
| Sandy clay | 4 |
| Sandy clay loam | 4 |
| Silt loam | 4 |
| Silty clay | 3 |
| Clay loam | 3 |
| Silty clay loam | 3 |
| Muck | 2 |
| Non-shrinking clay | 1 |
| Hydraulic Conductivity (m/s) | |
| Range | Rating |
| 0.00095+ | 10 |
| 0.0005–0.00095 | 8 |
| 0.00033–0.0005 | 6 |
| 0.00015–0.00033 | 4 |
| 0.00005–0.00015 | 2 |
| 0.00000015–0.00005 | 1 |
References
- Solly, W.B.; Pierce, R.R.; Perlman, H.A. Estimated Use of Water in the United States in 1995; U.S. Geological Survey Circular 1200; USGS: Denver, CO, USA, 1998. [Google Scholar]
- Hamblin, W.K.; Christiansen, E.H. Earth’s Dynamic Systems, 10th ed.; Prentice Hall: Upper Saddle River, NJ, USA, 2004. [Google Scholar]
- Novotny, V. Water Quality, Diffuse Pollution and Watershed Management, 2nd ed.; Wiley: Van Nostrand Reinhold, NY, USA, 2003. [Google Scholar]
- Baalousha, H. Assessment of a groundwater quality monitoring network using vulnerability mapping and geostatistics: A case study from Heretaunga Plains, New Zealand. Agric. Water Manag. 2010, 97, 240–246. [Google Scholar] [CrossRef]
- Zhang, Y.; Li, G. Long-Term Evolution of Cones Depression in shallow Aquifers in the North China Plain. Water 2013, 5, 677–693. [Google Scholar] [CrossRef]
- Keilholz, P.; Disse, M.; Halik, Ü. Effects of Land Use and Climate Change on Groundwater and Ecosystems at the Middle Reaches of the Tarim River Using the MIKE SHE Integrated Hydrological Model. Water 2015, 7, 3040–3056. [Google Scholar] [CrossRef]
- Fienen, M.N.; Hunt, R.J.; Doherty, J.E.; Reeves, H.W. Using Models for the Optimization of Hydrologic Monitoring; U.S. Geological Survey Fact Sheet 2011–3014; USGS: Reston, VA, USA, 2011.
- McDonald, M.G.; Harbaugh, A.W. A Modular Three-Dimensional Finite-Difference Ground-Water Flow Model; US Geological Survey Techniques of Water Resources Investigations Report Book 6; USGS: Washington, DC, USA, 1988; Chapter A1.
- Lin, Y.-P.; Chen, Y.-W.; Chang, L.-C.; Yeh, M.-S.; Huang, G.-H.; Petway, J.R. Groundwater Simulations and Uncertainty Analysis Using MODFLOW and Geostatistical Approach with Conditioning Multi-Aquifer Spatial Covariance. Water 2017, 9, 164. [Google Scholar] [CrossRef]
- Harbaugh, A.W. MODFLOW-2005, The U.S. Geological Survey Modular Ground-Water Model-the Ground-Water Flow Process; U.S. Geological Survey Techniques and Methods 6-A16; USGS: Reston, VA, USA, 2005.
- Markstrom, S.L.; Niswonger, R.G.; Regan, R.S.; Prudic, D.E.; Barlow, P.M. GSFLOW-Coupled Ground-Water and Surface-Water FLOW Model Based on the Integration of the Precipitation-Runoff Modeling System (PRMS) and the Modular Ground-Water Flow Model (MODFLOW-2005); U.S Geological Survey, Techniques and Methods 6-D1; USGS: Reston, VA, USA, 2008.
- Pacheco, F.A.L.; Fernandes, L.F.S. The multivariate statistical structure of DRASTIC model. J. Hydrol. 2013, 467, 442–459. [Google Scholar] [CrossRef]
- Chen, S.; Jang, C.; Peng, Y. Developing a probability-based model of aquifer vulnerability in an agricultural region. J. Hydrol. 2013, 486, 494–504. [Google Scholar] [CrossRef]
- Holden, L.R.; Graham, J.A.; Whitmore, R.W.; Alexander, W.J.; Pratt, R.W.; Liddle, S.F.; Piper, L.L. Results of the national alachlor well water survey. Environ. Sci. Technol. 1992, 26, 936–943. [Google Scholar] [CrossRef]
- Maas, R.P.; Kucken, D.J.; Patch, S.C.; Peek, B.T.; Van Engelen, D.L. Pesticides in eastern North Caroline rural supply wells: Landuse factors and persistence. J. Environ. Qual. 1995, 24, 426–431. [Google Scholar] [CrossRef]
- Navulur, K.C.S. Groundwater Vulnerability Evaluation to Nitrate Pollution on a Regional Scale Using GIS. Ph.D. Dissertation, Purdue University, West Lafayette, IN, USA, 1996. [Google Scholar]
- Babiker, I.S.; Mohamed, M.A.A.; Hiyama, T.; Kato, K. A GIS based DRASTIC model for assessing aquifer vulnerability in Kakamigahara Heights, Gifu Prefecture, central Japan. Sci. Total Environ. 2005, 345, 127–140. [Google Scholar] [CrossRef] [PubMed]
- Akhavan, S.; Mousavi, S.; Abedi-Koupai, J.; Abbaspour, K.C. Conditioning DRASTIC model to simulate nitrate pollution case study: Hamadan-Bahar plain. Environ. Earth Sci. 2011, 63, 1155–1167. [Google Scholar] [CrossRef]
- Aller, L.; Bennett, T.; Lehr, J.H.; Petty, R.J.; Hackett, G. DRASTIC: A Standardized System for Evaluating Groundwater Potential Using Hydrogeologic Settings; EPA/600/2-85/018; U.S. Environmental Protection Agency: Washington, DC, USA, 1987.
- Kalinski, R.J.; Kelly, W.E.; Bogardi, I.; Ehrman, R.L.; Yamamoto, P.O. Correlation between DRASTIC vulnerabilities and incidents of VOC contamination of municipal wells in Nebraska. Ground Water 1994, 32, 31–34. [Google Scholar] [CrossRef]
- McLay, C.D.A.; Dragden, R.; Sparling, G.; Selvarajah, N. Predicting groundwater nitrate concentrations in a region of mixed agricultural land use: A comparison of three approaches. Environ. Pollut. 2001, 115, 191–204. [Google Scholar] [CrossRef]
- Barbash, J.E.; Resek, E.A. Pesticides in Ground Water: Distribution, Trends, and Governing Factors; Ann Arbor Press Inc.: Ann Arbor, MI, USA, 1996. [Google Scholar]
- Tedesco, L.P.; Hoffmann, J.; Bihl, L.; Hall, B.E.; Barr, R.C.; Stouder, M. Upper White River Watershed Regional Watershed Assessment and Planning Report; Center for Earth and Environmental Science, IUPUI: Indianapolis, IN, USA, 2011. [Google Scholar]
- Fleming, A.H.; Brown, S.E.; Ferguson, V.R. The Hydrogeologic Framework of Marion County, Indiana at Atlas Illustrating Hydrogeologic Terrain and Sequence; Indiana Geological Survey Open File Report 93-5; Indiana Geological Survey: Bloomington, IN, USA, 1993. [Google Scholar]
- Zhang, R.; Hamerlinck, J.D.; Gloss, S.P.; Munn, L. Determination of nonpoint-source pollution using GIS and numerical models. J. Environ. Qual. 1996, 25, 411–418. [Google Scholar] [CrossRef]
- Tesoriero, A.J.; Inkpen, E.L.; Voss, F.D. Assessing ground-water vulnerability using logistic regression. In Proceedings of the Source Water Assessment and Protection 98 Conference, Dallas, TX, USA, 28–30 April 1998; pp. 157–165. [Google Scholar]
- Arnold, J.G.; Srinivasan, R.; Muttiah, R.S.; Williams, J.R. Large-area hydrologic modeling and assessment: Part I. Model development. J. Am. Water Resour. Assoc. 1998, 34, 73–89. [Google Scholar] [CrossRef]
- Bicknell, B.R.; Imhoff, J.C.; Kittle, J.L., Jr.; Jobes, T.H.; Donigian, A.S., Jr. Hydrological Simulation Program-Fortran, HSPF Version 12 User’s Manual; AQUA TERRA Consultants: Mountain View, CA, USA, 2001. [Google Scholar]
- Knisel, W.G.; Davis, F.M. GLEAMS: Groundwater Loading Effects of Agricultural Management Systems. User Manual Version 3.0; Publication No. SEWRL-WGK/FMD-050199; US Department of Agriculture, Agricultural Research Service, Southeast Watershed Research Laboratory: Tifton, GA, USA, 1999.
- Van Stemproot, D.; Evert, L.; Wassenaar, L. Aquifer vulnerability index: A GIS compatible method for groundwater vulnerability mapping. Can. Water Resour. J. 1993, 18, 25–37. [Google Scholar]
- Vías, J.M.; Andreo, B.; Perles, M.J.; Carrasco, F.; Vadillo, I.; Jiménez, P. Proposed method for groundwater vulnerability mapping in carbonate (karstic) aquifers: The COP method. Hydrogeol. J. 2006, 14, 912–925. [Google Scholar] [CrossRef]
- Foster, S.S.D. Fundamental concepts in aquifer vulnerability, pollution risk and protection strategy. In Vulnerability of Soil and Groundwater to Pollutants; Netherlands Organization for Applied Scientific Research: Hague, The Netherlands, 1987; Volume 38, pp. 69–86. [Google Scholar]
- Daly, D.; Drew, D. Irish methodologies for karst aquifer protection. In Hydrogeology and Engineering Geology of Sinkholes and Karst; Beek, B., Ed.; Balkema: Rotterdam, The Netherlands, 1999; pp. 267–272. [Google Scholar]
- Harter, T.; Walker, L.G. Assessing Vulnerability of Groundwater; California Department of Health Services Report 1–11: Sacramento, CA, USA, 2001. [Google Scholar]
- Rahman, A. A GIS based DRASTIC model for assessing groundwater vulnerability in shallow aquifer in Aligarh, India. Appl. Geogr. 2008, 28, 32–53. [Google Scholar] [CrossRef]
- Aller, L. DRASTIC: A Standardized System for Evaluating Ground Water Pollution Potential Using Hydrogeologic Settings; Robert S. Kerr Environmental Research Laboratory, Office of Research and Development, U.S. Environmental Protection Agency: Ada, OK, USA, 1985. [Google Scholar]
- De Marsily, G. Spatial Variability of Properties in Porous Media: A Stochastic Approach, in Fundamentals of Transport in Porous Media; Bear, J., Corapcioglu, M.Y., Eds.; Martinus Nijhoff: Leiden, The Netherlands, 1984; pp. 719–769. [Google Scholar]
- Poiani, K.A.; Bedford, B.L.; Merrill, M.D. A GIS-based index for relating landscape characteristics to potential nitrogen leaching to wetlands. Landsc. Ecol. 1996, 11, 237–255. [Google Scholar] [CrossRef]
- Zomorodi, K. Curve Number and Groundwater Recharge Credits for LID Facilities in New Jersey. In Proceedings of the Conference “Putting the LID on Stormwater Management!”, College Park, MD, USA, 21–23 September 2004. [Google Scholar]
- Yang, Y.S.; Wang, L. Catchment-scale vulnerability assessment of groundwater pollution from diffuse sources using the DRASTIC method: A case study. Hydrol. Sci. J. 2010, 55, 1206–1216. [Google Scholar] [CrossRef]
- Nobre, R.C.M.; Rotunno Filho, O.C.; Mansur, W.J.; Nobre, M.M.M.; Cosenza, C.A.N. Groundwater vulnerability and risk mapping using GIS, modeling and a fuzzy logic tool. J. Contam. Hydrol. 2007, 94, 277–292. [Google Scholar] [CrossRef] [PubMed]
- Indiana Department of Natural Resources (IDNR), Aquifer Systems Mapping (1:48,000). 2012. Available online: http://www.in.gov/dnr/water/4302.htm (accessed on 7 March 2016).
- Naeini, M.P.; Cooper, G.F.; Hauskrecht, M. Binary Classifier Calibration Using a Bayesian Non-Parametric Approach. In Proceedings of the SIAM International Conference on Data Mining, Vancouver, BC, Canada, 30 April–2 May 2015; pp. 208–216. [Google Scholar]
- Xu, P.; Davoine, F.; Zha, H.; Denœux, T. Evidential calibration of binary SVM classifiers. Int. J. Approx. Reason. 2016, 72, 55–70. [Google Scholar] [CrossRef]
- Getis, A.; Ord, J.K. The Analysis of Spatial Association by Use of Distance Statistics. Geogr. Anal. 1992, 24, 189–206. [Google Scholar] [CrossRef]
- Ord, J.K.; Getis, A. Local Spatial Autocorrelation Statistics: Distributional Issues and an Application. Geogr. Anal. 1995, 27, 286–306. [Google Scholar] [CrossRef]
- Mitchell, A. The ESRI Guide to GIS Analysis; ESRI Press: Redlands, CA, USA, 2005; Volume 2. [Google Scholar]
- Woodrow, K.; Lindsay, J.B.; Berg, A.A. Evaluating DEM conditioning techniques, elevation source data, and grid resolution for field-scale hydrological parameter extraction. J. Hydrol. 2016, 540, 1022–1029. [Google Scholar] [CrossRef]


| Data Type | Source | Format | Scale | Date | Used to Produce |
|---|---|---|---|---|---|
| Water well | IDNR 1 | Point Shapefile | 1:24,000 | 1959–2010 | Depth to water |
| Annual Precipitation | NCDC 2 | Tabular data | - | 1949–2013 | Recharge |
| LULC | MRLC 3 | Raster | 1:250,000 | 2006 | Recharge |
| Aquifer Systems | USGS 4 | Polygon Shapefile Text | 1:48,000 | 2003–2011 | Aquifer media |
| SSURGO 5 | NRCS 6 | Polygon Shapefile | 1:12,000 | 2005 | Recharge Soil media Topography |
| iLITH data | IGS 7 | Point Shapefile | 1:24,000 | 2001 | Impact of vadose |
| Aquifer Transmissivity | IDNR 1 | Point Shapefile | 1:24,000 | 2011 | Conductivity |
| DRASTIC Parameters | Description | Original Weight |
|---|---|---|
| Depth to water (D) | Depth from the ground surface to the water table. Deeper water table levels imply lesser contamination chances. | 5 |
| Recharge (R) | Amount of water entering the aquifer. The amount of recharge is positively correlated with the vulnerability rating. | 4 |
| Aquifer media (A) | Material property of the saturated zone, which controls pollutant attenuation processes based on the permeability of each layer of media. | 3 |
| Soil media (S) | Soil media affects contaminant transport and water from soil surface to the aquifer. | 2 |
| Topography (T) | Slope of the land surface. For low slope, contaminant is less likely to become runoff and more likely to infiltrate. | 1 |
| Impact of vadose zone media (I) | Vadose zone is the typical soil horizon above the water table and below the ground surface. If vadose zone is highly permeable, this will lead to a high vulnerability rating. | 5 |
| Hydraulic conductivity (C) | Hydraulic conductivity represents the ability of the aquifer to transmit water. Hydraulic conductivity is positively correlated with the vulnerability rating. | 3 |
| Aquifer Media | |||
|---|---|---|---|
| Range | Rating (Typical) | Vulnerability (IDNR Report) | Rating (Modified) |
| Karst limestone | 10 | Very high | 10 |
| Basalt | 9 | High | 8 |
| Sand and gravel | 8 | Moderate | 6 |
| Massive sandstone Massive limestone | 7 | Low | 4 |
| Bedded sandstone Limestone Shale | 6 | Very Low | 2 |
| Glacial till | 5 | ||
| Weathered metamorphic | 4 | ||
| Metamorphic Igneous | 3 | ||
| Massive shale | 2 | ||
| GA Driving Variables | Values |
|---|---|
| Population size | 100 |
| Max generation | 10,000 |
| Initial random value | 1000 |
| Min. value of parameters | 0 |
| Max. value of parameters | 6 |
| Crossover probability | 0.5 |
| Mutation probability | 0.02 |
| Calibration Methods | D | R | A | S | T | I | C | RMSE |
|---|---|---|---|---|---|---|---|---|
| No calibration | 5 | 4 | 3 | 2 | 1 | 5 | 3 | 0.70 |
| Bi-GA 1 | 5.7 | 4.3 | 3 | 1.6 | 0.7 | 5.4 | 2.8 | 0.57 |
| Uncalibrated DRASTIC | Calibrated DRASTIC | |||
|---|---|---|---|---|
| Reference Data | Reference Data | |||
| Classification | >2 ppm | >2 ppm | ||
| Very high + high 1 (>2 ppm) | 12 | Very high + high 1 (>2 ppm) | 16 | |
| Others 2 (≤2 ppm) | 23 | Others 2 (≤2 ppm) | 19 | |
| Class | Area (%) | Number of Nitrate Detections >2 ppm |
|---|---|---|
| Very low | 10.6 | 1 (0.9%) |
| Low | 60.4 | 4 (3.4%) |
| Moderate | 25.8 | 70 (60.3%) |
| High | 3.0 | 34 (29.3%) |
| Very high | 0.2 | 7 (6%) |
| Class | Area (%) | Number of Nitrate Detections >2 ppm |
|---|---|---|
| Very low | 9.6 | 0 (0%) |
| Low | 60.1 | 5 (4.3%) |
| Moderate | 26.9 | 62 (53.4%) |
| High | 3.2 | 42 (36.2%) |
| Very high | 0.2 | 7 (6%) |
| Navulur (1996) | ||||
|---|---|---|---|---|
| DRASTIC | SEEPAGE | Combined DL 1 | DRASTIC 2 | |
| HV-Area 3 (%) | 24.8 | 28.6 | 56.9 | 3.4 |
| N-Detections 4 (%) | 80.7 | 60.5 | 91.8 | 42.2 |
| Detection Ratio | 3.3 | 2.1 | 1.6 | 12.4 |
| Calibration Methods | Potential Groundwater Monitoring and Management Sites (%) | ||
|---|---|---|---|
| Z-Scores | |||
| 1.65–1.96 | 1.96–2.58 | >2.58 | |
| Bi-GA | 3.4 | 5.6 | 10.9 |
© 2017 by the authors. Licensee MDPI, Basel, Switzerland. This article is an open access article distributed under the terms and conditions of the Creative Commons Attribution (CC BY) license (http://creativecommons.org/licenses/by/4.0/).
Share and Cite
Jang, W.S.; Engel, B.; Harbor, J.; Theller, L. Aquifer Vulnerability Assessment for Sustainable Groundwater Management Using DRASTIC. Water 2017, 9, 792. https://doi.org/10.3390/w9100792
Jang WS, Engel B, Harbor J, Theller L. Aquifer Vulnerability Assessment for Sustainable Groundwater Management Using DRASTIC. Water. 2017; 9(10):792. https://doi.org/10.3390/w9100792
Chicago/Turabian StyleJang, Won Seok, Bernard Engel, Jon Harbor, and Larry Theller. 2017. "Aquifer Vulnerability Assessment for Sustainable Groundwater Management Using DRASTIC" Water 9, no. 10: 792. https://doi.org/10.3390/w9100792
APA StyleJang, W. S., Engel, B., Harbor, J., & Theller, L. (2017). Aquifer Vulnerability Assessment for Sustainable Groundwater Management Using DRASTIC. Water, 9(10), 792. https://doi.org/10.3390/w9100792