
Analysis of the Course and Frequency of High Water Stages in Selected Catchments of the Upper Vistula Basin in the South of Poland


Abstract
:1. Introduction
2. Characterization of Study Catchments
3. Materials and Methods
3.1. Trend Detection for High Water Stage Metrics
3.2. Homogeneity of Statistical Data
3.3. Heteroscedasticity
3.4. Time Series Periodicity
4. Results and Discussion
5. Conclusions
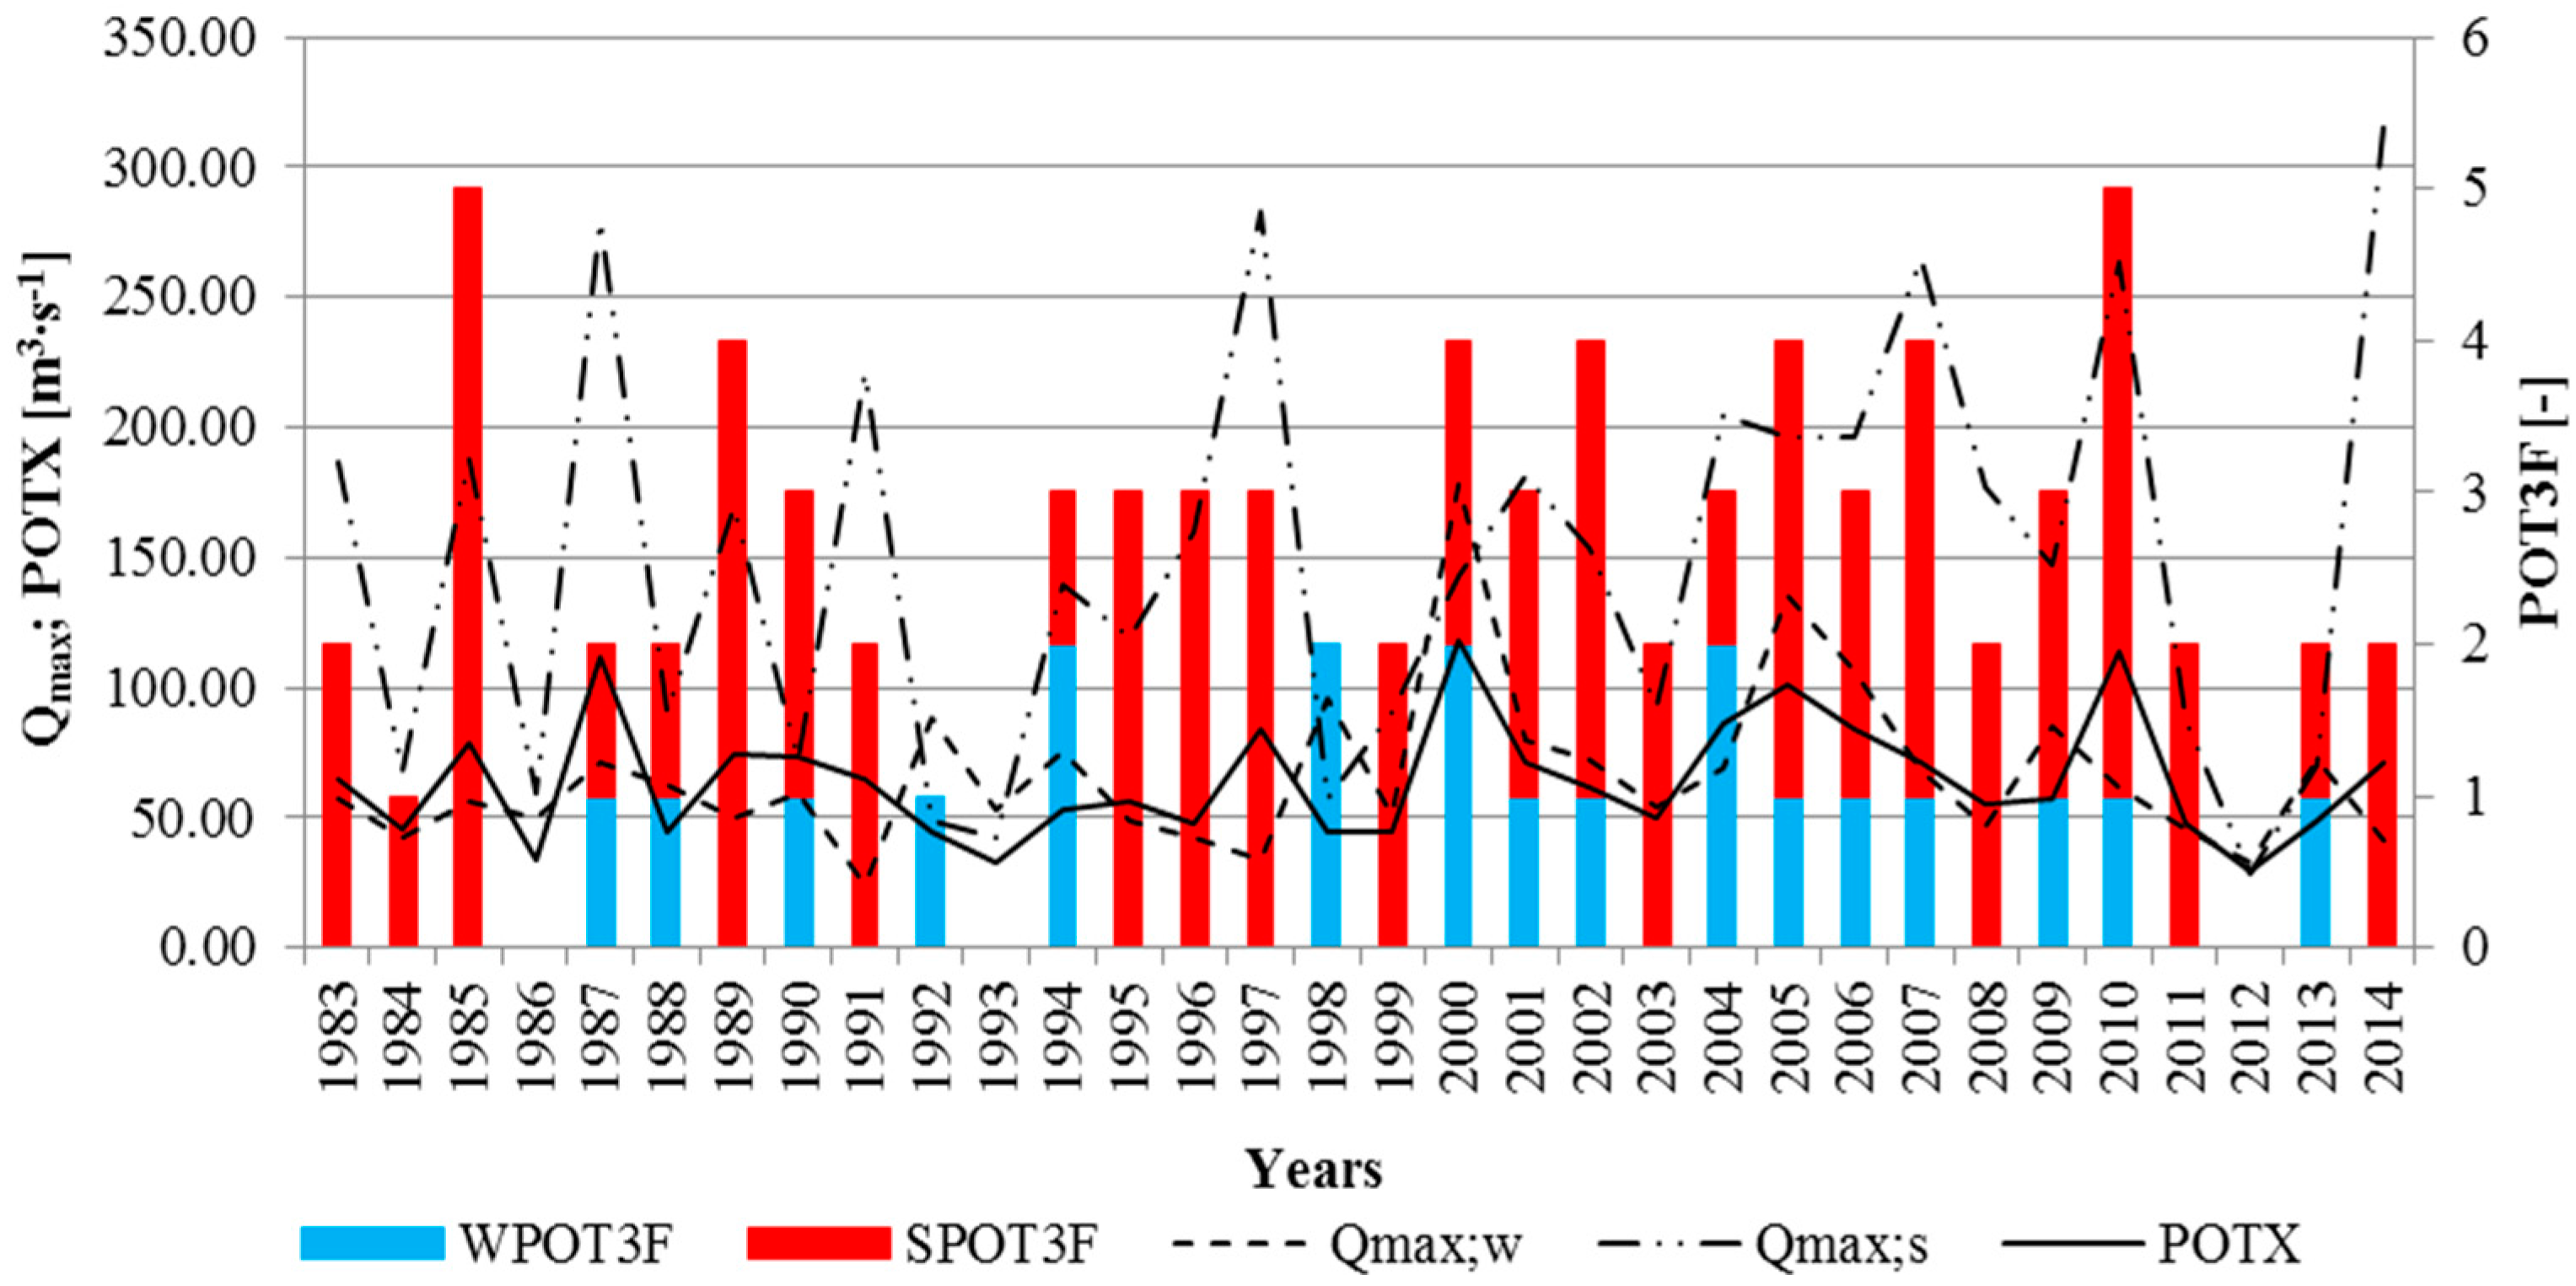
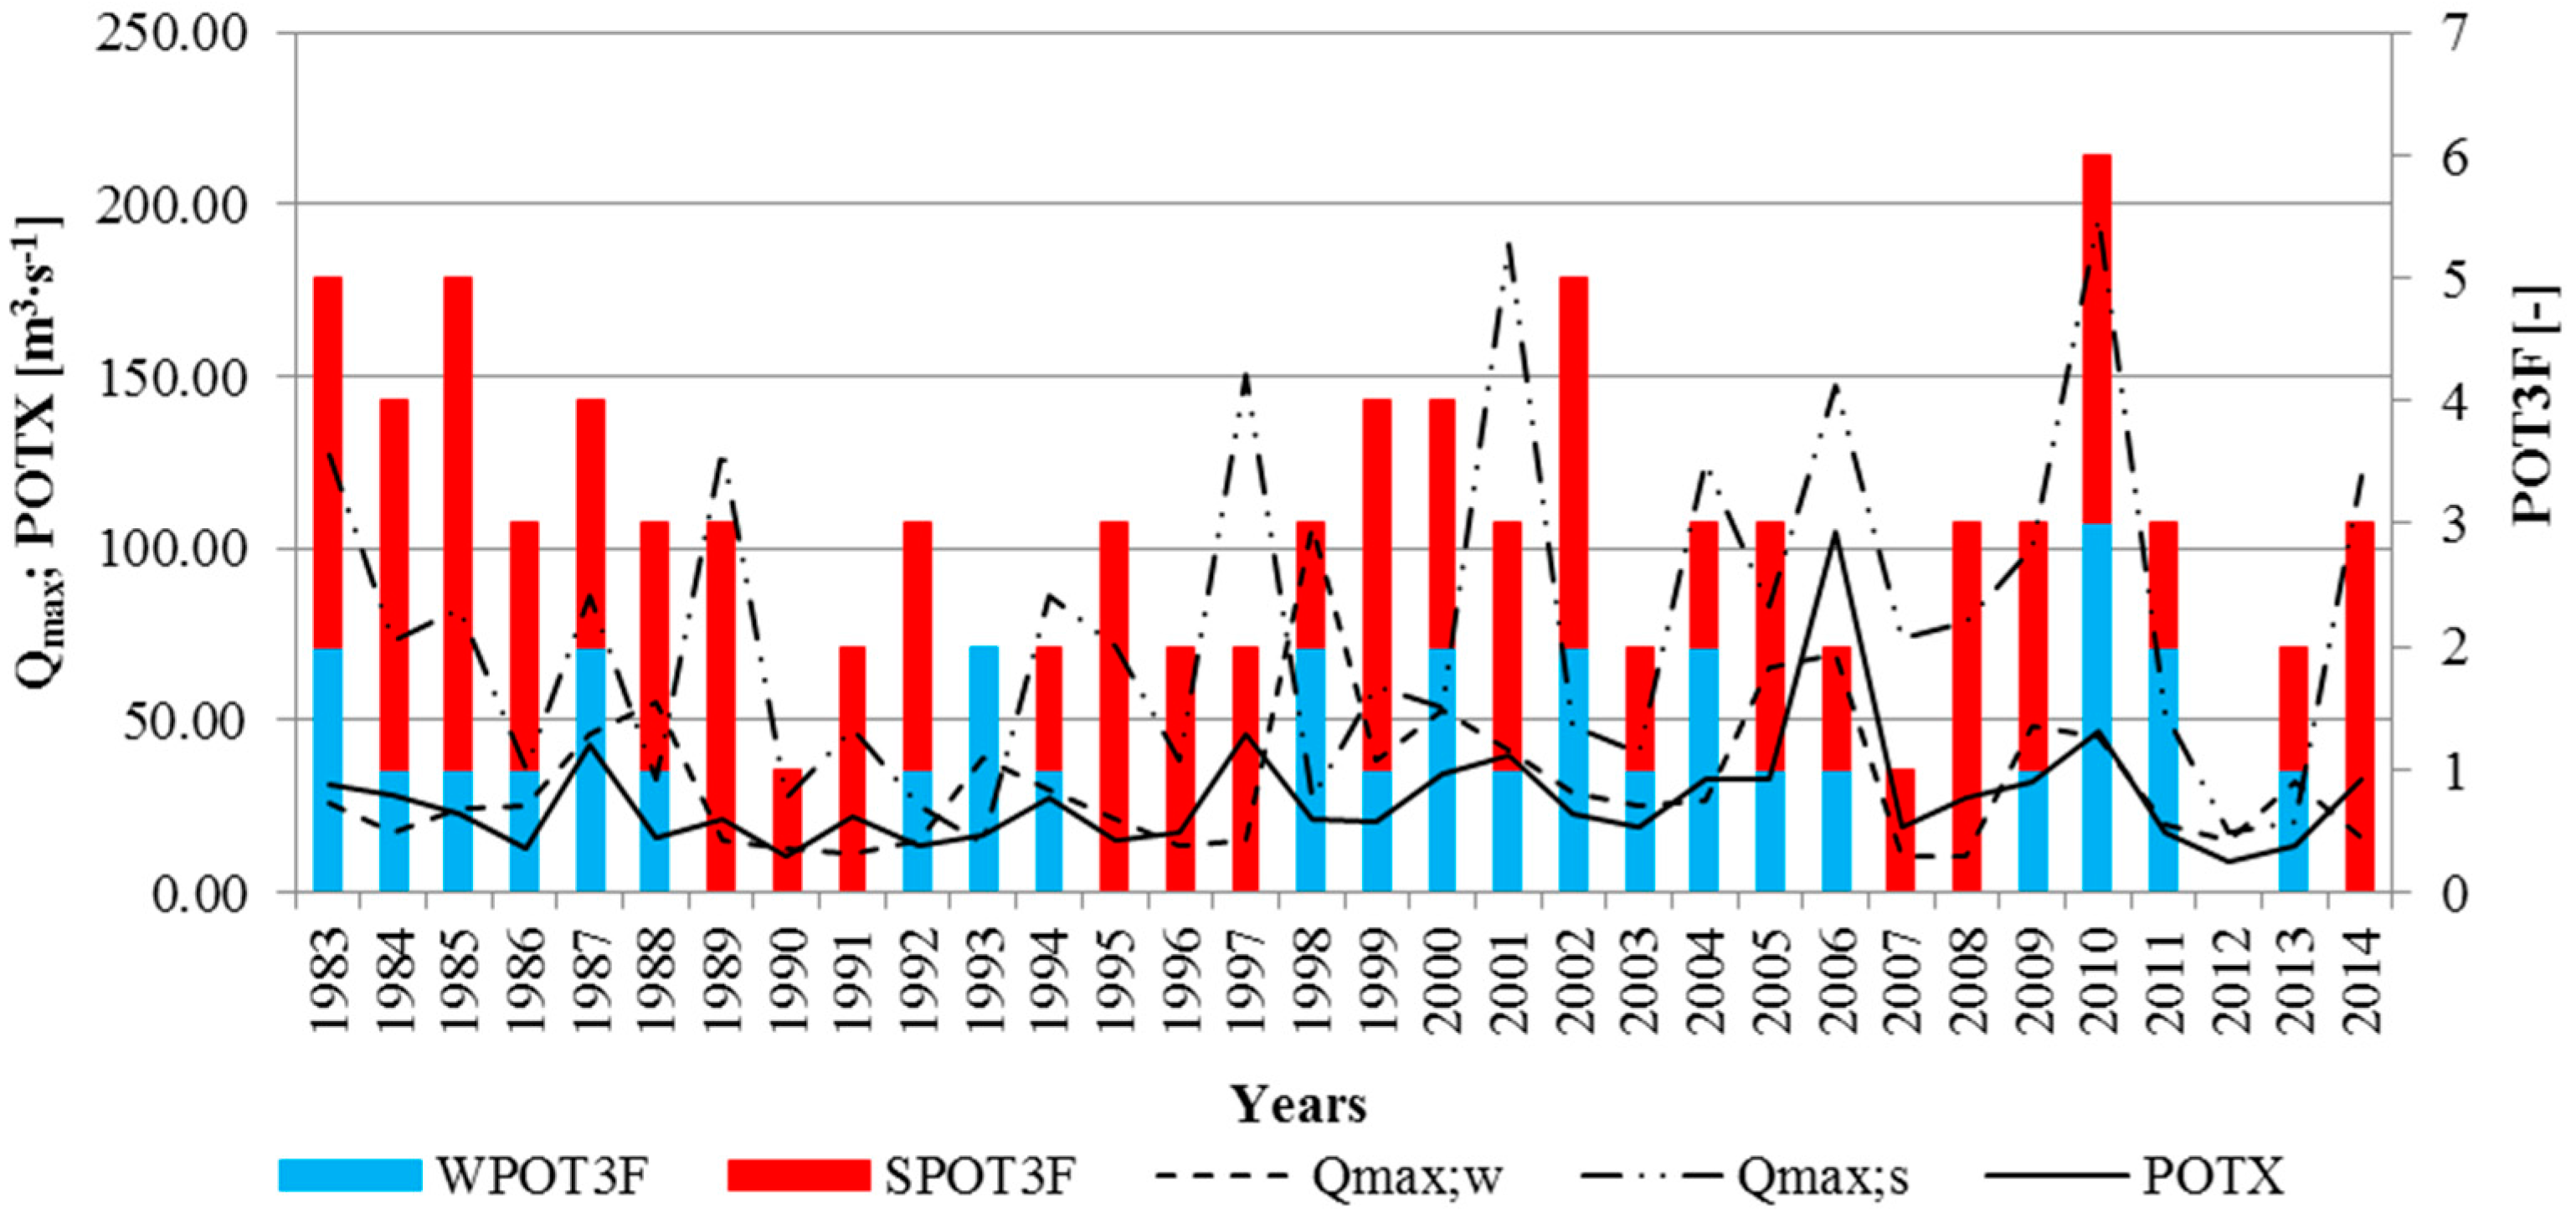
- Long-term hydrometric measurements conducted in the study catchments usually indicated upward trends for maximum flows and increasing incidence of high water stages. However, these trends were not significant.
- No significant differences in high water stage metrics were detected for the Dunajec, the Kamienica, and the San. Therefore, it may be concluded that no factor significantly affecting the runoff of high water from these catchments has appeared in the investigated multi-year period. Significant differences between the analyzed metrics (Qmax and POTX) were detected for the Rudawa and the Wisłok, respectively. Additionally, no significant differences in the variances for these metrics were found in each of the cases.
- Although the detected trends were not significant, the hydrological parameters and meteorological factors should be still monitored in order to capture any changes in the trend significance and the factors affecting their fluctuations.
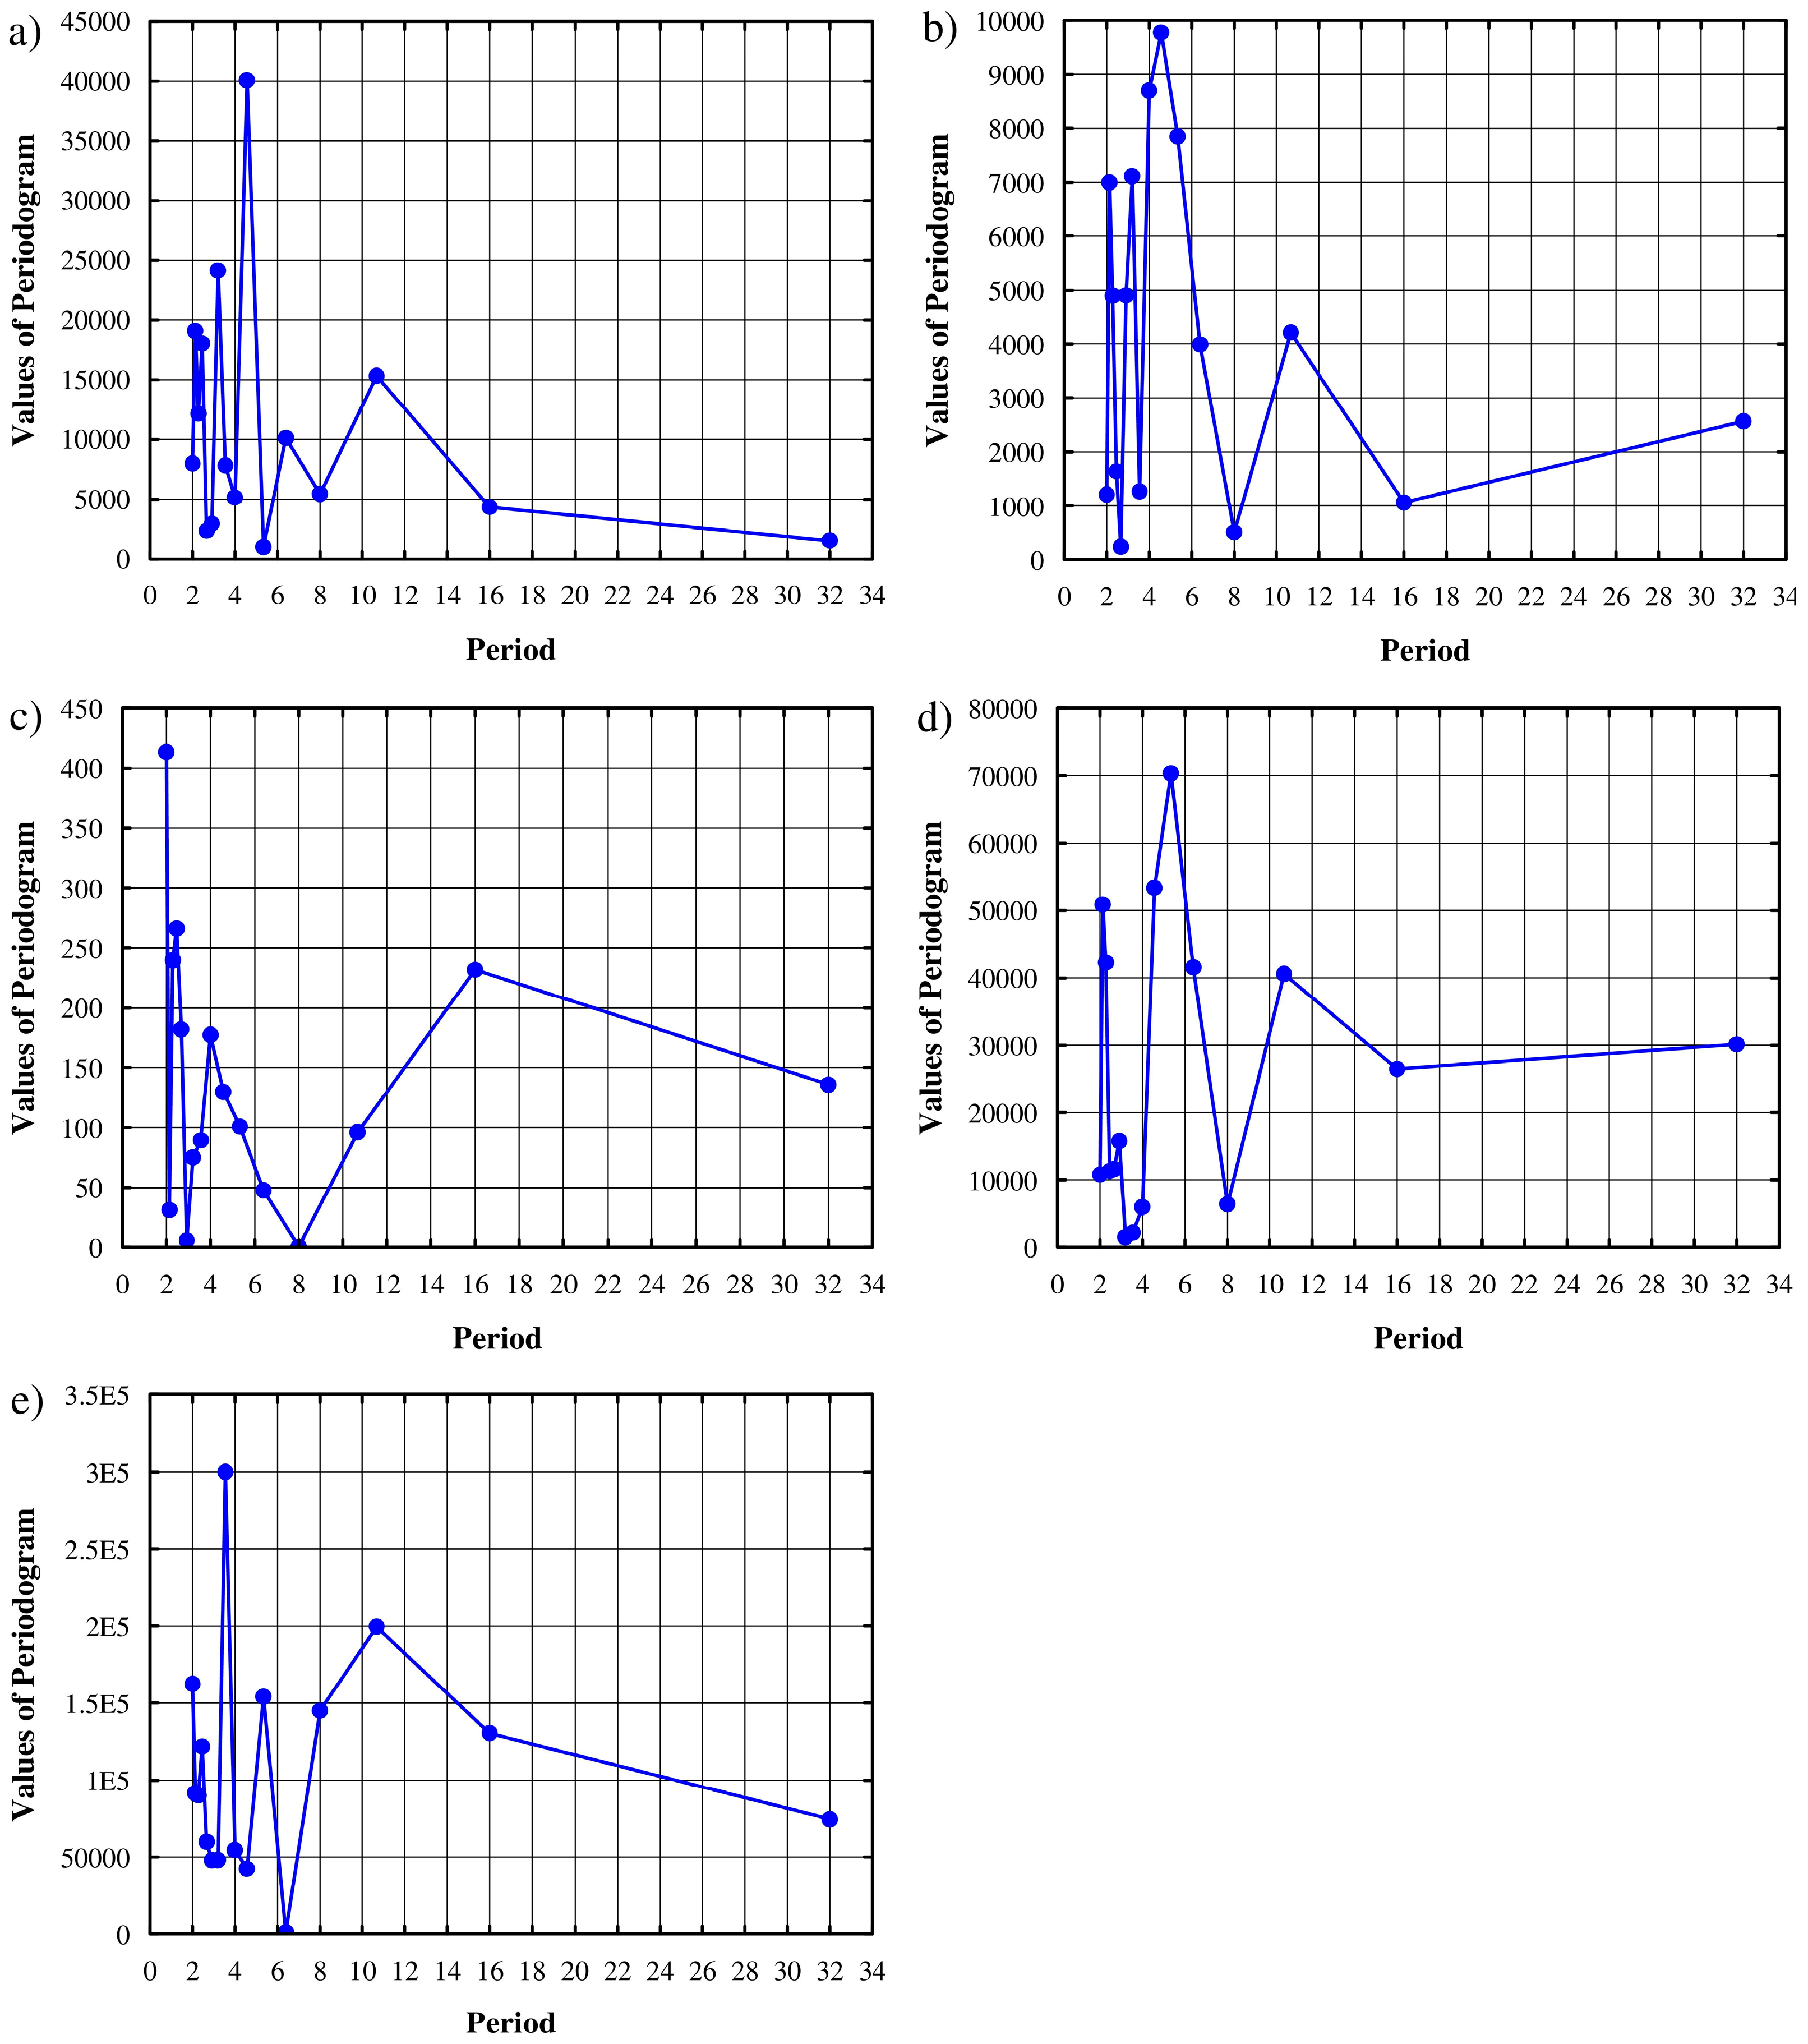
- Spectral analysis indicates that Qmax shows the same cyclic behavior in the five analyzed basins.
Acknowledgments
Author Contributions
Conflicts of Interest
References
- Du, S.; Gu, H.; Wen, J.; Chen, K.; Van Rompaey, A. Detecting flood variations in Shanghai over 1949–2009 with Mann-Kendall Tests and a Newspaper-Based Database. Water 2015, 7, 1808–1824. [Google Scholar] [CrossRef]
- Kundzewicz, Z.W. Change detection in high river flows in Europe. In Proceedings of the Symposium S6 Held during the Seventh IAHS Scientific Assembly, Foz do Iguaçu, Brazil, 3–9 April 2005; pp. 71–80.
- Kundzewicz, Z.W.; Ulbrich, U.; Brucher, T.; Graczyk, D.; Kruger, A.; Leckebusch, G.C.; Menzel, L.; Pińskwar, I.; Radziejewski, M.; Szwed, M. Summer floods in Central Europe—Climate change track? Nat. Hazards 2005, 36, 165–189. [Google Scholar] [CrossRef]
- Perju, E.R.; Zahara, L. Changes in the frequency and magnitude of floods in the Bucegi Mountains (Romanian Carpathians). In Proceedings of the Water Resources and Wetlands, Tulcea, Romania, 11–13 September 2014; pp. 321–328.
- Mendez, F.J.; Mendez, M.; Luceno, A.; Losada, I.J. Estimation of the long-term variability of extreme significant wave height using a time-dependent Peak over Threshold (POT) model. J. Geophys. Res. 2006, 111, 1–13. [Google Scholar] [CrossRef]
- Svensson, C.; Hannaford, J.; Kundzewicz, Z.W.; Marsh, T.J. Trends in river floods: Why is there no clear signal in observations? Front. Flood Res. (IAHS Publ.) 2006, 305, 1–8. [Google Scholar]
- Hattermann, F.F.; Kundzewicz, Z.W.; Huang, S.; Vetter, T.; Gerstengarbe, F.W.; Werner, P. Climatological drivers of changes in flood hazard in Germany. Acta Geophys. 2013, 61, 463–477. [Google Scholar] [CrossRef]
- Tian, P.; Zhao, G.; Li, J.; Tian, K. Extreme value analysis of stream flow time series in Poyang Lake Basin, China. Water Sci. Eng. 2011, 4, 121–132. [Google Scholar]
- Lindström, G.; Bergström, S. Runoff trends in Sweden 1807–2002. Hydrol. Sci. J. 2004, 49, 69–83. [Google Scholar] [CrossRef]
- Villarini, G.; Smith, J.A.; Serinaldi, F.; Ntelekos, A.A. Analyses of seasonal and annual maximum daily discharge records for central Europe. J. Hydrol. 2011, 399, 299–312. [Google Scholar] [CrossRef]
- Mudelsee, M.; Börngen, M.; Tetzlaff, G.; Grünewald, U. Extreme floods in central Europe over the past 500 years: Role of cyclone pathway “Zugstrasse Vb”. J. Geophys. Res. 2004, 109, 689–693. [Google Scholar] [CrossRef]
- Kundzewicz, Z.W.; Graczyk, D.; Maurer, T.; Pińskwa, I.; Radziejewski, M.; Svensson, C.; Szwed, M. Trend detection in river flow series: 1. Annual maximum flow. Hydrol. Sci. J. 2005, 50, 797–810. [Google Scholar] [CrossRef]
- Hirabayashi, Y.; Kanae, S.; Emori, S.; Oki, T.; Kimoto, M. Global projections of changing risks of floods and droughts in a changing climate. Hydrol. Sci. J. 2008, 53, 754–773. [Google Scholar] [CrossRef]
- Douglas, E.M.; Vogel, R.M.; Kroll, C.N. Trends in floods and low flows in the United States: Impact of spatial correlation. J. Hydrol. 2000, 240, 90–105. [Google Scholar] [CrossRef]
- Nka, B.N.; Oudin, L.; Karambiri, H.; Paturel, J.E.; Ribstein, P. Trends in floods in West Africa: Analysis based on 11 catchments in the region. Hydrol. Earth Syst. Sci. 2015, 19, 4707–4719. [Google Scholar] [CrossRef]
- Zhang, Q.; Jiang, T.; Gemmer, M.; Becker, S. Precipitation, temperature and runoff analysis from 1950 to 2002 in the Yangtze Basin, China. Hydrol. Sci. J. 2005, 50, 65–80. [Google Scholar]
- Tao, H.; Gemmer, M.; Bai, Y.; Su, B.; Mao, W. Trends of stream flow in the Tarim River Basin during the past 50 years: Human impact or climate change? J. Hydrol. 2011, 400, 1–9. [Google Scholar] [CrossRef]
- Asadieh, B.; Krakauer, N.Y.; Fekete, B.M. Historical trends in mean and extreme runoff and streamflow based on observations and climate models. Water 2016, 8, 189. [Google Scholar] [CrossRef]
- Piętka, I. Long-term variations of spring runoff of Polish rivers. Prace Studia Geograficzne 2009, 43, 81–95. (In Polish) [Google Scholar]
- Banasik, K.; Hejduk, L. Long-term changes in Runoff from a Small Agricultural catchment. Soil Water Res. 2012, 7, 64–72. [Google Scholar]
- Banasik, K.; Hejduk, L.; Hejduk, A.; Kaznowska, E.; Banasik, J.; Byczkowski, A. Long-term variability of runoff from a small catchment in the region of the Kozienice Forest. Sylwan 2013, 158, 578–586. (In Polish) [Google Scholar]
- Kundzewicz, Z.W.; Stoffel, M.; Kaczka, R.J.; Wyżga, B.; Niedźwiedź, T.; Pińskwar, I.; Ruiz-Villanueva, V.; Łupikasza, E.; Czajka, B.; Ballesteros-Canovas, J.A.; et al. Floods at the northern foothills of the Tatra Mountains—A Polish-Swiss research project. Acta Geophys. 2014, 62, 620–641. [Google Scholar] [CrossRef]
- Chowdhury, R.K.; Eslamian, S. Climate change and hydrologic modeling. In Handbook of Hydrology: Modelling, Climate Change and Variability; Eslamian, S., Ed.; CRC Press: London, UK, 2014; pp. 71–86. [Google Scholar]
- Svensson, C.; Kundzewicz, Z.W.; Maurer, T. Trend detection in river flow series: 2. Flood and low-flow index series. Hydrol. Sci. J. 2005, 50, 811–824. [Google Scholar] [CrossRef]
- Wałęga, A.; Młyński, D. Assesment of seasonal occurance of minimum flow for mountain river by Colwell indices. Infrastruktura Ekologia Terenów Wiejskich 2016, 2, 557–568. (In Polish) [Google Scholar]
- Gyorffy, B.; Gyorffya, A.; Tulassay, Z. The problem of multiple testing and its solutions for genom-wide studies. Orvosi Hetil. 2005, 146, 559–563. [Google Scholar]
- Petrow, T.; Merz, B. Trends in flood magnitude, frequency and seasonality in Germany in the period 1951–2002. J. Hydrol. 2009, 371, 129–141. [Google Scholar] [CrossRef]
- Yue, S.; Pilon, P. A comparison of the power of the t test, Mann-Kendall and bootstrap tests for trend detection. Hydrol. Sci. J. 2004, 49, 21–37. [Google Scholar] [CrossRef]
- Rutkowska, A.; Ptak, M. On certain stationary tests for hydrological series. Stud. Geotech. Mech. 2012, 34, 51–63. [Google Scholar]
- ÇiÇek, I.; Duman, N. Seasonal and annual precipitation trends in Turkey. Carpath. J. Earth Environ. Sci. 2015, 10, 77–84. [Google Scholar]
- Jones, J.J.A.; Liu, C.; Woo, M.; Kung, H. Regional Hydrological Response to Climate Change; Kluwer Academic Publisher: London, UK, 1996. [Google Scholar]
- Levene, H. Robust tests for equality of variances. In Contributions to Probability and Statistics: Essays in Honor of Harold Hotelling; Olkin, I., Hotteling, H., Eds.; Stanford University Press: Redwood City, CA, USA, 1960; pp. 278–292. [Google Scholar]
- Walega, A.; Michalec, B. Characteristics of extreme heavy precipitation events occurring in the area of Cracow (Poland). Soil Water Res. 2014, 9, 182–191. [Google Scholar]
- Haan, C.T. Statistical Methods in Hydrology; The Iowa Stat Press: Ames, IA, USA, 2002. [Google Scholar]
- Bednarczyk, S.; Jarzębińska, T.; Mackiewicz, S.; Wołoszyn, E. Vademecum Ochrony Przeciwpowodziowej; Krajowy Zarząd Gospodarki Wodnej: Gdańsk, Poland, 2006; p. 326. (In Polish) [Google Scholar]
- Ziernicka-Wojtaszek, A.; Kaczor, G. The intensity and amount of precipitation in both the city of Krakow and the neighbouring areas during the May–June flood. Acta Scientiarum Polonorum Formatio Circumiectus 2010, 12, 143–151. (In Polish) [Google Scholar]
- Walega, A.; Młyński, D. Kokoszka, R. Verification of selected empirical methods for the calculation of minimum and mean flows in catchments of the Dunajec basin. Infrastruktura Ekologia Terenów Wiejskich 2014, II/3, 825–837. (In Polish) [Google Scholar]
- Walega, A.; Młyński, D.; Kokoszka, R.; Miernik, W. Possibilities of applying hydrological methods for determining environmental flows in select catchments of the upper Dunajec basin. Pol. J. Environ. Stud. 2015, 44, 2663–2676. [Google Scholar] [CrossRef]
- Walega, A.; Młyński, D. Verification of Punzet equation to calculate flood frequency in mountain and high land river in upper basin Vistula. Infrastruktura Ekologia Terenów Wiejskich 2015, IV, 873–885. (In Polish) [Google Scholar]
- Pińskwar, I. Projections of Changes in Precipitation Extremes in Poland; Komitet Gospodarki Wodnej PAN: Warsaw, Poland, 2010; p. 183. (In Polish) [Google Scholar]
- Kundzewicz, Z.; Stoffel, M.; Małarzewski, Ł. Climatological background of floods at the northern foothills of the Tatra Mountains. Theor. Appl. Climatol. 2014, 119, 273–284. [Google Scholar]
- Falarz, M. Long-term variability in reconstructed and observed snow coverover the last 100 winter seasons in Cracow and Zakopane (southern Poland). Clim. Res. 2002, 19, 247–256. [Google Scholar] [CrossRef] [Green Version]
- Czarnecka, M.; Nidzgorska-Lencewicz, J. Multiannual variability of seasonal precipitation in Poland. Woda-Środowisko-Obszary Wiejskie 2012, 12, 45–60. (In Polish) [Google Scholar]


| Metric | Unit | Description |
|---|---|---|
| Qmax | m3·s−1 | The highest flow observed during a hydrological year (max{Qmax;w; Qmaxs}) |
| Qmax;w | m3·s−1 | The highest flow observed during the winter half-year (1 November–30 April) |
| Qmax;s | m3·s−1 | The highest flow observed during the summer half-year (1 May–30 October) |
| POTX | m3·s−1 | Mean size of the flow determined based on high water stages exceeding the assumed threshold value |
| POT3F | – | Number of high water stages exceeding the threshold value for each hydrological year (ΣZPOT3F + SPOT3F) |
| WPOT3F | – | Number of high water stages exceeding the threshold value for the winter half-year (1 November–30 April) |
| SPOT3F | – | Number of high water stages exceeding the threshold value for the summer half-year (1 May–30 October) |
| Metric | Range | Mann-Kendall S | Test Z | p | Trend for the Significance Level α = 0.05 |
|---|---|---|---|---|---|
| Dunajec–Nowy Targ-Kowaniec cross-section | |||||
| Qmax [m3∙s−1] | 33.30–283.00 | 54 | 0.86 | 0.28 | non-significant |
| Qmax;w [m3∙s−1] | 24.40–178.00 | 20 | 0.31 | 0.38 | non-significant |
| Qmax;s [m3∙s−1] | 28.50–283.00 | 52 | 0.83 | 0.28 | non-significant |
| POTX [m3∙s−1] | 29.10–118.20 | 13 | 0.19 | 0.39 | non-significant |
| POT3F [–] | 0–5 | 46 | 0.79 | 0.29 | non-significant |
| WPOT3F [–] | 0–2 | 48 | 0.85 | 0.28 | non-significant |
| SPOT3F [–] | 0–5 | 28 | 0.49 | 0.35 | non-significant |
| Rudawa–Balice cross-section | |||||
| Qmax [m3∙s−1] | 3.72–32.90 | 87 | 1.39 | 0.15 | non-significant |
| Qmax;w [m3∙s−1] | 2.68–28.20 | 80 | 1.28 | 0.18 | non-significant |
| Qmax;s [m3∙s−1] | 1.82–32.90 | 75 | 1.320 | 0.19 | non-significant |
| POTX [m3∙s−1] | 3.28–17.95 | 40 | 0.63 | 0.33 | non-significant |
| POT3F [–] | 0–8 | 43 | 0.73 | 0.31 | non-significant |
| WPOT3F [–] | 0–4 | 53 | 0.87 | 0.27 | non-significant |
| SPOT3F [–] | 0–6 | 16 | 0.29 | 0.38 | non-significant |
| Kamienica–Nowy Sącz cross-section | |||||
| Qmax [m3∙s−1] | 17.40–196.00 | 25 | 0.39 | 0.37 | non-significant |
| Qmax;w [m3∙s−1] | 10.10–106.00 | 26 | 0.41 | 0.37 | non-significant |
| Qmax;s [m3∙s−1] | 14.60–196.00 | 29 | 0.45 | 0.36 | non-significant |
| POTX [m3∙s−1] | 9.25–104.95 | 49 | 0.78 | 0.29 | non-significant |
| POT3F [–] | 0–6 | −83 | −1.39 | 0.15 | non-significant |
| WPOT3F [–] | 0–3 | −15 | −0.28 | 0.38 | non-significant |
| SPOT3F [–] | 0–4 | −101 | −1.70 | 0.09 | non-significant |
| Wisłok–Tryńcza cross-section | |||||
| Qmax [m3∙s−1] | 69.50–554.00 | 58 | 0.92 | 0.26 | non-significant |
| Qmax;w [m3∙s−1] | 49.90–460.00 | 60 | 0.96 | 0.25 | non-significant |
| Qmax;s [m3∙s−1] | 35.80–554.00 | 81 | 1.30 | 0.17 | non-significant |
| POTX [m3∙s−1] | 48.33–258.00 | 98 | 1.57 | 0.12 | non-significant |
| POT3F [–] | 0–6 | 89 | 1.50 | 0.13 | non-significant |
| WPOT3F [–] | 0–3 | 70 | 1.23 | 0.19 | non-significant |
| SPOT3F [–] | 0–3 | 75 | 1.30 | 0.17 | non-significant |
| San–Przemyśl cross-section | |||||
| Qmax [m3∙s−1] | 140.00–945.00 | −10 | −0.15 | 0.39 | non-significant |
| Qmax;w [m3∙s−1] | 103.00–945.00 | 19 | 0.29 | 0.38 | non-significant |
| Qmax;s [m3∙s−1] | 100.00–850.00 | 21 | 0.61 | 0.73 | non-significant |
| POTX [m3∙s−1] | 92.50–324.00 | 51 | 0.81 | 0.29 | non-significant |
| POT3F [–] | 0–8 | 5 | 0.11 | 0.40 | non-significant |
| WPOT3F [–] | 0–4 | 19 | 0.32 | 0.38 | non-significant |
| SPOT3F [–] | 0–4 | 19 | 0.34 | 0.38 | non-significant |
| Metric | Unit | Values of Tests and Probability of the Test (p) | |||
|---|---|---|---|---|---|
| χ2 | p 1 | W | p 1 | ||
| Dunajec–Nowy Targ-Kowaniec cross-section | |||||
| Qmax | [m3∙s−1] | 0.960 | 0.327 | 0.004 | 0.948 |
| POTX | [m3∙s−1] | 1.278 | 0.258 | 0.463 | 0.501 |
| POT3F | [–] | 1.511 | 0.219 | 0.067 | 0.797 |
| Kamienica–Nowy Sącz cross-section | |||||
| Qmax | [m3∙s−1] | 0.278 | 0.598 | 1.703 | 0.202 |
| POTX | [m3∙s−1] | 2.505 | 0.113 | 1.328 | 0.259 |
| POT3F | [–] | 0.014 | 0.906 | 0.175 | 0.,678 |
| Rudawa–Balice cross-section | |||||
| Qmax | [m3∙s−1] | 3.990 | 0.046 | 0.071 | 0.791 |
| POTX | [m3∙s−1] | 2.566 | 0.111 | 0.189 | 0.667 |
| POT3F | [–] | 2.413 | 0.120 | 0.274 | 0.604 |
| Wisłok–Tryńcza cross-section | |||||
| Qmax | [m3∙s−1] | 1.998 | 0.158 | 1.663 | 0.207 |
| POTX | [m3∙s−1] | 4.143 | 0.041 | 1.102 | 0.302 |
| POT3F | [–] | 2.681 | 0.102 | 0.378 | 0.543 |
| San–Przemyśl cross-section | |||||
| Qmax | [m3∙s−1] | 0.007 | 0.791 | 0.277 | 0.610 |
| POTX | [m3∙s−1] | 1.547 | 0.214 | 3.789 | 0.061 |
| POT3F | [–] | 0.594 | 0.441 | 0.006 | 0.936 |
© 2016 by the authors; licensee MDPI, Basel, Switzerland. This article is an open access article distributed under the terms and conditions of the Creative Commons Attribution (CC-BY) license (http://creativecommons.org/licenses/by/4.0/).
Share and Cite
Walega, A.; Młyński, D.; Bogdał, A.; Kowalik, T. Analysis of the Course and Frequency of High Water Stages in Selected Catchments of the Upper Vistula Basin in the South of Poland. Water 2016, 8, 394. https://doi.org/10.3390/w8090394
Walega A, Młyński D, Bogdał A, Kowalik T. Analysis of the Course and Frequency of High Water Stages in Selected Catchments of the Upper Vistula Basin in the South of Poland. Water. 2016; 8(9):394. https://doi.org/10.3390/w8090394
Chicago/Turabian StyleWalega, Andrzej, Dariusz Młyński, Andrzej Bogdał, and Tomasz Kowalik. 2016. "Analysis of the Course and Frequency of High Water Stages in Selected Catchments of the Upper Vistula Basin in the South of Poland" Water 8, no. 9: 394. https://doi.org/10.3390/w8090394
APA StyleWalega, A., Młyński, D., Bogdał, A., & Kowalik, T. (2016). Analysis of the Course and Frequency of High Water Stages in Selected Catchments of the Upper Vistula Basin in the South of Poland. Water, 8(9), 394. https://doi.org/10.3390/w8090394