Article

Long-Term Comparison of Disinfection By-Product Formation Potential in a Full Scale Treatment Plant Utilizing a Multi-Coagulant Drinking Water Treatment Scheme

by
Andrew T. Skeriotis
1,*,
Nancy P. Sanchez
1,†,
Marla Kennedy
1,
David W. Johnstone
2 and
Christopher M. Miller
1
1
Department of Civil Engineering, University of Akron, 210 Auburn Science and Engineering Center, Akron, OH 44325, USA
2
Department of Civil Engineering, Ohio Northern University, 107 Biggs Engineering Building, Ada, OH 45810, USA
*
Author to whom correspondence should be addressed.
Current address: Department of Civil and Environmental Engineering, Rice University, Houston, TX 77005, USA
Water 2016, 8(8), 318; https://doi.org/10.3390/w8080318
Submission received: 2 June 2016 / Revised: 7 July 2016 / Accepted: 21 July 2016 / Published: 29 July 2016

Abstract

:
A comparative study of two coagulants, aluminum sulfate (Alum) and aluminum chlorohydrate (ACH), used in parallel in a full scale water treatment plant (WTP) in Ohio from October 2009 to December 2012, was conducted to determine disinfection by-product (DBP) formation potential removal based on both dissolved organic matter (DOM) and fluorescence-derived metrics. Water quality parameters and fluorescence intensity of water samples collected before and after coagulation were measured three times per week and fluorescence matrices were analyzed using parallel factor (PARAFAC) analysis, while DBP formation potential was measured in a weekly basis in pre- and post-coagulation water samples. This study revealed that Alum consistently removed more trihalomethane (THM) formation potential per mg/L of dissolved organic carbon (DOC) than ACH. ACH treated waters averaged approximately 33% more THM formation potential when normalized to DOC. Similarly, haloacetic acid (HAA) formation potential averaged 10% higher in ACH treated waters. From the fluorescence analysis, PARAFAC components C1 and C2 (humic-like fluorophores groups) removal were 23% and 16% higher, respectively, with Alum when compared to ACH. Monte Carlo simulations, based on neural network models developed from the field data, were performed to compare DBP formation across a wide range of conditions. At similar pH, the model results showed that ACH coagulated water had 13% and 20% higher THM and HAA formation potential, respectively, when compared with Alum. The observations from this study reveal that a coagulant’s preferential removal of DBP precursors has an impact on DBP formation despite similar DOC removal.

1. Introduction

Surface water treatment plants (WTP) face many challenges including stricter regulations on disinfection by-products (DBP) levels imposed by the United States Environmental Protection Agency (U.S. EPA). DBPs that are currently regulated by the U.S. EPA are trihalomethanes (THM) and haloacetic acids (HAA), which must have local annual running averages of less than 80 µg/L and 60 µg/L respectively [1]. Surface waters ubiquitously contain natural organic matter (NOM), whose dissolved portion, quantified as dissolved organic carbon (DOC) [2], reacts with chlorine during disinfection to form THMs [3] and HAAs. A robust approach to limit the formation of DBPs is to maximize DOC removal via coagulation. Optimization of the coagulation process includes the selection of appropriate coagulant and dose in order to achieve DOC removal levels that will keep the treatment facility in compliance while controlling associated chemical costs. Optimal coagulant doses including preoxidation can be difficult to determine because of the dynamic nature of DOC. Jar tests are typically used to optimize treatment processes; however, there may be some limitations. An issue with jar tests is that only one sample of source water is typically used, therefore, the spatial and temporal variability of the nature of DOC is not properly captured [4]. Since the chemical character of DOC is dynamic, treatment processes must respond to these dynamics and include adaptive strategies. WTPs must be able to adjust their treatment processes as the DOC in the surface water changes, which is a limitation associated with the use of jar tests. The purpose of this study is to compare two coagulants, aluminum sulfate (Alum) and aluminum chlorohydrate (ACH), effectiveness in removal of DOC and DBP formation potential at a full-scale plant that has the ability to run side by side treatment trains utilizing two different coagulants. Samples collected three times a week from October 2009 to December 2012 including raw water, Alum treated settled water, and ACH treated settled water were analyzed for DOC, specific ultraviolet absorbance (SUVA), fluorescence excitation-emission matrices (EEM), and DBP formation potential (performed weekly). Further analysis of EEMs of raw and settled water samples was performed utilizing parallel factor (PARAFAC) analysis.
NOM is a complex heterogeneous mixture of organic compounds consisting of aliphatic and aromatic compounds [5]. This mixture of organic compounds defines the nature of the DOC and its reactivity with chlorine, as well as the treatability of the source water. Aromatic compounds, which are more easily removed through coagulation [6,7] are generally associated with humic acids which consist of large molecular weight compounds. These compounds account for over half of the mass of the DOC in water [5] and are precursors for THM formation. Aliphatic or low molecular weight compounds are usually removed at a lesser extent by coagulation (compared with aromatic structures) and therefore might have a significant contribution to DBP formation. In addition to potential DBP formation, other water quality water issues caused by NOM include: (i) taste and odor along with color issues; (ii) increases in coagulation and disinfection doses which in turn lead to larger sludge volumes and increased DBP formation; (iii) promotion of biological growth in the distribution system; (iv) increased levels of complex metals and adsorbed organic pollutants; (v) provides sources and sinks for carbon; and (vi) can intercede photochemical microbial processes [4,8]. Furthermore, DOC is also responsible for affecting WTP treatment train processes, such as shortened run times with membrane filtration, granulated activated carbon fouling and decreased the performance of oxidants and disinfectants [9].
There are two main sources of NOM that comprise the nature of DOC. The allochthonous NOM is derived from the degradation of terrestrial plant matter which is dissolved and transported through rivers, lakes and estuaries within a watershed and include: agricultural runoff, urban runoff, forested land, soil and aquatic environments [10]. Autochthonous NOM is produced by microbial processes in the water. NOM concentration, composition and chemistry can exhibit significant variations in nature and are a function of temperature, pH and ionic strength, as well as photolytic and microbial processes [4].
There are literally thousands of different chemical compounds in NOM consisting of both hydrophilic and hydrophobic components. The hydrophobic compounds within NOM are aromatic compounds with phenolic structures and conjugated double bonds while the hydrophilic part consists of aliphatic compounds are low molecular weight structures, including carbohydrates, proteins, sugars and amino acids [11]. Hydrophobic and high molecular weight compounds in NOM have been shown to be a precursor to the formation of DBPs [12]. In waters with low DOC however, hydrophilic compounds may play a contributing role in the formation of DBP and furthermore, can lead to the formation of new compounds including iodine and bromine containing DBPs, which are more toxic than chlorinated species [12,13,14].
Because of this varying and complex nature of DOC, there is an inherent need to efficiently characterize DOC when determining treatment options. Multiple tools are available to characterize DOC; however, several methods offer little insight into the true nature of DOC. Fluorescence spectroscopy is a popular technique used to study the character of DOC. The application of this analytical method has experienced significant growth because of its simplicity, cost efficiency and its sensitivity and selectivity [15,16]. In fluorescence spectroscopy, a range of excitation wavelengths is used to record successive emission spectra over a range of wavelengths, generating a three-dimensional fluorescence EEM that can be used to characterize different types and sources of DOC [17].
Various fluorescence spectroscopy analysis tools that have been widely used to characterize DOC include but are not limited to: fluorescence regional integration (FRI), PARAFAC, EEM maximum peaks and fluorescence indices [3,10,18,19,20,21]. Fluorescence intensity is proportional to the concentrations of fluorophores and the differences of fluorescence intensities have been demonstrated to be proportional to concentration of specific fractions of DOC [17].
PARAFAC application to EEMs is considered the state of the art to effectively deconvolve these 3-D matrices and extract the groups of fluorophores that constitute the DOC in specific source and treated waters. Other fluorescence methods are not unique to each water source as only the intensities, location of excitation-emission wavelength maxima or regional volumes vary [22]. The PARAFAC model decomposes an EEM into a set of trilinear terms and a residual array [10] as shown in Equation (1):
x i j k = f = 1 F a i f   b j f   c k f + ε i j k
From the obtained EEM, xijk is the fluorescence intensity for the ith sample at the kth and jth excitation and emission wavelengths respectively. The aif term, defined as scores, is directly proportional the concentration of the fth fluorophores in the ith sample while the bjf and ckf terms are estimates of emission and excitation spectrum of the fth fluorophores respectively and defined as loadings while εijk is the residual term for the model [23]. Certain components derived from PARAFAC analysis represent groups of fluorophores sharing similar organic properties and the score of each component indicate relative concentrations of the DOC fractions [17]. Fmax, the maximum fluorescence intensity of any given PARAFAC component, has been demonstrated by Baghoth et al. [24] to correlate well with the concentration of the humic-like fraction of DOC though not as well with tryptophan-like and tyrosine-like PARAFAC components. PARAFAC components were shown in this study to have positive correlations for the prediction DOC fraction concentrations and DBP formation potential. The application of fluorescence spectroscopy using PARAFAC components to determine the formation of DBPs and DOC concentrations was demonstrated by Johnstone et al. [25] and Pifer and Fairly [26] among others. Johnstone and Miller [27] used fractional regional integration (FRI) [2] with chlorine consumption to determine DBP formation with success; however, using only FRI without chlorine consumption did not yield significant results. They concluded that overlapping of fluorophores using FRI volumes prohibited the estimation of DBP formation.
Coagulation is a process that WTPs employ to remove NOM and turbidity [11,28]. The mechanism in which coagulation works is one where destabilization of colloids and a coagulant floc is formed which is by adsorption to solid precipitates or through charge neutralization and precipitation [29,30,31,32,33]. Coagulants, such as Alum and ACH, are added to water in which the coagulant salt disassociates and the metallic ion undergoes hydrolysis creating positively charged ion complexes. These positively charged ions attract NOM and turbidity, which are typically negative, to form colloids that eventually settle out through sedimentation.
Coagulation of NOM can be described by two fractions of DOC. Nonsorbable DOC is the fraction of DOC that cannot be removed by coagulation, and adversely, there is sorbable, the fraction of DOC that can be removed by coagulation [34]. The different fractions of DOC that can be removed by a specific coagulant vary with the coagulant used. Studies have shown that the sorbable versus nonsorbable ratio varies with each type of coagulant used showing that different coagulants have preferential removal of components in regards to varying DOC compounds [34]. This is indicative that different source waters may require different coagulants, which exhibit different removal efficiencies, because of the nature of DOC.
In this full scale study, two different coagulants were dosed in parallel treatment trains. They goal of the study was to analyze each coagulant’s ability to remove DBP precursors by utilizing fluorescence and other DOC metrics. The study provides insight on the nature of DOC and how different coagulants have preferential removals of DOC. Previous studies show that the nature of DOC is not altered during coagulation, rather, different coagulants will remove different ratios of components that lead to DBP formation potential [35]. The use of fluorescence to monitor source water and treatment processes may be a valuable tool in optimizing coagulants and oxidants to assure that WTPs can stay in compliance while controlling chemical costs.

2. Experimental Procedures

2.1. Materials

Only reagent grade chemicals were used in this study. Water for dilutions and glassware preparation was organic-free de-ionized (DI) water. The DI was made from tap water ran through a Barnstead ROpure LP low pressure reverse osmosis (RO) system (Barnstead/Thermolyne Corp., Dubuque, IA, USA) then measured on a Total Organic Carbon Analyzer to assure the DI water is organic-free. All glassware was cleaned using Alconox powdered precision cleaner (Alconox Inc., White Plains, NY, USA). Glassware was then rinsed three times with DI water to remove any residues. All clear laboratory glassware is then soaked in a hydrochloric acid (HCl) bath for at least 24 h. Amber bottles used for sample collection and DBP formation potential tests also went in to an acid bath for a minimum of 24 h; however, then were soaked in a chlorine bath (greater than 10 mg/L free chlorine). Acid baths were adjusted to a pH of 2.00. All glassware was then rinsed again three times with DI and placed into a drying oven and allowed to dry at 100 °C.
Water samples from the WTP were collected weekly and stored in 250 mL amber bottles with polytetrafluoroethylene (PTFE) lined caps at 4 °C. WTP personnel collected raw water and coagulated settled water before any intermediate dose of chlorine. Samples were collected on Monday, Wednesday and Friday for weekly pick up the following Monday. All experiments were conducted on the same day, and therefore no samples were stored longer than 7 days. All water samples were filtered through a 0.45 micron membrane filter in order to remove any particulate carbon previous to analysis.

2.2. Experimental Methods

Raw water and coagulated water samples where chlorinated using a concentration of 10 mg/L of sodium hypochlorite for a period of 48 h. This was done to ensure that all reactive DOC has incorporated chlorine consumption thus determining a samples DBP formation potential (DBPFP). Chlorinated samples were immediately quenched with sodium sulfite at a 20% stoichiometric excess of initial aqueous chlorination concentration. After quenching, 120 mL samples were adjusted to pH < 0.5 using sulfuric acid. The internal standard was added to makes a concentration of 1.0 µg/L of 1, 2 dibromopropane. 3-mL of Methyl tert-Butyl Ether (MtBE) was added for DBP extraction. Samples were then placed on a Burrell (Pittsburgh, PA, USA) wrist action shaker for 30 min.
Diazomethane was used to derivatize the neutral HAA species to either corresponding methyl esters per U.S. EPA method 552.1 [36] following indications of Xie et al. [37]. THMs were extracted and analyzed using the U.S. EPA method 551.1 [38] and were measured on an Agilent Technologies (Santa Clara, CA, USA) 7890-A gas chromatograph/mass spectrometer (GC/MS). HAAS were analyzed using a modified version of U.S. EPA 552.1 [36]. The extraction and derivatization of haloacetic acids was conducted according to the EPA method 552.2 modified following indications of Xie et al. [37].
DOC concentration was measured on a Shimadzu Total Organic Carbon (TOC-5000A) Analyzer (Kyoto, Japan) using the non-purgeable organic carbon (NPOC) method where by samples are acidified (2 < pH < 3) to convert all the carbonate (inorganic carbon) to carbonic acid. The carbonic acid (inorganic carbon) then is purged by sparging for 10 min with ultrapure air. The organic carbon stock solution for a four point calibration is made from dissolving 2.1254 g of potassium biphthalate (C8H5KO4) in 1000 mL of DI. Measurements are taken from the average of 3 injections (maximum of 9) that have a standard deviation of less than 200 in area or a correlation value of 98%.
All UV254 measurements were taken on a Shimadzu UV 1601 dual beam spectrophotometer (Kyoto, Japan) using a 1 cm quartz cuvette. Filtering the water samples through a 0.45 micron membrane filter was the only preparation for the UV254 analysis. The unit of absorbance is measured as cm−1 and the specific ultra-violet absorbance (SUVA) is found by multiplying the absorbance by 100 and dividing by DOC (mg/L) with the resulting unit of SUVA being L·mg−1·m−1.
All of the fluorescence EEM scans were obtained by a Hitachi F-7000 fluorescence spectrophotometer (Tokyo, Japan). The excitation range was set at 204 nm to 404 nm at a sampling interval of 5 nm. The emission range was set at 290 nm to 550 nm at a 2 nm sampling interval. The excitation and emission slits were both set a 10 nm and the scan speed was set at 60,000 nm/min. The instrument response was set at 0.002 s while the photomultiplier tube voltage was set at 400 V.
Instrument spectral corrections were applied using a concentration of rhodamine B, as recommended by the manufacturer, for excitation spectrum as well as a quartz diffuser for emission spectra. As an additional quality control measure, a solution of quinine sulfate (7 mg/L in 0.1 M H2SO4) was excited at 310 nm and the fluorescence emission was measured at 450 nm prior to every sample run. The relative standard deviation for the quinine sulfate test was within 5% for all scans performed. Differences in lamp energy and intensities can give varying results therefore to eliminate these variances all of the EEM data was normalized to Raman units (RU). RU (nm−1) also makes it possible to compare results with corrected spectra measured on other units [10]. To convert to RU, the EEM scan must be divided by the area of under the Raman scatter peak (excitation wavelength of 350 nm) of DI water. Normalizing all corrected spectra EEM scans by RU removes any instrument bias.
Sample preparation for fluorescence analysis included filtering the sample through a 0.45 micron membrane filter. Each sample was prepared by pipetting 5 mL of sample into a 20 mL scintillation vial along with potassium chloride (KCl) and sulfuric acid (H2SO4) to adjust the ionic strength of the sample and is adjusted the pH of 3 ± 0.15. The pH adjustment is in order to minimize the potential for metal-binding and subsequent fluorescence quenching in waters that may contain metals [2]. A KCl blank was subtracted from the set of EEM scans obtained from a sample set.

2.3. Analytical Methods

2.3.1. PARAFAC Analysis

PARAFAC modeling was conducted using the N-way v.3.00 Toolbox [39] and the Fluor v.1.7 Toolbox [40] for Matlab. There were a total of 361 raw water and Alum treated water samples and 299 ACH treated water samples there was used for the PARAFAC modeling. Preliminary results of this study precluded the water plant to use ACH during the summer months. The PARAFAC model was fit using the entire data set (i.e., raw, Alum and ACH was used for a single model). Excitation wavelengths below 224 nm were removed from the model because wavelengths under 220 nm are commonly associated with high levels of noise and do not contribute to relevant or useful fluorescence data [10,41]. A triangle of zeros was included in the upper region of excitation and the lower region of emission to expedite calculations [10,42]. Fluorescence samples that exhibited extremely high or low intensities and atypical contour plots were classified outliers and removed from the data set. One to six components were retained in each PARAFAC model and non-negative constraints were applied to the excitation and emission modes. Random values and singular value decomposition were used for the initialization of the model.
The convergence to a unique solution for multiple runs was examined and used as a criterion for selection of the appropriate number of PARAFAC components to be retained in the PARAFAC model. The presence of a single solution after multiple runs from different starting points shows the adequacy of the model and its convergence to a global minimum. The model validation was based on split half analysis [43] in which the entire data set, including raw, Alum, and ACH, was divided into two sub-datasets and an independent model was fit over each new group of samples. Core consistency diagnostic (CORCONDIA) [18] was used as an additional criterion to choose the number of PARAFAC components in the model. CORCONDIA evaluates the degree of trilinearity of the PARAFAC loadings by comparison of the least squares Tucker3 [44] core calculated for these and a superdiagnol core of ones. CORCONDIA generally decreases as the number of components in a model increase, being 100% for a one component model. Significant reductions appear when a component is added after the appropriate number of components in a model is selected; and therefore, the number of components retained corresponds to the model that precedes this reduction [45].

2.3.2. Modeling Procedures

Multilayer perceptron (MLP) neural network models are networks that acquire knowledge which is stored within the nodes. The biggest advantage of MLP is that it can find linear and non-linear relationships between the inputs and outputs of the model. MLP models were fitted to predict DBP formation potential (THM and HAA) using 243 daily measurements of raw and settled fluorescence PARAFAC component scores and pH as predictor variables. There are other predictors that have shown in previous studies to be good indicators of DBP formation potential including SUVA [46]. Prior to model development, all input variables were scaled between −1 and +1 to coincide with the limits of the tan-sigmoid activation function and data were randomly divided into training (70%), testing (15%), and validation (15%) datasets. Models were built using the training and validation sets and evaluated using the test data set.
MLP models were trained in Matlab v. r2014a (The MathWorks Inc., Natick, MA, USA), using the Neural Network Toolbox (Matlab, 2014). The MLP model structure included an input layer, one hidden layer, and an output layer. Initial weights were determined through trial and error, and the number of nodes in the hidden layer was determined by evaluating structures ranging from 1 node to 2n + 1 nodes (where n = number of inputs) in the hidden layer (Hecht-Nelson, 1987).
Model performance was assessed using the correlation (R) between the measured and model predicted values and the mean squared error (MSE) for the test data set. The correlation was calculated as shown in Equation (2), where xi and yi are the ith measured and predicted values, x i ¯ and y i ¯ are the mean measured and predicted values, and n is the population size. The MSE was calculated as shown in Equation (3). Higher values of R and lower MSE indicate a better performing model.
Equation (2):
R = i = 1 n ( x i x ¯ i ) ( y i y ¯ i ) i = 1 n ( x i x ¯ i ) 2 i = 1 n ( y i y ¯ i ) 2
Equation (3):
M S E = i = 1 n ( y i x i ) 2 n 2
To determine whether the model was able to adequately capture the expected impact of the input variables on the predicted DBPFP, parametric analyses were also conducted. Each variable was assessed, one at a time, by varying the parameter of interest across its range while holding all other variables constant at their mean values and calculating the model predicted DBPFP.
Monte Carlo simulations are algorithms that rely on random sampling to obtain results through what-if scenarios. Monte Carlo simulations were conducted in Matlab using the Statistics Toolbox (Matlab, 2014). The statistical distributions of the fluorescence PARAFAC component scores (C1, C2, and C3) were defined using a lognormal distribution with the mean and standard deviation calculated from operational data. Because the mean and standard deviation of the fluorescence component scores differed between the Alum and ACH operational data, unique fluorescence component score distributions were defined for each coagulant. The pH distribution was defined as a uniform distribution ranging from 6.2 to 8.4, which encompasses the range of pH of water that could enter the distribution system. The THM formation potential of Alum and ACH water was simulated 100,000 times by randomly selecting values from the defined fluorescence and pH distributions and using them as inputs to the trained THM formation potential model. The statistical distributions of the simulation results were then compared to assess the difference in THM formation potential between the two coagulants. The process was repeated for HAA formation potential.

3. Results and Discussion

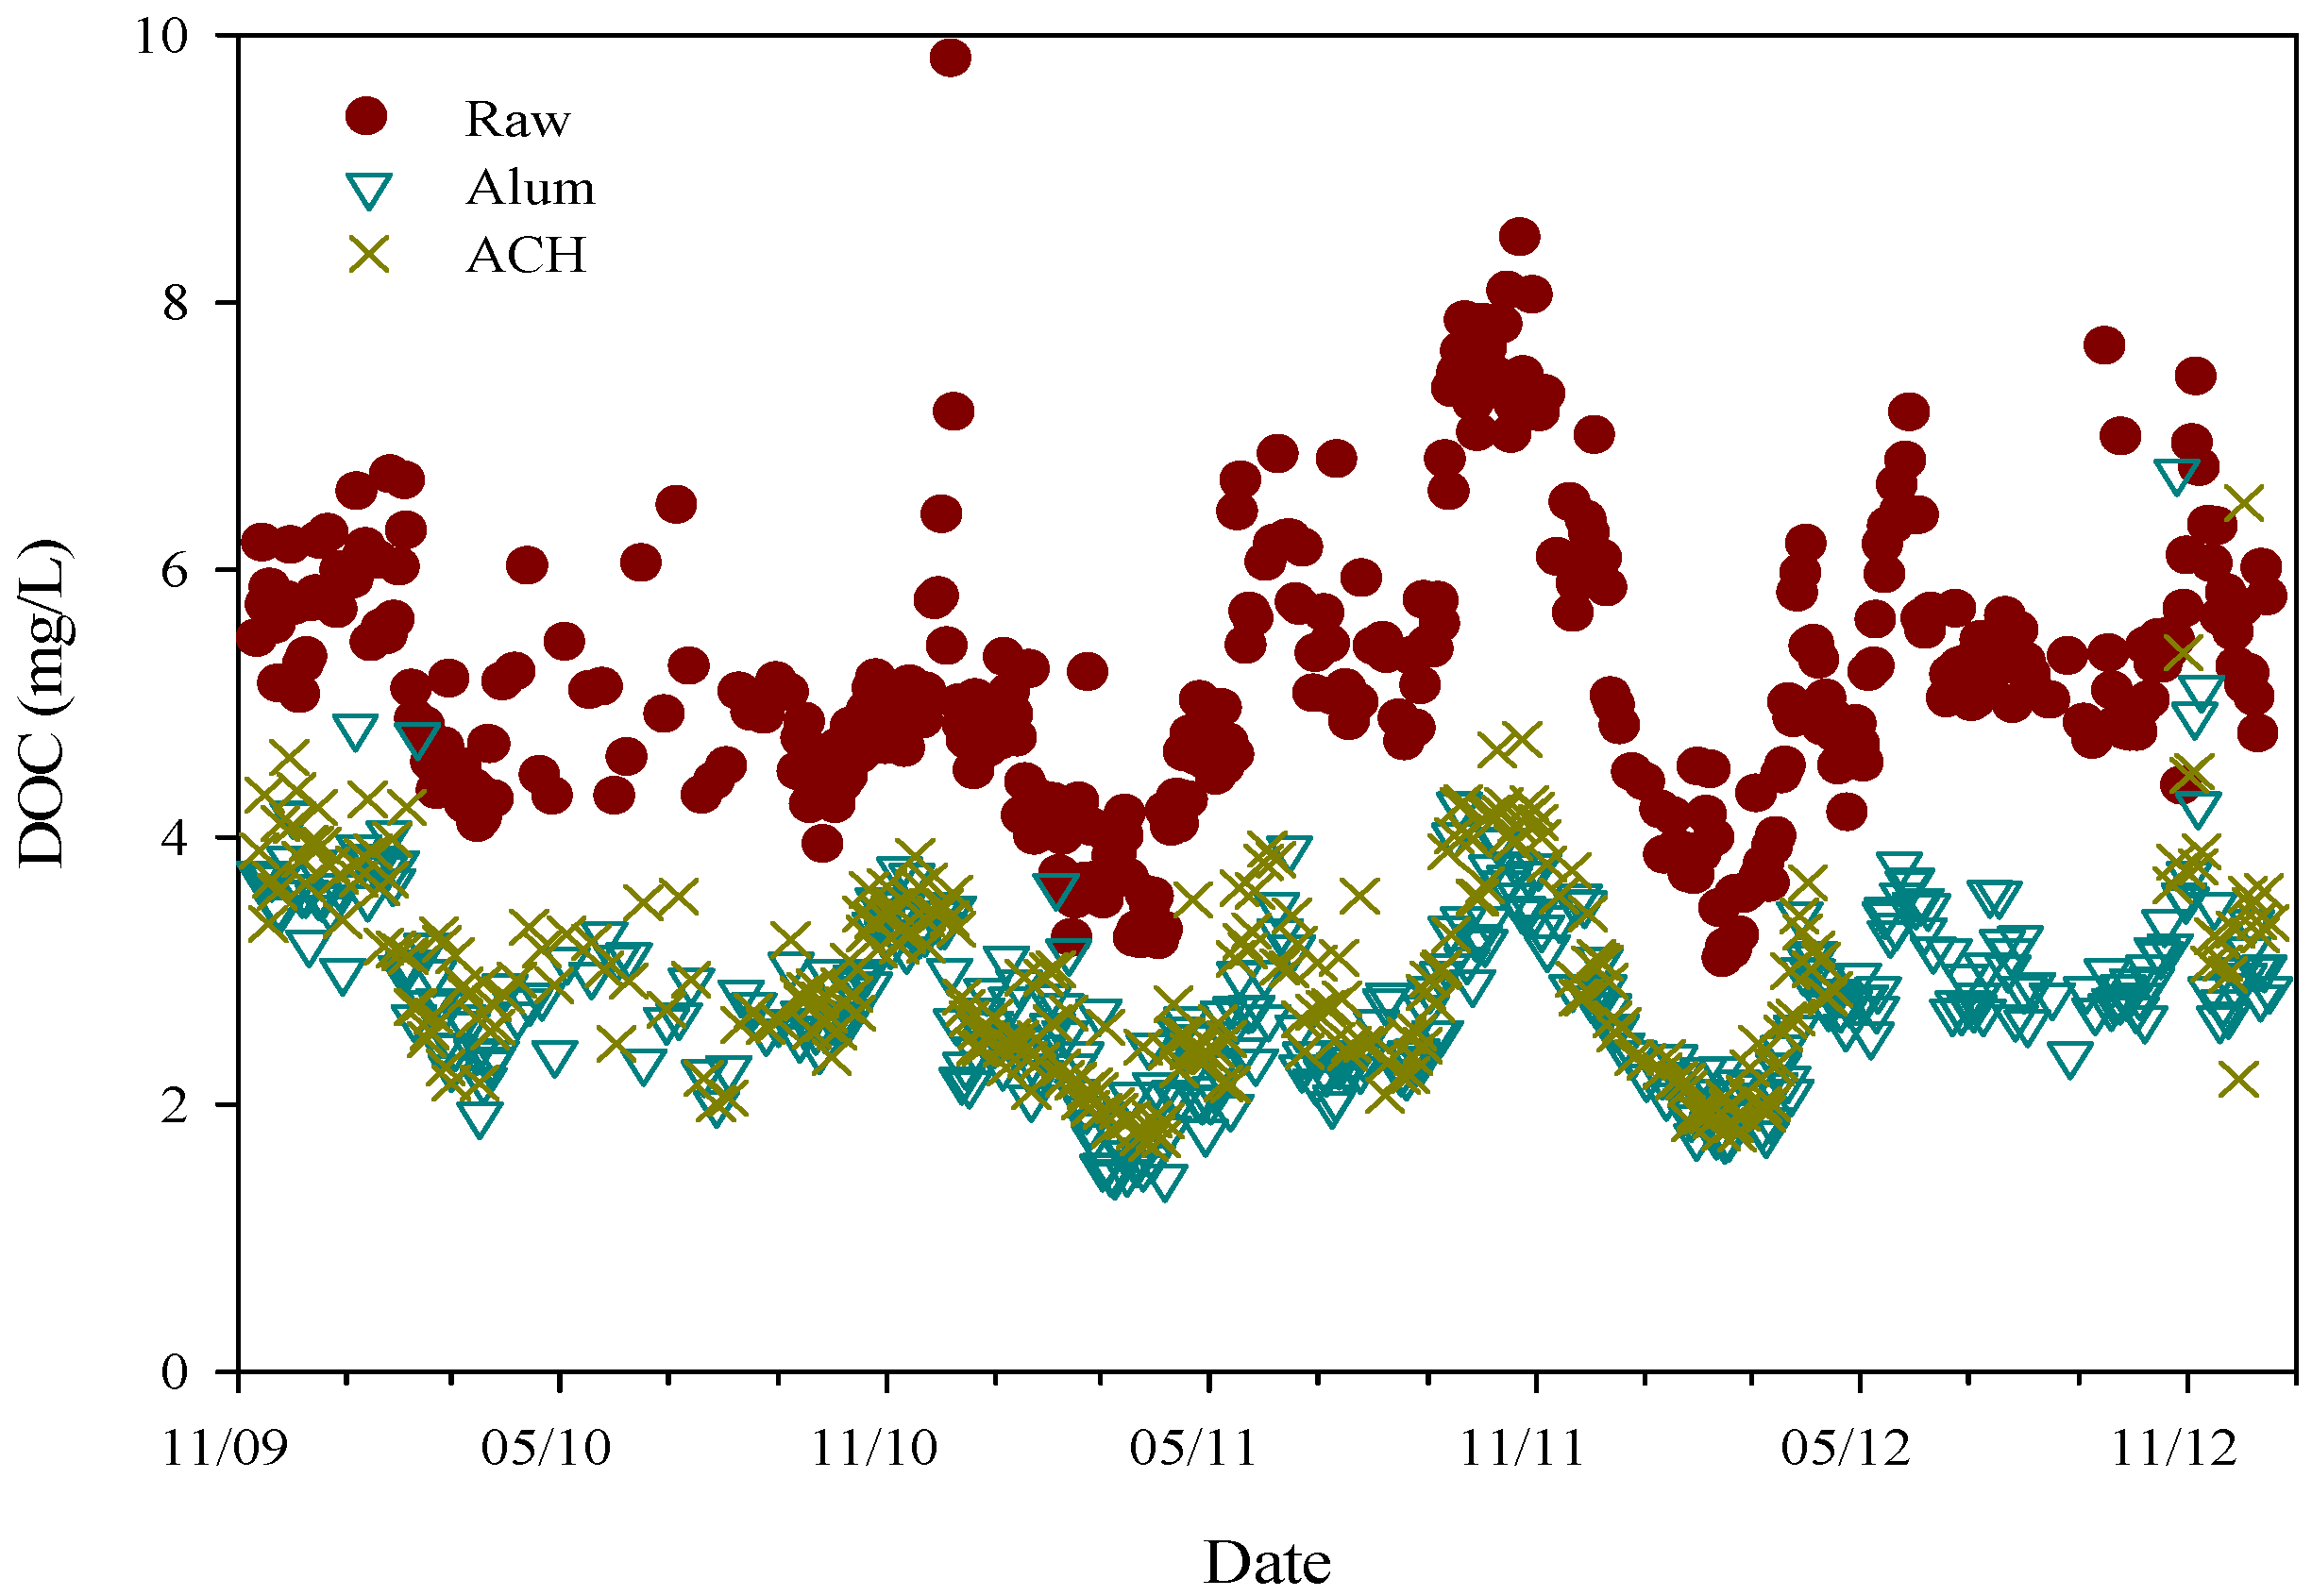
3.1. Source Water Characteristics and Dissolved Organic Carbon Removal

Akron Water Supply serves a population of almost 300,000 and has over 80,000 service connections. The source water is supplied from Lake Rockwell, which is a eutrophic lake because of increased nutrient loading and a shallow depth. It is fed by two other reservoirs via the Cuyahoga River and is part of the Upper Cuyahoga Watershed, which covers 207 square miles and is mostly agricultural with some residential areas. Table 1 shows water quality characteristics of the lake for samples collected between October 2009 and December 2012. The DOC concentration is considered moderate with a mean of 5.38 mg/L during the sampling period, while the mean SUVA level (3.05 L·mg−1·m−1) indicates that the source water ranges from moderate-to-difficult to treat (U.S.EPA, 1999). The pH ranged from 6.64 to 8.32 with a mean of 7.65 and the average alkalinity was 110 mg/L as CaCO3, with maximum levels of 160 mg/L as CaCO3. The source water average turbidity was 8 NTU, increasing to above 30 NTU during storm events.
Under the EPA Enhanced Coagulations and Enhanced Precipitative Softening Guidance Manual (1999), the required TOC removal for this specific water source is 35%. Figure 1 shows the seasonal variability of the raw and coagulated water DOC levels during the period of study. Removal efficiency of DOC exhibited similar levels between the two different treatment trains (i.e., Alum- and ACH-based coagulation). Average DOC removal percentages for Alum and ACH were 48% and 45%, respectively, while the median DOC removal percentages for Alum and ACH were 48% and 46%, respectively. Average DOC removal efficiencies where slightly higher with Alum than ACH (p = 0.02) utilizing the entire data set (n = 361 and 299 respectively).
Table 2 shows the average water quality parameters of raw, Alum treated, and ACH treated waters. Water treated with Alum and ACH had residual DOC averaging 2.83 mg/L and 2.97 mg/L, respectively, while the average UV254 was 0.044 cm−1 and 0.051 cm−1, respectively. The operational goal of the WTP was to balance turbidity removal between the two coagulants. The Alum dose ranged from 48 mg/L to 159 mg/L with an average of 84 mg/L while the ACH dose ranged from 8 mg/L to 58 mg/L with an average of 27 mg/L. As a result, ACH achieved similar DOC removal percentages as Alum. However, Alum removal of UV254 was 14% higher than ACH. Average Alum and ACH treated water pH was 6.99 and 7.50, respectively, showing that ACH-treated water remained more alkaline, which is consistent with the higher basicity percentage of ACH compared with Alum.

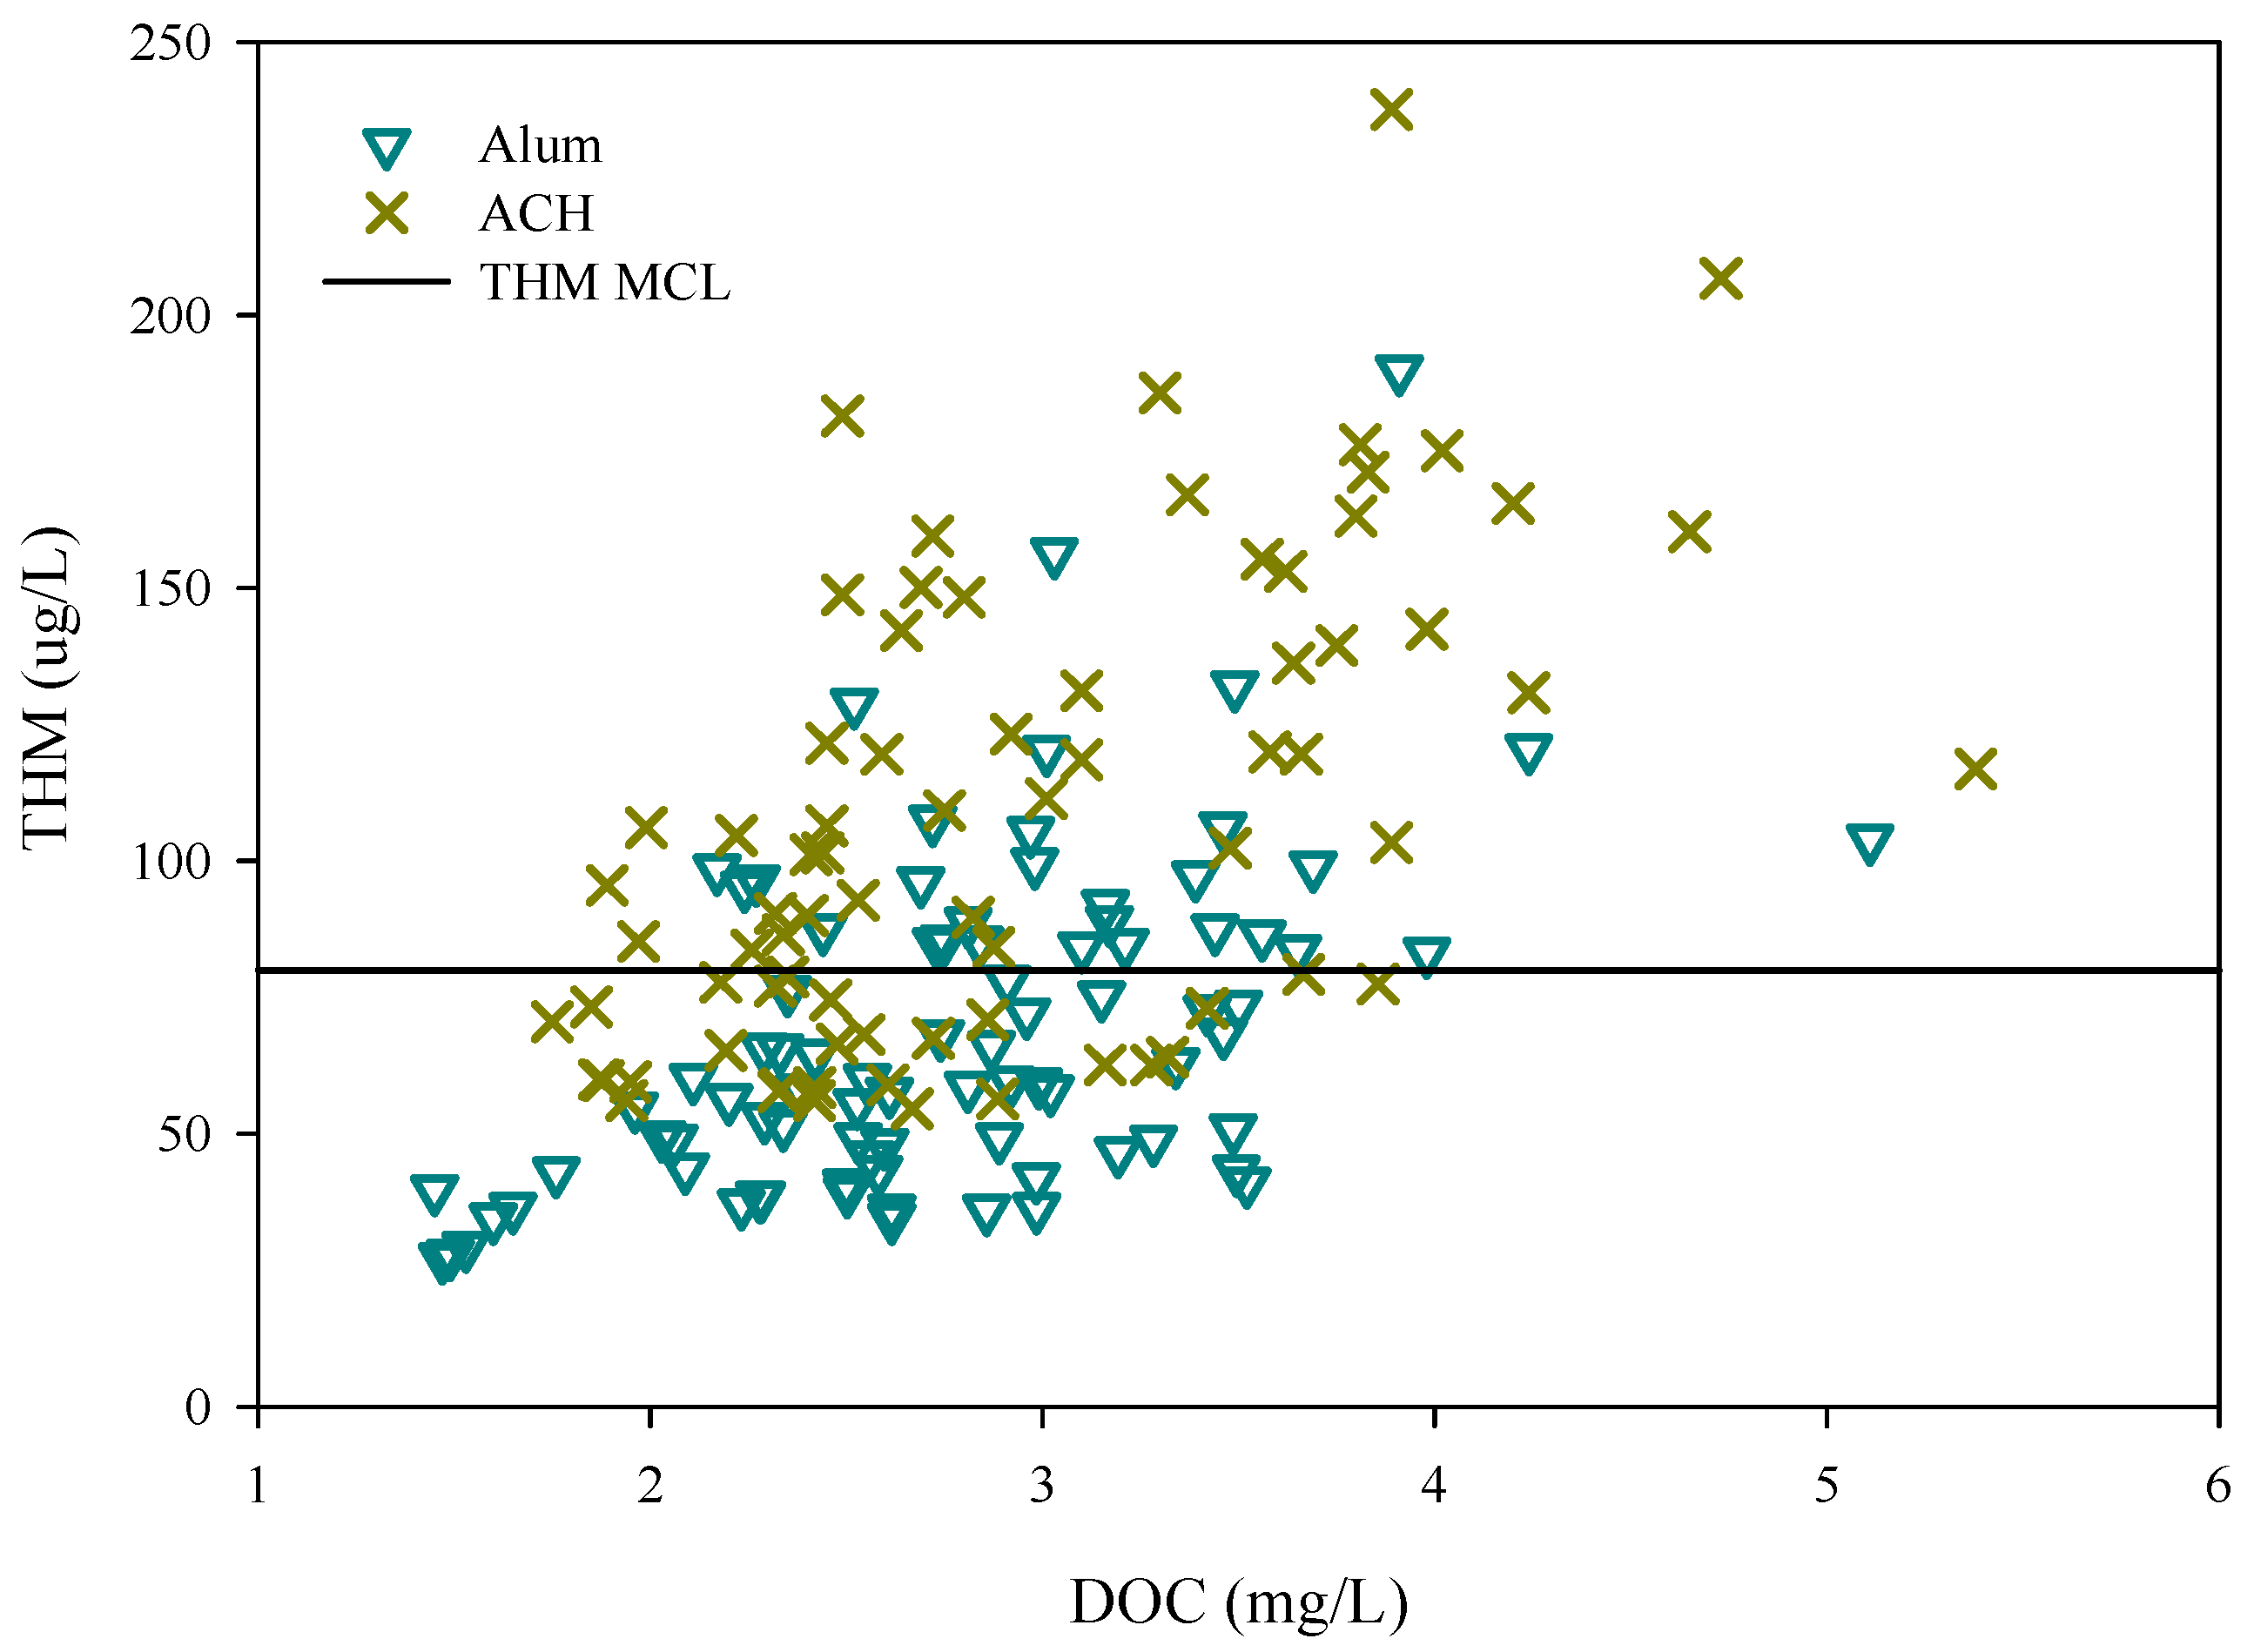
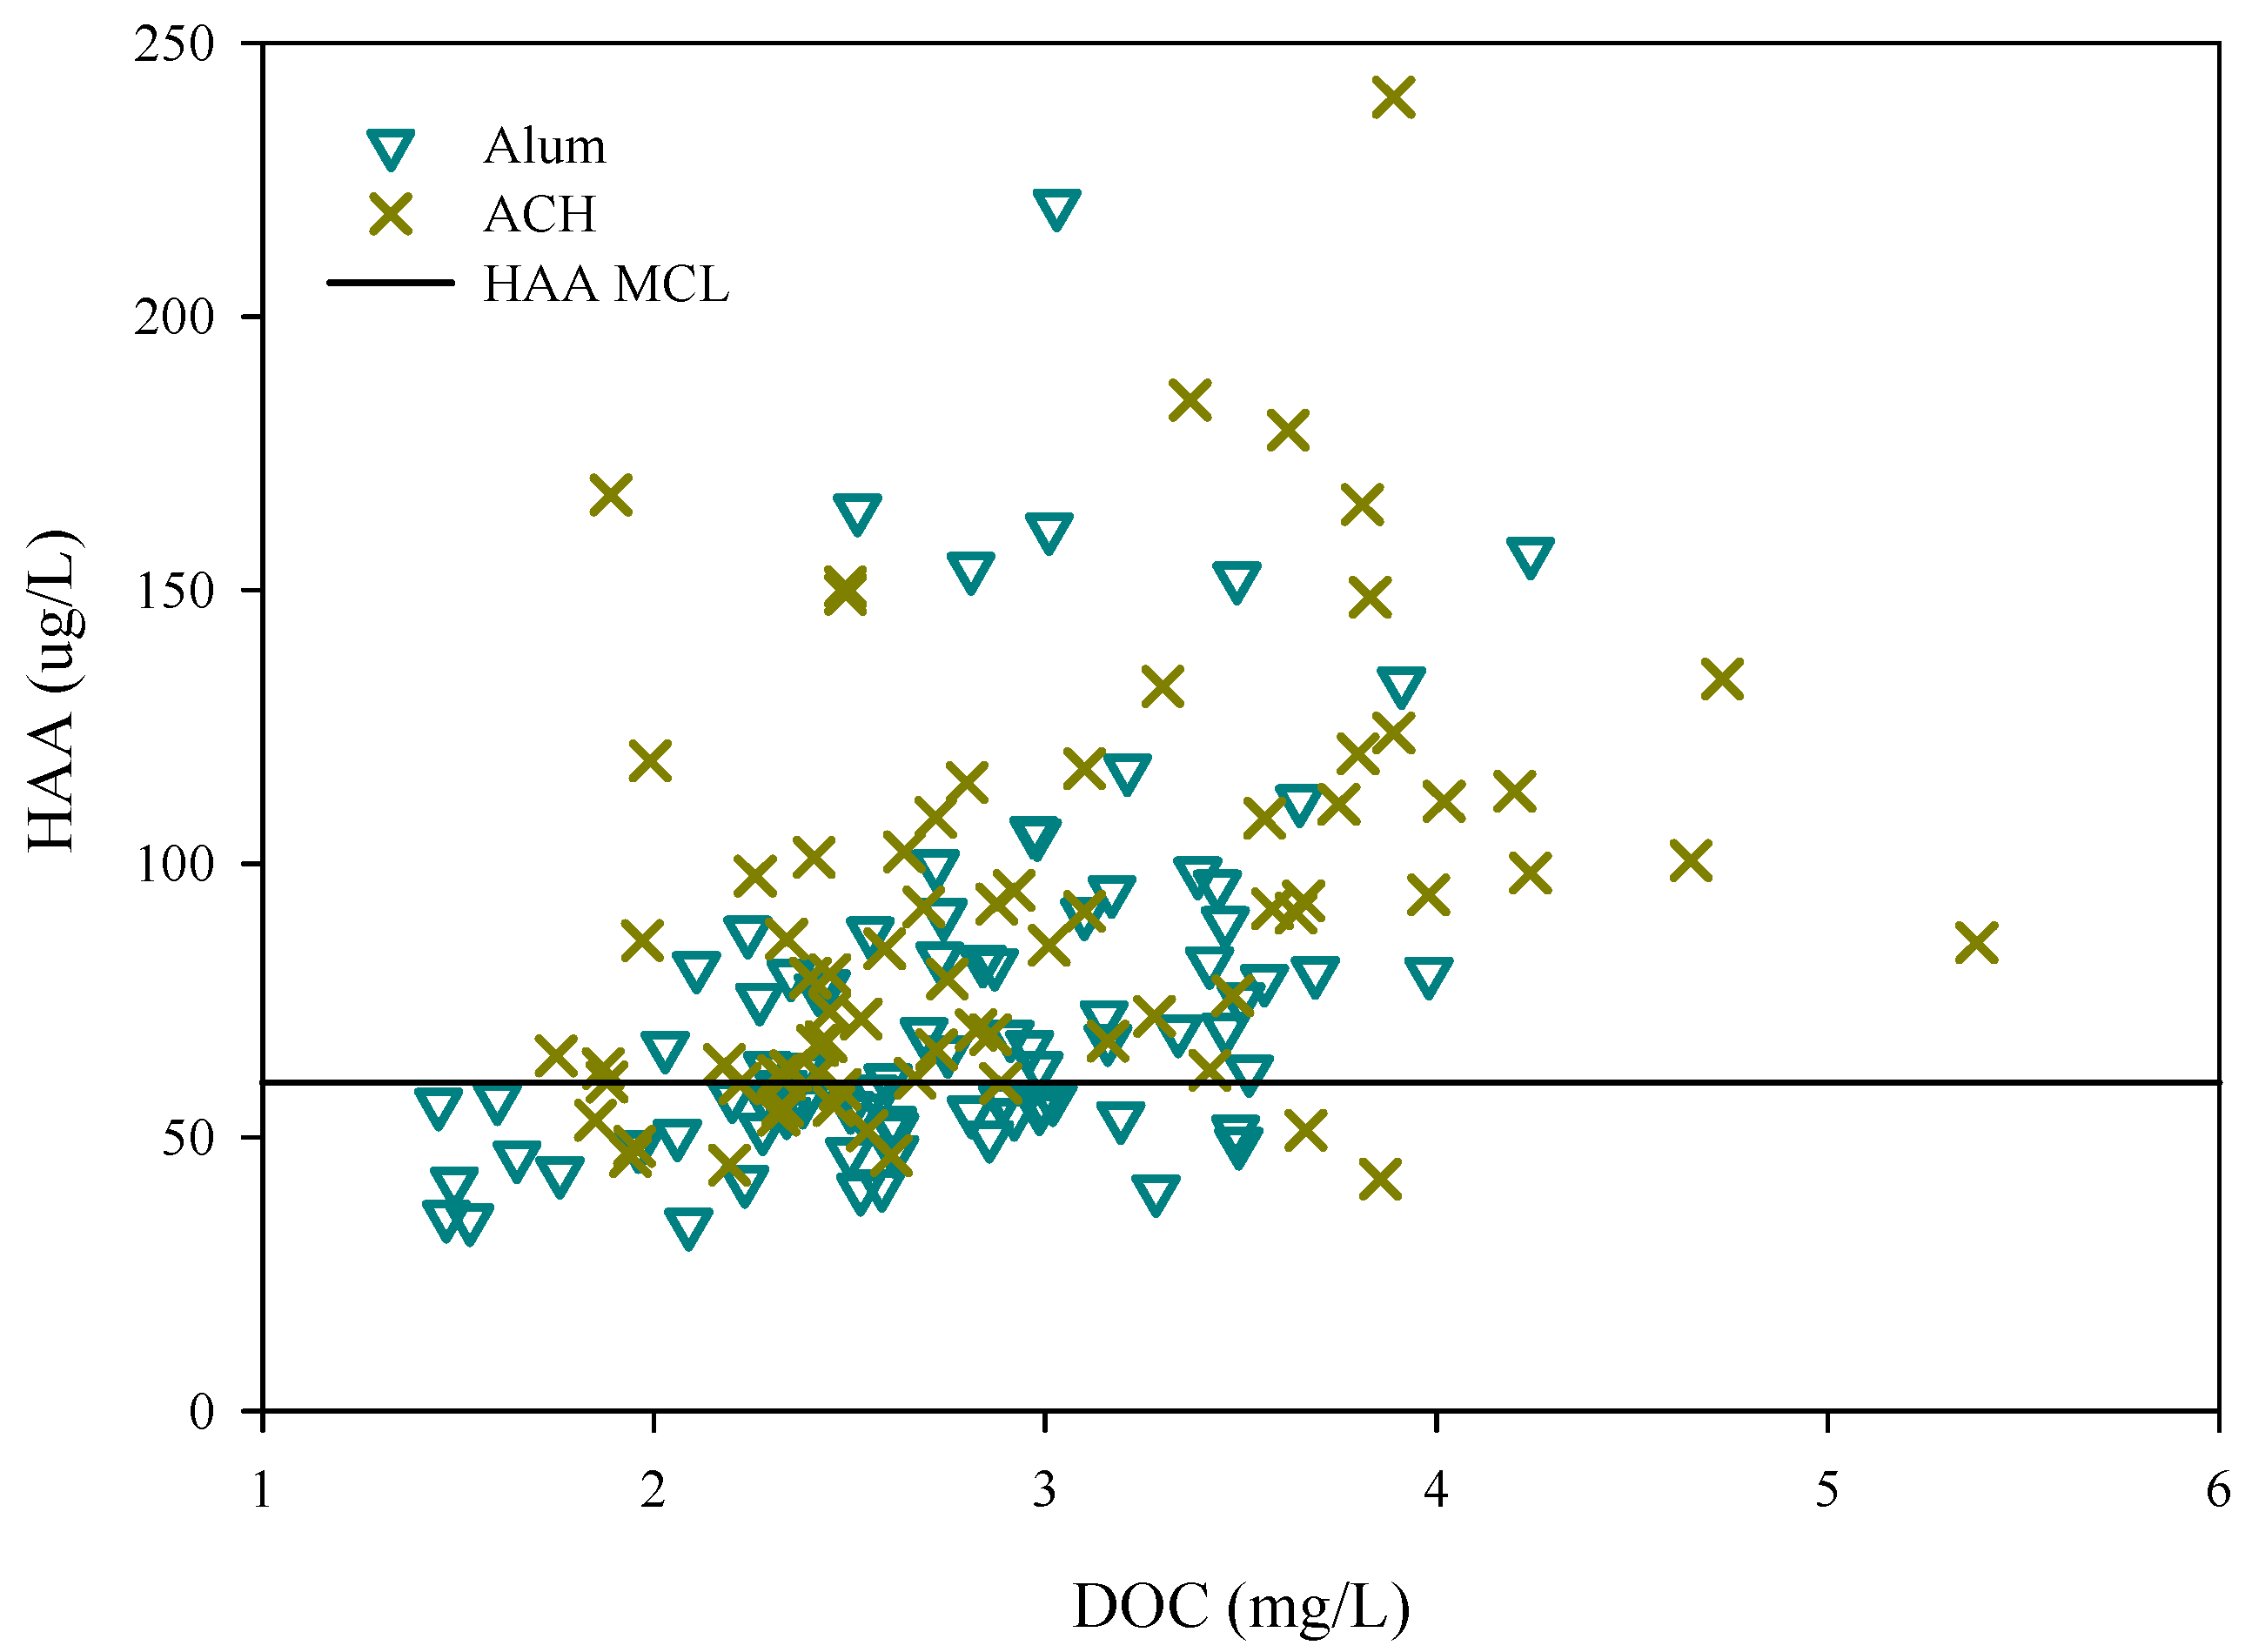
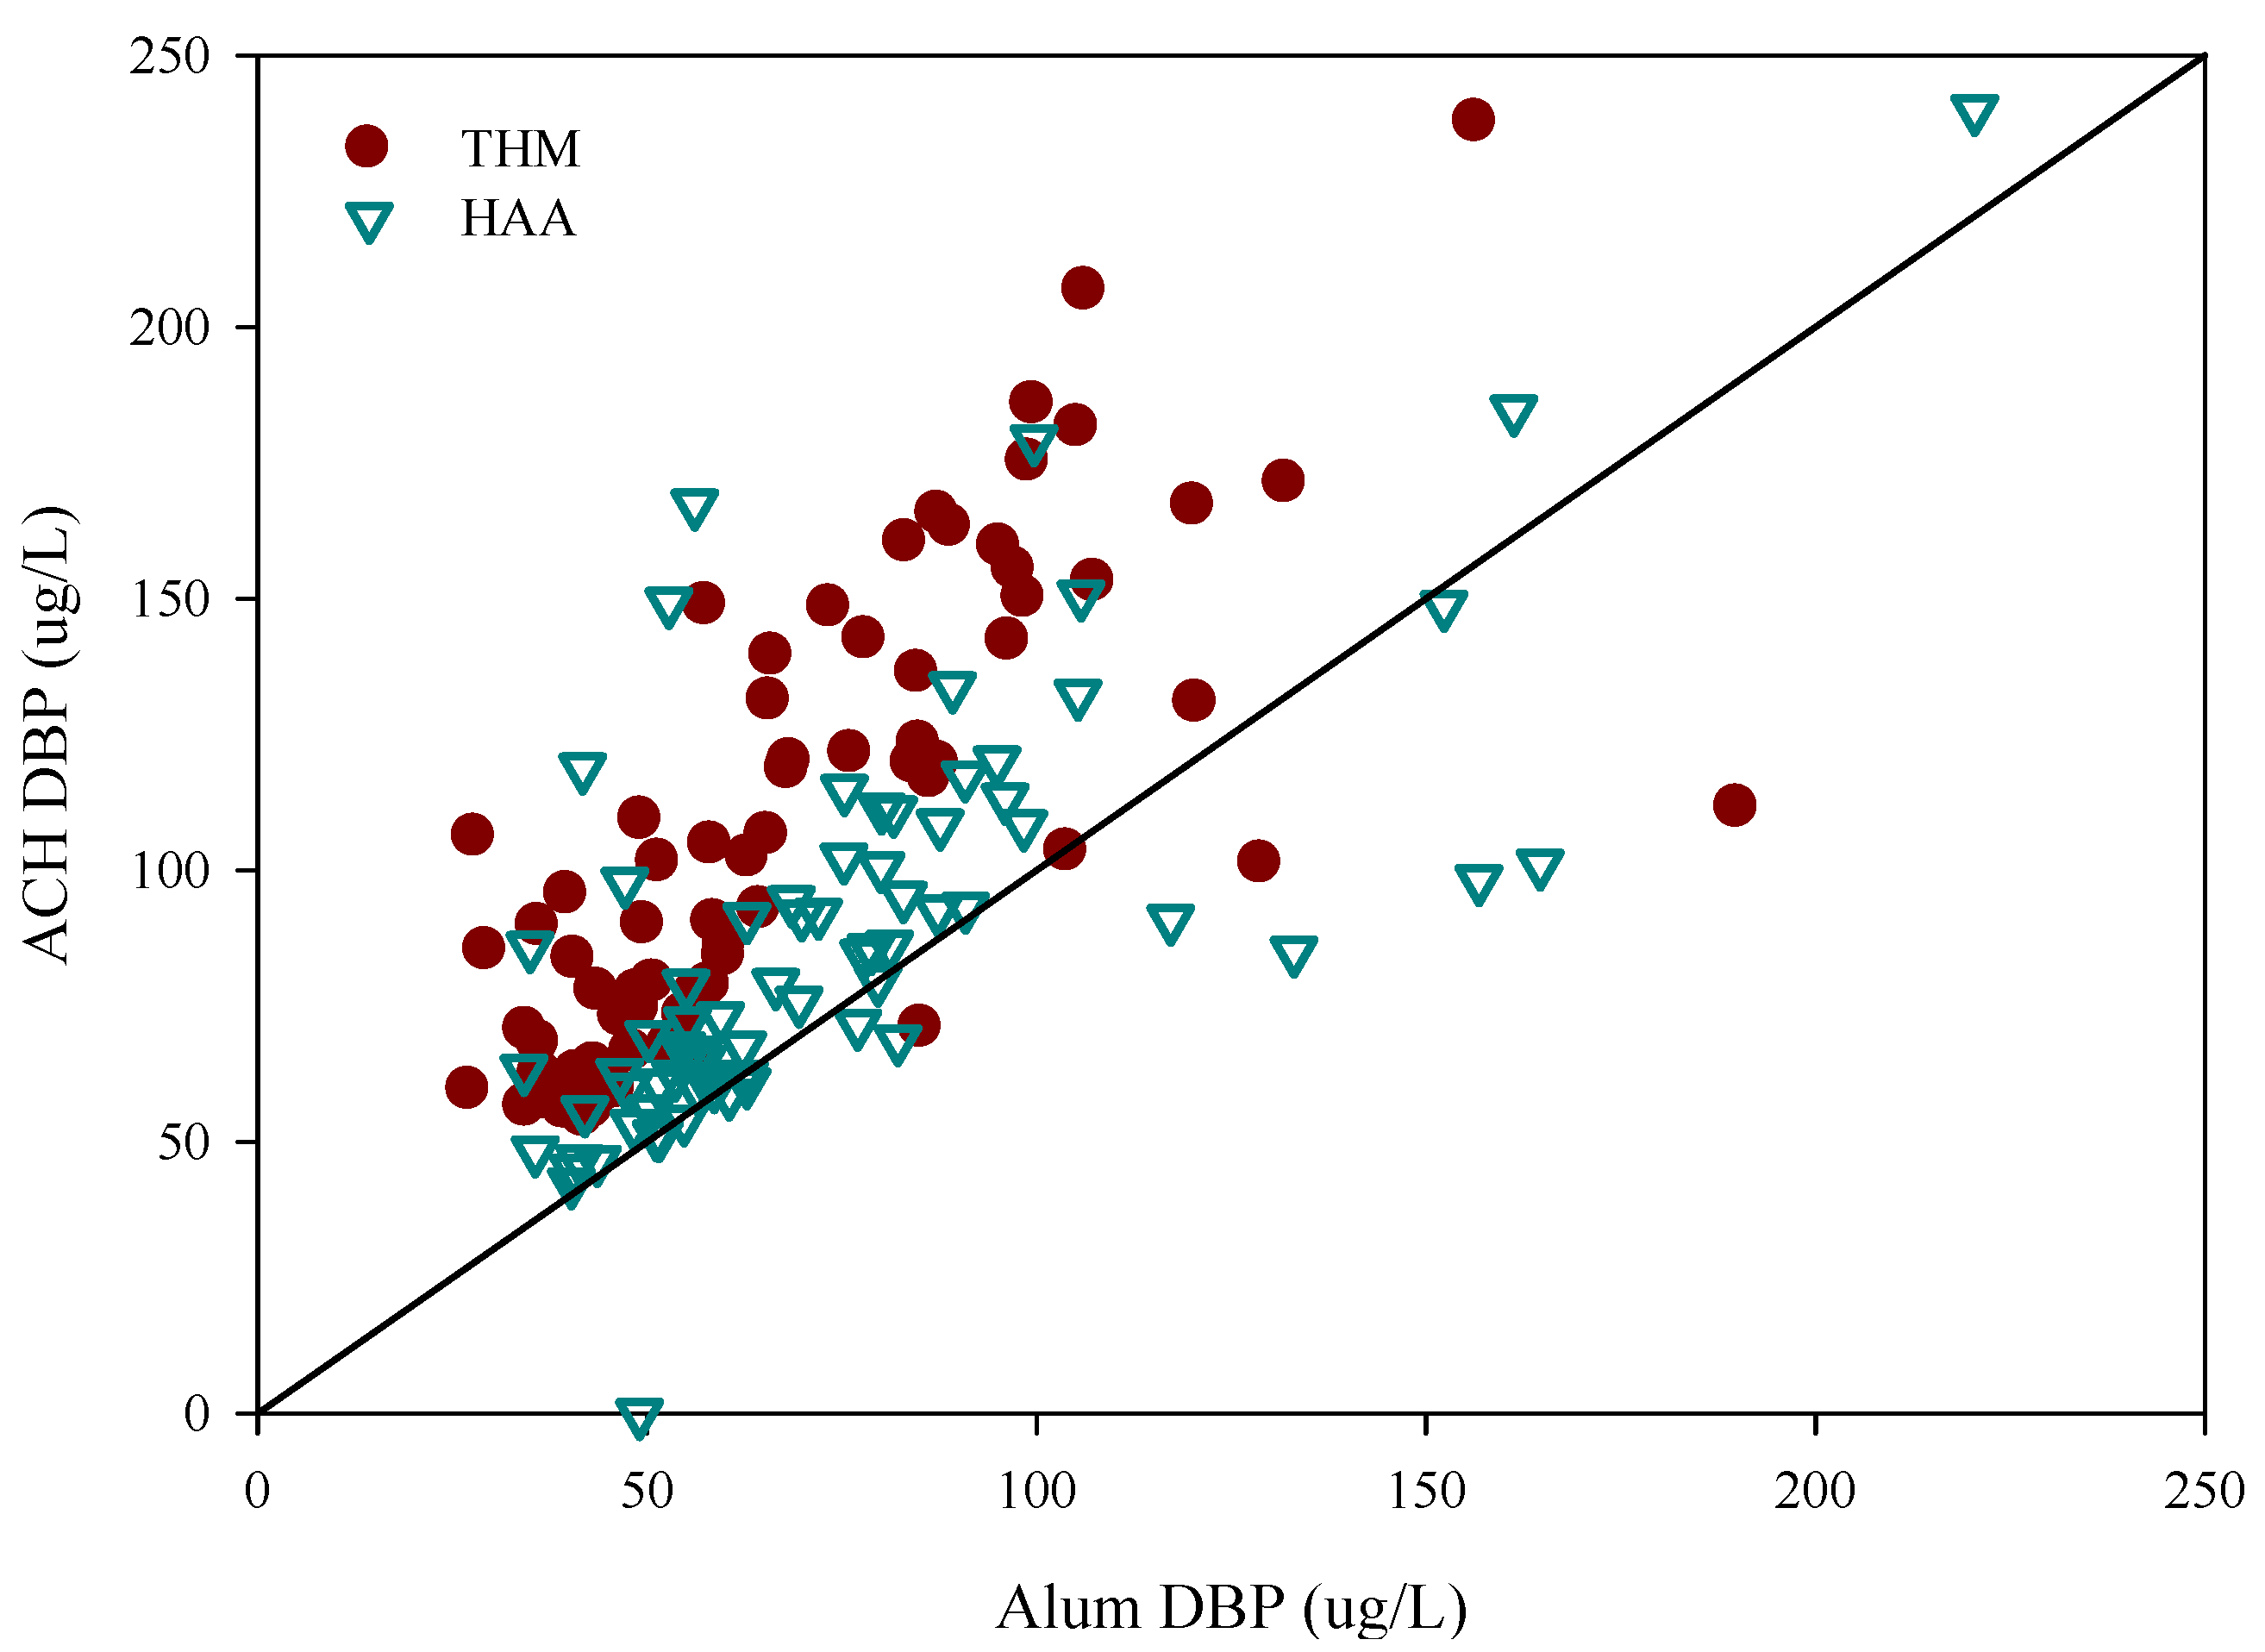
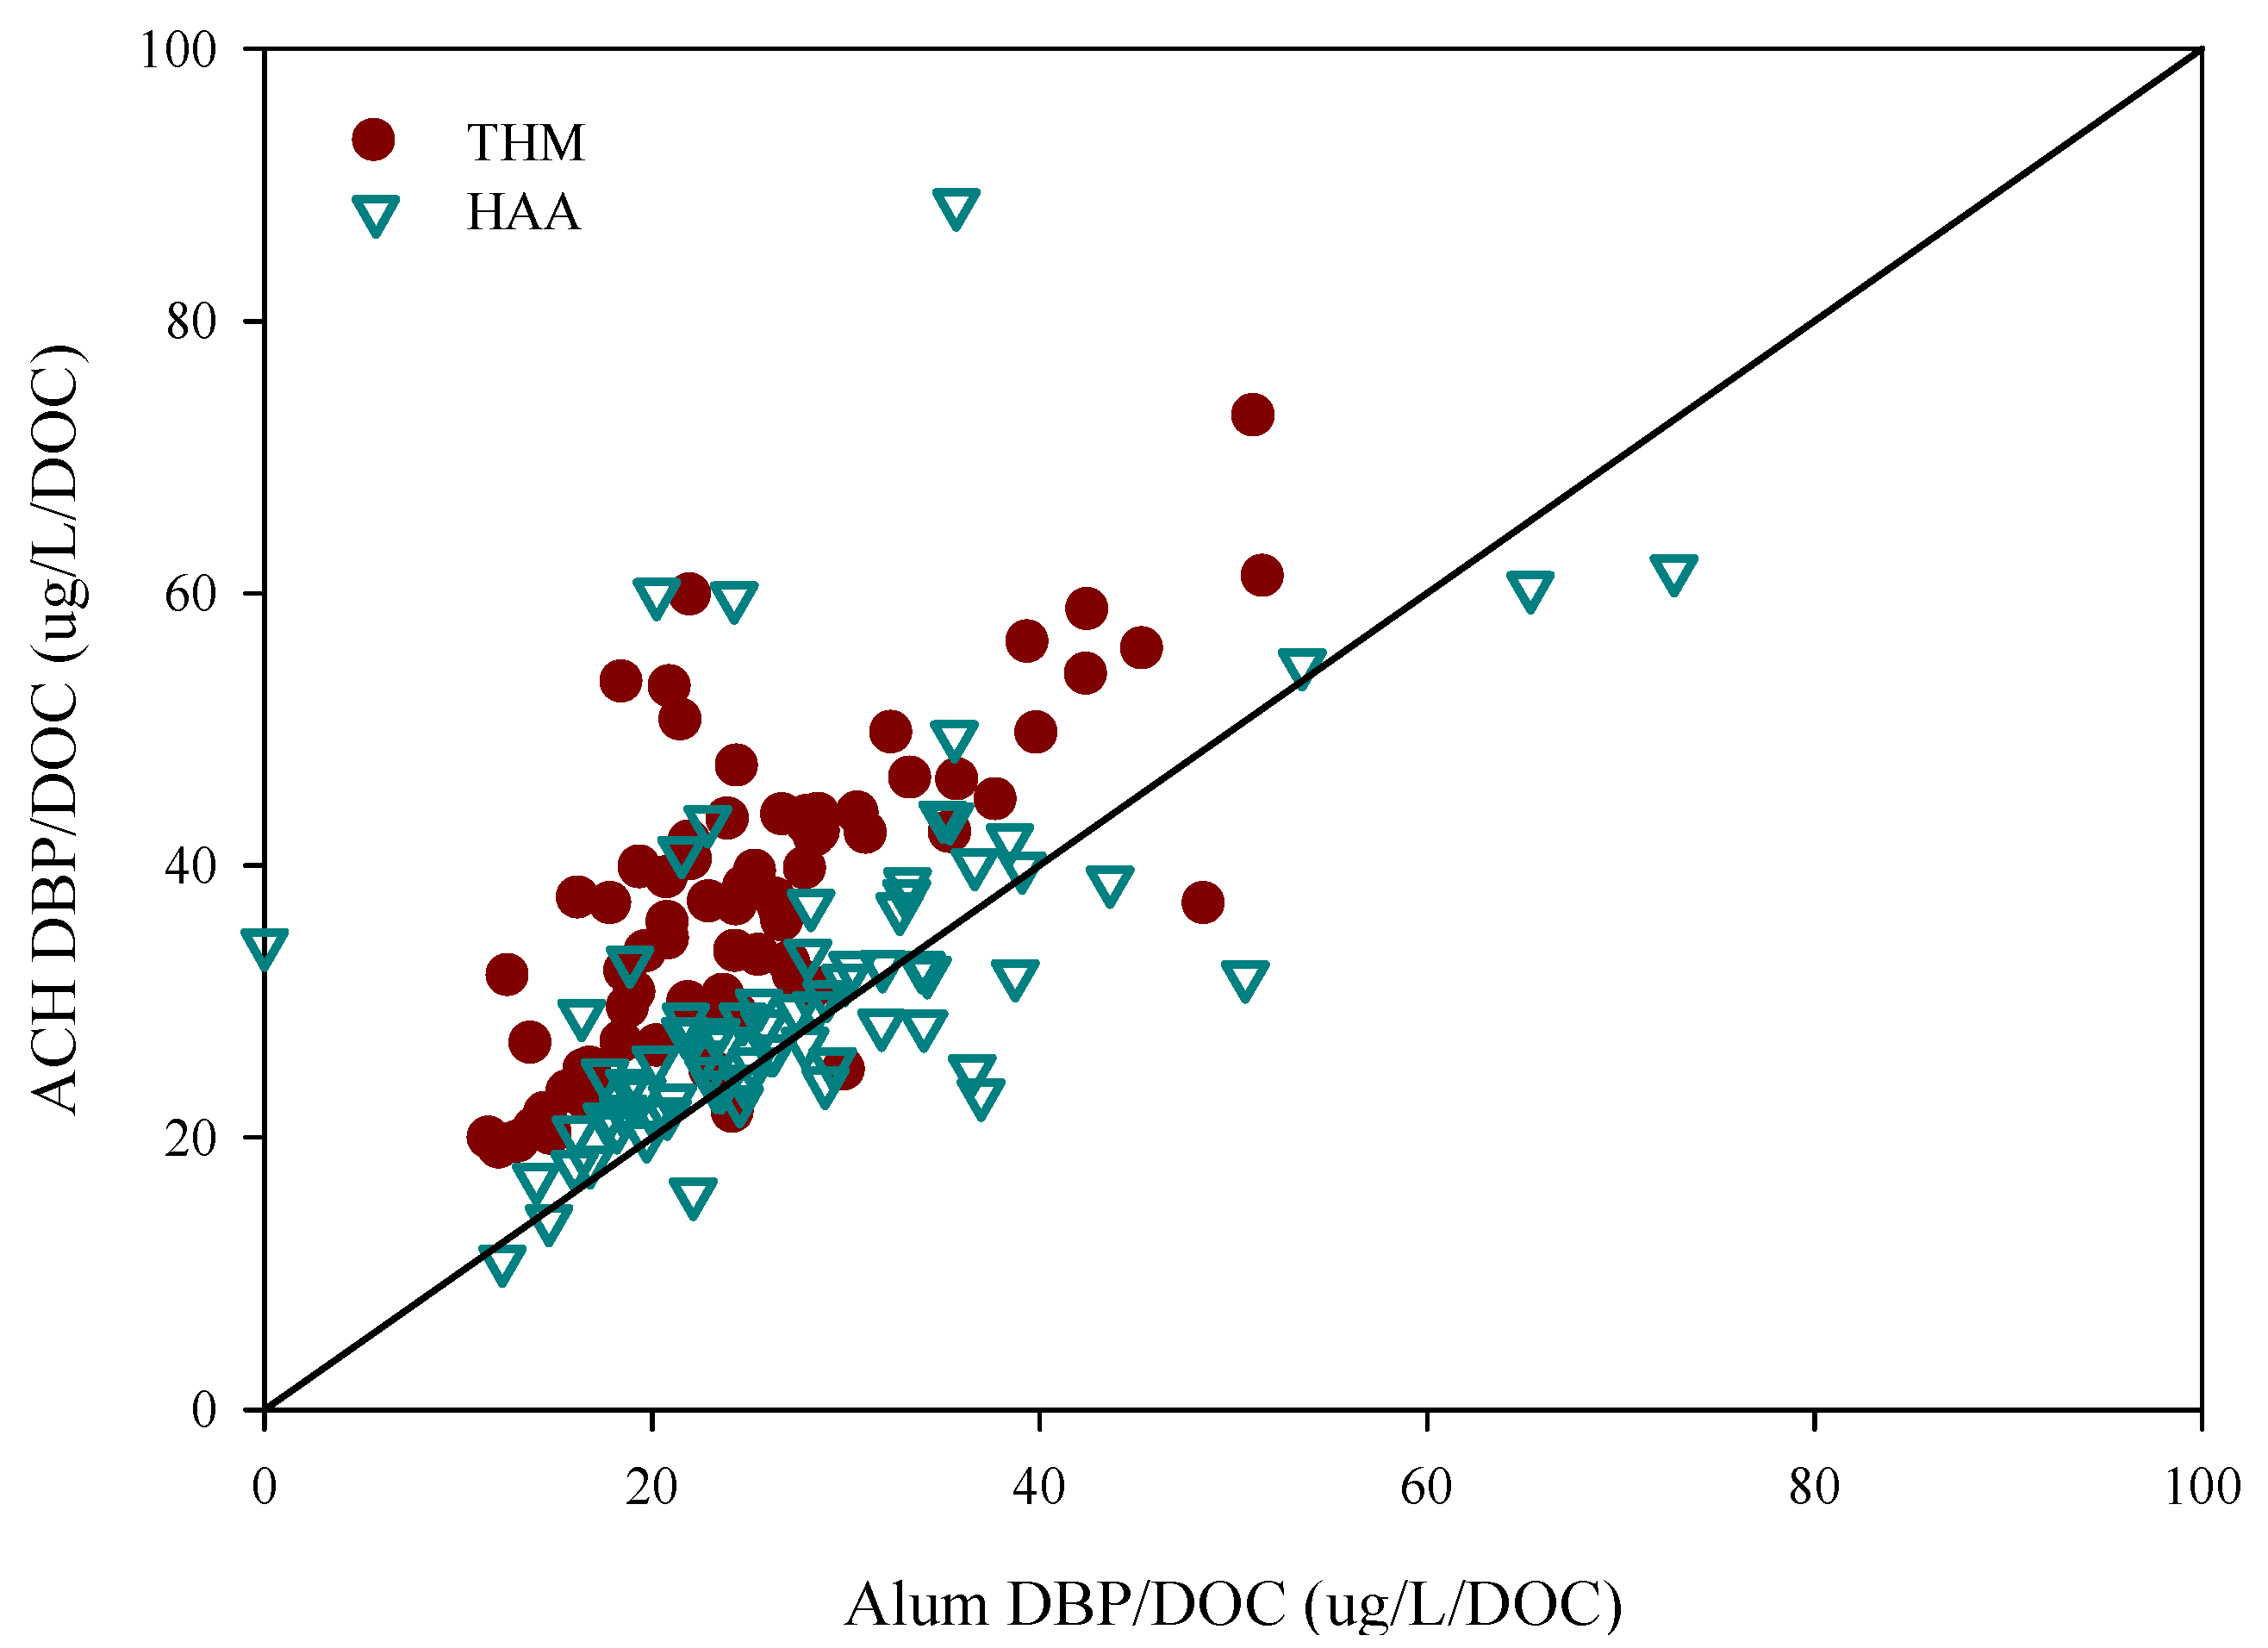
3.2. Disinfection By-Product Formation Potential

Figure 2 shows THM formation potential for both Alum treated water and ACH treated water and the associated DOC levels. It can be noticed that there is little relationship between DOC and DBP formation for THMs as the R2 value is only 0.29. Figure 3 shows the results of HAA formation potential for both Alum treated water and ACH treated water. Similar to THM formation potential, there is little relationship between DOC and HAA formation potential (R2 = 0.23). Simple quantification of DOC offers limited insight into the nature of DOC and DBP formation potential; therefore, a qualitative assessment of DOC is necessary to gain this insight.
Figure 4 shows Alum versus ACH coagulated water DBP formation potential for both THMs and HAAs. There are only three instances of THMs (n = 87), and seven instances (n = 75) of HAAs, where Alum treated water had higher DBP formation potential than ACH treated water. In order to gain insight on the reactivity of the specific DOC impact on DBP formation potential, all of the DBP results were normalized to DOC remaining. Figure 5 shows the results of Alum treated water versus ACH treated water DBP formation potential normalized to DOC concentration. These results indicate that the observation regarding higher THM formation potential in ACH treated water is valid when a DOC-based comparison is conducted. Only five Alum treated samples (n = 87) produced higher THMs per DOC as compared to ACH treated water. For HAAs, there are 17 Alum treated samples (n = 76) that produced higher HAAs per DOC. The normalized results show that Alum removed 33% more THM formation potential per mg/L DOC and 10% HAA formation potential than ACH.
Table 3 shows the mean DBP formation potential for raw water, Alum treated water, and ACH treated water samples. The average THM formation potential of ACH treated water was 36% greater than Alum treated water while the average HAA formation potential for ACH treated water was 15% greater than Alum treated water. Table 3 also shows that the average THM formation potential per mg/L of carbon for Alum and ACH were 24 and 36 ppb, respectively, which is an increase of 50% more THM formation potential in the ACH treated water then the Alum treated water. The average of HAA formation potential normalized to carbon for Alum and ACH were 27 and 30 ppb, respectively. On average, Alum outperformed ACH with respect to DBP formation potential per mg/L of carbon by lowering THM and HAA concentrations by 12 and 4 µg/L, respectively.
The DBP formation potential results reveal that the nature of DOC is the determining factor on how much DBP formation potential can be expected because of alum’s preferential removal of DBP precursors as compared to ACH. The normalized DBP formation potential results show this, however, the results do not shed any insight into the coagulant’s effect on the nature of DOC. Utilization of fluorescence spectroscopy with PARAFAC analysis was employed in order to gain insight into the nature of DOC and its reactivity with the different coagulants.

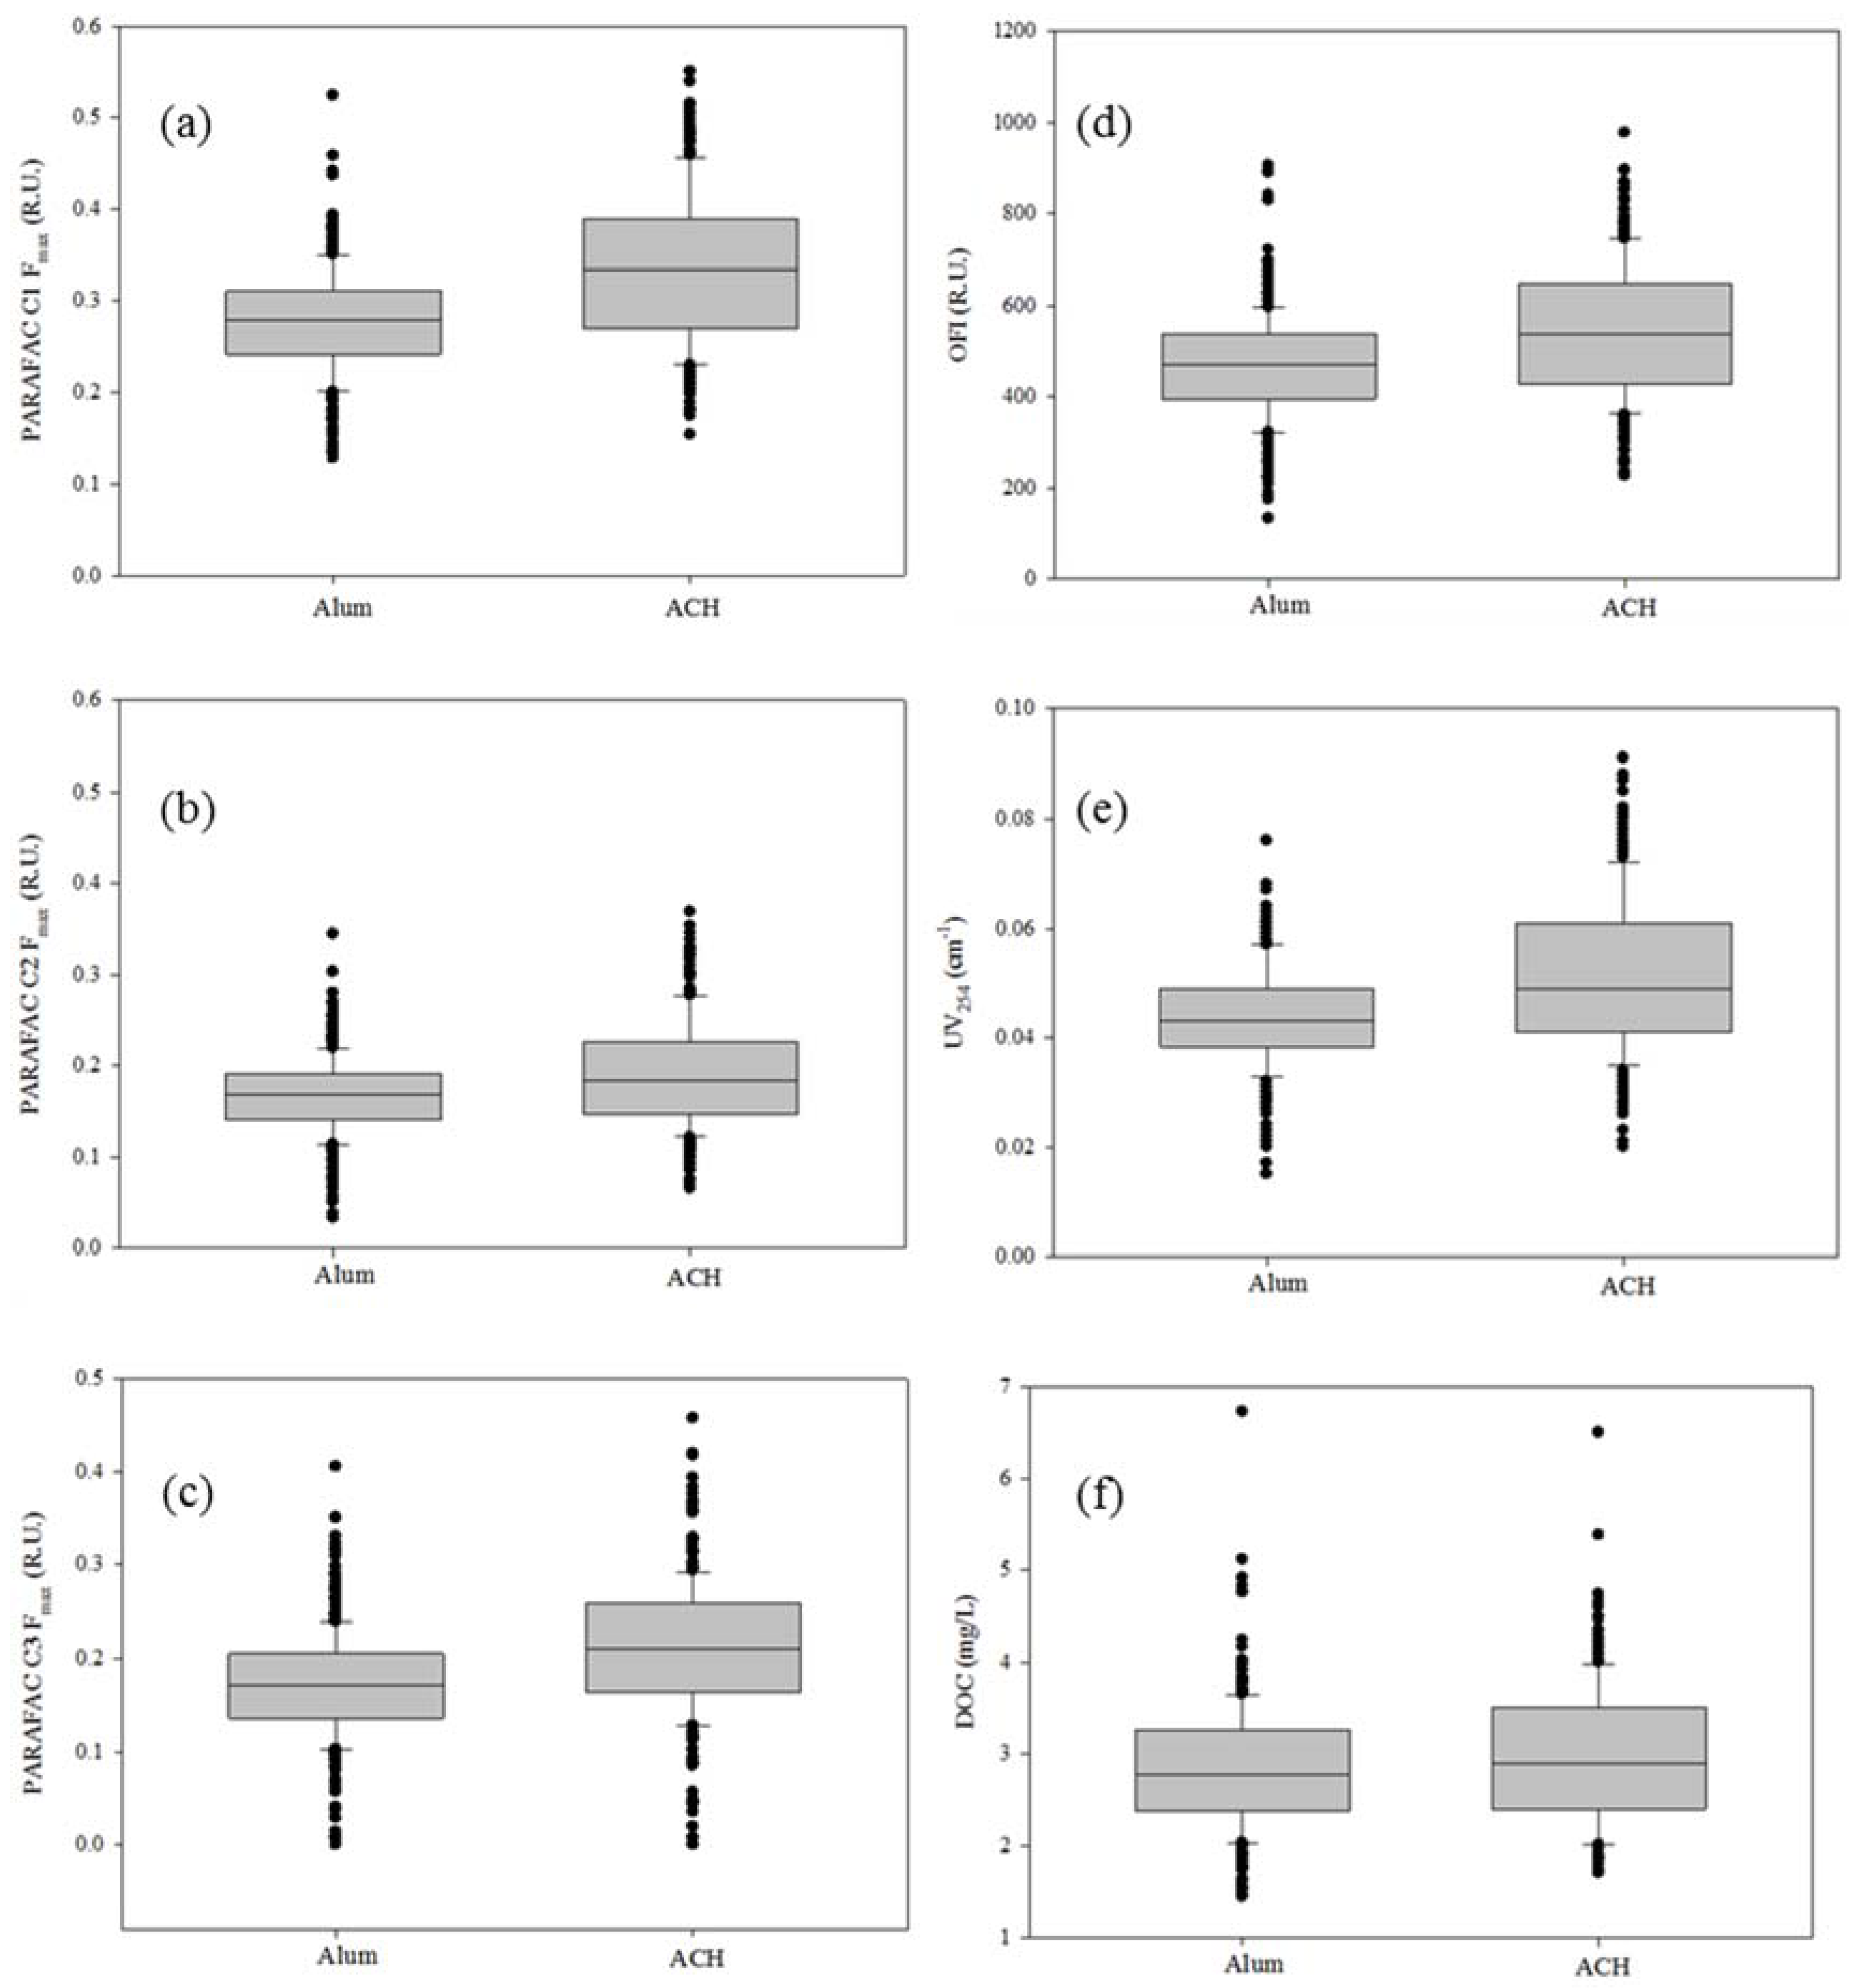
3.3. Fluorescence and DOC Analysis

The fluorescence EEMs were analyzed using PARAFAC analysis to determine the different components that make up the nature of DOC. PARAFAC analysis of the EEMs from all the samples yielded three distinct fluorophores or components. Component one (C1) had two excitation maxima at 234 and 319 nm with a single emission maximum at 400 nm. This component, which has been commonly identified in freshwater, is associated with humic-like fluorophores. Component two (C2) also contained a humic-like fluorophore with an excitation maximum below 224 nm and a secondary maximum at 354 nm with a maximum emission at 468/470 nm. Component three (C3) had an excitation maximum below 224 nm and at 284 nm with a maximum emission at 342 nm and is associated with protein-like structures.
Coagulation of the raw water sample has been found to have little effect on the signature of the fluorophores but rather, decreases the fluorophore intensity which correlates to a decrease in DOC of the water [47]. The two different coagulants in this study exhibited different preferential removal of DOC. Table 4 shows the results of the PARAFAC analysis along with DOC, UV, and overall fluorescence intensity (OFI), which is the summation of all the EEM pairs with the matrix [48] results. From Table 4, it is evident that fluorescence and UV intensities are lower with Alum treated water than with ACH treated water. Average fluorescence component removal for Alum was 15%–25% higher than ACH, even though the DOC removal for Alum was only 5% higher over ACH. Both OFI and UV removal were 17% higher for Alum than ACH.
PARAFAC component 1 Fmax averaged 0.277 and 0.355 (R.U.) for Alum and ACH, respectively, while component 2 averaged 0.166 and 0.191 (R.U.) for Alum and ACH, respectively. Component 3 averaged 0.170 and 0.210 (R.U.) for Alum and ACH, respectively. Studies have shown that fluorescence components that correlate to THM formation are humic-like components C1 and C2, while HAA formation correlates with humic-like components and microbial-derived component (C3) [17,47]. PARAFAC component scores, which have been shown to correlate with THM formation, were 10%–20% higher in ACH treated water than water treated with Alum. Component 1, component 2, and component 3 Fmax was 22%, 13%, and 19%, respectively, higher with ACH treated water as compared to Alum treated water (Table 4). Figure 6 shows the box plots of all the parameters in Table 4. Even though Alum and ACH had similar quantitative DOC removal, fluorescence results showed that Alum had preferential removal of humic-like DOC (C1 and C2) as compared with ACH. The difference in the fluorescence and UV between Alum and ACH is much higher than DOC as shown. This gives insight into that quantifying DOC does not capture what UV and fluorescence capture with regards to the nature of DOC.
The results show THM formation is higher in water treated with ACH than water treated with Alum. Previous research showed similar results but attributed the increase in THM formation to an alkaline shift in pH of the water samples [49]. While other studies have confirmed this observation [50], the results of this study suggest that different precursors were removed at different extents through coagulation with Alum that were not removed with ACH.

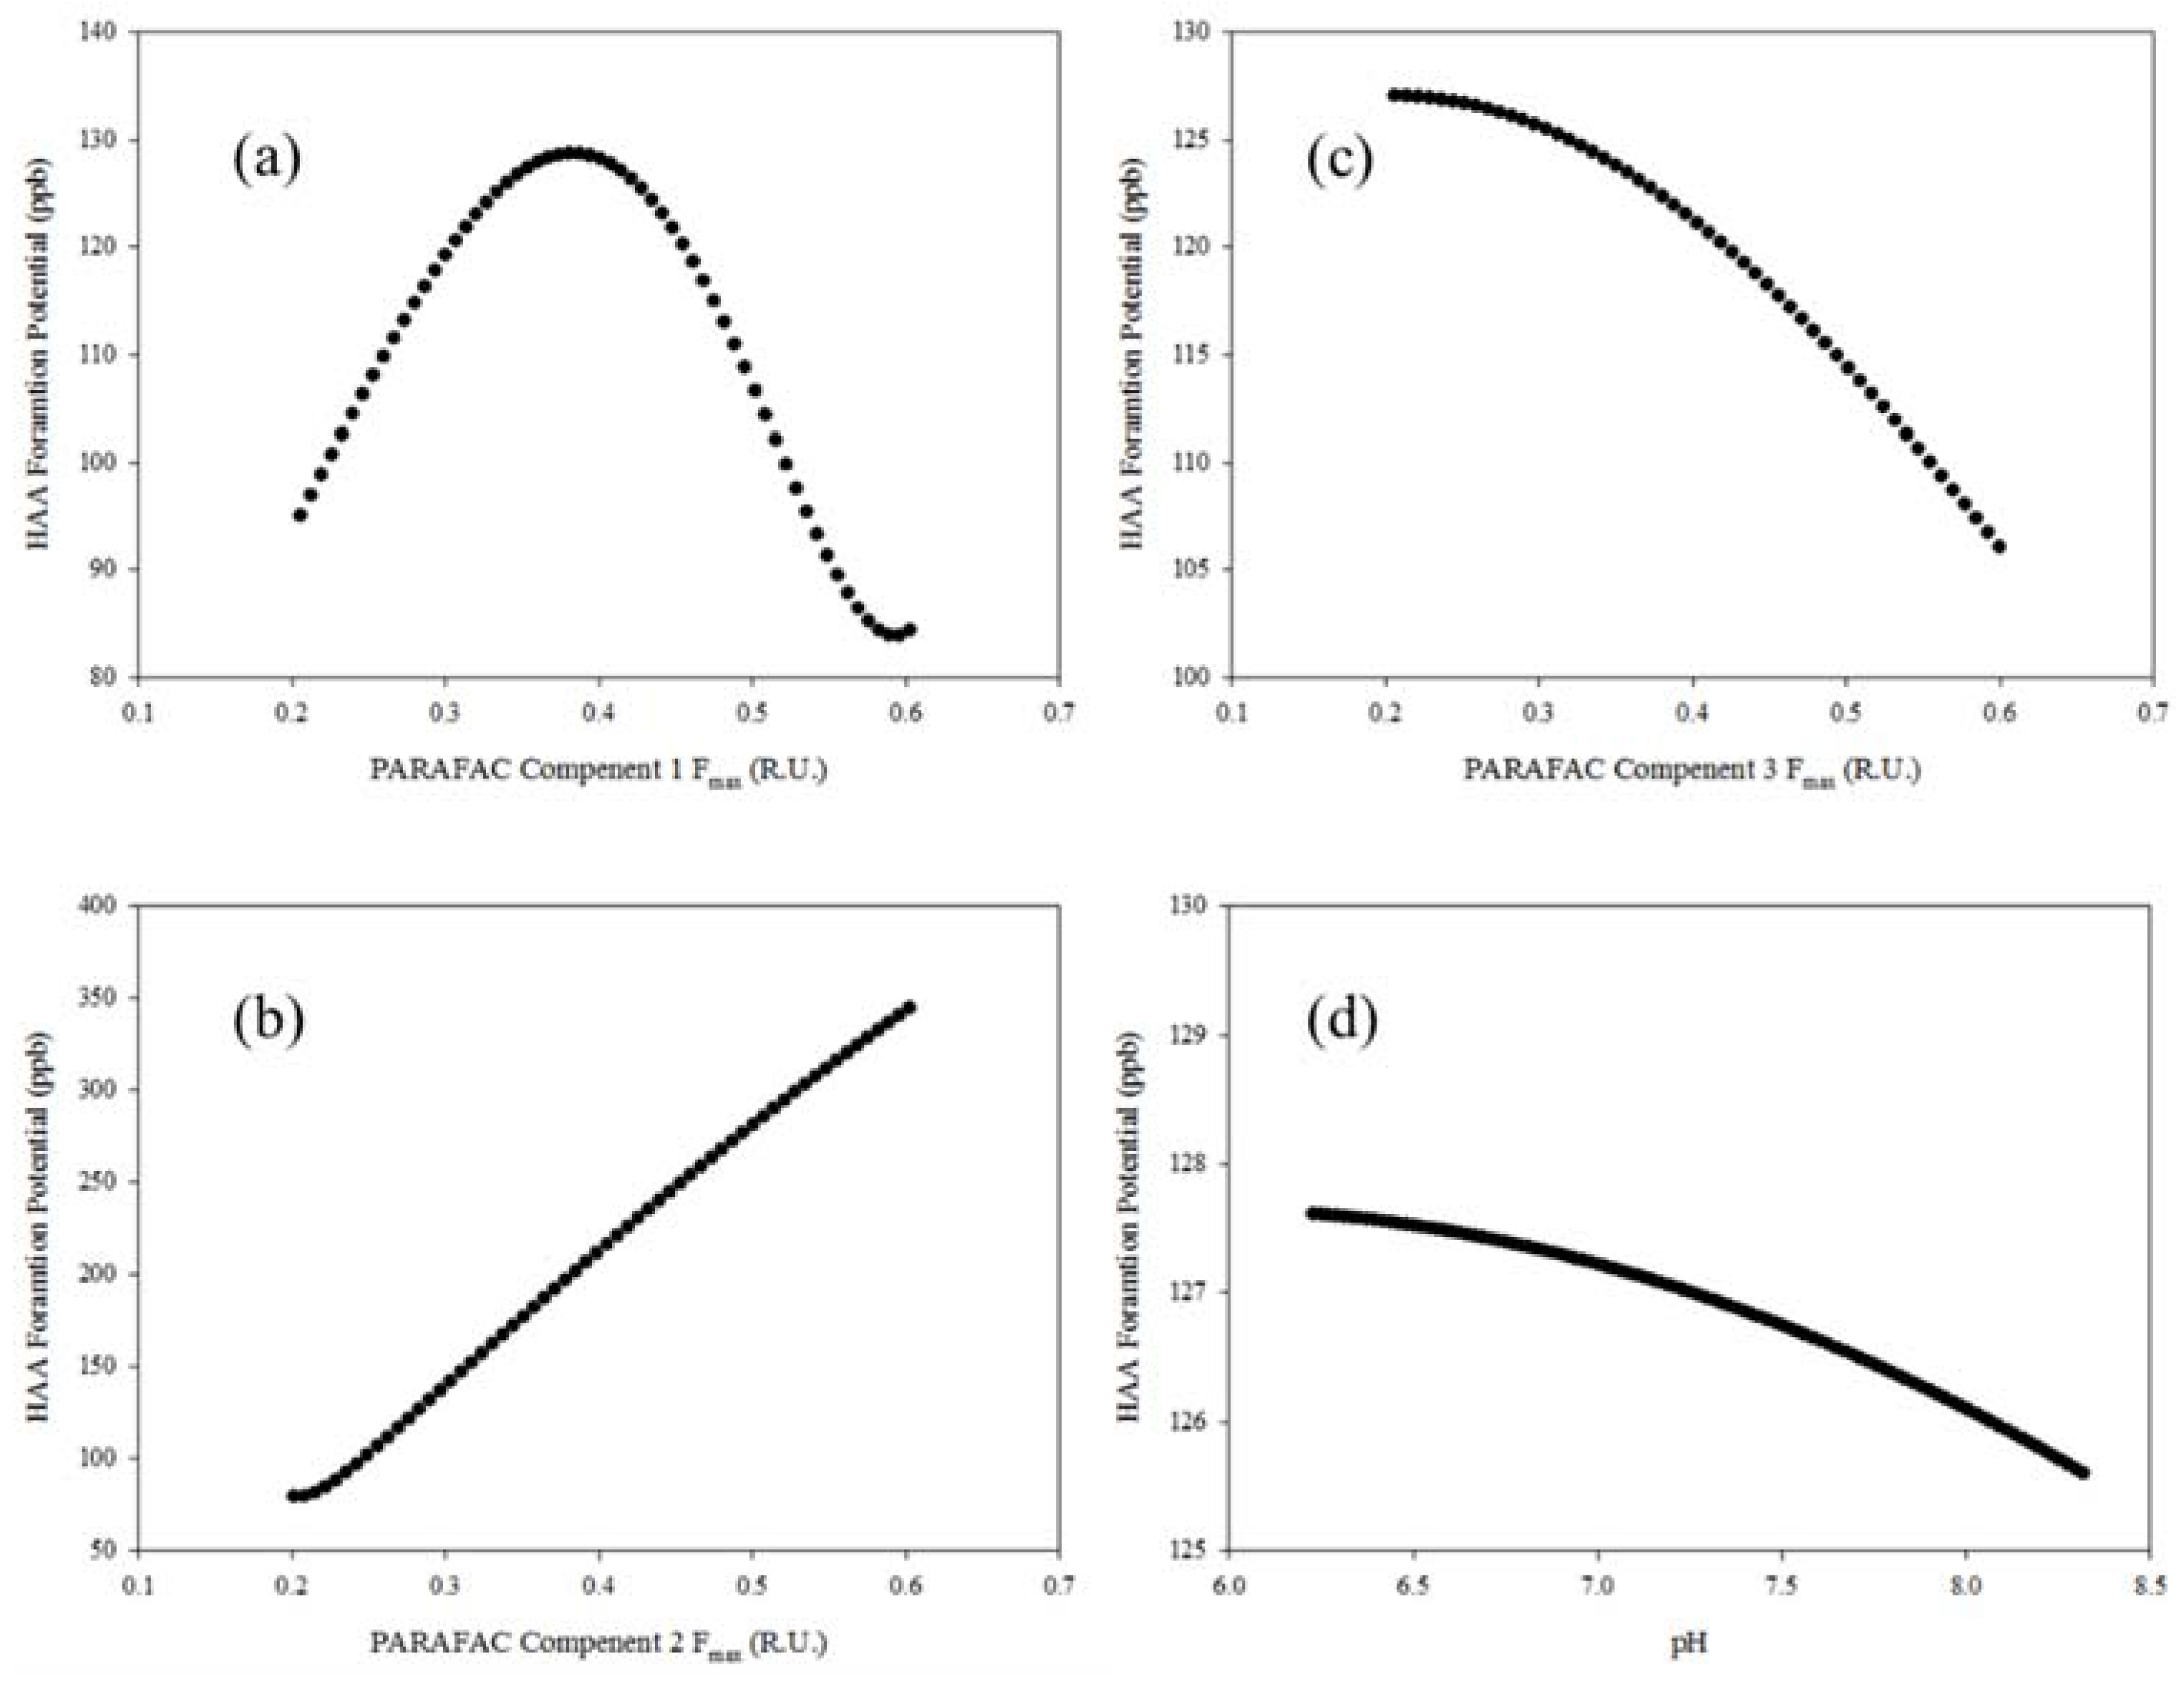
3.4. Monte Carlo Simulations of Disinfection By-Product Formation Potential Modelling

Neural network models were evaluated based on the correlation between modeled and measured values; however, a parametric analysis was performed in order to determine if neural network models are viable and components in the model follow expected trends. A model can have good correlation, but can still be invalid. For example, if pH has a negative correlation with THM formation potential, then the model may have good correlation for the specific data set, however the model is not valid because previous studies have shown that THMs and pH have a positive correlation. Figure 7 and Figure 8 show the results of the parametric analysis that yielded acceptable results. PARAFAC humic-like components, specifically C1 and C2, positively correlated with increases in THMs and HAAs. Figure 7 shows the results of the parametric analysis for the THM formation potential model. As shown, the model generally captured the typical trends for changes in THM formation potential as a function of fluorescence components and pH. The modeled THM formation potential generally increases as C1, C2, or pH increase. C2 has the largest effect on the modeled THM formation potential because it continued to increase while C1 displayed an asymptotic behavior.
Figure 8 shows the results of the parametric analysis for the HAA formation potential model. As pH increased, the HAA formation potential decreased, however, the impact of pH on HAA formation potential was not substantial. For example, an increase of one pH unit from 7 to 8 correlated to THM formation potentials of 110 and 160 µg/L, respectively. On the other hand, a decrease in one pH unit from 8 to 7 only correlated to a 2 µg/L increase for HAA formation potential. Component C2 had the largest impact on the modeled HAA formation potential. These results indicate that the trained THM and HAA formation potential are valid and can be used to predict DBP formation from fluorescence components and pH. Final models for THM and HAA formation potential models were selected based on the results of the correlation between measured and predicted values and the parametric analysis.
Two neural network models, one for THM formation potential using Alum and ACH, and one for HAA formation potential using both coagulants, were selected for modeling. The results of the neural network are presented in Table 5 showing the correlation coefficient and the mean square errors. These results show that there was a high correlation between measured and modeled THM formation potential (R = 0.88 on the test data set; R = 0.91 for complete data set) and measured and modeled HAA formation potential (R = 0.92 for the test data set; R = 0.91 for the entire data set). After verification that the models performed well through the correlation coefficients, and that the model components were verified (e.g., parametric analysis), the neural network algorithms were utilized for input into the Monte Carlo analysis.
The Monte Carlo analysis results are shown in Table 6. A total of 400,000 simulations were performed with 100,000 for each of the four scenarios: Alum THM, ACH THM, Alum HAA, and ACH HAA. The maximum THM formation potential for Alum and ACH is 231 ppb and 320 ppb, respectively. The median THM formation potential was 77 ppb and 87 ppb for Alum and ACH, respectively. The simulations showed that ACH had 13% higher THM formation potential than Alum utilizing the same pH range. Simulated HAA formation potential models showed similar results with a median formation of 81 ppb and 97 ppb for Alum and ACH treated waters, respectively. This represents a 17% higher HAA formation for ACH over Alum when modeled over the same pH range. The results show that even though THM and HAA formation potential were modeled using the same algorithm and pH input distribution, Alum had better THM and HAA formation potential removal regardless of pH. These results imply that Alum has preferential removal of DBP precursors.

4. Summary

Alum- and ACH-based coagulation was studied in parallel at full scale over a period of three years to investigate DBP formation potential removal. It was found that Alum performed better with regards to DBP formation potential removal because of preferential DOC removal. Alum also performed better when it came to HAA formation potential removal. THM formation potential was an average of 47% higher in water that was treated with ACH as compared to Alum while HAA formation potential was 14% higher is water treated with ACH as compared to Alum. DBP formation potential values were normalized to DOC in order to conduct a comparison on a per carbon basis. ACH treated water averaged almost 12 ppb per mg/L DOC higher THM formation potential than water treated with Alum. HAA formation potential also exhibited increased formation at 3 ppb per mg/L DOC with ACH as compared to Alum.
Fluorescence spectroscopy was employed for analysis of the same samples used for DBP formation potential tests. PARAFAC was used to analyze and quantify the EEMs from raw, Alum treated and ACH treated waters. The PARAFAC results are in agreement with what was observed from the DBP formation potential tests. A total of 3 PARAFAC components were found which include component 1 (C1), and component 2 (C2), both of which have humic-like characteristics. Component 3 (C3), has protein-like characteristics. Average C1 and C2 removals with Alum were 23% and 16% higher respectively as compared with ACH. The data show that Alum removed more DBP precursors than ACH did. This increased DBP precursor removal also correlated with the increased DBP formation potential observed. Although the Alum and ACH treated DOC concentrations were similar (i.e., settled DOC for Alum and ACH were 2.83 and 2.97 mg/L, respectively), fluorescence was able to capture the distinct nature of the DOC in the samples treated with each coagulant (reflected by the different contribution of C1, C2 and C3 in the Alum- and ACH-treated water samples).
Finally, Monte Carlo simulations were run to assess the effect of pH on DBP formation potential. 100,000 simulations were conducted for each coagulant and DBP for a total of 400,000 simulations. The PARAFAC component distribution for Alum and ACH were input into the model and had different distributions created from the original data set for each coagulant. The pH was held constant for both Alum and ACH (i.e., they shared the same pH distribution) in order to remove any bias towards pH. The pH distribution range was 6.4 to 8.2 and the simulation randomly selected a pH in the range for the model. The results of the Monte Carlo simulation showed that ACH treated water formed an average of approximately 15% higher THMs and HAAs then water treated with Alum. These observations indicate that the coagulant preferential component removal has higher impact on the DBP formation potential than pH, even though the role of pH should be considered.
The results of this study show that different coagulants have preferential removal for DBP formation potential. While quantifying DOC provided limited insight on DBP formation, fluorescence spectroscopy was successfully utilized to characterize the DOC nature. Employing fluorescence spectroscopy in WTPs is promising on many levels; however, specifically targeting DBP forming compounds during treatment is vital for treatment optimization and compliance. Different coagulants target different compounds and have preferential removal in the treatment process. In this three year, full-scale parallel study of two different coagulants applied on the same source water, Alum exhibited higher performance removing DBP formation potential as compared with ACH. Monte Carlo simulations further validated that Alum performed better at removing DBP formation potential than ACH under similar conditions. Further studies are needed to analyze the coagulants affinity to DBP precursor removal and the DOC removal mechanism for these and other coagulants.

Supplementary Materials

The following are available online at https://www.mdpi.com/2073-4441/8/8/318/s1

Acknowledgments

The authors would like to acknowledge the City of Akron Water Treatment Facility for making this study possible.

Author Contributions

Andrew Skeriotis is the primary author for the study. Nancy Sanchez performed all of the PARAFAC modelling and contributed to the writing. Marla Kennedy performed all of the Monte Carlo and neural network modelling and contributed to the writing. David Johnstone contributed to the results section and reviewed the DBP data. Chris Miller is Andrew Skeriotis’ advisor and contributed to the abstract and summary as well as reviewing the data.

Conflicts of Interest

The authors declare no conflict of interest.

References

  1. United States Environmental Protection Agency. National primary drinking water regulations: Stage 2 disinfectants and disinfection by-products rule. Fed. Regist. 2006, 71, 387–493. [Google Scholar]
  2. Chen, W.; Westerhoff, P.; Leenheer, J.A.; Booksh, K. Fluorescence excitation-emission matrix regional integration to quantify spectra for dissolved organic matter. Environ. Sci. Technol. 2003, 37, 5701–5710. [Google Scholar] [CrossRef] [PubMed]
  3. Rook, J.J. Formation of haloforms during chlorination of natural waters. Water Treat. Exam. 1974, 23, 234–243. [Google Scholar]
  4. Leenheer, J.A.; Croué, J.-P. Peer reviewed: Characterizing aquatic dissolved organic matter. Environ. Sci. Technol. 2003, 37, 18A–26A. [Google Scholar] [CrossRef] [PubMed]
  5. Świetlik, J.; Sikorska, E. Characterization of natural organic matter fractions by high pressure size-exclusion chromatography, specific UV absorbance and total luminescence spectroscopy. Pol. J. Environ. Stud. 2005, 15, 145–153. [Google Scholar]
  6. Archer, D.A.; Singer, P.C. An evaluation of the relationship between: SUVA and NOM coagulation using the ICR database. J. Am. Water Works Assoc. 2006, 98, 110–123. [Google Scholar]
  7. Bose, P.; Reckhow, D.A. The effect of ozonation on natural organic matter removal by alum coagulation. Water Res. 2007, 41, 1516–1524. [Google Scholar] [CrossRef] [PubMed]
  8. Jacangelo, J.G.; Demarco, J.; Owen, D.M.; Randtke, S.J. Selected processes for removing NOM: An overview: Natural organic matter. J. Am. Water Works Assoc. 1995, 87, 64–71. [Google Scholar]
  9. Owen, D.M.; Amy, G.L.; Chowdhary, Z.K. Characterization of Natural Organic Matter and Its Relationship to Treatability; AWWARF: Denver, CO, USA, 1993. [Google Scholar]
  10. Stedmon, C.A.; Markager, S.; Bro, R. Tracing dissolved organic matter in aquatic environments using a new approach to fluorescence spectroscopy. Mar. Chem. 2003, 82, 239–254. [Google Scholar] [CrossRef]
  11. Matilainen, A.; Gjessing, E.T.; Lahtinen, T.; Hed, L.; Bhatnagar, A.; Sillanpää, M. An overview of the methods used in the characterisation of natural organic matter (NOM) in relation to drinking water treatment. Chemosphere 2011, 83, 1431–1442. [Google Scholar] [CrossRef] [PubMed]
  12. Hua, G.; Reckhow, D.A. Comparison of disinfection byproduct formation from chlorine and alternative disinfectants. Water Res. 2007, 41, 1667–1678. [Google Scholar] [CrossRef] [PubMed]
  13. Krasner, S.W.; Weinberg, H.S.; Richardson, S.D.; Pastor, S.J.; Chinn, R.; Sclimenti, M.J.; Onstad, J.D.; Thruston, A.D., Jr. Occurrence of a New Generation of Disinfection Byproducts. Environ. Sci. Technol. 2006, 40, 7175–7185. [Google Scholar] [CrossRef] [PubMed]
  14. Ates, N.; Kaplan, S.S.; Sahinkaya, E.; Kitis, M.; Dilek, F.B.; Yetis, U. Occurrence of disinfection by-products in low DOC surface waters in Turkey. J. Hazard. Mater. 2007, 142, 526–534. [Google Scholar] [CrossRef] [PubMed]
  15. Bieroza, M.; Baker, A.; Bridgeman, J. Relating freshwater organic matter fluorescence to organic carbon removal efficiency in drinking water treatment. Sci. Total Environ. 2009, 407, 1765–1774. [Google Scholar] [CrossRef] [PubMed]
  16. Peiris, R.H.; Halle, C.; Budman, H.; Moresoli, C.; Peldszus, S.; Huck, P.M.; Legge, R.L. Indentifying fouling events in a membrane-based drinking water treatment process using principal component analysis of fluorescence excitation-emission matrices. Water Res. 2010, 44, 185–194. [Google Scholar] [CrossRef] [PubMed]
  17. Baghoth, S.A.; Sharma, S.K.; Amy, G.L. Tracking natural organic matter (NOM) in a drinking water treatment using fluorescence excitation-emission matrices and PARAFAC. Water Res. 2011, 45, 797–809. [Google Scholar] [CrossRef] [PubMed]
  18. Coble, P.G. Characterization of marine and terrestrial DOM in seawater using excitation-emission matrix spectroscopy. Mar. Chem. 1996, 51, 325–346. [Google Scholar] [CrossRef]
  19. McKnight, D.M.; Boyer, E.W.; Westerhoff, P.K.; Doran, P.T.; Kulbe, T.; Andreson, D.T. Spectrofluorometric characterization of dissolved organic matter for indication of precursors organic material and aromaticity. Limnol. Oceanogr. 2001, 46, 38–48. [Google Scholar] [CrossRef]
  20. Zsolnay, A.; Baigar, E.; Jimenez, M.; Steinweg, B.; Saccomandi, F. Differentiating with fluorescence spectroscopy the sources of dissolved organic matter in soils subjected to drying. Chemosphere 1999, 38, 45–50. [Google Scholar] [CrossRef]
  21. Huguet, A.; Vacher, L.; Relexans, S.; Saubusse, S.; Froidfond, J.M.; Parlanti, E. Properties of fluorescent dissolved organic carbon in the Gironde Estuary. Org. Geochem. 2009, 40, 706–719. [Google Scholar] [CrossRef]
  22. Bro, R. PARAFAC, Tutorial and applications. Chemom. Intell. Lab. Syst. 1997, 38, 149–171. [Google Scholar] [CrossRef]
  23. Holbrook, D.R.; Yen, J.H.; Grizzard, T.J. Characterizing natural organic material from Occoquan Watershed (Northern Virginia, US) using fluorescence spectroscopy and PARAFAC. Sci. Total Environ. 2006, 361, 249–266. [Google Scholar] [CrossRef] [PubMed]
  24. Baghoth, S.A.; Dignum, M.; Grefta, A.; Kroesbergen, J. Characterization of NOM in a drinking water treatment process train with no disinfectant residual. Water Sci. Technol. Water Supply 2009, 9, 379–386. [Google Scholar] [CrossRef]
  25. Johnstone, D.W.; Sanchez, N.P.; Miller, C.M. Parallel Factor Analysis of Excitation-Emission Matrices to Assess Drinking Water Disinfection Byproduct Formation during a Peak Formation Period. Environ. Eng. Sci. 2009, 26, 1551–1559. [Google Scholar] [CrossRef]
  26. Pifer, A.D.; Fairey, J.L. Improving UV254 using fluorescence-PARAFAC analysisand asymmetric flow-field flow fractionation for assessing disinfection byproduct formation and control. Water Res. 2012, 46, 2927–2936. [Google Scholar] [CrossRef] [PubMed]
  27. Johnstone, D.W.; Miller, C.M. Fluorescence Excitation–Emission Matrix Regional Transformation and Chlorine Consumption to Predict Trihalomethane and Haloacetic Acid Formation. Environ. Eng. Sci. 2009, 26, 1163–1170. [Google Scholar] [CrossRef]
  28. Xu, W.; Wang, Y.; Yue, Q.; Ren, H. Effect of second coagulant addition on coagulation efficiency, floc particles and residual Al for humic acid treatment by Al13 polymer and polyaluminum chloride (PACl). J. Hazard. Mater. 2012, 215–216, 129–137. [Google Scholar] [CrossRef] [PubMed]
  29. Gregory, J.; Duan, J. Hydrolyzing metal salts as coagulants. Pure Appl. Chem. 2001, 73, 2017–2026. [Google Scholar] [CrossRef]
  30. Bell-Ajy, K.; Abbaszadegan, M.; Ibrahim, E.; Verges, D.; LeChevallier, M. Conventional and optimized coagulation for NOM removal. J. Am. Water Works Assoc. 2000, 92, 44–58. [Google Scholar]
  31. Matilainen, A.; Vepsäläinen, M.; Sillanpää, M. Natural organic matter removal by coagulation during drinking water treatment: A review. Adv. Colloid Interface Sci. 2010, 159, 189–197. [Google Scholar] [CrossRef] [PubMed]
  32. Dempsey, B.A.; Sheu, H.; Ahmed, T.M.T.; Mentick, J. Polyaluminum chloride an alum coagulation of clay-fulvic acid suspensions. J. Am. Water Works Assoc. 1985, 77, 74–80. [Google Scholar]
  33. Van Benschoten, J.E.; Edzwald, J.K. Chemical aspects of coagulation using aluminum salts—I, Hydrolytic reactions of alum and polyaluminum chloride. Water Res. 1990, 24, 1519–1526. [Google Scholar] [CrossRef]
  34. Edwards, M. Predicting DOC removal during enhanced coagulation. J. Am. Water Works Assoc. 1997, 89, 78–89. [Google Scholar]
  35. Sanchez, N.P.; Skeriotis, A.T.; Miller, C.M. Assessment of Dissolved Organic Matter Fluorescence PARAFAC components before and after coagulation-filtration in a full scale water treatment plant. Water Res. 2013, 47, 1679–1690. [Google Scholar] [CrossRef] [PubMed]
  36. U.S. EPA. Determination of Haloacetic Acids and Dalapon in Drinking Water by Liquid-liquid Extraction, Derivatization and Gas Chromatography with Electron Capture Detection; U.S. EPA Method 552.2; National Exposure Research Laboratory Office of Research and Development U.S. EPA: Cincinnati, OH, USA, 1995.
  37. Xie, Y.; Reckhow, D.A.; Springborg, D.C. Analyzing HAAs and ketoacids without diazomethane. J. Am. Water Works Assoc. 1998, 90, 131–138. [Google Scholar]
  38. U.S. EPA. Determination of Chlorinated Disinfection Byproducts, Chlorinated Solvents, and Halogenated Pesticides/Herbicides in Drinking Water by Liquid-liquid Extraction and Gas Chromatography with Electron-Capture Detection; U.S. EPA Method 551.1; National Exposure Research Laboratory Office of Research and Development U.S. EPA: Cincinnati, OH, USA, 1995.
  39. Anderson, C.M.; Bro, R. Practical aspects of PARAFAC modeling of fluorescence excitation emission data. J. Chemom. 2003, 17, 200–215. [Google Scholar] [CrossRef]
  40. Stedmon, C.A.; Bro, R. Characterizing dissolved organic matter fluorescence with parallel factor analysis: A tutorial. Limnol. Oceanogr. Methods 2008, 6, 572–579. [Google Scholar] [CrossRef]
  41. Yamashita, Y.; Tanoue, E. Chemical characterization of protein-like fluorescence in DOM in relation to aromatic amino acids. Mar. Chem. 2003, 82, 255–271. [Google Scholar] [CrossRef]
  42. Thygesen, L.G.; Rinnan, Å.; Barsberg, S.; Møller, J.K.S. Stabilizing the PARAFAC decomposition of fluorescence spectra by insertion of zeroes outside the data area. Chemom. Intell. Lab. Syst. 2004, 71, 97–106. [Google Scholar] [CrossRef]
  43. Harshman, R.A.; Lundy, M.E. The PARAFAC Model for Three-Way Factor Analysis and Multidimensional; Law, H.G., Snyder, C.W., Hattie, J.A., McDonald, R.P., Eds.; Research Methods for Multimode Data Analysis, Praeger: New York, NY, USA, 1984. [Google Scholar]
  44. Tucker, L. Some mathematical notes on three-mode factor analysis. Psychometrika 1966, 31, 279–311. [Google Scholar] [CrossRef] [PubMed]
  45. Bro, R.; Kiers, H.A. A new efficient method for determining the number of components in PARAFAC models. J. Chemom. 2003, 17, 274–286. [Google Scholar] [CrossRef]
  46. Ged, E.C.; Chadik, P.A.; Boyer, T.H. Predictive capability of chlorination disinfection byproducts models. J. Environ. Manag. 2014, 149, 253–262. [Google Scholar] [CrossRef] [PubMed]
  47. Sanchez, N.P.; Skeriotis, A.T.; Miller, C.M. A PARAFAC-based Long-Term Assessment of DOM in a Multi-Coagulant Drinking Water Treatment Scheme. Environ. Sci. Technol. 2015, 48, 1582–1591. [Google Scholar] [CrossRef] [PubMed]
  48. Beggs, K.; Summers, S.; McKnight, D. Characterizing chlorine oxidation of dissolved organic matter and disinfection by-product formation with fluorescence spectroscopy and parallel factor analysis. J. Geophys. Res. 2009, 114, G04001. [Google Scholar] [CrossRef]
  49. Peleto, N.M.; Armour, J.; Andrews, A.C. Statistical significance testing of parallel pilot-scale coagulation optimization study to compare aluminum sulfate and polyaluminum chloride performance. J. Water Supply Res. Technol. AQUA 2014, 63, 532–540. [Google Scholar] [CrossRef]
  50. Liang, L.; Singer, P.C. Factors Influencing the Formation of and Relative Distribution of Haloacetic Acids and Trihalomethanes in Drinking Water. Environ. Sci. Technol. 2003, 37, 2920–2928. [Google Scholar] [CrossRef] [PubMed]
Figure 1. Dissolved organic carbon (DOC) for raw water (n = 361), Alum treated water (n = 361), and aluminum chlorohydrate (ACH) (n = 299) treated water from October 2009 to December 2012.
Water 08 00318 g001
Figure 2. Trihalomethane formation potential (THM) of Alum (n = 87) and aluminum chlorohydrate (n = 75) (ACH) treated waters versus dissolved organic carbon (DOC) with maximum contaminant level (MCL) at 80 µg/L.
Water 08 00318 g002
Figure 3. Haloacetic acid (HAA) formation potential of Alum (n = 87) and aluminum chlorohydrate (n = 75) (ACH) treated waters versus dissolved organic carbon (DOC) and maximum contaminant level (MCL) at 60 µg/L.
Water 08 00318 g003
Figure 4. Comparison of Alum and aluminum chlorohydrate (ACH) treated water with regards to trihalomethane (THM) (n = 87) and haloacetic acid (HAA) (n = 76) formation potential.
Water 08 00318 g004
Figure 5. Comparison of Alum and aluminum chlorohydrate (ACH) treated water with regards to trihalomethane (THM) (n = 87) and haloacetic acid (HAA) (n = 76) formation potential (FP) normalized to dissolved organic carbon (DOC).
Water 08 00318 g005
Figure 6. Box plot comparisons of fluorescence and organic carbon metrics including: (ac) Parallel factor (PARAFAC) component Fmax; (d) overall fluorescence index (OFI); (e) ultra-violet absorbance (UV) at 254 nm; (f) and dissolved organic carbon (DOC).
Water 08 00318 g006
Figure 7. (ac) Parametric analysis results of PARAFAC components 1 to 3; and (d) pH for trihalomethane (THM) formation potential.
Water 08 00318 g007
Figure 8. (ac) Parametric analysis results of PARAFAC components 1 to 3; and (d) pH for haloacetic acid (HAA) formation potential.
Water 08 00318 g008
Table 1. Lake Rockwell source water characteristics including: dissolved organic carbon (DOC), specific ultra-violet absorbance (SUVA), pH, alkalinity, and turbidity collected from October 2009 to December 2012.
ParameterDOC (mg/L)SUVA (L/mg-m)pHAlkalinity (mg/L as CaCO3)Turbidity (NTU)
Mean5.38 ± 1.283.05 ± 0.547.65 ± 0.35110 ± 247.92 ± 3.97
Median5.033.027.681107.43
Minimum3.141.676.64641.90
Maximum9.814.138.3216029.4
Table 2. Average water quality parameters of raw and treated water samples collected from October 2009 to December 2012 including dissolved organic carbon (DOC), pH, and ultra-violet absorption at 254 nm (UV254).
WaternDOC (mg/L)pHUV254 (cm−1)
Raw3615.38 ± 1.287.65 ± 0.350.149 ± 0.037
Alum3612.83 ± 0.666.99 ± 0.300.044 ± 0.009
ACH2992.97 ± 0.747.50 ± 0.290.051 ± 0.014
Table 3. Average trihalomethanes (THM) and standard deviations and haloacetic acids (HAA) and standard deviations and THMs and HAAs (and standard deviations) normalized to dissolved organic carbon (DOC) for raw water (n = 87), Alum treated water (n = 87), and aluminum chlorohydrate (n = 75) (ACH) treated water.
WaterTHM(SD) (ug/L)THM/DOC(SD) (ug/L)HAA(SD) (ug/L)HAA/DOC(SD) (ug/L)
Raw260(92)48(13)219(63)41(12)
Alum69(30)24(9)76(39)27(11)
ACH107(43)36(12)89(38)30(13)
Table 4. Comparison of dissolved organic carbon (DOM) and fluorescence metrics including: Parallel Factor (PARAFAC) Component Fmax, Overall Fluorescence Index (OFI), Dissolve Organic Carbon (DOC), Ultra-violet Absorbance (UV) at 254 nm, and OFI/DOC.
MetricRaw MeanAlum MeanACH Mean% > Alump-Value (t-Test)
PARAFAC C1 Fmax (R.U.)0.5010.2770.33521%0.000
PARAFAC C2 Fmax (R.U.)0.4950.1660.19115%0.000
PARAFAC C3 Fmax (R.U.)0.2900.1700.21024%0.000
OFI (R.U.)96946654617%0.000
DOC (mg/L)5.242.832.975%0.010
UV254 (cm−1)0.1500.0440.05117%0.000
Table 5. Neural network model results of all Alum and ACH data for trihalomethane (THM) and haloacetic acid (HAA) formation potential showing the correlation coefficient (R) and mean squared error (MSE).
DBPTestAll
RMSERMSE
THM0.8822890.911747
HAA0.9210430.911105
Table 6. Monte Carlo simulation results showing Alum vs. aluminum chlorohydrate (ACH) for trihalomethane (THM) and haloacetic acid (HAA) formation potential over the same pH range.
ParameterTHM (ug/L)HAA (ug/L)
AlumACHAlumACH
Minimum003411
Maximum231320527653
Median77878197

