
Drinking and Cleaning Water Use in a Dairy Cow Barn


 ,
,  ,
,
Abstract
:1. Introduction
2. Materials and Methods
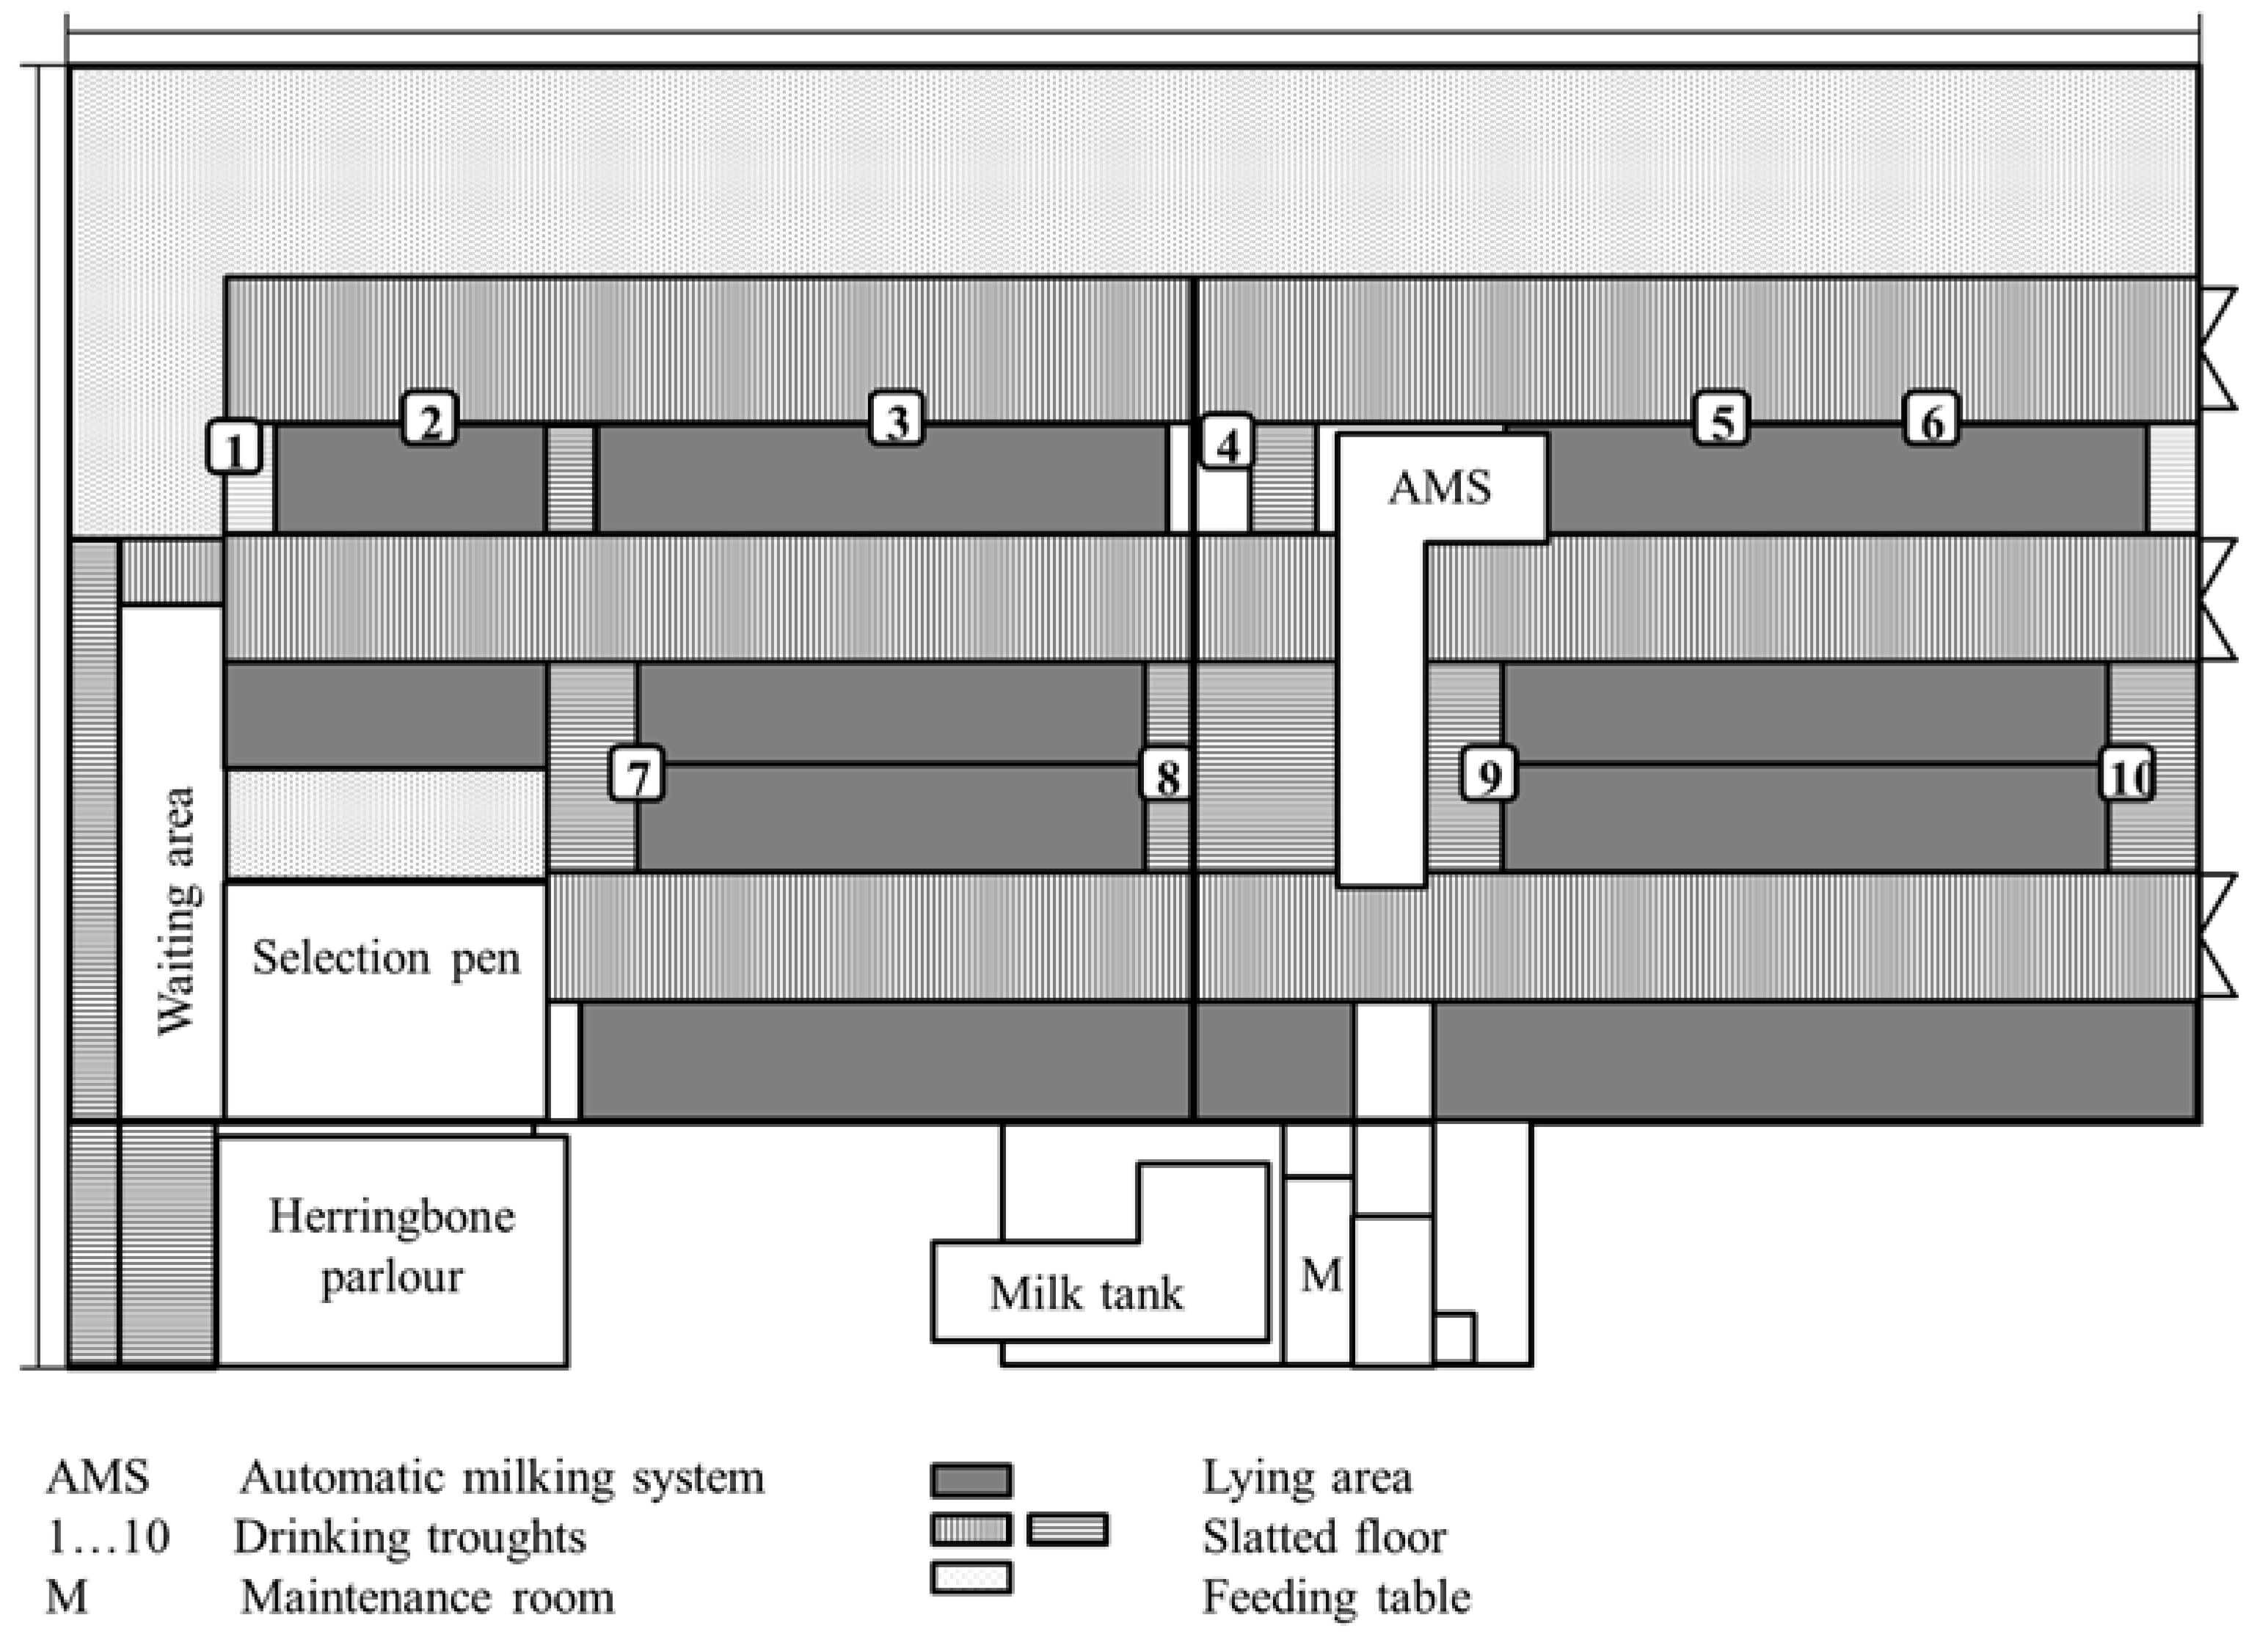
2.1. Milking Systems
2.2. Water Metering
2.3. Technical Water
2.4. Regression Functions of the Drinking Water Demand
2.5. Statistical Analyses
3. Results and Discussion
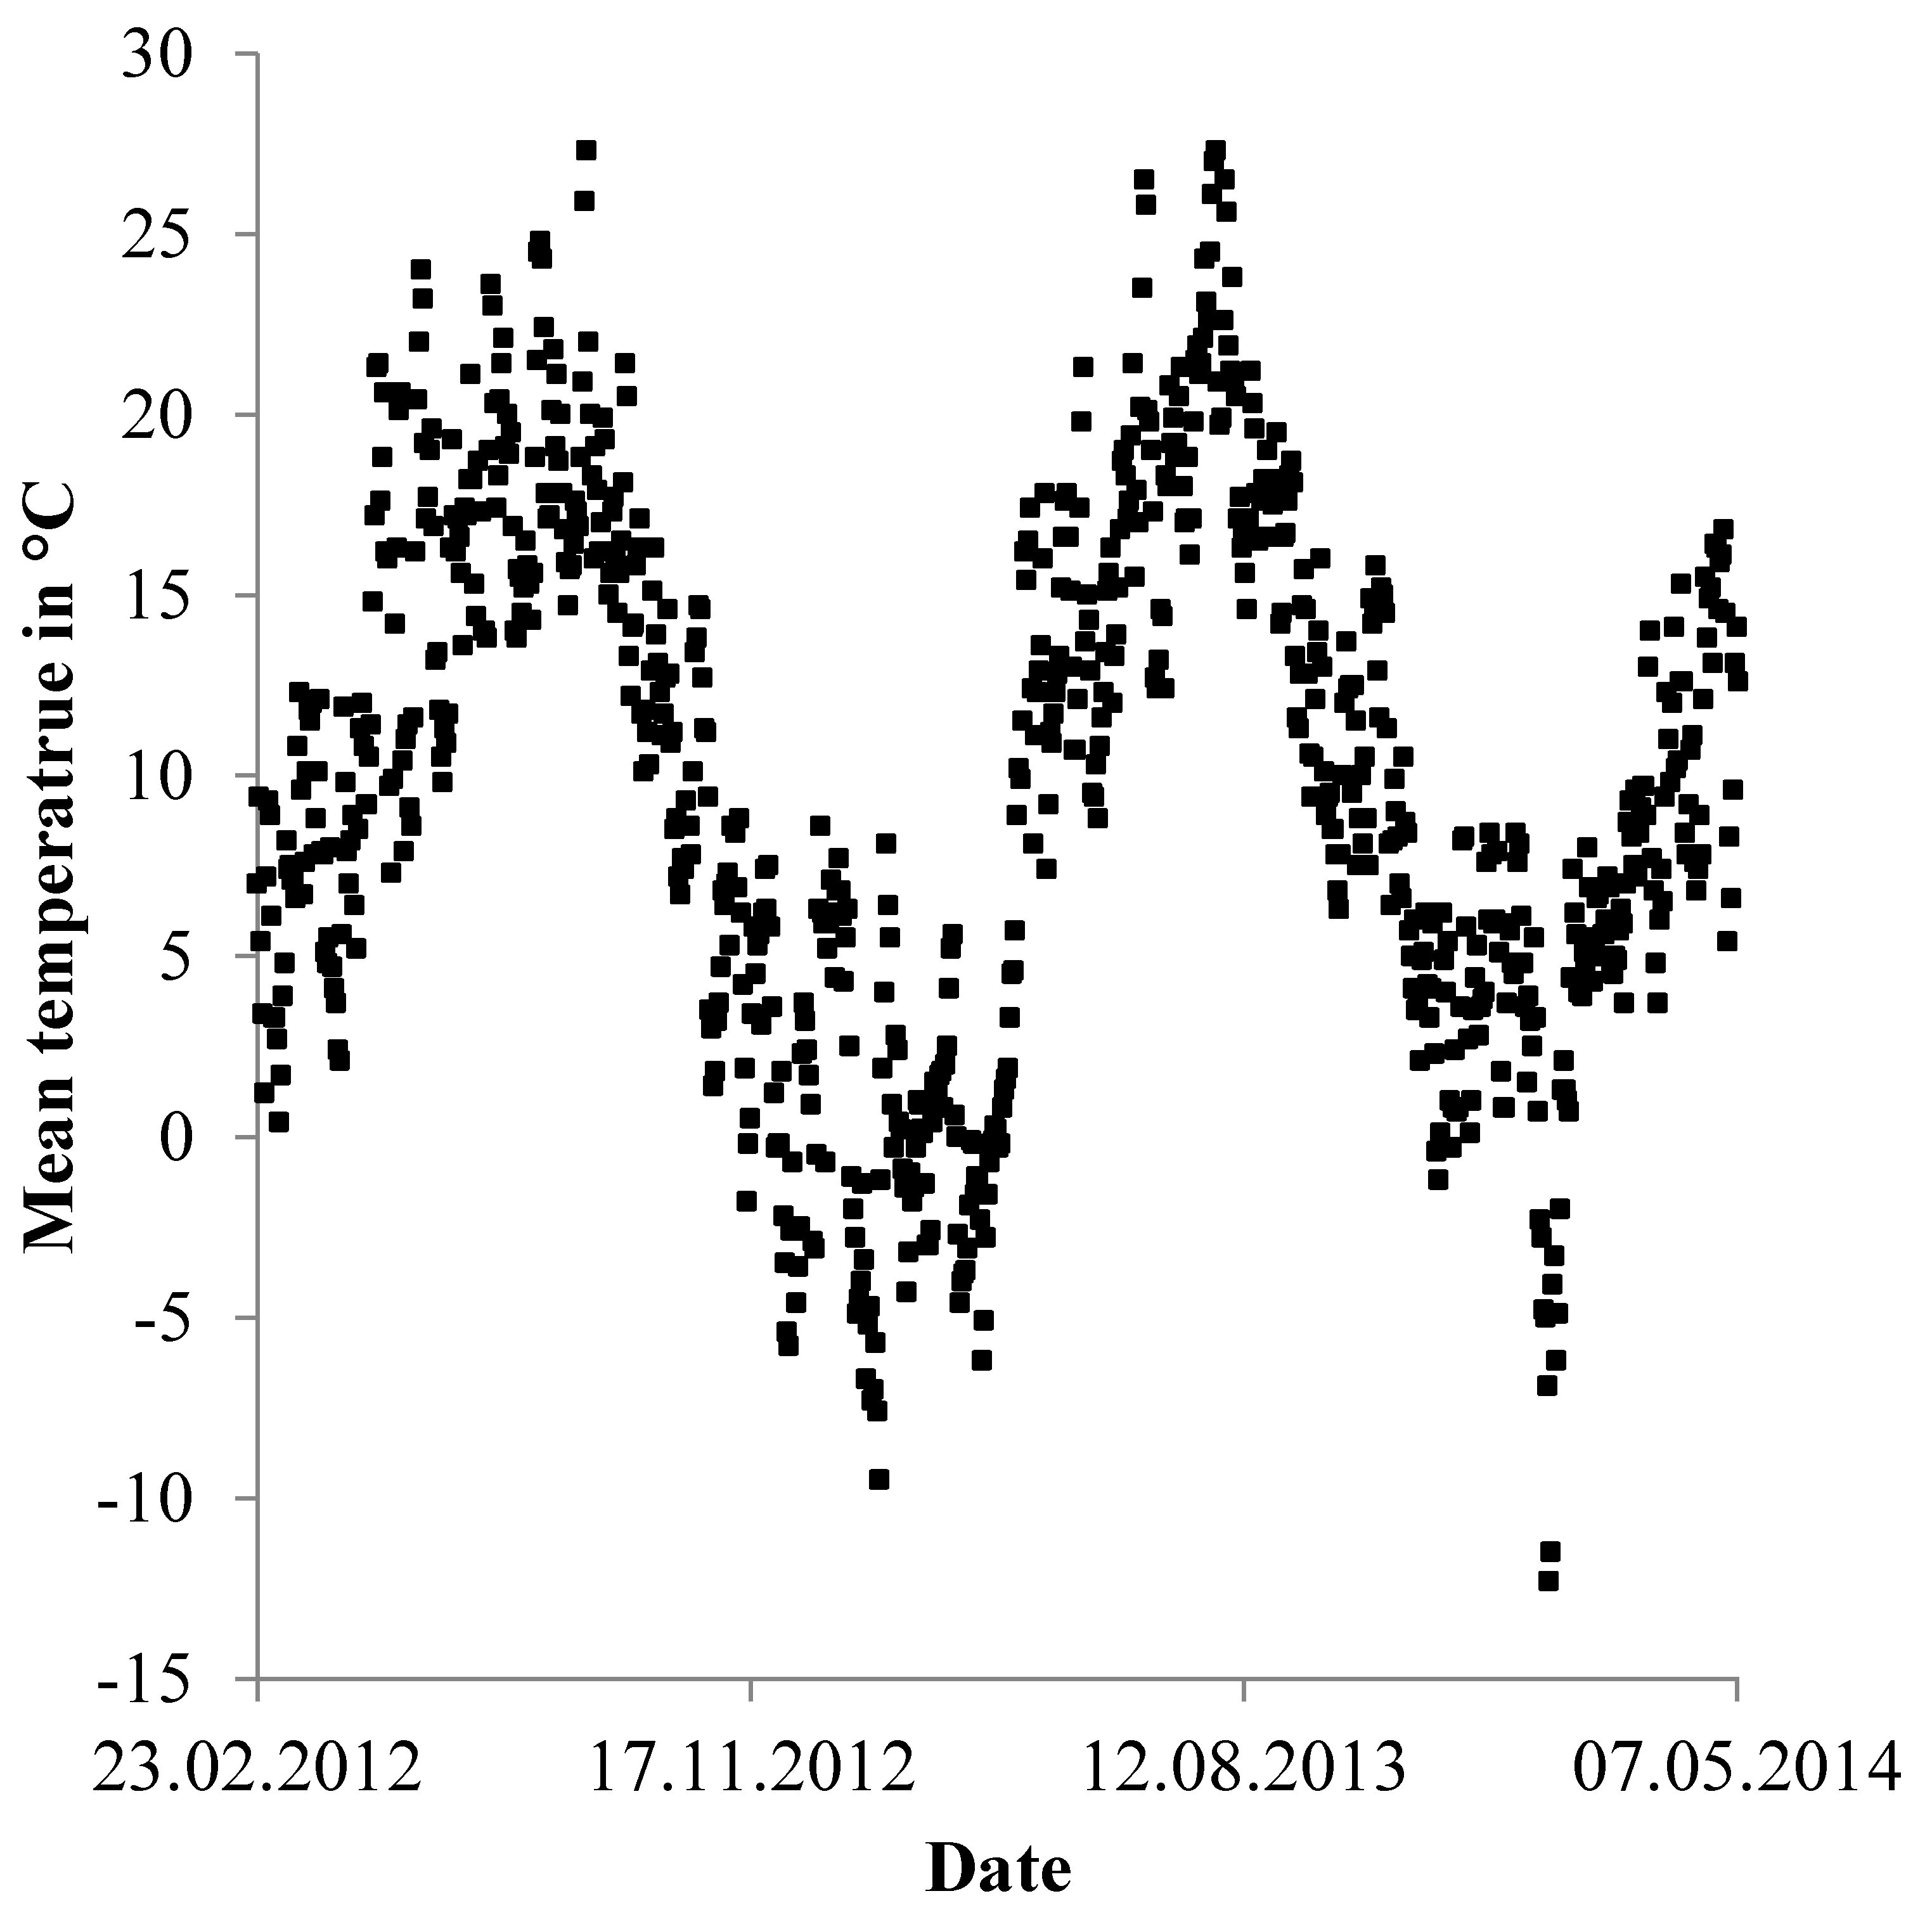
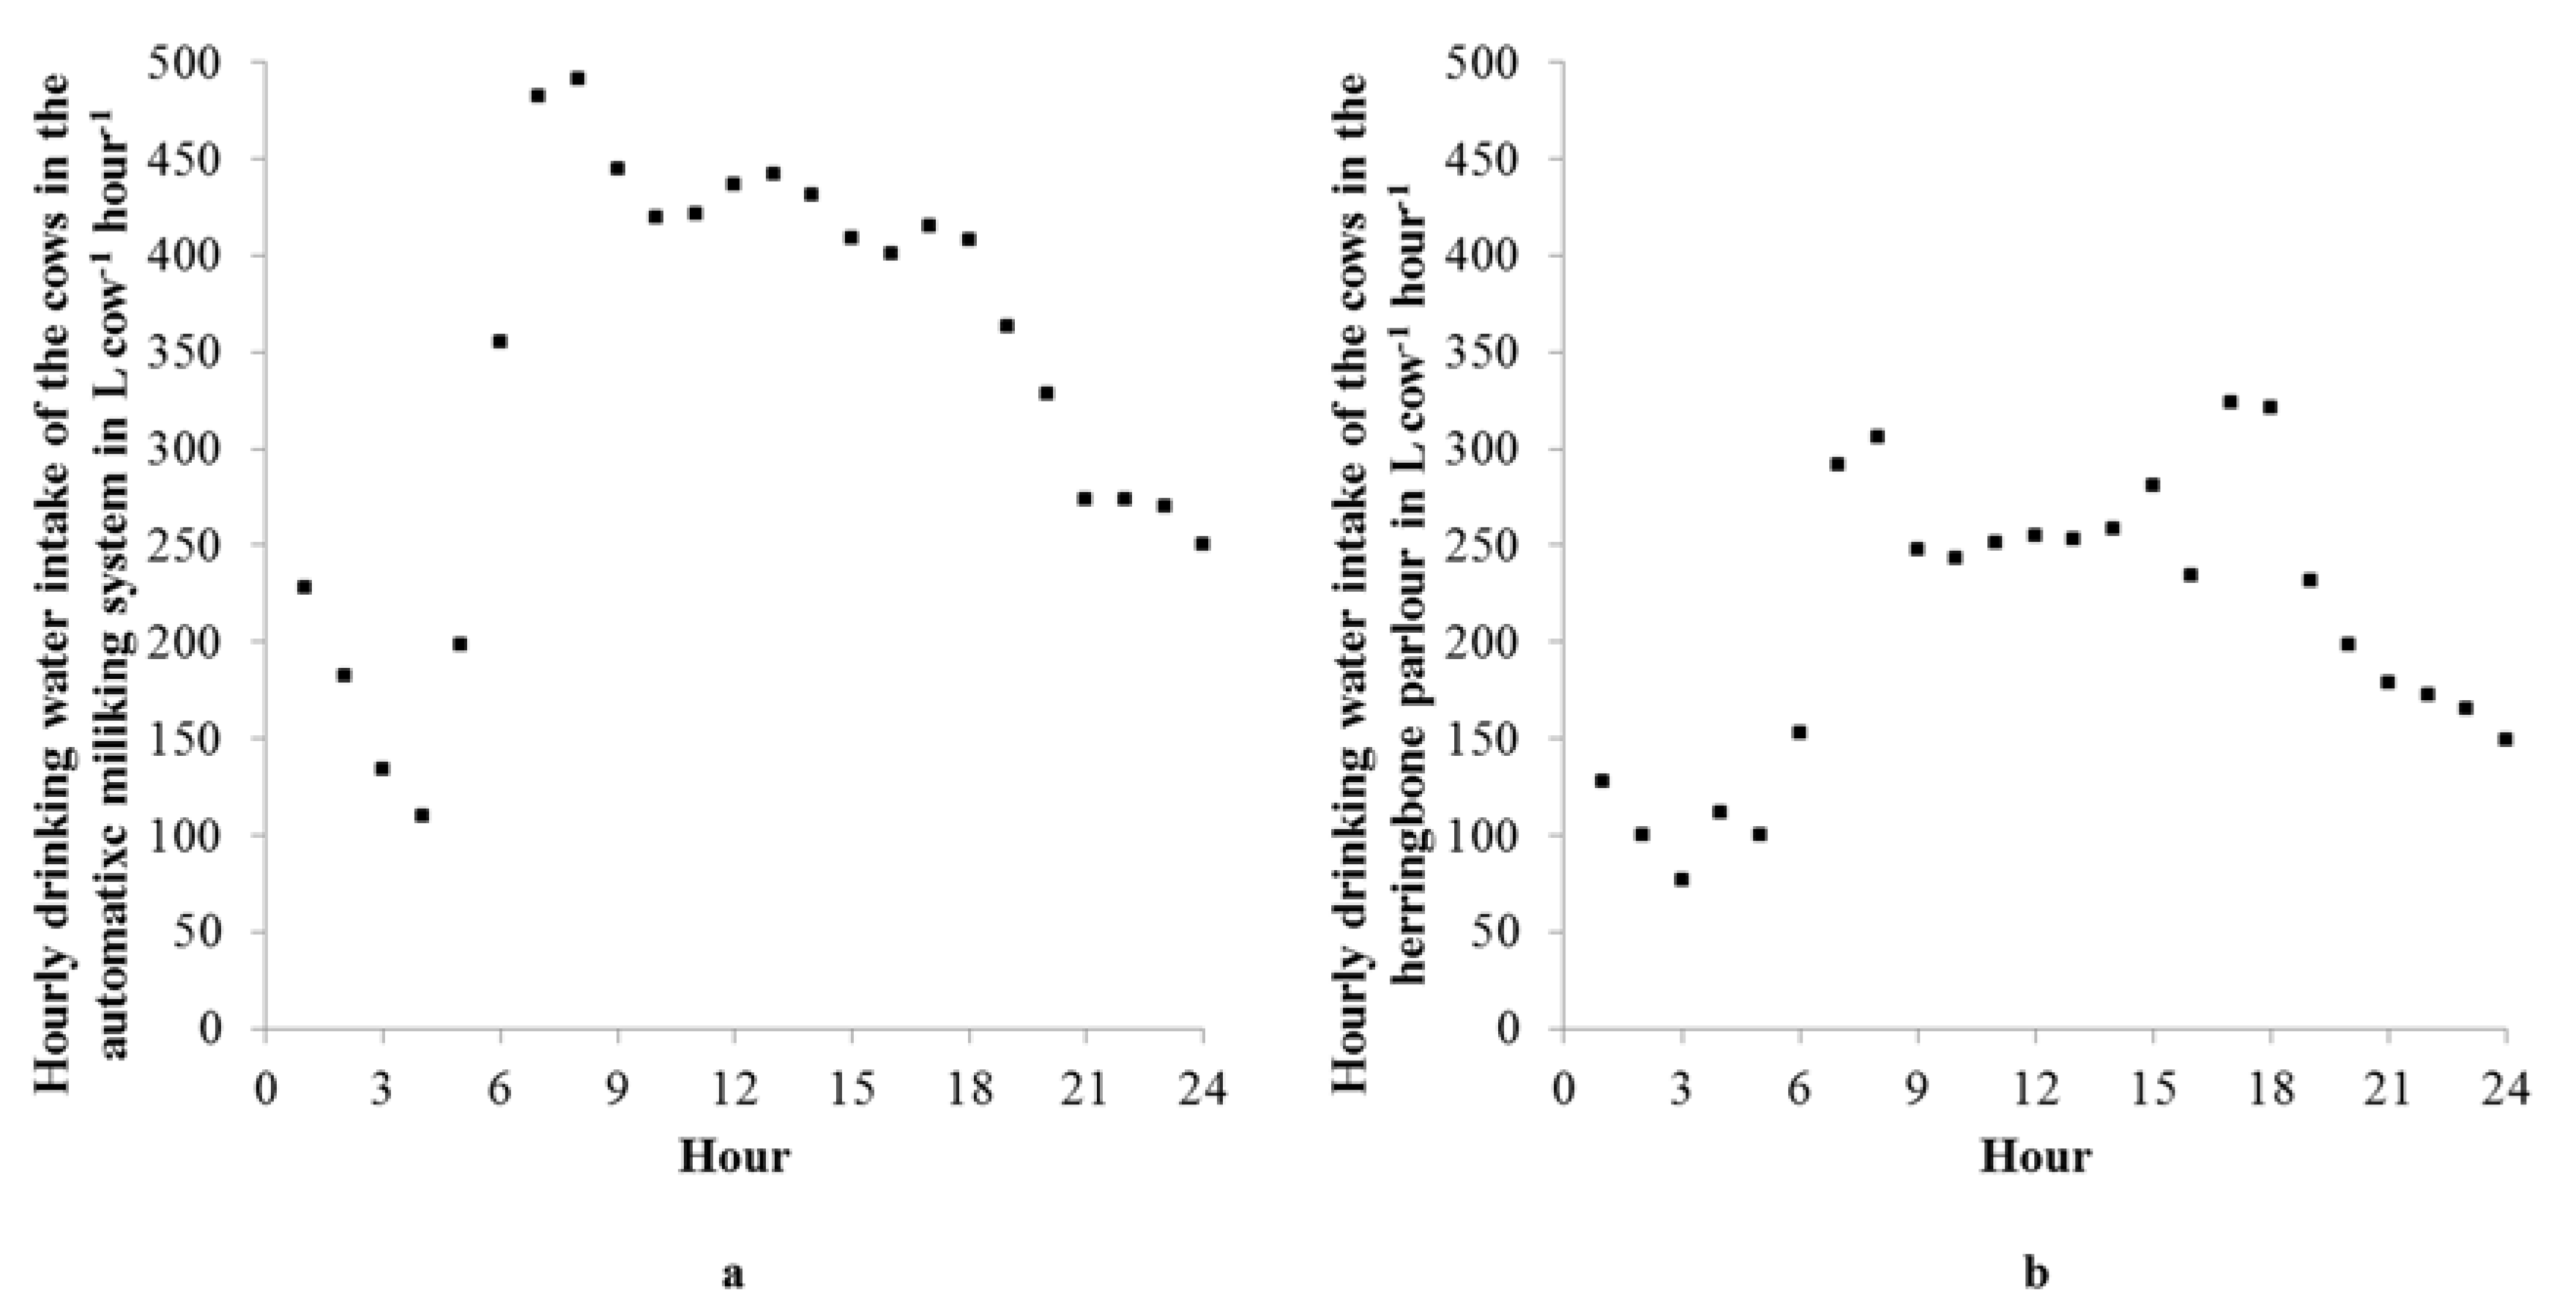
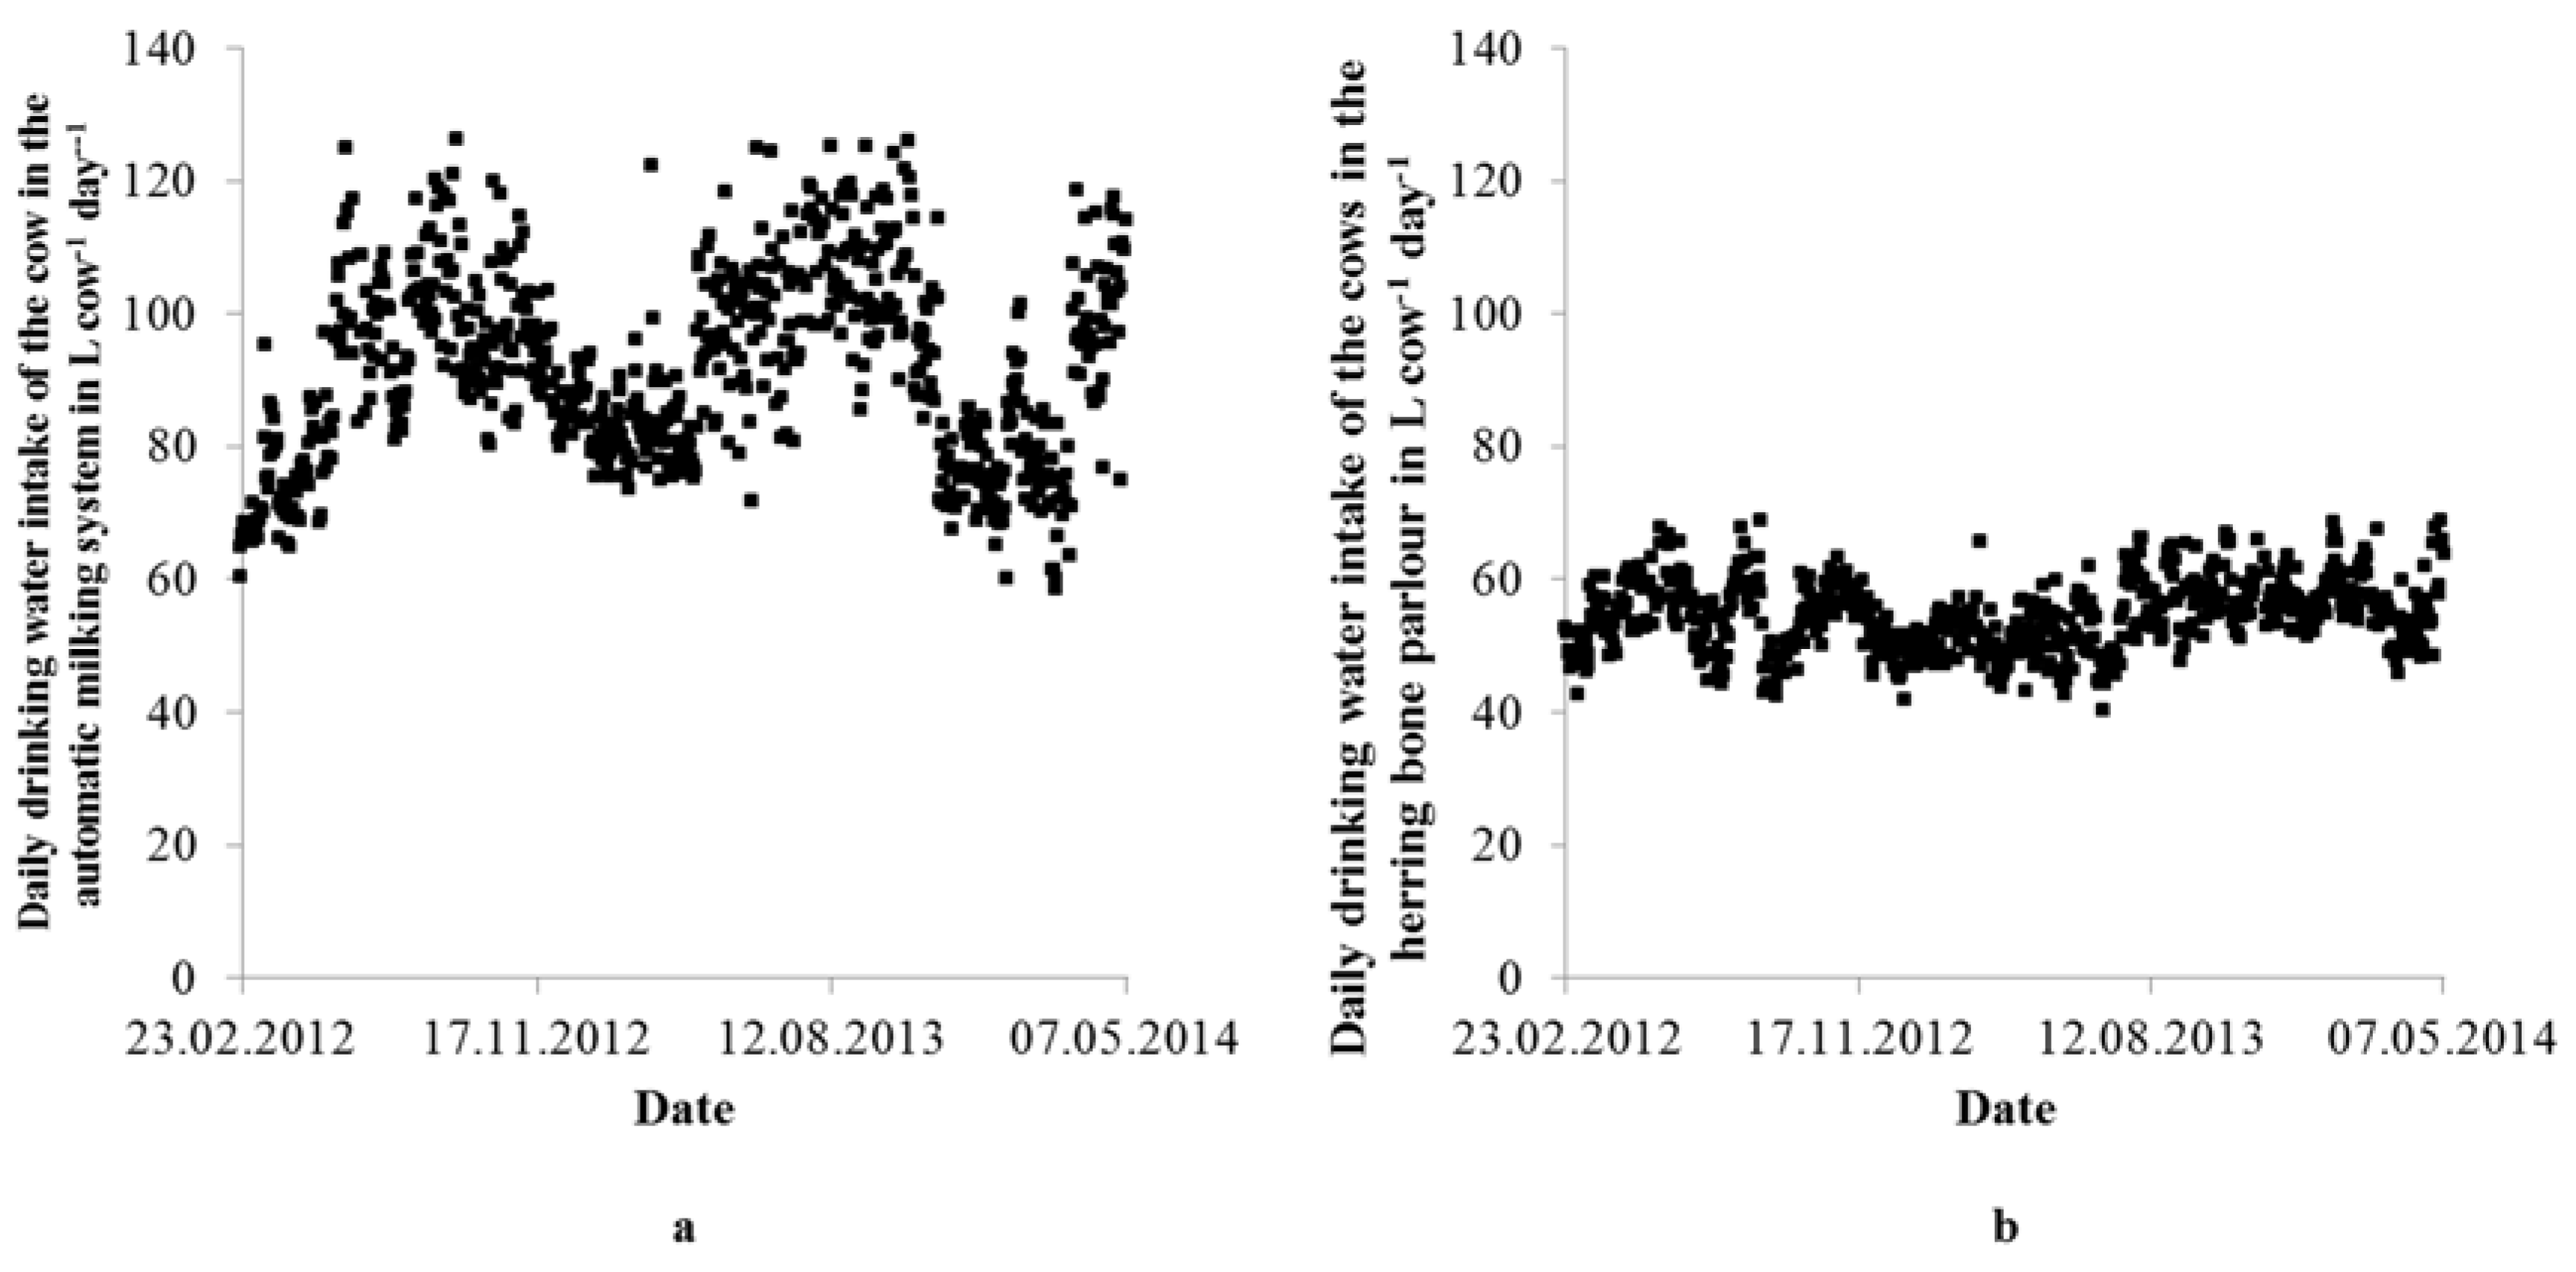
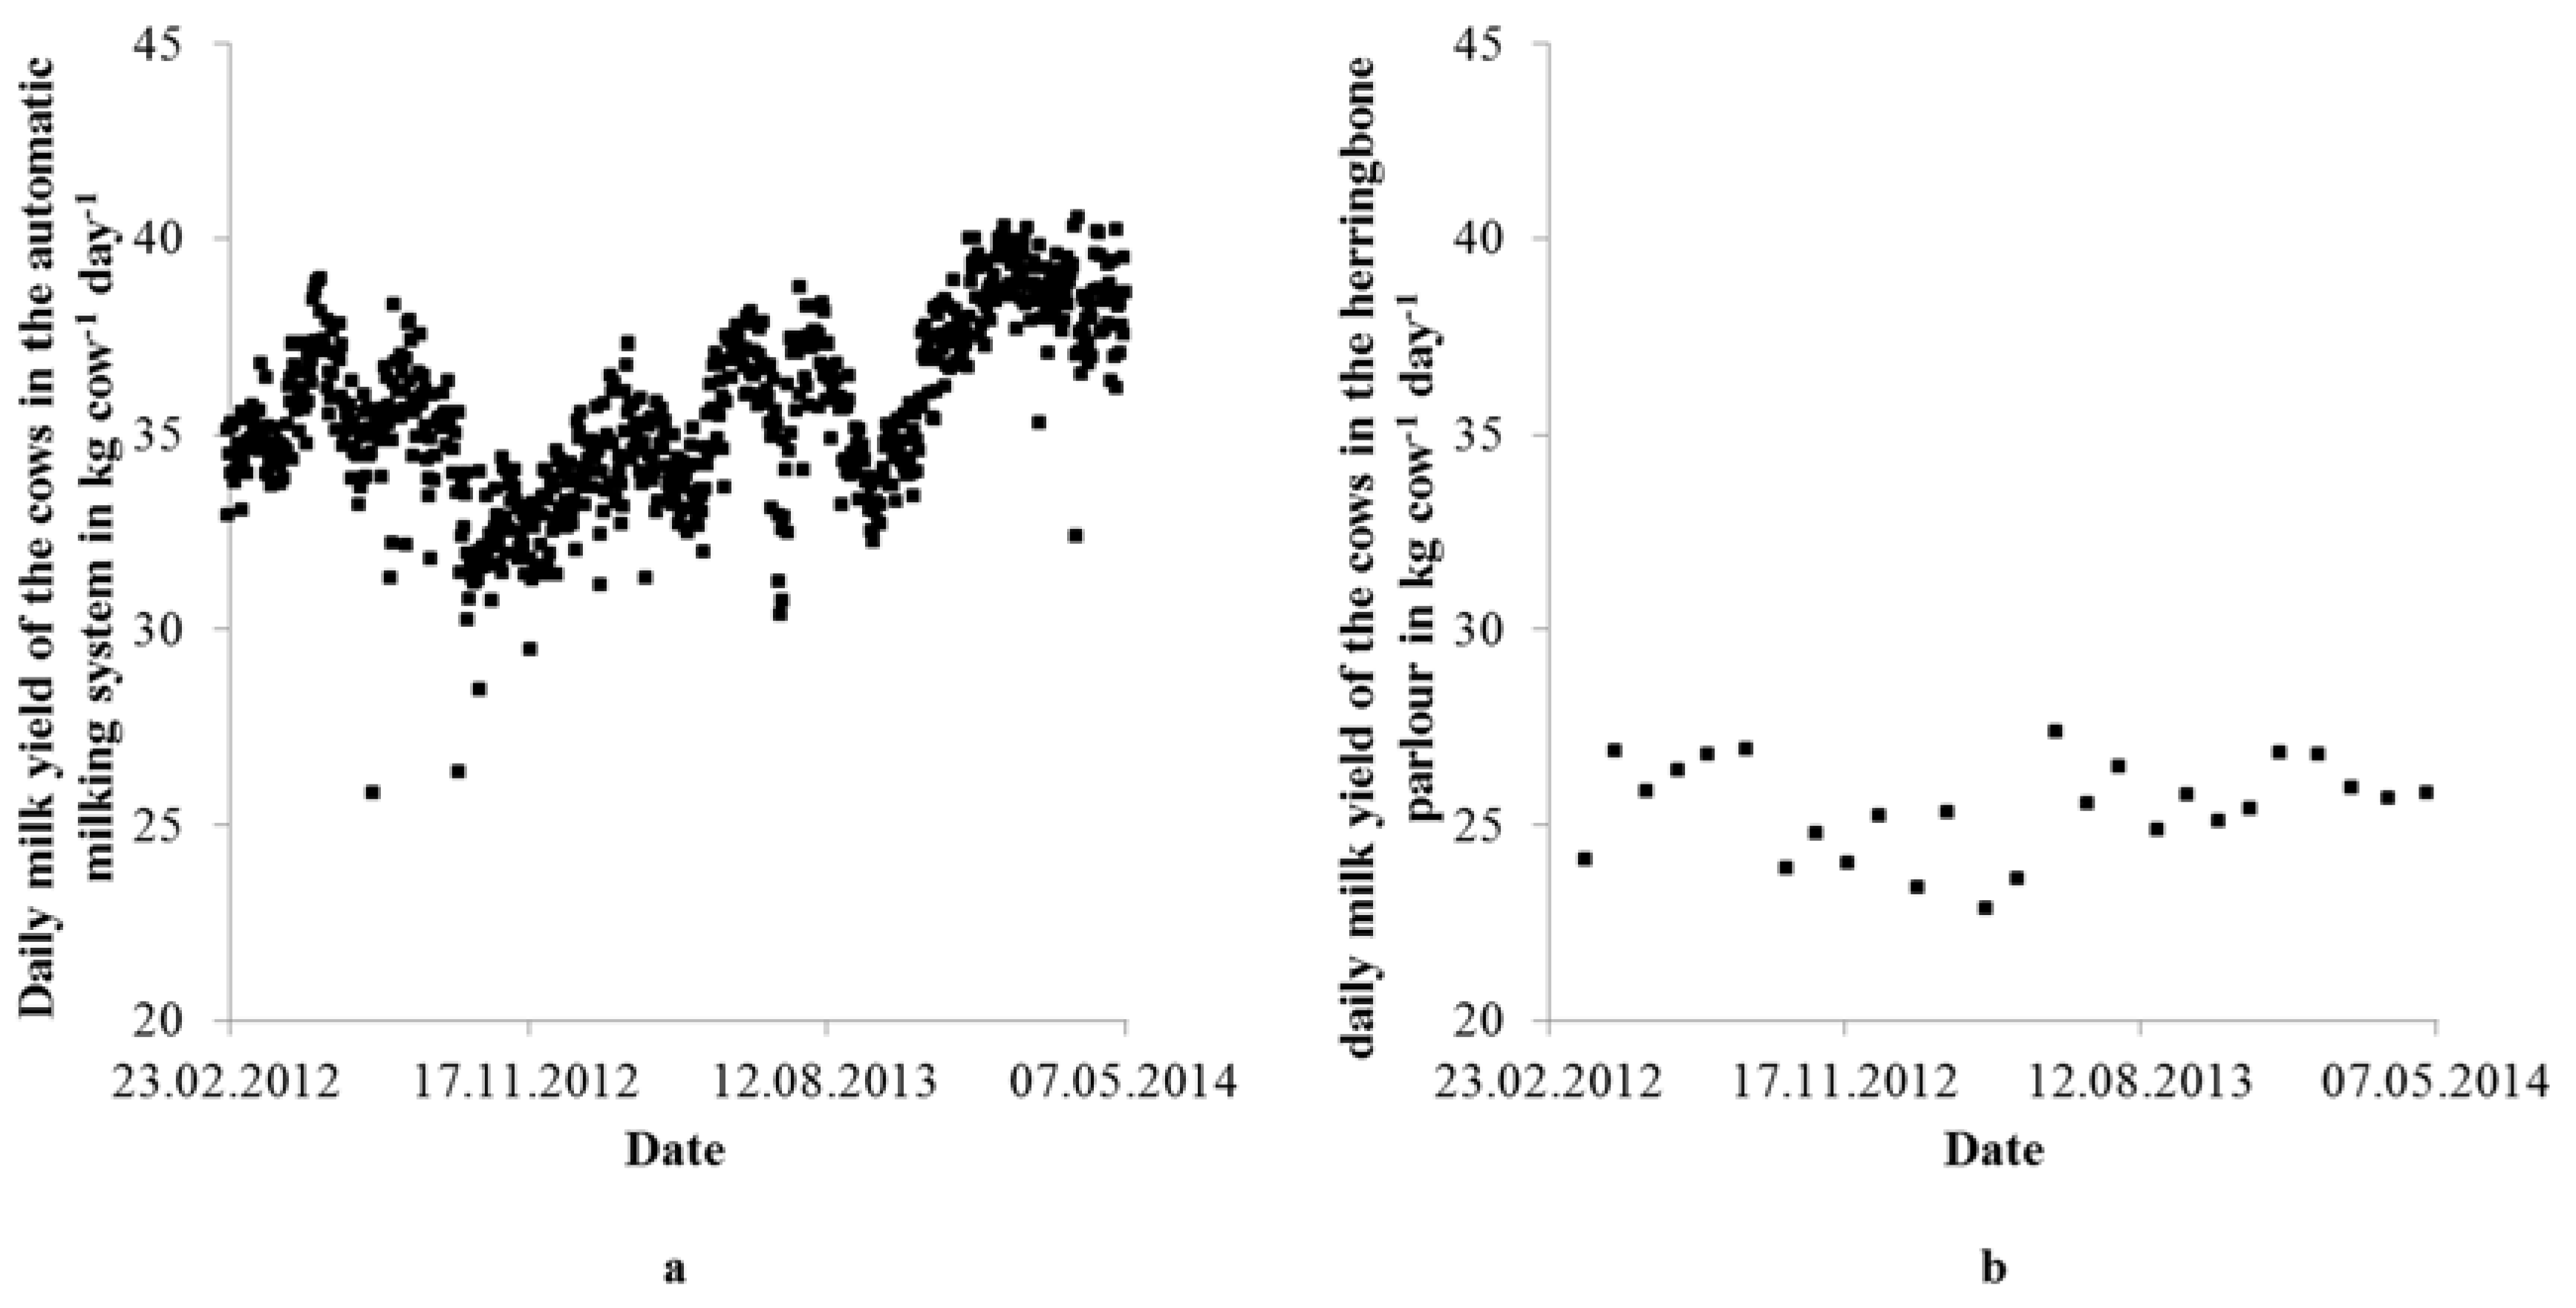
3.1. Drinking Water Demand
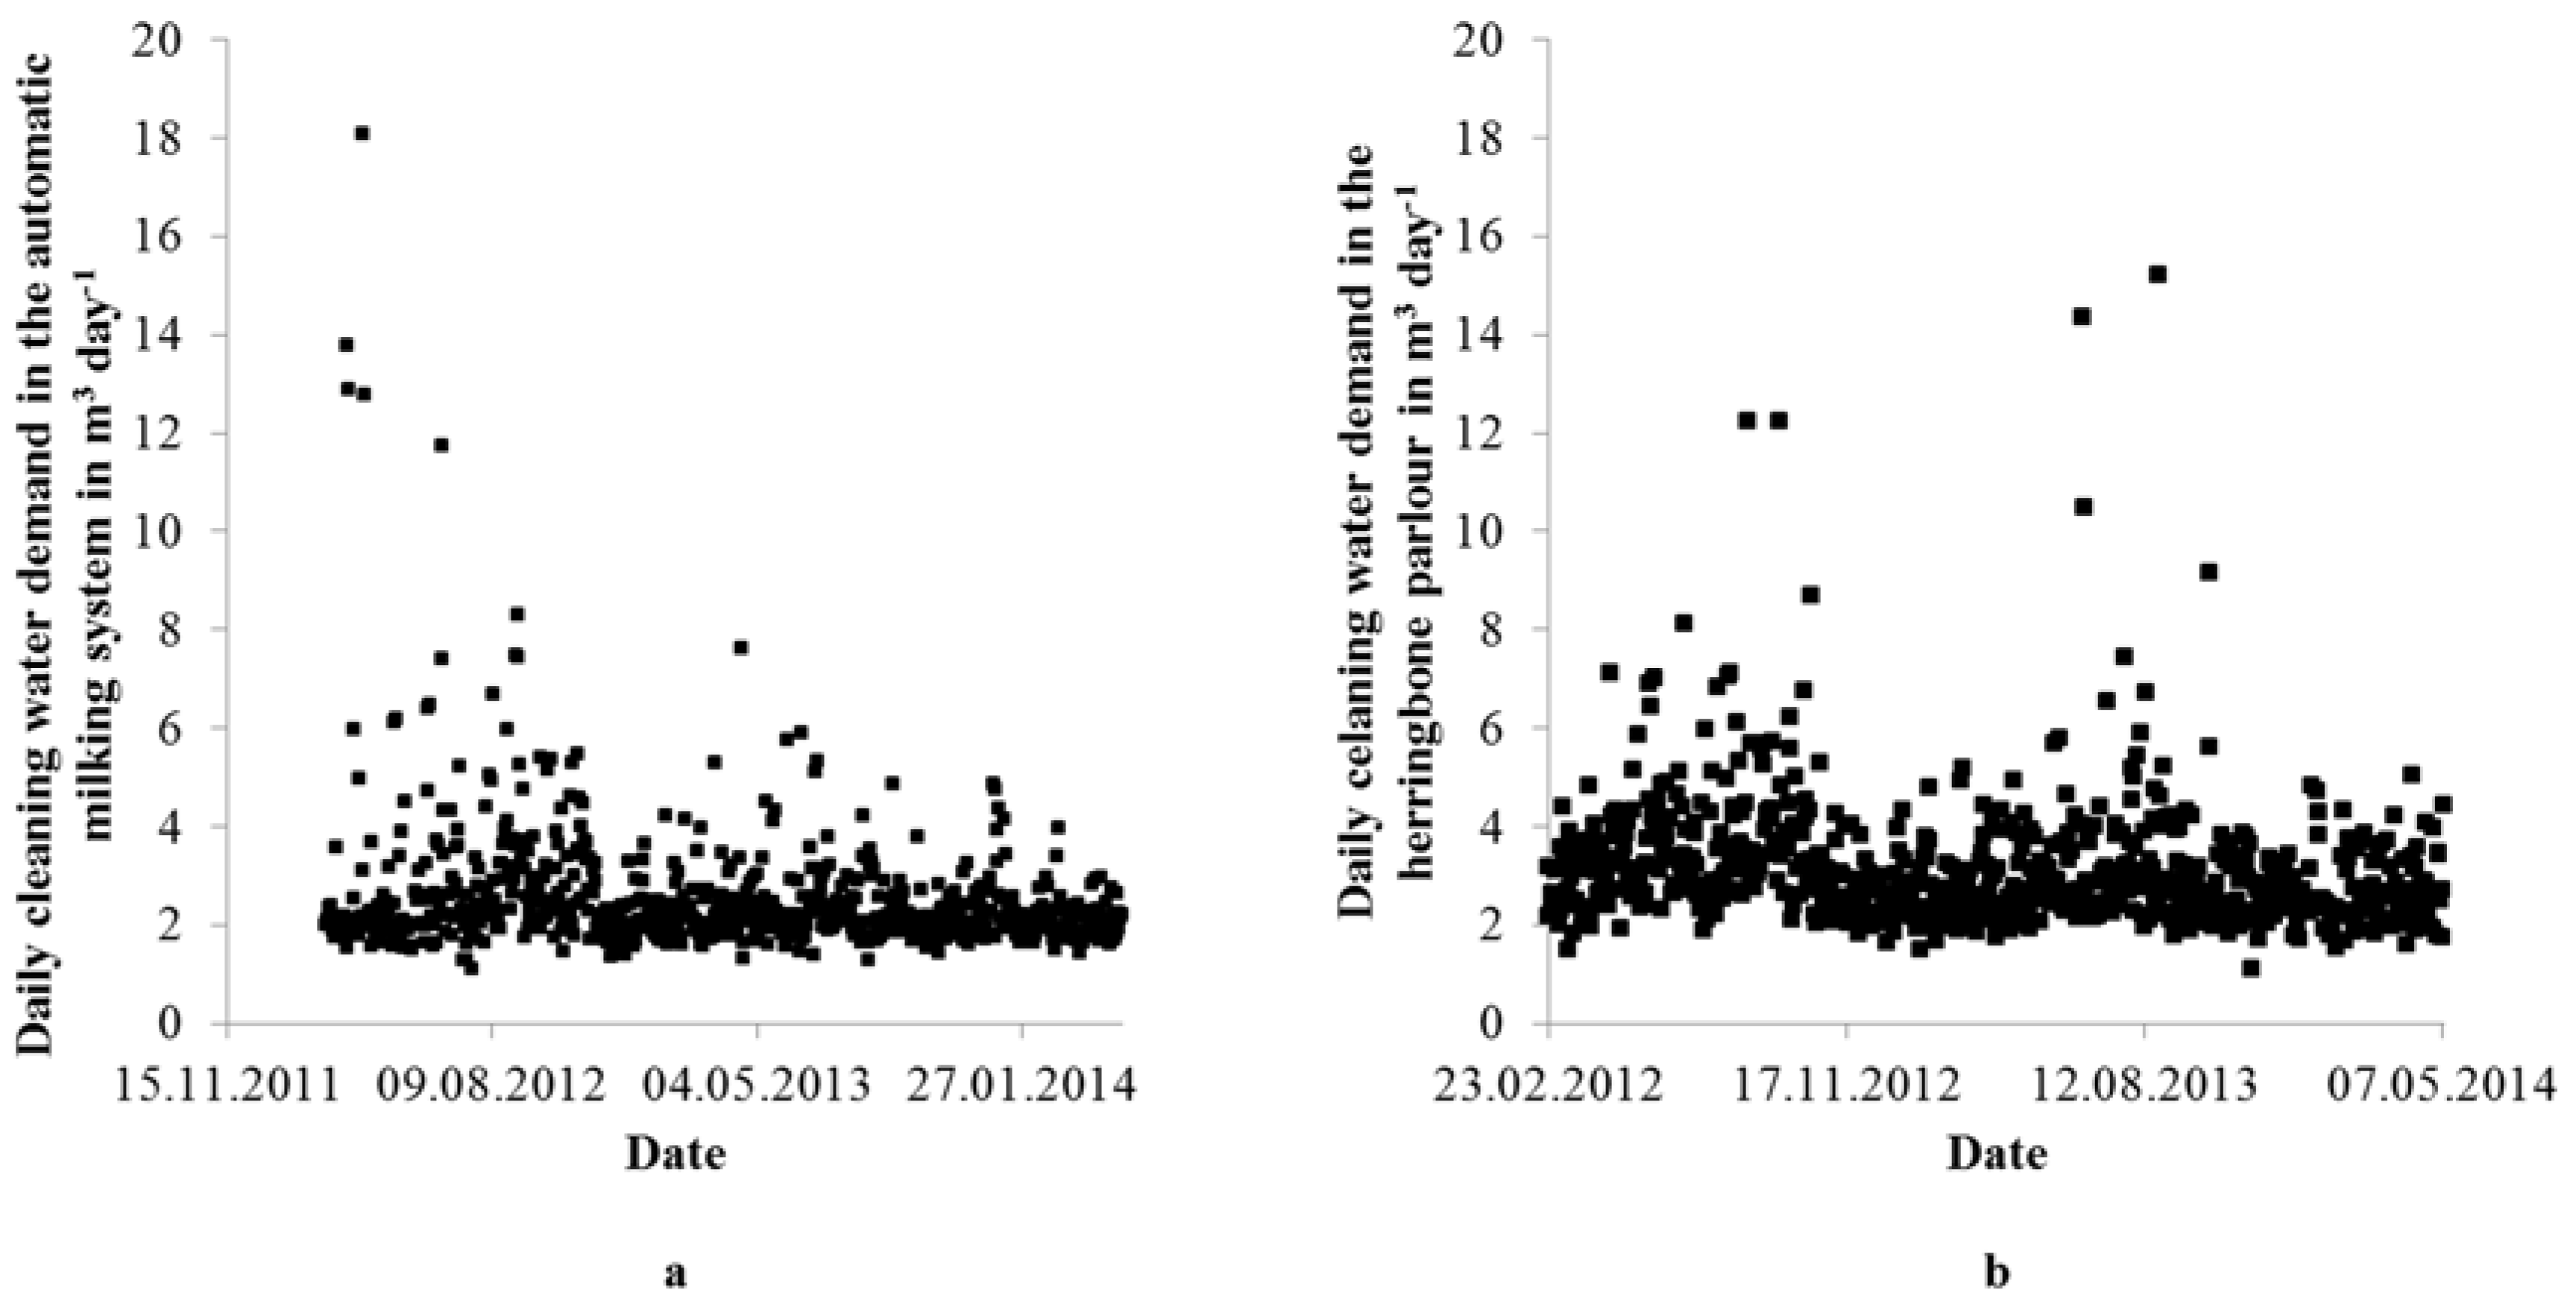
3.2. Cleaning Water Demand
3.3. Relation of Technical Water Demand to Total Water Demand for Milk Production
4. Conclusions
Acknowledgments
Author Contributions
Conflicts of Interest
Abbreviations
| °C | degree Celsius |
| AMS | Automatic Milking System |
| ATB | Leibniz Institute for Agricultural Engineering Potsdam-Bornim |
| DMC | dry matter content |
| DMI | dry matter intake |
| DOY | day of the year |
| FTP | file transfer protocol |
| h | hour |
| ha | hectare |
| HBP | herring bone parlour |
| kg | kilogram |
| KTBL | Kuratorium für Technik und Bauwesen in der Landwirtschaft |
| L | liter |
| Max | maximum |
| Min | minimum |
| m | meter |
| m2 | square meter |
| m3 | cubic meter |
| NSE | Nash-Sutcliffe efficiency |
| NSElog | logarithmic Nash-Sutcliffe efficiency |
| PBIAS | percent BIAS |
| R2 | coefficient of determination |
| RF | rainfall |
| RMSE | root mean square error |
| RSR | ratio of the root mean square error to the standard deviation of measured data |
| SD | standard deviation |
| Tmean | mean ambient temperature |
| Tmin | minimum ambient temperature |
| InNa | sodium intake |
| mb | live weight of the animals |
| Wclean | cleaning water |
| Wdrink-cow | drinking water of the cows |
| Wdrink-cow_daily | daily drinking water of the cows |
| Wirri | irrigation water |
| Wtap | tap water |
| Wtech | technical water |
| Wtech-barn | technical water in the barn |
| Ymilk | milk yield |
References
- Drastig, K.; Prochnow, A.; Kraatz, S.; Klauss, H.; Plöchl, M. Water footprint analysis for the assessment of milk production in Brandenburg (Germany). Adv. Geosci. 2010, 27, 65–70. [Google Scholar] [CrossRef]
- Krauß, M.; Kraatz, S.; Drastig, K.; Prochnow, A. The influence of dairy management strategies on water productivity of milk production. Agric. Water Manag. 2015, 147, 175–186. [Google Scholar] [CrossRef]
- Krauß, M.; Keßler, J.; Prochnow, A.; Kraatz, S.; Drastig, K. Water productivity of poultry production: The influence of different broiler fattening systems. Food Energy Secur. 2015, 4, 76–84. [Google Scholar] [CrossRef]
- Peden, D.; Tadesse, G.; Misra, A.K.; Awad Amed, F.; Astatke, A.; Ayalneh, W. Water and livestock for human development. In Comprehensive Assessment of Water Management in Agriculture; Molden, D., Ed.; Oxford University Press: Oxford, UK, 2007; pp. 485–514. [Google Scholar]
- Singh, B.; Ajeigbe, H.; Tarawali, S.; Fernandez-Rivera, S.; Abubakar, M. Improving the production and utilization of cowpea as food and fodder. Field Crops Res. 2003, 84, 169–177. [Google Scholar] [CrossRef]
- Prochnow, A.; Drastig, K.; Klauss, H.; Berg, W. Water use indicators at farm scale: Methodology and case study. Food Energy Secur. 2012, 1, 29–46. [Google Scholar] [CrossRef]
- Cardot, V.; Le Roux, Y.; Jurjanz, S. Drinking Behavior of Lactating Dairy Cows and Prediction of Their Water Intake. J. Dairy Sci. 2008, 91, 2257–2264. [Google Scholar] [CrossRef] [PubMed]
- Holter, J.B.; Urban, W.E., Jr. Water partitioning and intake prediction in dry and lactating Holstein cows. J. Dairy Sci. 1992, 75, 1472–1479. [Google Scholar] [CrossRef]
- Meyer, U.; Everinghoff, M.; Gädeken, D.; Flachowsky, G. Investigations on the water intake of lactating dairy cows. Livest. Prod. Sci. 2004, 90, 117–121. [Google Scholar] [CrossRef]
- Murphy, M.R.; Davis, C.L.; McCoy, G.C. Factors affecting water consumption by Holstein cows in early lactation. J. Dairy Sci. 1983, 66, 35–38. [Google Scholar] [CrossRef]
- Palhares, J.C.P.; Pezzopane, J.R.M. Water footprint accounting and scarcity indicators of conventional and organic dairy production systems. J. Clean. Prod. 2015, 93, 299–307. [Google Scholar] [CrossRef]
- Jensen, M.L. Power and Water Consumption—With AMS; FarmTest Cattle: Aarhus, Denmark, 2009. [Google Scholar]
- Kuratorium für Technik und Bauwesen in der Landwirtschaft (KTBL). Wasserversorgung in der Rinderhaltung–Wasserbedarf–Technik–Management (Water Supply in Cattle Farming–Water Demand–Technology–Management); KTBL: Darmstadt, Germany, 2008. [Google Scholar]
- Rasmussen, J.B.; Petersen, J. Electricity and Water Consumption at Milking; FarmTest Cattle: Aarhus, Denmark, 2004. [Google Scholar]
- Schuiling, H.J.; Verstappen-Boerekamp, J.A.M.; Knappstein, K.; Benfalk, C. Optimal Cleaning of Equipment for Automatic Milking: Investigation of Systems, Procedures and Demands; Deliverable D16: Wageningen, The Netherlands, 2001. [Google Scholar]
- Steward, G.; Rout, R. Reasonable Stock Water Requirements Guidelines for Resource Consent Applications; Horizons Regional Council: Palmerston North, New Zealand, 2007. [Google Scholar]
- Williams, J. Dairy Shed Water. How much Water Do You Use? State of Victoria, Department for Primary Industries: Ellinbank, Australia, 2009.
- Drastig, K.; Kraatz, S.; Libra, J.; Prochnow, A.; Hunstock, U. Implementation of hydrological processes and agricultural management options into the ATB-Modeling Database to improve the water productivity at farm scale. Agron. Res. 2013, 11, 31–38. [Google Scholar]
- Maidment, D.R. Handbook of Hydrology; McGraw-Hill: Columbus, OH, USA, 1993. [Google Scholar]
- Moriasi, D.N.; Arnold, J.G.; Van Liew, M.W.; Bingner, R.L.; Harmel, R.D.; Veith, T.L. Model evaluation guidelines for systematic quantification of accuracy in watershed simulations. Trans. ASABE 2007, 50, 885–900. [Google Scholar] [CrossRef]
- Ellis, J.L.; Kebreab, E.; Odongo, N.E.; McBride, B.W.; Okine, E.K.; France, J. Prediction of methane production from dairy and beef cattle. J. Dairy Sci. 2007, 90, 3456–3466. [Google Scholar] [CrossRef] [PubMed]
- Tedeschi, L.O. Assessment of the adequacy of mathematical models. Agric. Syst. 2006, 89, 225–247. [Google Scholar] [CrossRef]
- Willmott, C.J. On the validation of models. Phys. Geogr. 1981, 2, 184–194. [Google Scholar]
- Santhi, C.; Arnold, J.G.; Williams, J.R.; Dugas, W.A.; Srinivasan, R.; Hauck, L.M. Validation of the swat model on a large river basin with point and nonpoint sources. J. Am. Water Resour. Assoc. 2001, 37, 1169–1188. [Google Scholar] [CrossRef]
- Van Liew, M.W.; Arnold, J.G.; Garbrecht, J.D. Hydrologic simulation on agricultural watersheds: Choosing between two models. Trans. ASAE 2003, 46, 1539–1551. [Google Scholar] [CrossRef]
- Khelil-Arfa, H.; Boudon, A.; Maxin, G.; Faverdin, P. Prediction of water intake and excretion flows in Holstein dairy cows under thermoneutral conditions. Animal 2012, 6, 1662–1676. [Google Scholar] [CrossRef] [PubMed]
- Chapagain, A.K.; Hoekstra, A.Y. Virtual water flows between nations in relation to trade in livestock and livestock products. In Value of Water Research Report Series No. 13 UNESCO-IHE; Institute for Water Education: Delft, The Netherlands, 2003. [Google Scholar]
- Eide, M.H. Life cycle assessment (LCA) of industrial milk production. Int. J. Life Cycle Assess. 2002, 7, 115–126. [Google Scholar] [CrossRef]
- Döring, K.; Kraatz, S.; Prochnow, A.; Drastig, K. Indirect water demand of dairy farm buildings. Agric. Eng. Int. CIGR J. 2013, 15, 16–22. [Google Scholar]
- De Boer, I.J.M.; Hoving, I.E.; Vellinga, T.V.; Van de Ven, G.W.J.; Leffelaar, P.A.; Gerber, P.J. Assessing environmental impacts associated with freshwater consumption along the life cycle of animal products: The case of Dutch milk production in Noord-Brabant. Int. J. Life Cycle Assess. 2012, 18, 193–203. [Google Scholar] [CrossRef]
- Sultana, M.N.; Uddin, M.M.; Ridoutt, B.; Hemme, T.; Peters, K. Benchmarking consumptive water use of bovine milk production systems for 60 geographical regions: An implication for Global Food Security. Glob. Food Secur. 2015, 4, 56–68. [Google Scholar] [CrossRef]
- Mekonnen, M.M.; Hoekstra, A.Y. A global assessment of the water footprint of farm animal products. Ecosystems 2012, 15, 401–415. [Google Scholar] [CrossRef]
- Zonderland-Thomassen, M.A.; Ledgard, S.F. Water footprinting—A comparison of methods using New Zealand dairy farming as a case study. Agric. Syst. 2012, 110, 30–40. [Google Scholar] [CrossRef]
- Singh, O.P.; Kishore, A. Water productivity of milk production in North Gujarat, Western India. In Proceedings of the 2nd Asia Pacific Association of Hydrology and Water Resources (APHW) Conference, Singapore, 5–8 July 2004; pp. 442–449.
- Brown, S.; Schreier, H.; Lavkulich, L.M. Incorporating virtual water into water management: A British Columbia example. Water Resour. Manag. 2009, 23, 2681–2696. [Google Scholar] [CrossRef]
- Atzori, A.S.; Canalis, C.; Francesconi, A.H.D.; Pulina, G. A preliminary study on a new approach to estimate of water resource allocation: The net water footprint applied to animal products. Agric. Agric. Sci. Procedia 2016, 1, 50–57. [Google Scholar] [CrossRef]


| Measured or Estimated Value | Mean | SD 1 | Min 2 | Max 3 |
|---|---|---|---|---|
| Automatic milking system | ||||
| Number of cows | 87.9 | 4.0 | 78.0 | 101.0 |
| Milk yield (kg·cow−1·day−1) | 35.5 | 9.6 | 0.0 | 83.9 |
| Daily drinking water intake (L·cow−1·day−1) | ||||
| own measurements | 91.1 | 14.3 | 58.5 | 126.2 |
| calculated according to Cardot et al. [7] | 95.7 4 | 4.9 | 82.2 | 108.4 |
| calculated according to Holter and Urban [8] | 76.3 4 | 2.8 | 68.5 | 81.1 |
| calculated according to Meyer et al. [9] | 84.2 4 | 12.9 | 51.9 | 114.2 |
| calculated according to Murphy et al. [10] | 92.8 | 8.1 | 69.2 | 113.2 |
| Herringbone milking parlour (HBP) | ||||
| Number of cows | 91.8 | 6.2 | 73.0 | 101.0 |
| Milk yield (kg·cow−1·day−1) | 25.4 | 7.5 | 2.9 | 65.3 |
| Daily drinking water intake (L·cow−1·day−1) | ||||
| own measurements | 54.4 | 5.3 | 40.2 | 121.7 |
| calculated according to Cardot et al. [7] | 69.2 4 | 4.6 | 55.6 | 81.0 |
| calculated according to Holter and Urban [8] | 53.0 4 | 2.7 | 46.5 | 56.9 |
| calculated according to Meyer et al. [9] | 68.9 4 | 12.1 | 36.7 | 97.9 |
| calculated according to Murphy et al. [10] | 74.4 4 | 8.4 | 49.2 | 95.2 |
| Model Evaluation Statistics | Estimated Value | Cardot et al. [7] | Holter and Urban [8] | Meyer et al. [9] | Murphy et al. [10] | This Study |
|---|---|---|---|---|---|---|
| Standard regression | Slope | 1.30 | 1.54 | 0.94 | 1.33 | 0.97 |
| y-intercept | −34.36 | −26.66 | 0.96 | −38.10 | 1.09 | |
| Pearson’s correlation coefficient (R) | 0.86 | 0.87 | 0.63 | 0.77 | 0.82 | |
| Coefficient of determination (R2) | 0.74 | 0.75 | 0.39 | 0.59 | 0.67 | |
| Dimensionless | Nash-Sutcliffe efficiency (NSE) | −0.15 | −0.53 | −0.44 | −1.11 | 0.51 |
| Logarithmic transformed NSE (NSElog) | −0.60 | 0.12 | −0.56 | −1.98 | 0.59 | |
| Error index | Root mean square error (RMSE) | 15.12 | 14.79 | 17.06 | 17.89 | 12.18 |
| RMSE-observations standard deviation ratio (RSR) | 0.80 | 0.70 | 0.84 | 0.71 | 0.57 | |
| BIAS | 9.74 | −8.05 | 3.89 | 10.92 | −0.01 | |
| Percent bias (PBIAS) | 13.4 | −11.1 | 5.4 | 15 | −0.01 |
| Water Demand | Unit | Mean | Standard Deviation | Min | Max |
|---|---|---|---|---|---|
| Automatic milking system (AMS) | |||||
| Cleaning water demand | |||||
| per day | m3·day−1 | 2.5 | 1.3 | 1.1 | 18.1 |
| per cow and day | L·cow−1·day−1 | 28.6 | 14.8 | 11.8 | 207.9 |
| per kg milk | L·kg·milk−1 | 0.8 | 0.4 | 0.4 | 6.1 |
| Herringbone milking parlour (HBP) | |||||
| Cleaning water demand | |||||
| Total | m3·day−1 | 3.1 | 1.3 | 1.1 | 15.2 |
| of the milk tank | m3·day−1 | 0.1 | 0.1 | 0 | 0.5 |
| of the milking equipment | m3·day−1 | 0.7 | 0.3 | 0.3 | 6.9 |
| for udder cleaning | m3·day−1 | 0.3 | 0.1 | 0.1 | 2.2 |
| for surface cleaning | m3·day−1 | 2.0 | 1.1 | 0.9 | 9.3 |
| per cow and day | L·cow−1·day−1 | 33.8 | 14.1 | 12.5 | 170.8 |
| per kg milk | L·kg·milk−1 | 1.3 | 0.5 | 0.5 | 6.5 |
| Reference | Approach | Fractions of Water Use | Total Water Demand in L·kg−1·milk | Share of Drinking Water | Share of Cleaning Water | Share of Technical Water |
|---|---|---|---|---|---|---|
| of Total Water Demand in % | ||||||
| de Boer et al. [30] | Life cycle assessment | evaporation of transport of feed or electricity production, evapotranspiration of feed cultivation, unused irrigation water, water embodied in crop or animal products, tap water for industrial or agricultural processes | 66 | - | - | 8.0 |
| Sultana et al. [31] | Consumptive water use | water consumption from feed and other inputs, e.g., drinking, servicing, manufacturing inputs and capital goods | 1833 | 1.0 | 4.0 | 5.5 |
| Chapagain and Hoestra [27] | Water footprint | evapotranspiration for plant growth, ground/surface water consumed, drinking and service water | 735 | 0.6 | 0.2 | 0.8 |
| Mekonnen and Hoekstra [32] | Water footprint | evapotranspiration for plant growth, ground/surface water consumed, drinking and service water, freshwater required to dilute the load of pollutants to ambient water quality standards | 1020 | 1.1 | 0.8 | 2.0 |
| Zonderland- Thomassen and Ledgard [33] | Water footprint | evapotranspiration for plant growth, ground/surface water consumed, freshwater required to dilute the load of pollutants to ambient water quality standards | 1015 | 1.0 | 1.0 | 2.0 |
| Peden et al. [4] | Livestock water productivity | transpiration, evaporation, downstream discharge, degradation and contamination of water | 1269 | <2.0 | - | - |
| Singh and Kishore [34] | Water productivity | irrigation water use for crop production, drinking water | 2040 | 1.2 | - | - |
| Brown et al. [35] | Virtual water | rain water, irrigation water, the water requirements of feed, drinking and service water for animals, water required for processing | - | 0.4 | 0.006 | - |
| Atzori et al. [36] | Net water footprint index | evapotranspiration including rain water, soil water, and irrigation water, drinking water, service water | 26–408 | - | - | 2–40 |
© 2016 by the authors; licensee MDPI, Basel, Switzerland. This article is an open access article distributed under the terms and conditions of the Creative Commons Attribution (CC-BY) license (http://creativecommons.org/licenses/by/4.0/).
Share and Cite
Krauß, M.; Drastig, K.; Prochnow, A.; Rose-Meierhöfer, S.; Kraatz, S. Drinking and Cleaning Water Use in a Dairy Cow Barn. Water 2016, 8, 302. https://doi.org/10.3390/w8070302
Krauß M, Drastig K, Prochnow A, Rose-Meierhöfer S, Kraatz S. Drinking and Cleaning Water Use in a Dairy Cow Barn. Water. 2016; 8(7):302. https://doi.org/10.3390/w8070302
Chicago/Turabian StyleKrauß, Michael, Katrin Drastig, Annette Prochnow, Sandra Rose-Meierhöfer, and Simone Kraatz. 2016. "Drinking and Cleaning Water Use in a Dairy Cow Barn" Water 8, no. 7: 302. https://doi.org/10.3390/w8070302
APA StyleKrauß, M., Drastig, K., Prochnow, A., Rose-Meierhöfer, S., & Kraatz, S. (2016). Drinking and Cleaning Water Use in a Dairy Cow Barn. Water, 8(7), 302. https://doi.org/10.3390/w8070302