Article

European Water Footprint Scenarios for 2050

by
A. Ertug Ercin
1 and
Arjen Y. Hoekstra
2,*
1
Water Footprint Network, International Water House, Bezuidenhoutseweg 2, 2594 AV The Hague, The Netherlands
2
Twente Water Centre, University of Twente, P.O. Box 217, 7500 AE Enschede, The Netherlands
*
Author to whom correspondence should be addressed.
Water 2016, 8(6), 226; https://doi.org/10.3390/w8060226
Submission received: 2 February 2016 / Revised: 29 April 2016 / Accepted: 24 May 2016 / Published: 27 May 2016
(This article belongs to the Special Issue Water Footprint Assessment)

Abstract

:
This study develops water footprint scenarios for Europe for 2050, at the country level, based on projections regarding population and economic growth, production and trade patterns, consumption patterns (diets and bioenergy use) and technological development. The objective is to estimate possible future changes in the green, blue and grey water footprint (WF) of production and consumption, to analyze the main drivers of projected changes and to assess Europe’s future dependence on water resources elsewhere in the world. We develop four scenarios, considering globalization versus regional self-sufficiency, and development driven by economic objectives versus development driven by social and environmental objectives. The study shows that the most critical driver of change affecting Europe’s future WF is the consumption pattern. The WFs of both production and consumption in Western Europe increase under scenarios with high meat consumption and decrease with low-meat scenarios. Besides, additional water demands from increasing biofuel needs will put further pressure on European water resources. The European countries with a large ratio of external to total WF of consumption in 2000 decrease their dependencies on foreign water resources in 2050.

1. Introduction

Availability of freshwater in sufficient quantities and adequate quality is a prerequisite for human societies and natural ecosystems. In many parts of the world, excessive freshwater consumption and pollution by human activities put enormous pressure on this availability as well as on food security, environmental quality, economic development and social well-being. Today’s water problems related to freshwater scarcity may be aggravated in the future due to increases in demands for water and decreases in water availability and quality. Many authors have estimated that our dependency on water resources will increase significantly in the future and this brings problems for future food security and environmental sustainability [1,2,3,4].
Population and economic growth, changes in production patterns and trade relations, the allocation of water to competing uses and the way in which different sectors of society will respond to increasing water scarcity and pollution will be major factors affecting the future of global water resources. These factors are addressed in several water supply and demand scenario studies [3,5,6,7,8].
The current study develops water footprint (WF) scenarios for 2050 for Western and Eastern Europe and for individual European countries based on a number of drivers of change: population and economic growth, production and trade patterns, consumption patterns (diets and bioenergy use) and technological development. It follows the global WF scenario framework and methodology as described in Ercin and Hoekstra [8], which covers the assessment of future WF scenarios for the globe as a whole, distinguishing between 16 world regions. The year 2000 is the reference year. We develop four scenarios S1–S4 with different storylines, based on the dichotomies of ‘economy driven development’ (S1, S2) versus ‘environmental sustainability’ (S3, S4) and ‘globalization’ (S1, S3) versus ‘regional self-sufficiency’ (S2, S4). The study considers three sectors of water use: agriculture, industrial and domestic and distinguishes between green, blue and grey WFs. The green WF refers to consumptive water use of rainwater (green water resources); the blue WF refers to the consumption of groundwater and surface water (blue water resources); the grey WF refers to the amount of water contamination and is measured as the volume of water required to assimilate pollutants from human activities [9]. The objective of this European WF scenario study is to understand the possible future changes in the WF of production and consumption at the country level and to analyze the main drivers of change. In addition, we assess virtual water flows between Europe and the rest of the world and show dependencies of Europe on water resources in other regions of the world under different possible futures.

2. Materials and Methods

2.1. Scenario Description and Drivers of Change

For constructing water footprint scenarios for Europe, we use the four different scenarios as described by Ercin and Hoekstra [8]: global markets (S1), regional markets (S2), global sustainability (S3) and regional sustainability (S4). We first constructed a baseline scenario for 2050 and created four scenarios based on the baseline by using different alternatives for the drivers of change. The first scenario S1, global market, is characterized by high economic growth and liberalized international trade. Meat and dairy products are important elements of the diet of people. Scenario S2, regional markets, is also driven by economic growth, but the focus is more on regional and national boundaries. Regional self-sufficiency increases. Population growth is highest under this scenario. Scenario S3, global sustainability, is characterized by increased social and environmental values, which are integrated in global trade rules. Economic growth is slower than in S1 and S2 and social equity is taken into consideration. Scenario S4, local sustainability, is dominated by strong national or regional values. Self-sufficiency, equity and environmental sustainability are at the top of the policy agenda. We used five main drivers of change in European scenario development: population growth, economic growth, consumption patterns, production and trade pattern and technology development. Detailed description of scenarios, drivers of change, data sources and assumptions are described in Ercin and Hoekstra [8]. Table 1 shows the drivers of change and assumption for each of the four different scenarios.
We use population growth scenarios from the UN [10] and scenarios for the growth of Gross Domestic Product (GDP) per country from the database of the Centre for International Earth Science Information Network of Columbia University [11]. Consumption patterns include both dietary options and bio-energy demand. Two alternative diet options are used based on Erb et al. [12]. Under the ‘western high meat’ scenario, economic growth and consumption patterns accelerate in the coming decades, leading to a spread of western diet patterns. This scenario brings all regions to the industrialized diet pattern. Under the ‘less meat’ scenario, each regional diet will develop towards the diet of the country in the region that has the highest calorie intake in 2000, but only 30% of the protein comes from animal sources.
We integrated three different biofuel consumption alternatives into our scenarios. The baseline scenario is fossil-fuel dominated: biofuel demand remains constant at 2010 levels for most of the countries. This scenario is a conservative plan for biofuel development. Under the biofuel-expansion scenario, it is assumed that there will be an expansion in biofuel demand towards 2050. It is based on current national biofuel plans. Under the drastic-biofuel-expansion scenario, rapid growth of biofuel demand is foreseen.
Production and trade patterns are taken based on Calzadilla et al. [14], who estimated agricultural production changes in world regions by taking climate change and trade liberalization into account. We use two different trade futures as described in their study. The trade-liberalization scenario 1 (TL1) assumes a 25% tariff reduction for all agricultural sectors. In addition, it assumes zero export subsidies and a 50% reduction in domestic farm support. Trade liberalization scenario 2 (TL2) is a variation of the TL1 case with 50% tariff reduction for all agricultural sectors. In addition, Calzadilla et al. [14] elaborated potential impacts of climate change on production and trade patterns, considering IPCC’s A1B and A2 emission scenarios. We considered production changes as estimated in A1B+TL2 and A1B + TL1. We used A2 for the S2 and S4 scenarios but we also used self-sufficiency options to S2 and S4. In self-sufficiency scenario SS1, we assume a 20% reduction in the import of agricultural products (in tons) by importing regions compared to the baseline in 2050. Therefore, exporting regions reduce their exports by 20%. This is applied in S2. Under self-sufficiency scenario SS2, we assume a 30% reduction in imports by importing nations relative to the baseline in 2050. This alternative is used for S4.
Ercin and Hoekstra [8] developed global water footprint scenarios for 16 different regions of the world for the year 2050. In this assessment, we used the results of their global scenarios for estimating virtual water flows between Europe and the rest of the world and applied their framework and methodology at the country level in Europe. We also used the country classification and grouping as described in Ercin and Hoekstra [8], which are: the USA; Canada; Japan and South Korea (JPK); Western Europe (WEU); Australia and New Zealand (ANZ); Eastern Europe (EEU); Former Soviet Union (FSU); Middle East (MDE); Central America (CAM); South America (SAM); South Asia (SAS); South-east Asia (SEA); China (CHI); North Africa (NAF); Sub-Saharan Africa (SSA) and the rest of the world (RoW). In this study, WEU consists of: Andorra, Austria, Belgium, Cyprus, Denmark, Finland, France, Germany Greece, Iceland, Ireland, Italy, Luxembourg, Malta, Netherlands, Norway, Portugal, Spain, Sweden, Switzerland, and the United Kingdom. EEU consists of: Albania, Bosnia and Herzegovina, Bulgaria, Croatia, Czech Republic, Hungary, Macedonia, Montenegro, Poland, Romania, Serbia, Slovakia and Slovenia.

2.2. Estimation of Water Footprints

This study follows the terminology of water footprint assessment as described in the Water Footprint Assessment Manual [9]. The water footprint measures water use in terms of water volumes consumed (evaporated or incorporated into the product) and polluted per unit of time. The water footprint of an individual or community is defined as the total volume of freshwater that is used to produce the goods and services consumed by the individual or community. The ‘water footprint of national (regional) production’ refers to the total freshwater volume consumed or polluted within the territory of the nation (region). This includes water use for making products consumed domestically but also water use for making export products. It is different from the ‘water footprint of national (regional) consumption’, which refers to the total amount of water that is used to produce the goods and services consumed by the inhabitants of the nation (region). This refers to both water use within the nation (region) and water use outside the territory of the nation (region), but is restricted to the water use behind the products consumed within the nation (region). The water footprint of national (regional) consumption thus includes an internal and external component. The internal water footprint of consumption is defined as the use of domestic water resources to produce goods and services consumed by the national (regional) population. It is the sum of the water footprint of the production minus the volume of virtual-water export to other nations (regions) insofar as related to the export of products produced with domestic water resources. The external water footprint of consumption is defined as the volume of water resources used in other nations (regions) to produce goods and services consumed by the population in the nation (region) considered. It is equal to the virtual-water import minus the volume of virtual-water export to other nations (regions) because of re-export of imported products.
In the global study [8], Europe is described by two regions: Western and Eastern Europe. To enable us to make a more detailed analysis for Europe, we use country-specific data on population change and per capita food consumption for Western and Eastern Europe. We down-scaled the results given for Western and Eastern Europe to the nations within Europe. To estimate production, trade, virtual water flows, and water footprint of production and consumption per country within Europe, we followed the same methodology as described in Ercin and Hoekstra [8]. The regions in the equations given in the study are replaced by the nations of Europe. The production distribution among the European countries in 2050 is done by taking the production patterns in 2000 [15]. Baseline data on the WF of crop and animal products are taken from [16,17], respectively.

3. Results

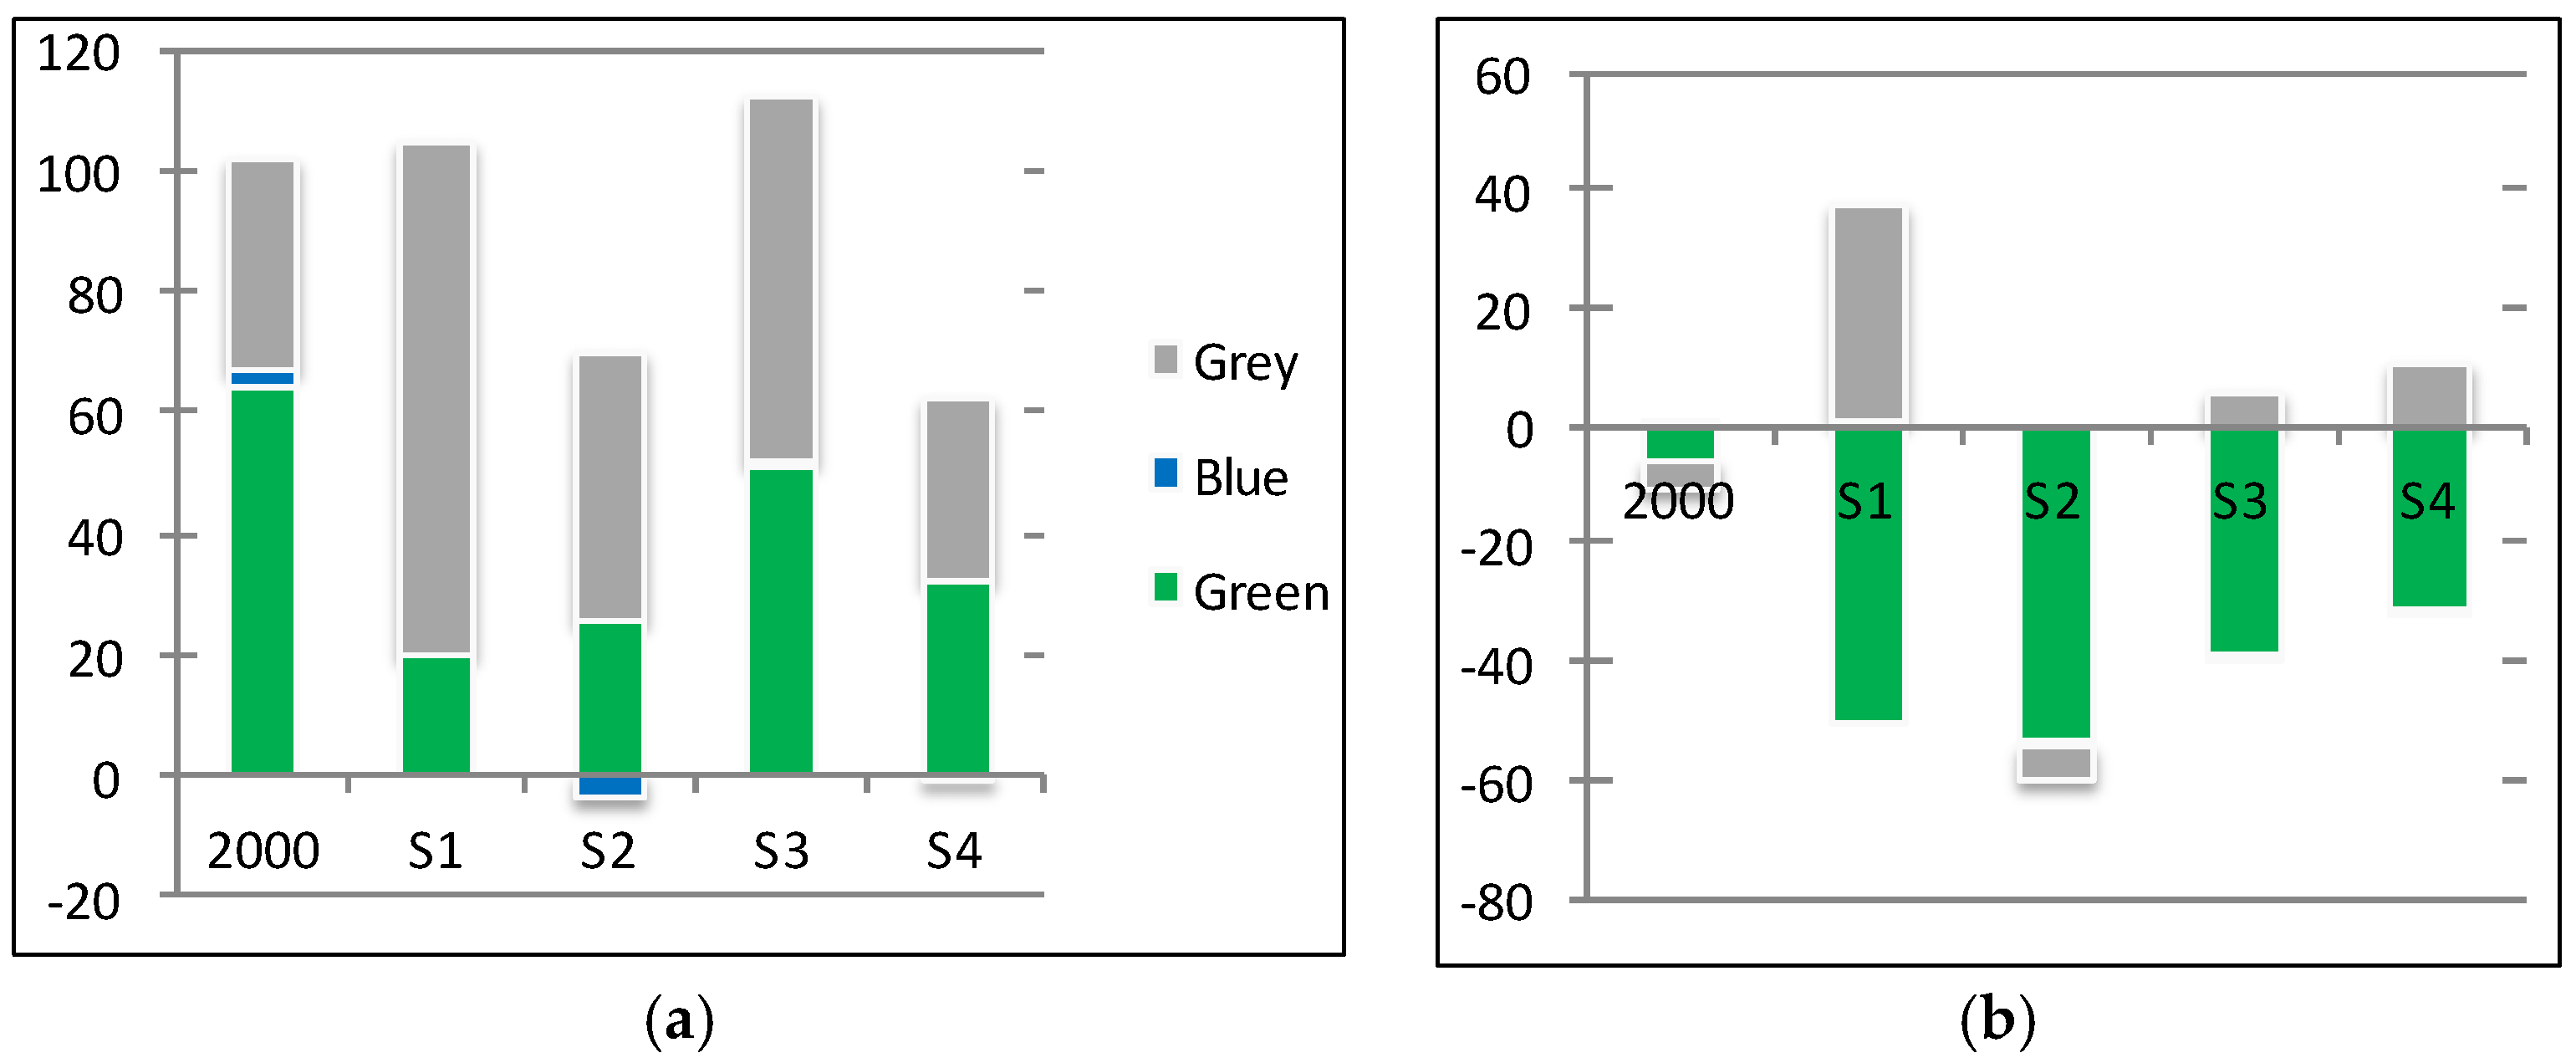
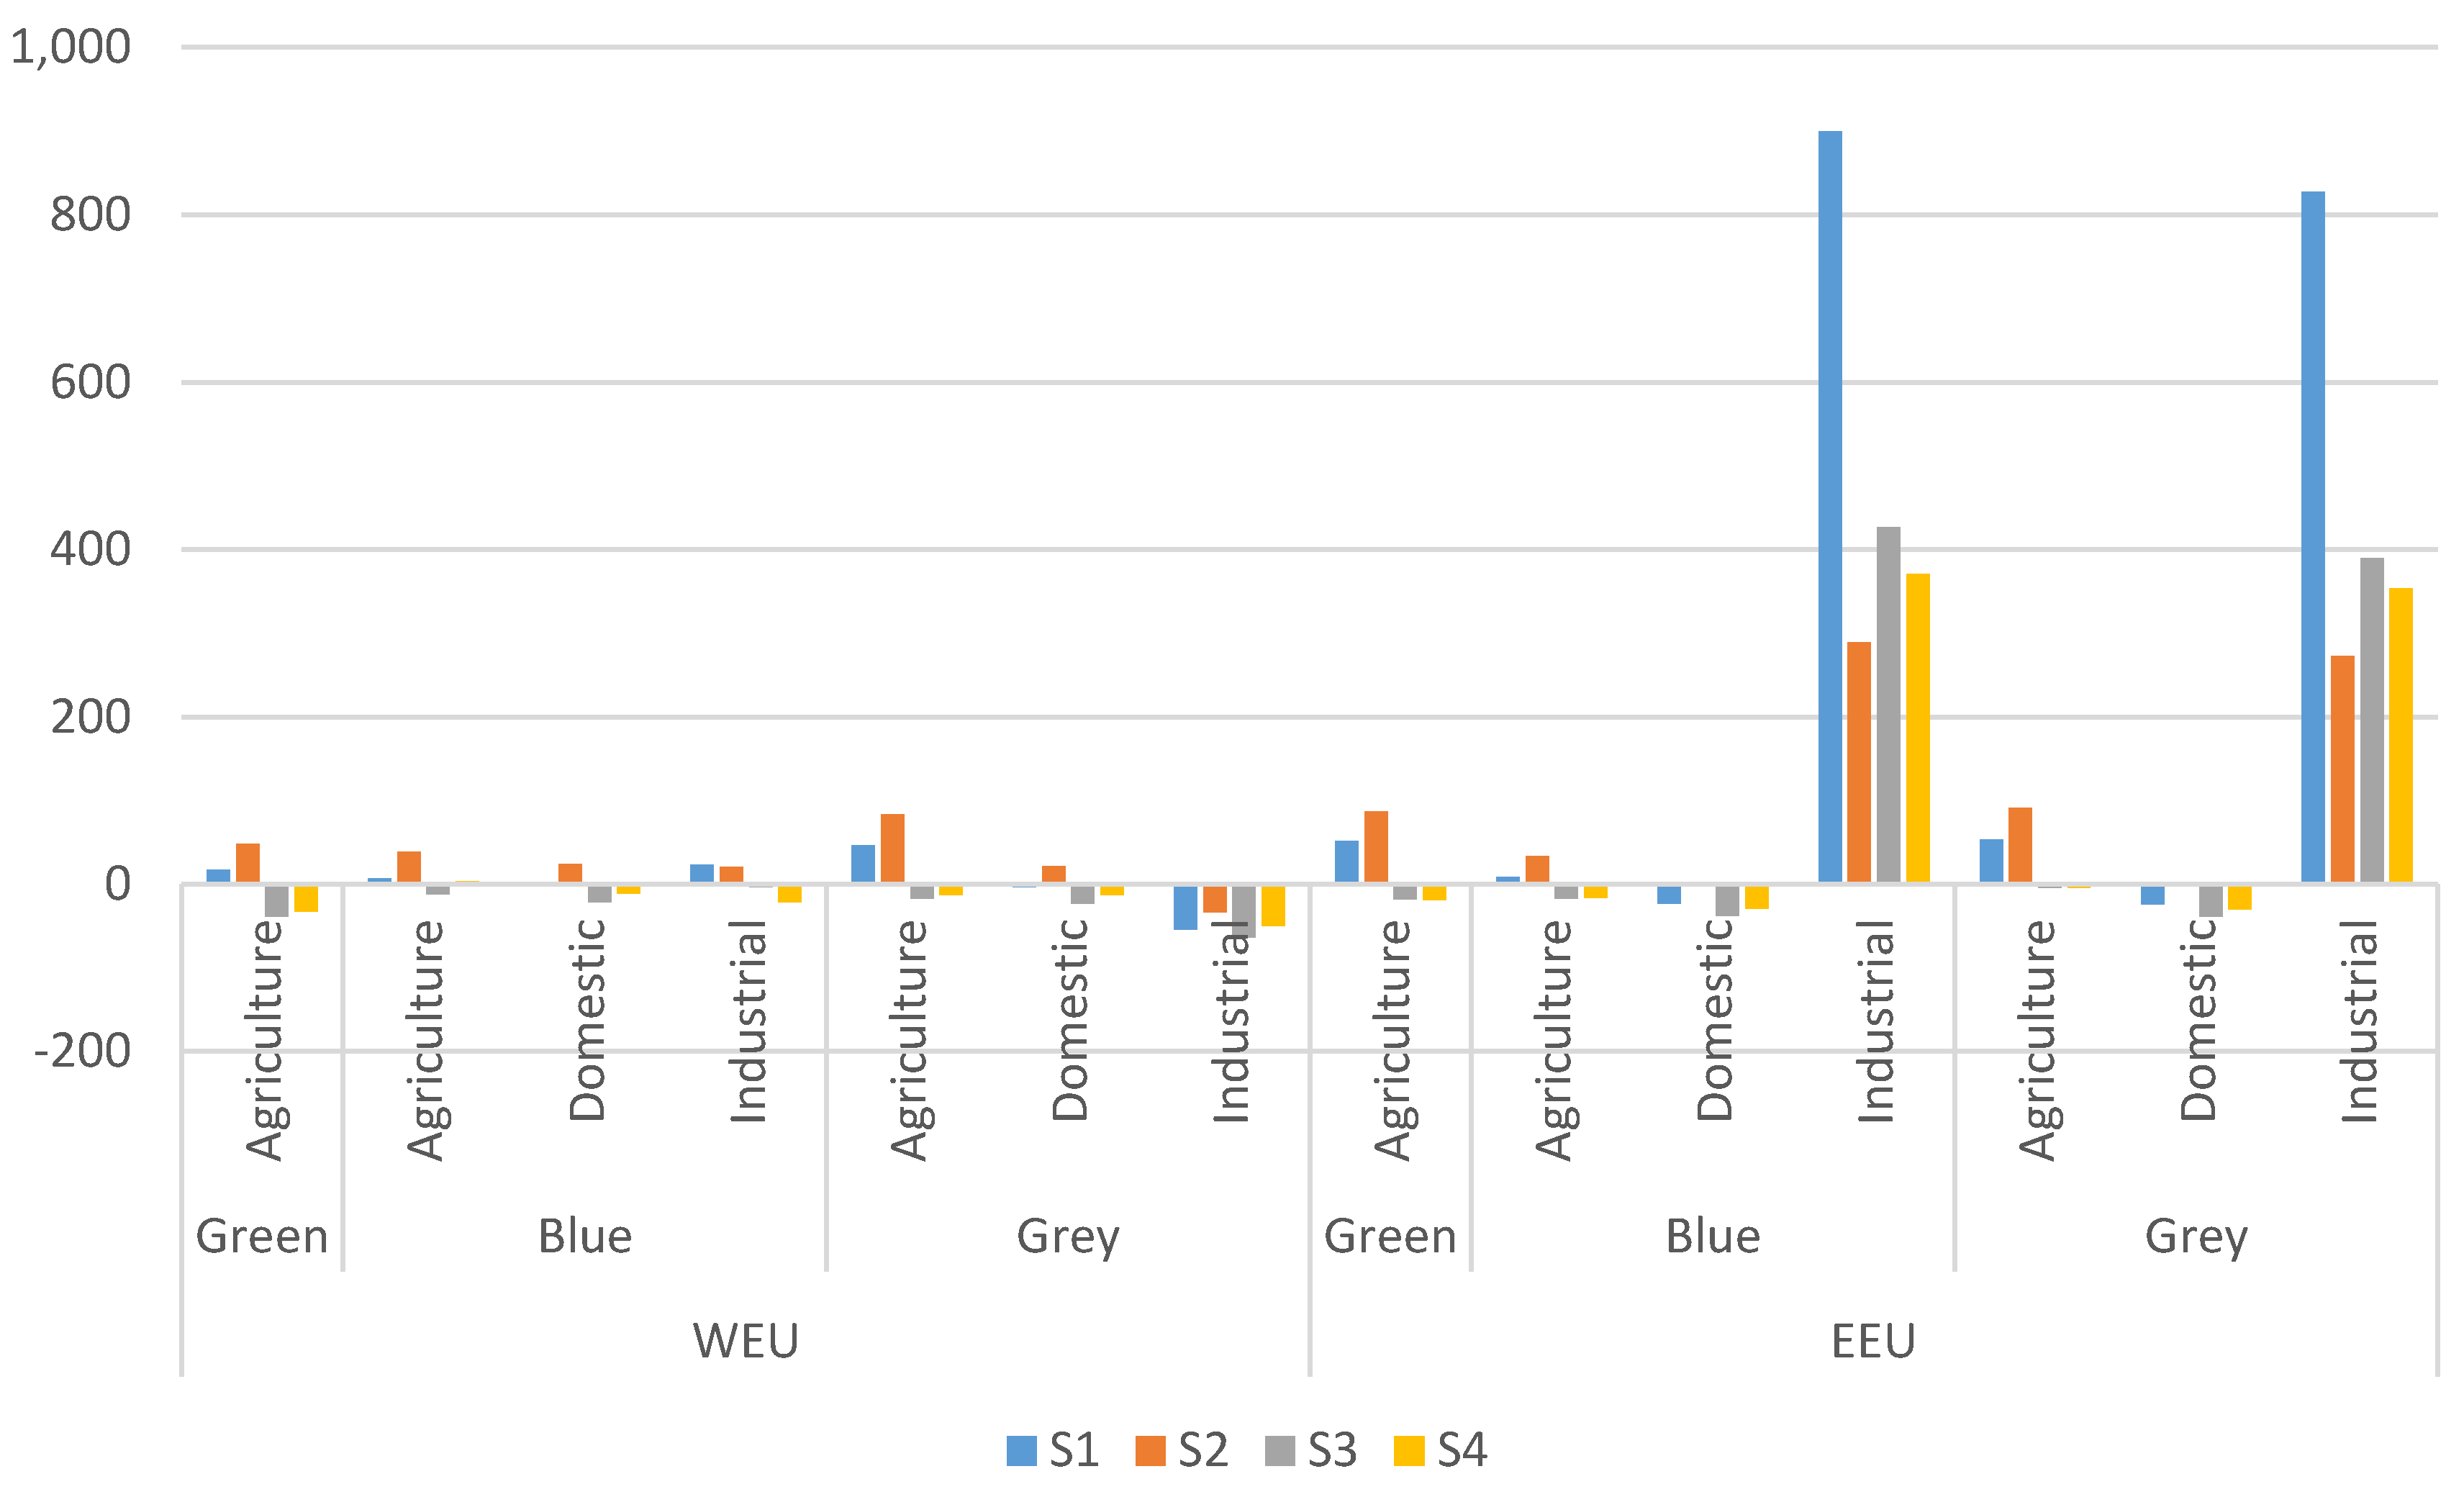
3.1. Water Footprint of Production

The total WF of production in Western Europe (WEU) increases by +12% in S1 and +42% in S2 relative to 2000 values. It decreases 36% in S3 and 29% in S4. The green WF of production becomes 17% and 48% larger in S1 and S2 and 38% and 32% smaller in S3 and S4 compared to 2000. The blue component changes in a similar way: increases by 9 and 35% in S1 and S2 and decreases by 11% in S3 and 1% in S4 (Figure 1). The grey component decreases in S1, S3 and S4 by 6, 40, 30% respectively, and increases by 22% in S2.
The WF of agricultural production in WEU increases by 19% in S1 and 51% in S2 and falls by 34% and 28% in S3 and S4 compared to 2000. The industrial WF of production in WEU decreases under all scenarios. The WF of domestic water supply reduces in S1, S3 and S4 but increases in S2 compared to 2000.
Eastern Europe (EEU) increases its WF of total production by +150% and +107% in S1 and S2, respectively, compared to 2000. The increase is lower in S3 and S4 than under the other scenarios, but volumes are 36% and 31% higher, respectively, than in 2000. The grey WF of production in EEU shows the greatest growth: 448% in S1, 174% in S2, 197% in S3 and 179% in S4. The blue WF of production increases significantly as well: 231% in S1, 94% in S2, 93% in S3 and 81% in S4. Increases can also be seen in the green WF of production, which is 51% and 86% larger than 2000 in S1 and S2, respectively. In S3 and S4, the green WF of production decreases (18%–19% lower than 2000).
The WF of industrial production in EEU in S1 becomes 8 times higher than in 2000. The less drastic but still large increase is also detected in the other scenarios. The WF related to agricultural production becomes larger in S1 and S2, by 50% and 85%, respectively. It stays below the 2000 volumes in S3 and S4. The WF of domestic water supply remains at the value of 2000 in S2 and decreases by around 24%–39% for S1, S3 and S4.
Among the agricultural products, the WF related to meat production has the largest share (28%) in the total for S1 and S2 in WEU. The share of meat production decreases to 19%–22% in S3 and S4. Oil crops and cereals increase their share in the total WF of production in S3 and S4 partly due to the high demand for biofuel by WEU. The WF of meat production shows the greatest increase in S1 and S2 but it decreases 20% in S3 and S4 compared to 2000. The WF of vegetable and fruit production increases largely in S1 and S2 and decreases by 20%and 30% in S3 and S4 compared to 2000. For most of product groups, the WF of production increases in S1/S2 and decreases in S3/S4. The total WF of oil crop and sugar crop production increases in S2 and S4 and decreases in S1 and S3, compared to 2000.
The WF of agricultural production increases notably in EEU in S1 and S2 for all product groups. The WFs related to the production of meat, dairy products, vegetables and fruits multiply by more than two times in S1 and S2. However, the total WF of production for these product groups reduces by 30% in S3 and S4. The total WF of sugar crop and oil crop production increases in S1, S2 and S4 compared to 2000. The increase in the overall WF of agricultural production is the highest in S2 because of the large population size and high meat content diet in this scenario.
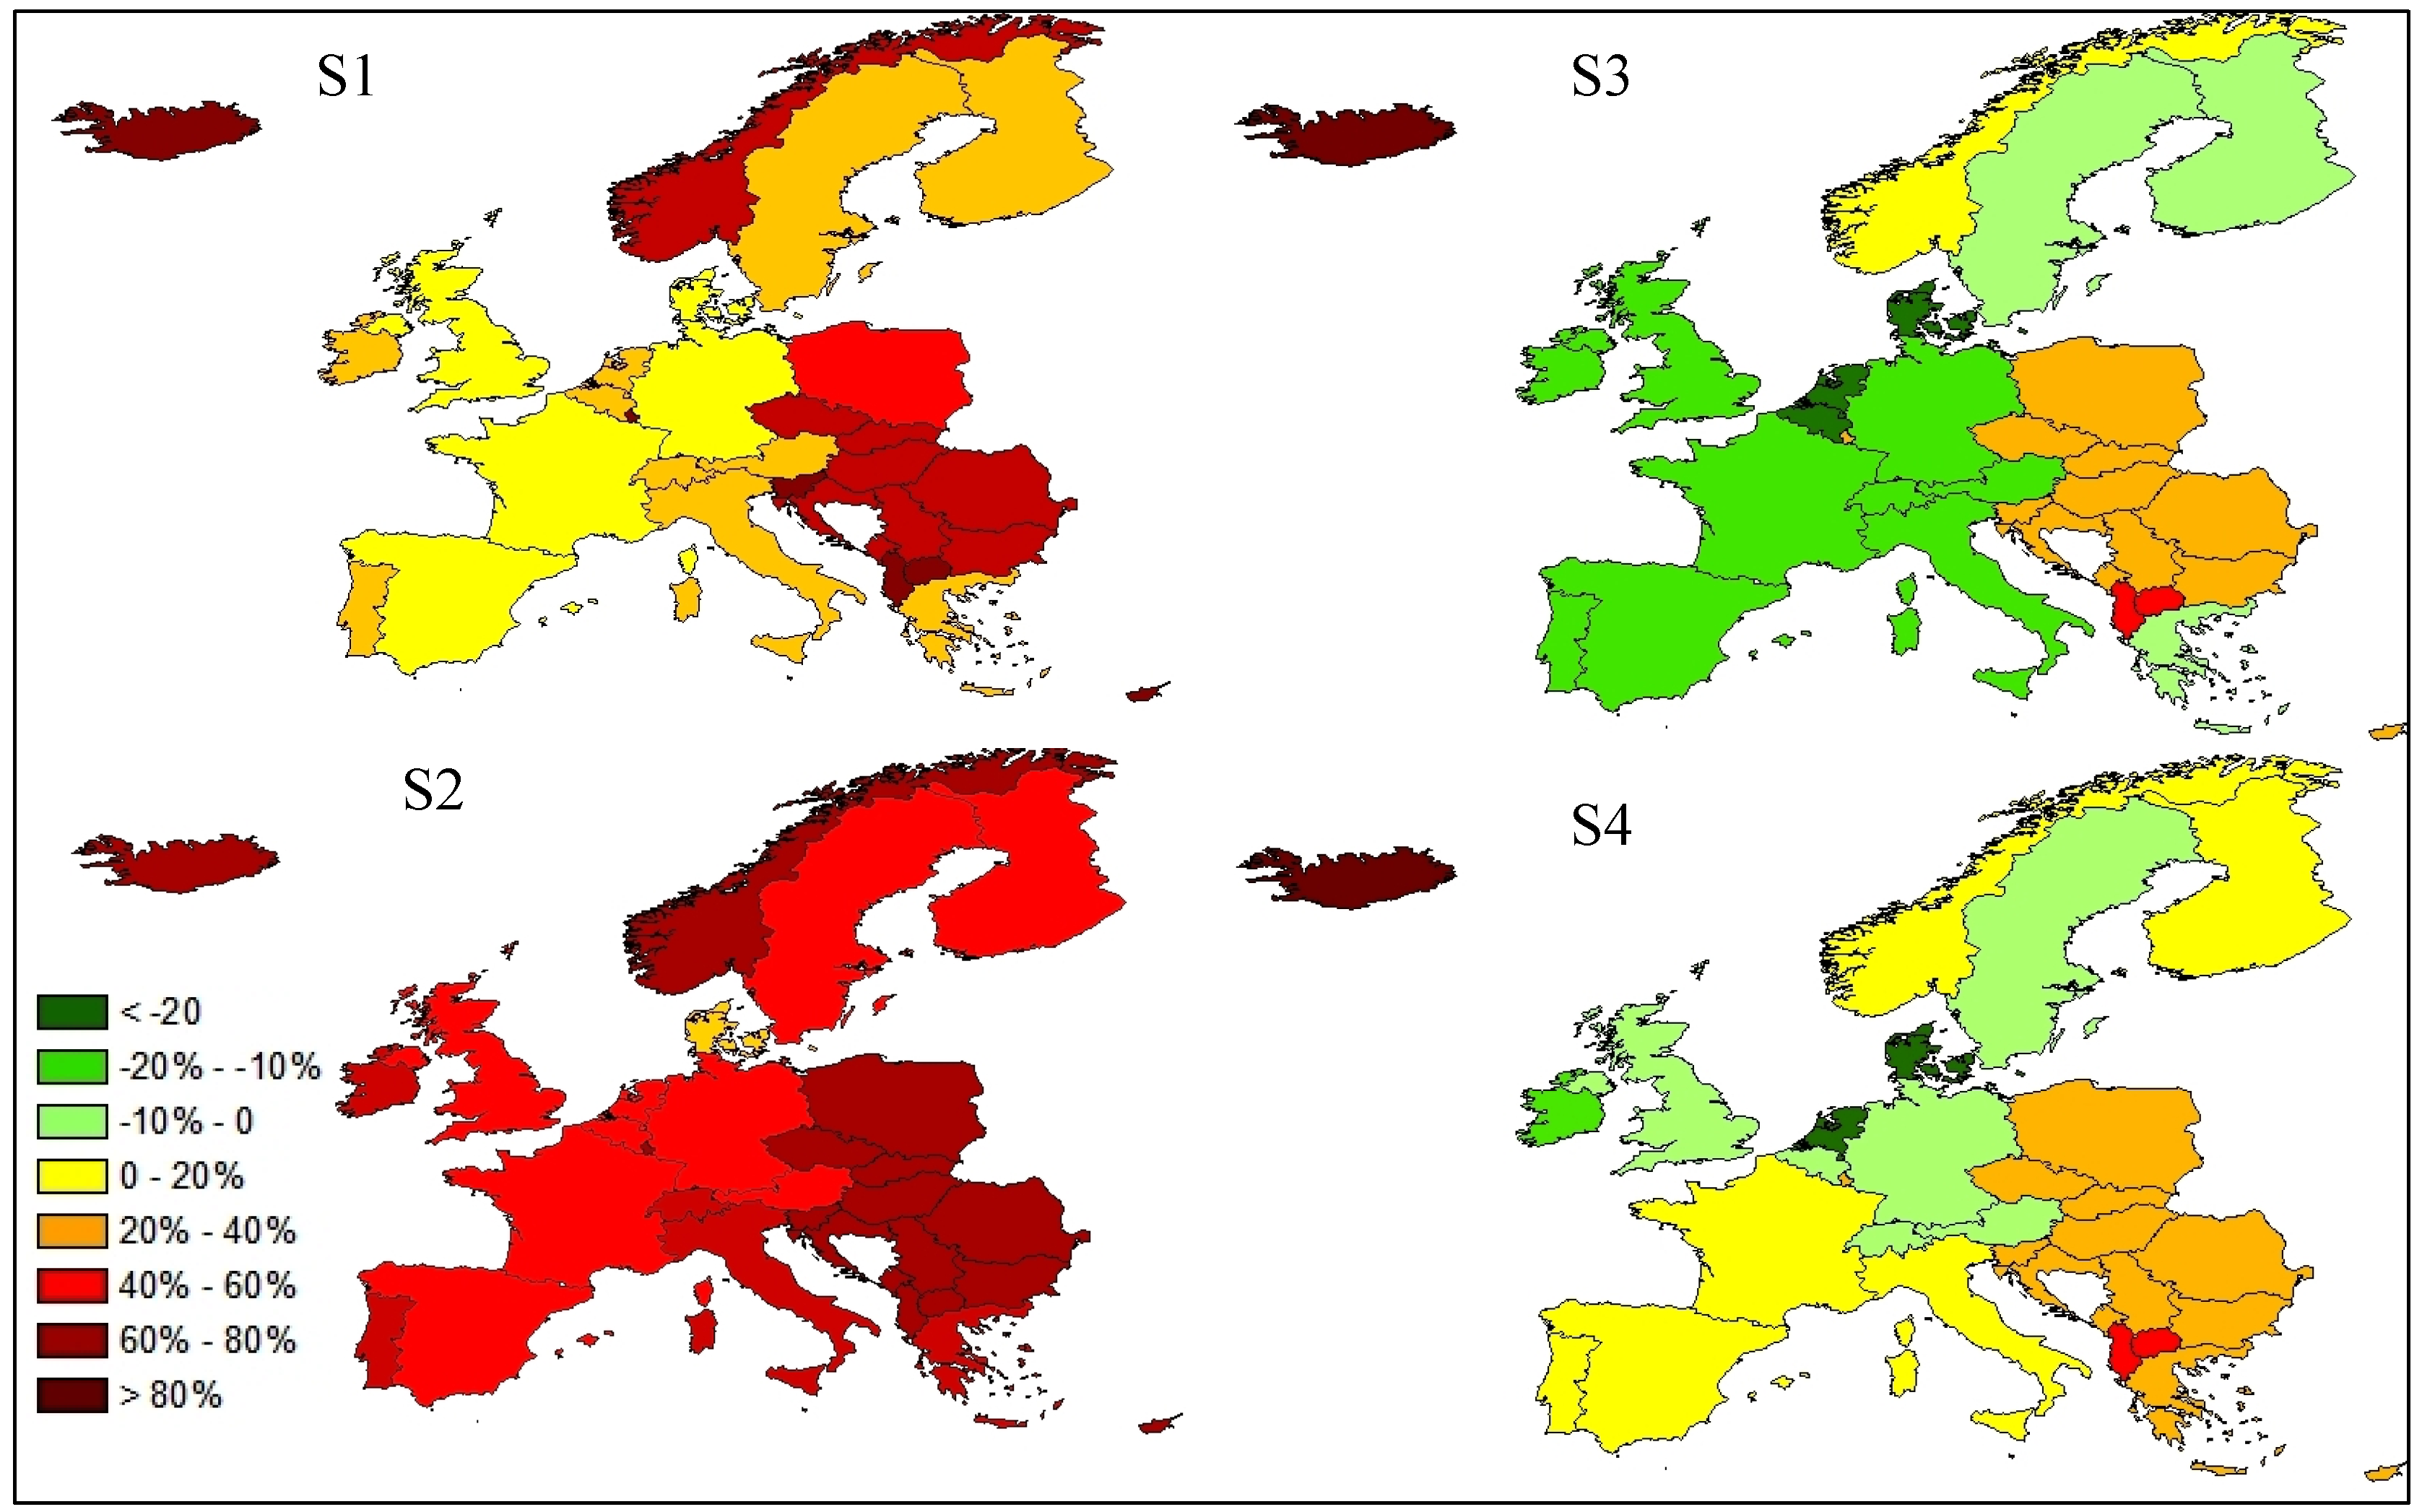
On a national level, Eastern European countries like Poland, Hungary, Bulgaria and Romania become important producers and significantly increase their WF of consumption in S1 and S2 compared to 2000 (Figure 2). The countries with the largest WF of production in 2000, like France and Spain, continue to have the largest WF of production in 2050. A shift from Southern Europe to Northern Europe is observed in the WF of cereal production. Norway, Luxembourg, Iceland, Cyprus and Malta have the highest increase in the WF of production in S1 and S2 compared to 2000.
All Eastern European countries have a larger WF of production in S3 and S4 relative to 2000, although the increase (around 30%) is smaller than the increases in the WF of production observed in S1 and S2. All of the WEU countries decrease their WF of production in S3 compared to 2000, except Cyprus, Malta, Iceland and Norway. A reduction in the WF of production is seen in the Netherlands, Belgium, Sweden, Germany, the UK, Ireland, Austria, Switzerland and Denmark in S4 compared to 2000. Spain and Italy, two counties with a large WF of production in 2000 in Europe, decrease their WF of production relative to 2000 only in S3 among all scenarios. Low-meat content diets and a shift of production to Central and Eastern Europe are the main reasons for this. Among the WEU countries, the Netherlands and Denmark have the highest reduction in the total WF of production compared to 2000, in S3 and S4. France reduces its WF of production in S3 but increases in S4 compared to 2000. Germany has a smaller WF of production in S3 and S4 compared to 2000.
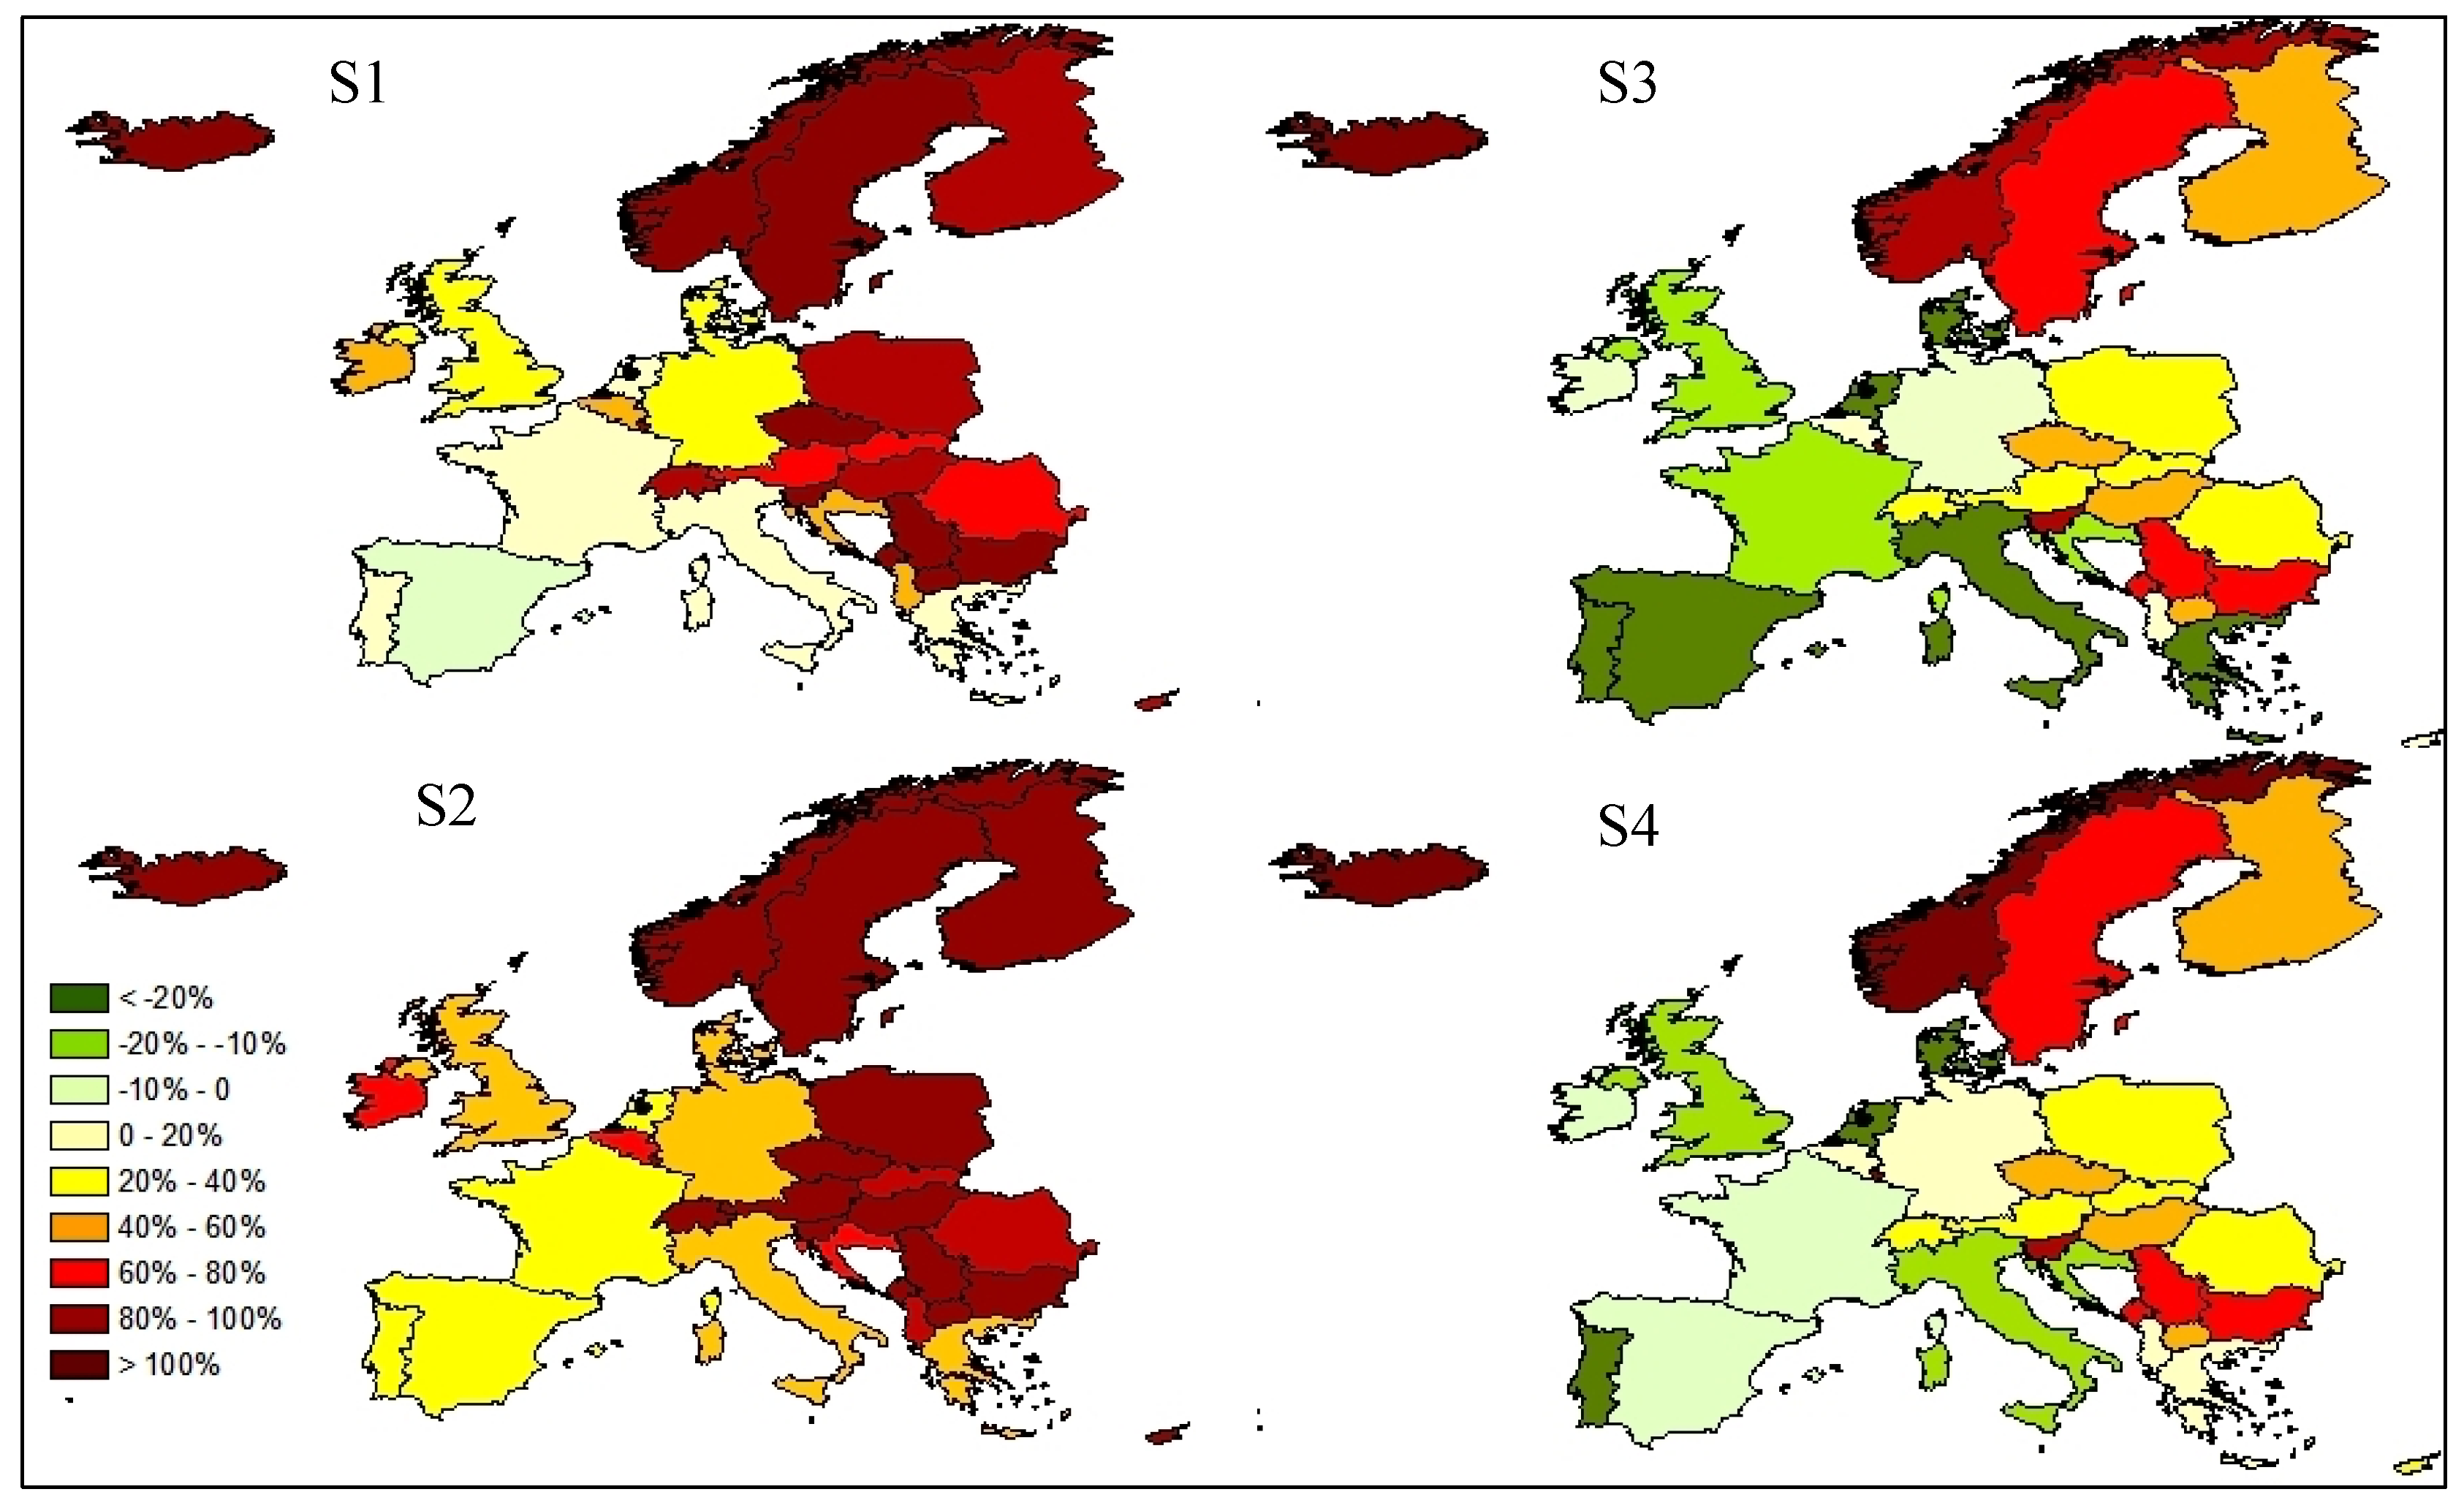
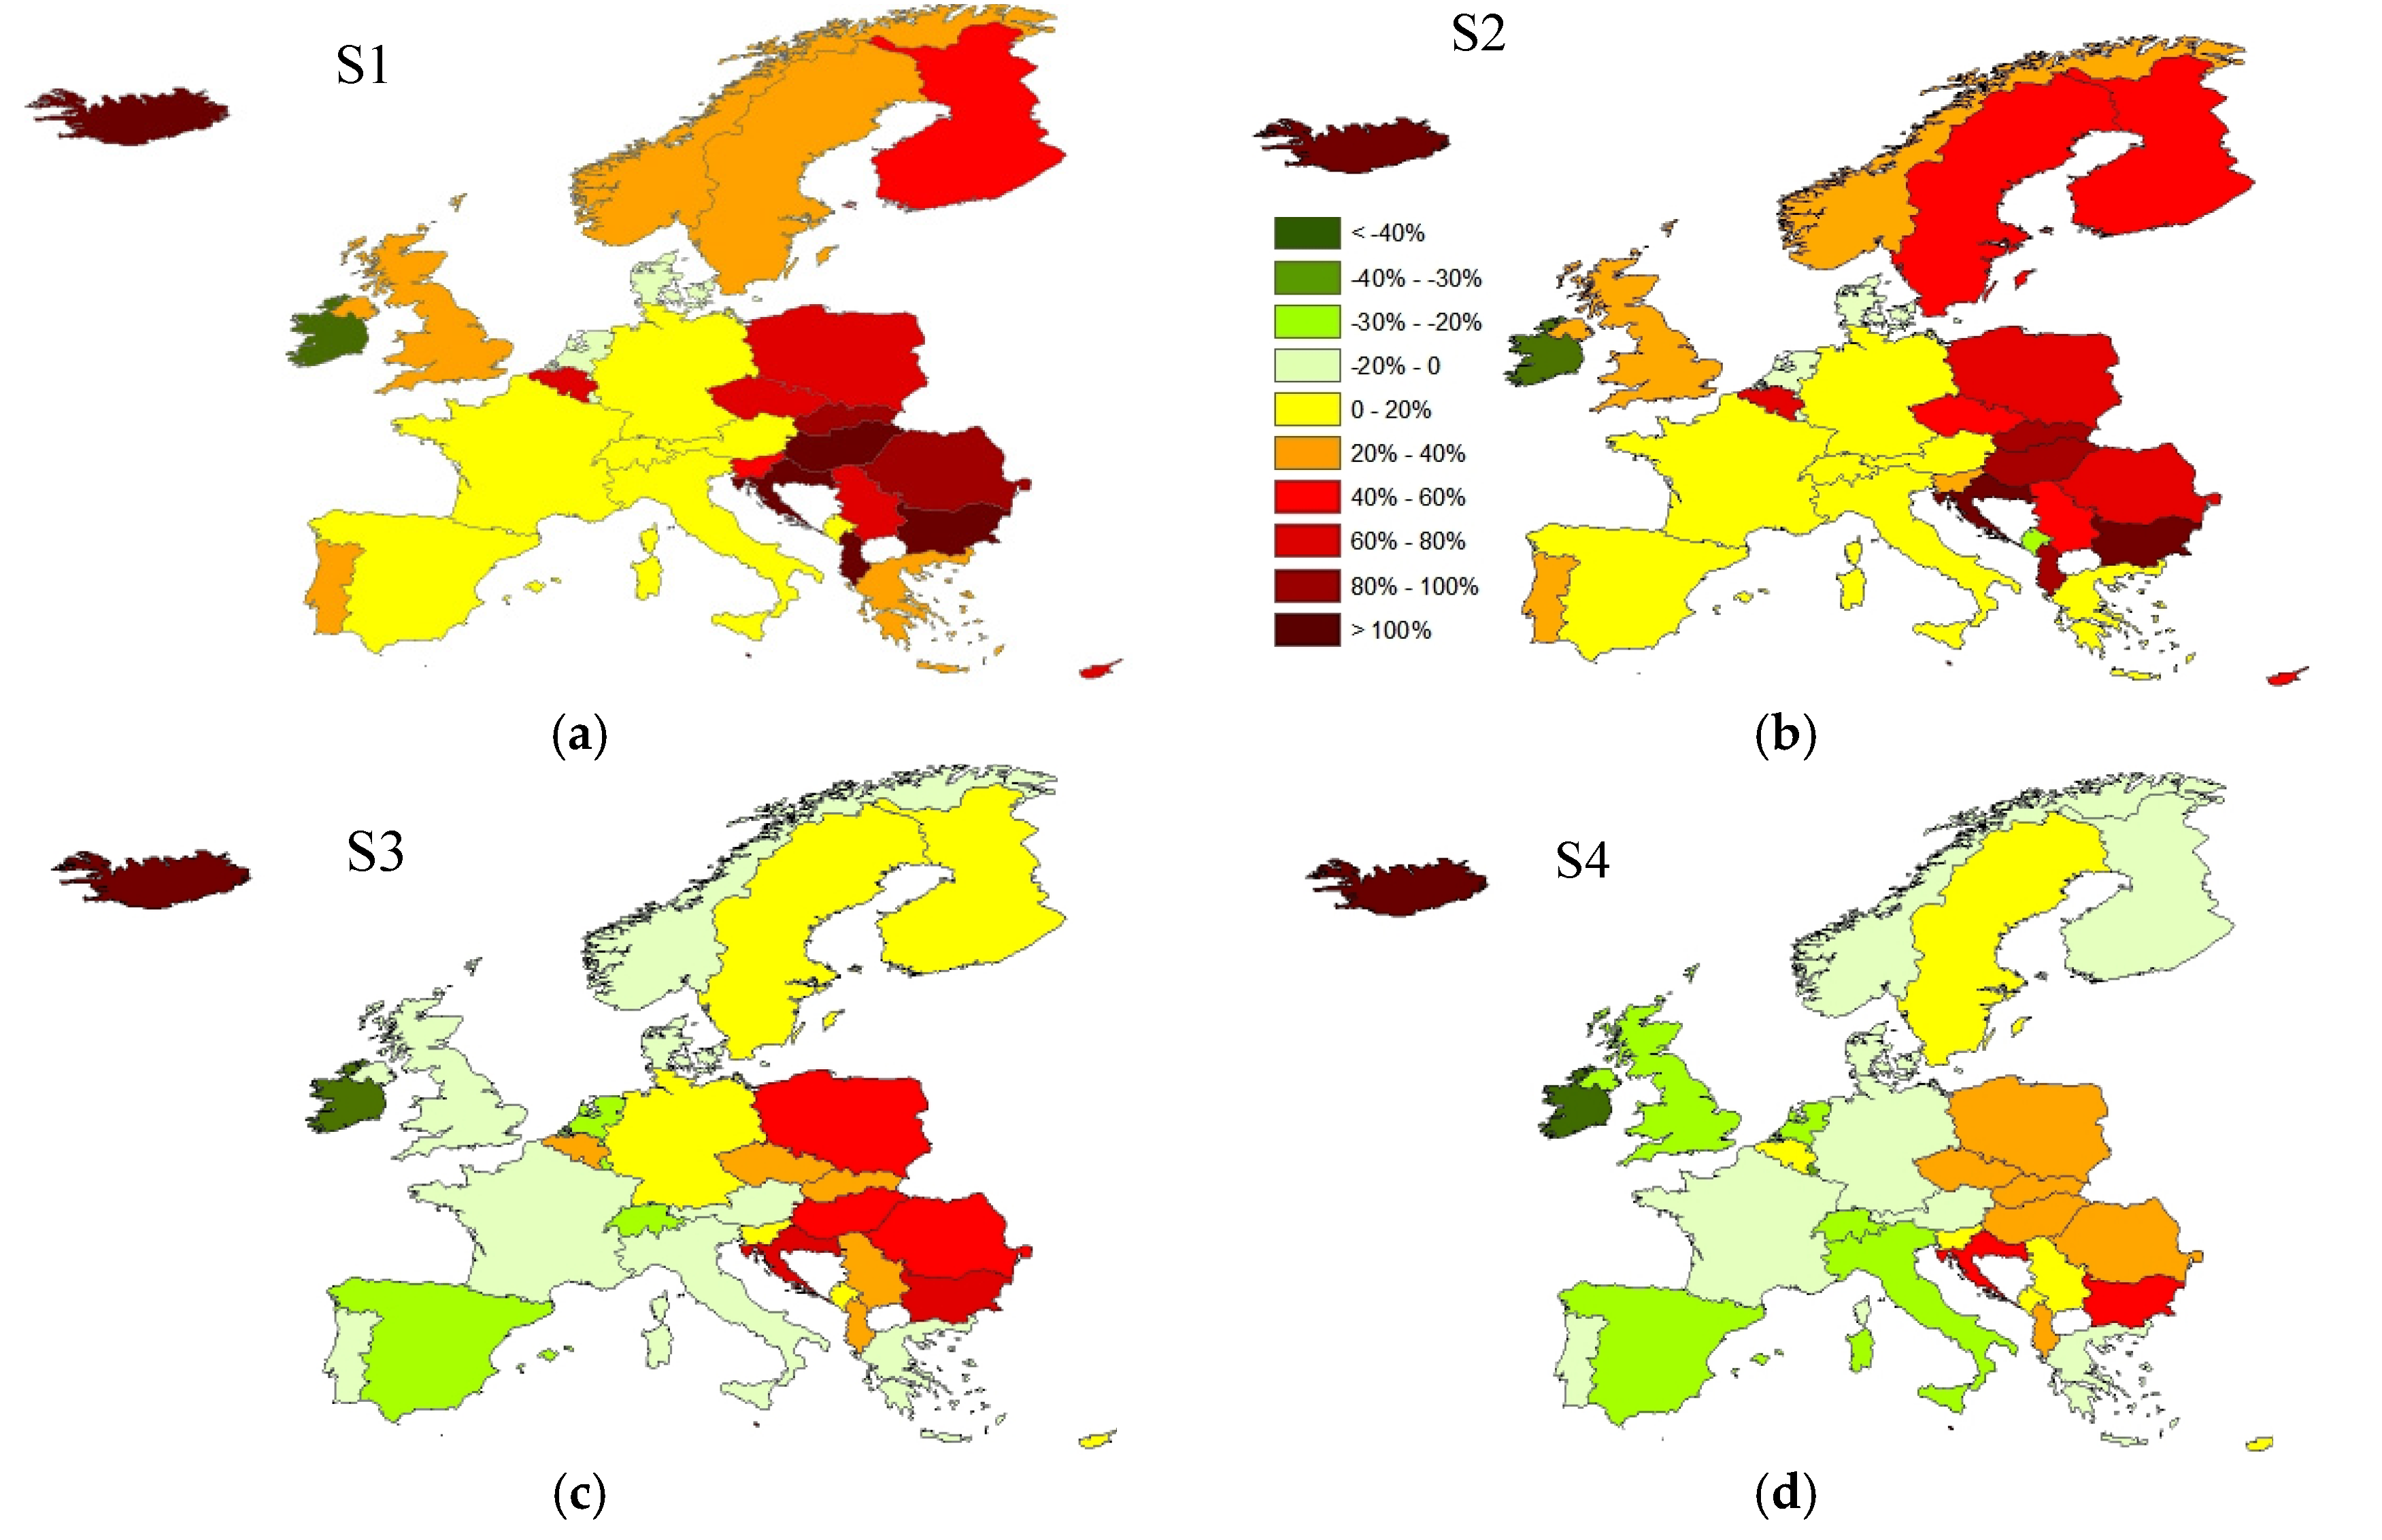
With respect to the blue WF, the net abstraction from surface water and groundwater, many countries face an increase in all scenarios. This includes the four most northern countries (Norway, Sweden, Finland, Iceland) and most countries in Eastern Europe (Figure 3). Most of the EEU countries double their blue WF of production in S1 and S2. They also have a larger blue WF of production in S3 and S4, except Croatia and Bosnia and Herzegovina. Serbia, the Czech Republic, Slovenia and Macedonia have the highest increase in blue WF of production in EEU. In most of Western Europe—except for the four most northern countries—we see an increase in the blue WF in scenarios S1 and S2, but a decrease in scenarios S3 and S4. In Austria, Switzerland, Belgium and Luxembourg, however, we find an increase in blue WF of production in all scenarios.
An increasing blue WF of production means increasing blue water scarcity. The severity of this water scarcity increase differs per country. Spain, Portugal, Cyprus, Malta, Italy, some parts of France (west and south east), the south-east part of the UK and Greece already experience significant to severe water scarcity at least one month a year under current conditions [18]. The small island countries in Europe, Cyprus and Malta, increase their blue WF of production in S1 and S2 very significantly. These countries already experience high blue water scarcity, so scenarios S1 and S2 will be very problematic for these countries. The blue WF of production in Malta increases significantly in S3 and S4 as well. Scenario S2 shows an increase in blue water scarcity in all countries in Europe; the impacts will be largest in those regions that already experience recurrent or incidental severe water scarcity today, most in particular the countries in southern Europe. Under scenario S2, eastern European countries like Bulgaria and Romania will start facing severe water scarcity.
In a number of countries, water scarcity will decrease under some of the scenarios. Scenarios S3 and S4 show a reduction of blue WFs in the European countries that currently face highest water scarcity, which will reduce the pressure on their water resources and lessen the water scarcity. S3 yields the largest reduction of blue WF, especially for the countries experiencing the severest water scarcity: Spain, Italy and Greece. Pressures on the water resources in these countries will be reduced significantly under this scenario. Spain decreases its blue WF of production by 3% in S1, 27% in S3 and 5% in S4, but increases it by 32% in S2.

3.2. Virtual Water Flows

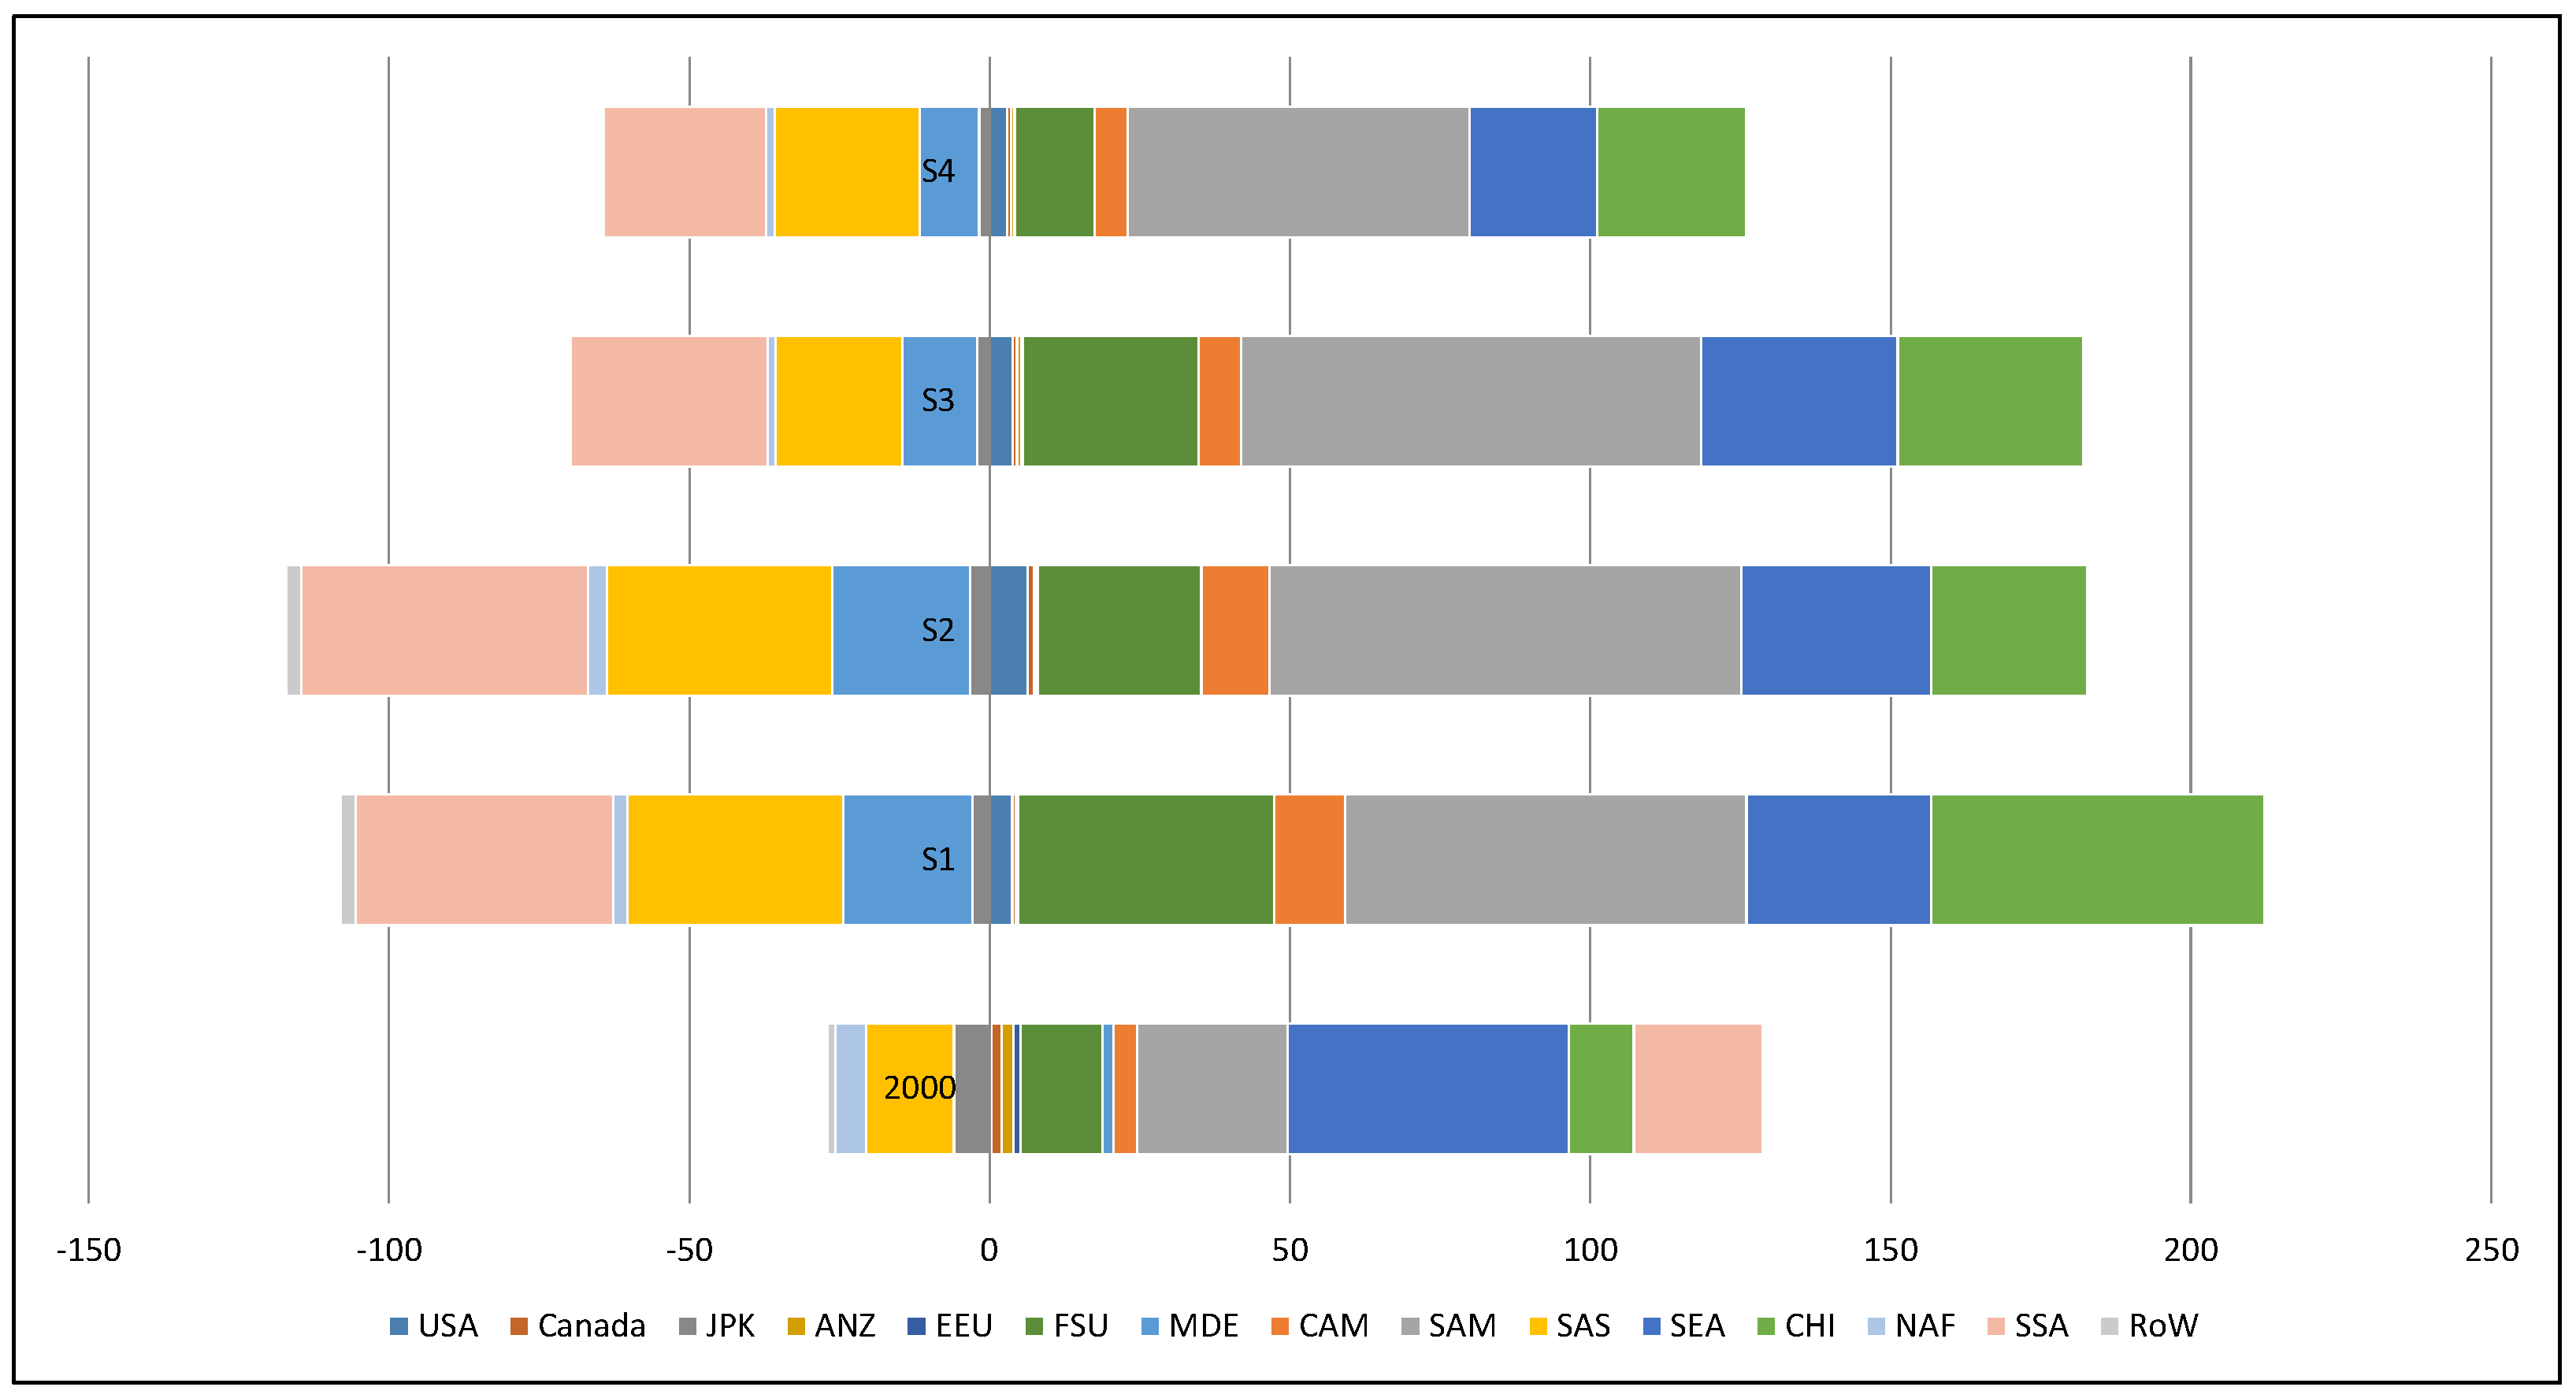
WEU is a net virtual water importer in 2000 (Figure 4). It will remain a net virtual water importer; however, it decreases its net virtual water import in S2 and S4 compared to 2000. It increases its net virtual water import by +2% in S1 and +10% in S3. The reduction in net virtual water import by WEU is −35% in S2 and −40% in S4. Net virtual water imports to WEU were mainly from SEA, SAM, FSU, CHI and SSA in 2000. Virtual water import from SAM increases by around +200% in S1, S2 and S3 and +120% in S4, which makes SAM the biggest virtual water exporter to WEU in 2050. Although SEA has a large net virtual water export to WEU in 2050, its net virtual water export to WEU decreases by −35% for S1, S2 and S3 and −55% for S4. Net virtual water imports from Canada, EEU and ANZ decrease as well, more than −50% in all scenarios. Net virtual water import from the USA increases more than 10 times in 2050 for all scenarios but remains relatively small compared to the net virtual water exports from other regions. The virtual water import volume from FSU increases by 210% in S1, 100% in S2 and S3 but decreases by 4% in S4. WEU increases its net virtual water import from China by +410% in S1 and more than +100% in S2, S3 and S4. Being net virtual water exporters to WEU in 2000, SSA and MDE become net virtual water importers from WEU in 2050 for all scenarios. WEU is a net virtual water exporter to SAS, MDE, NAF, SSA and JPK in 2050. The largest net virtual water export is to SSA under all scenarios, followed by SAS and MDE. Net virtual water export by WEU to SSA increases significantly in 2050 due to increased trade in animal products.
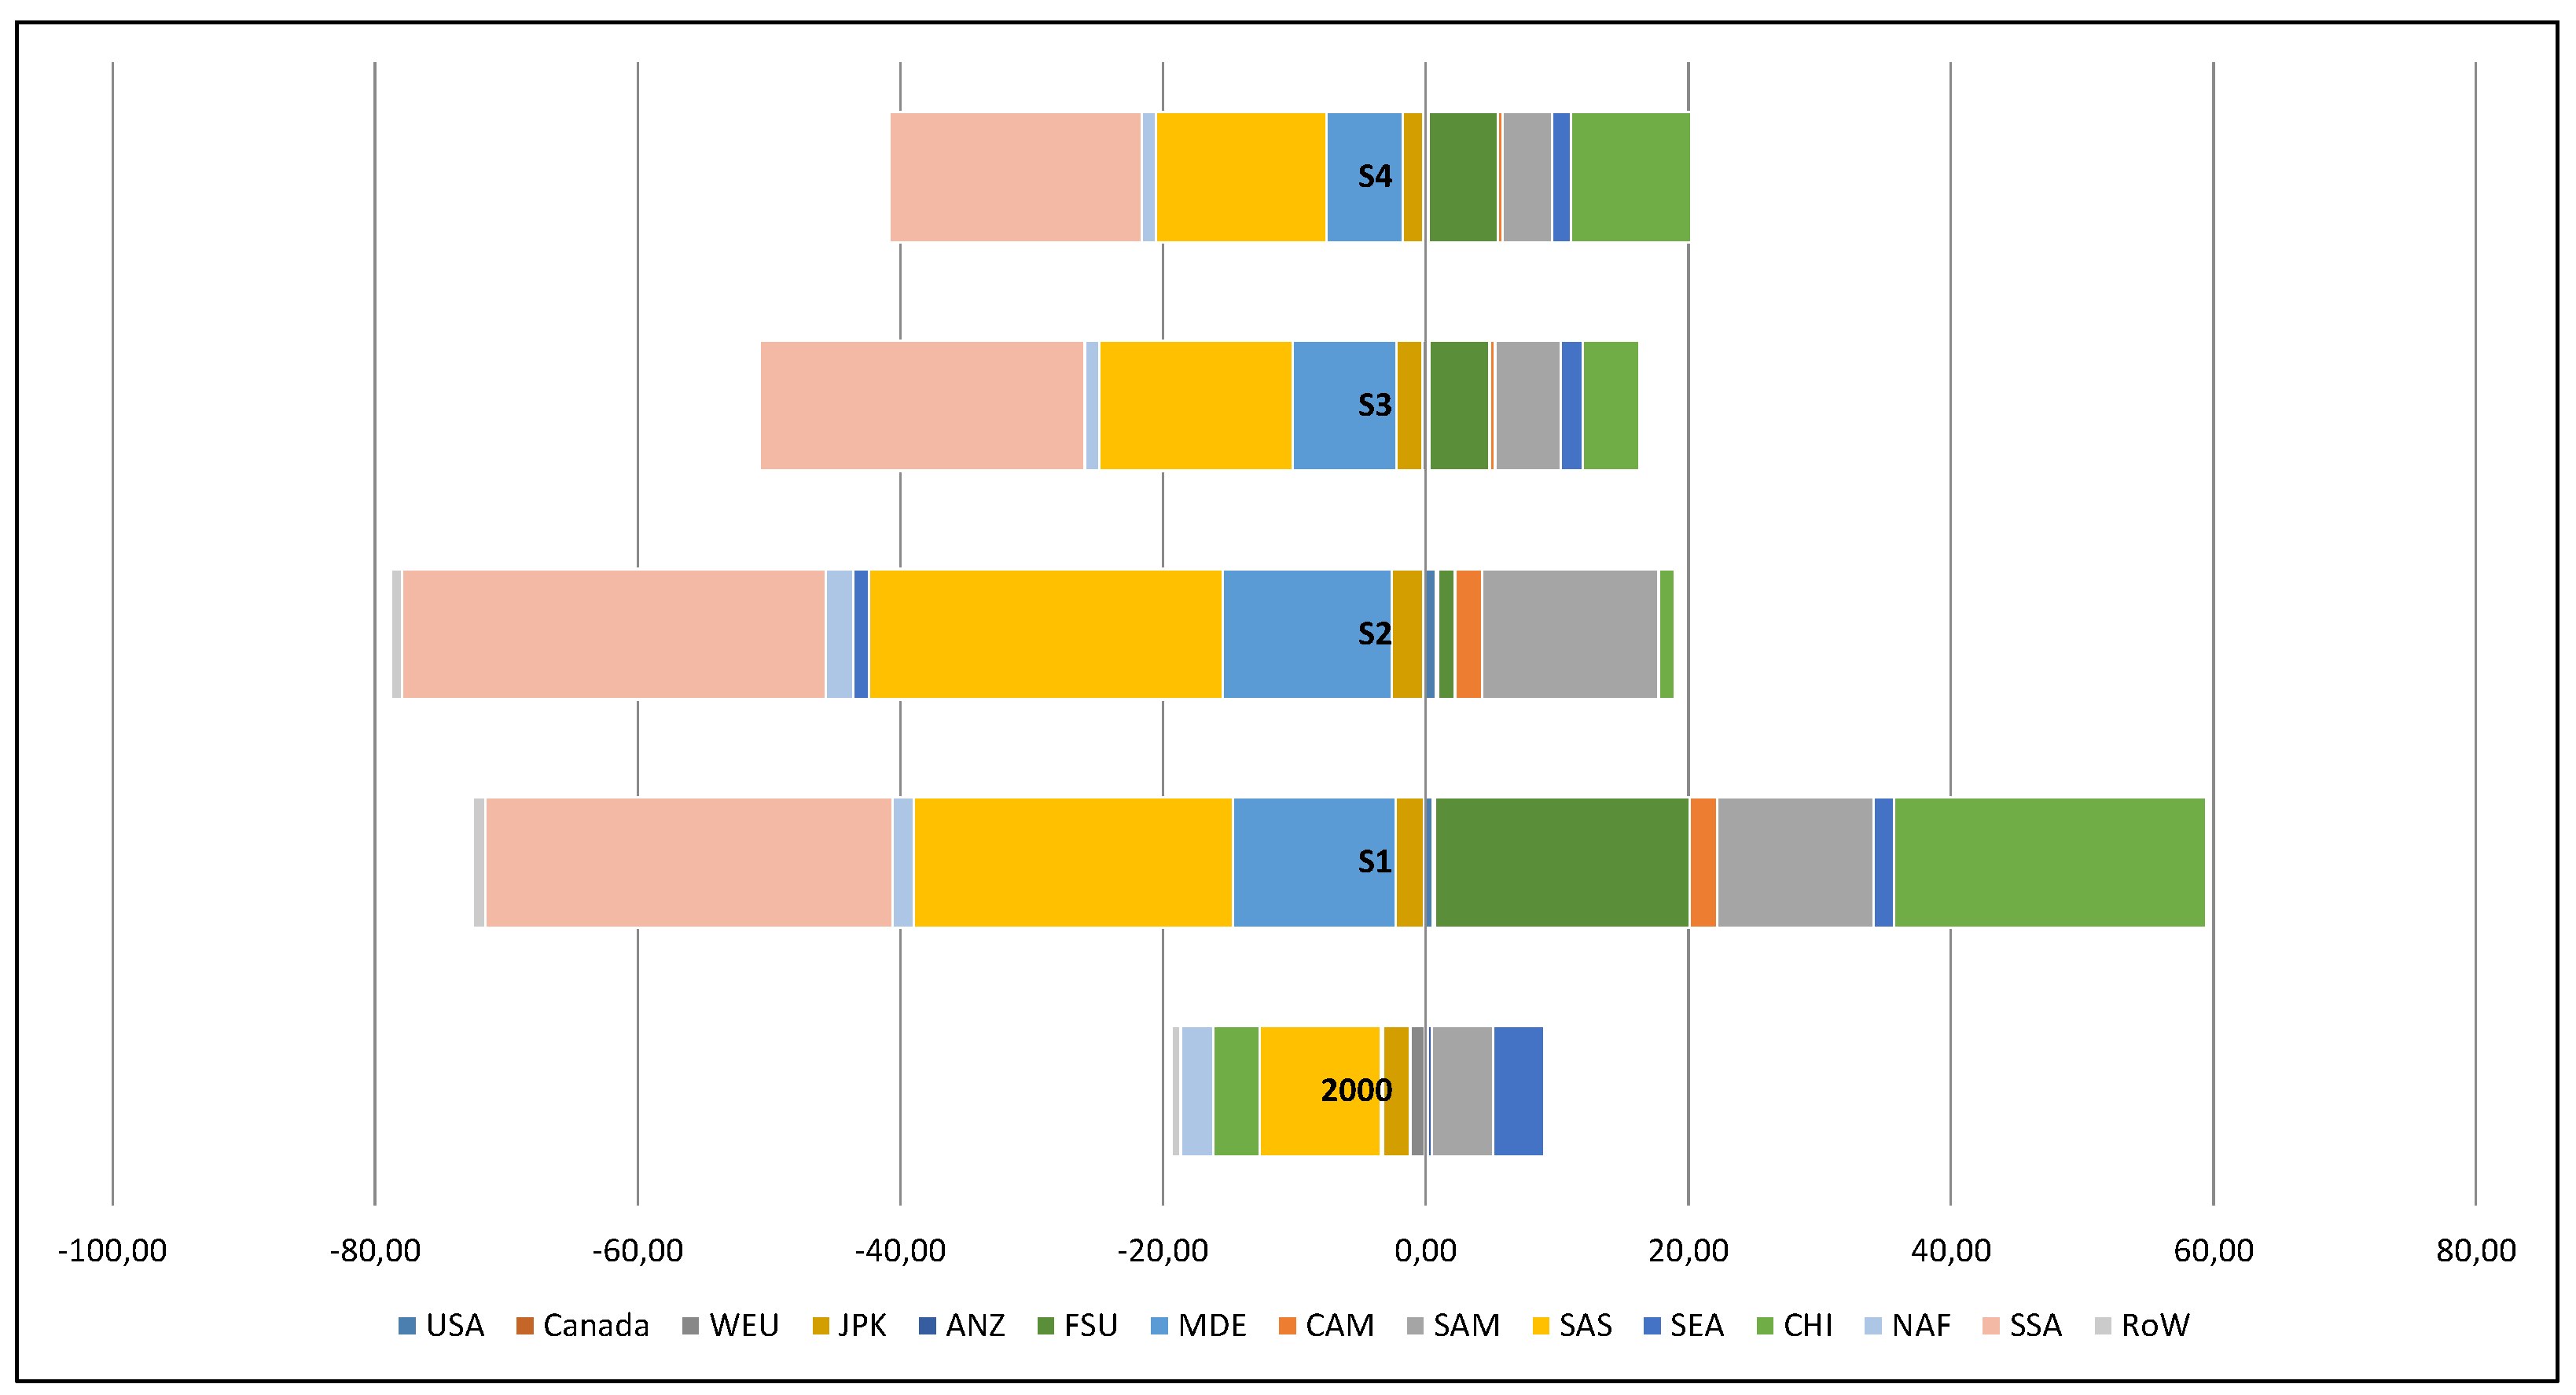
Eastern Europe (EEU), a net virtual water exporter in 2000, remains so in 2050. It considerably increases its net virtual water export, by +100% S4 up to +500% in S2 compared to 2000 (Figure 5). Its virtual water exports are higher than its imports from all the regions except the USA, Canada, CHI, SAM, FSU, CAM and ANZ in 2050. The largest net virtual water flow from EEU is to SSA, MDE and SAS in 2050. Being a net virtual water exporter to CHI and FSU in 2000, EEU becomes a net virtual water importer from these regions in 2050. Among the scenarios, net virtual water import by EEU is highest in S1 and lowest in S3.
Figure 6 shows the net virtual water flows from/to WEU and EEU by their green, blue and grey components. WEU is a net blue virtual water importer in 2000. In 2050, WEU becomes a net blue virtual water exporter in S2 and S4. By 2050, most of the net blue virtual water flows from WEU are to SSA, SAS and MDE and net blue virtual water imports to WEU are from SAM, the USA and ANZ. From the green water perspective, WEU is a net virtual water importer in all scenarios. As for the grey component, WEU continues to be a net importer in 2050 and increases its net virtual water import by +143% in S1, +29% in S2, +74% in S3. EEU is a net virtual water exporter in terms of green and blue components in 2050. It is a net grey virtual water importer in S1, S3 and S4 and exporter in S2. The green component has the biggest share in net virtual water exports from EEU.
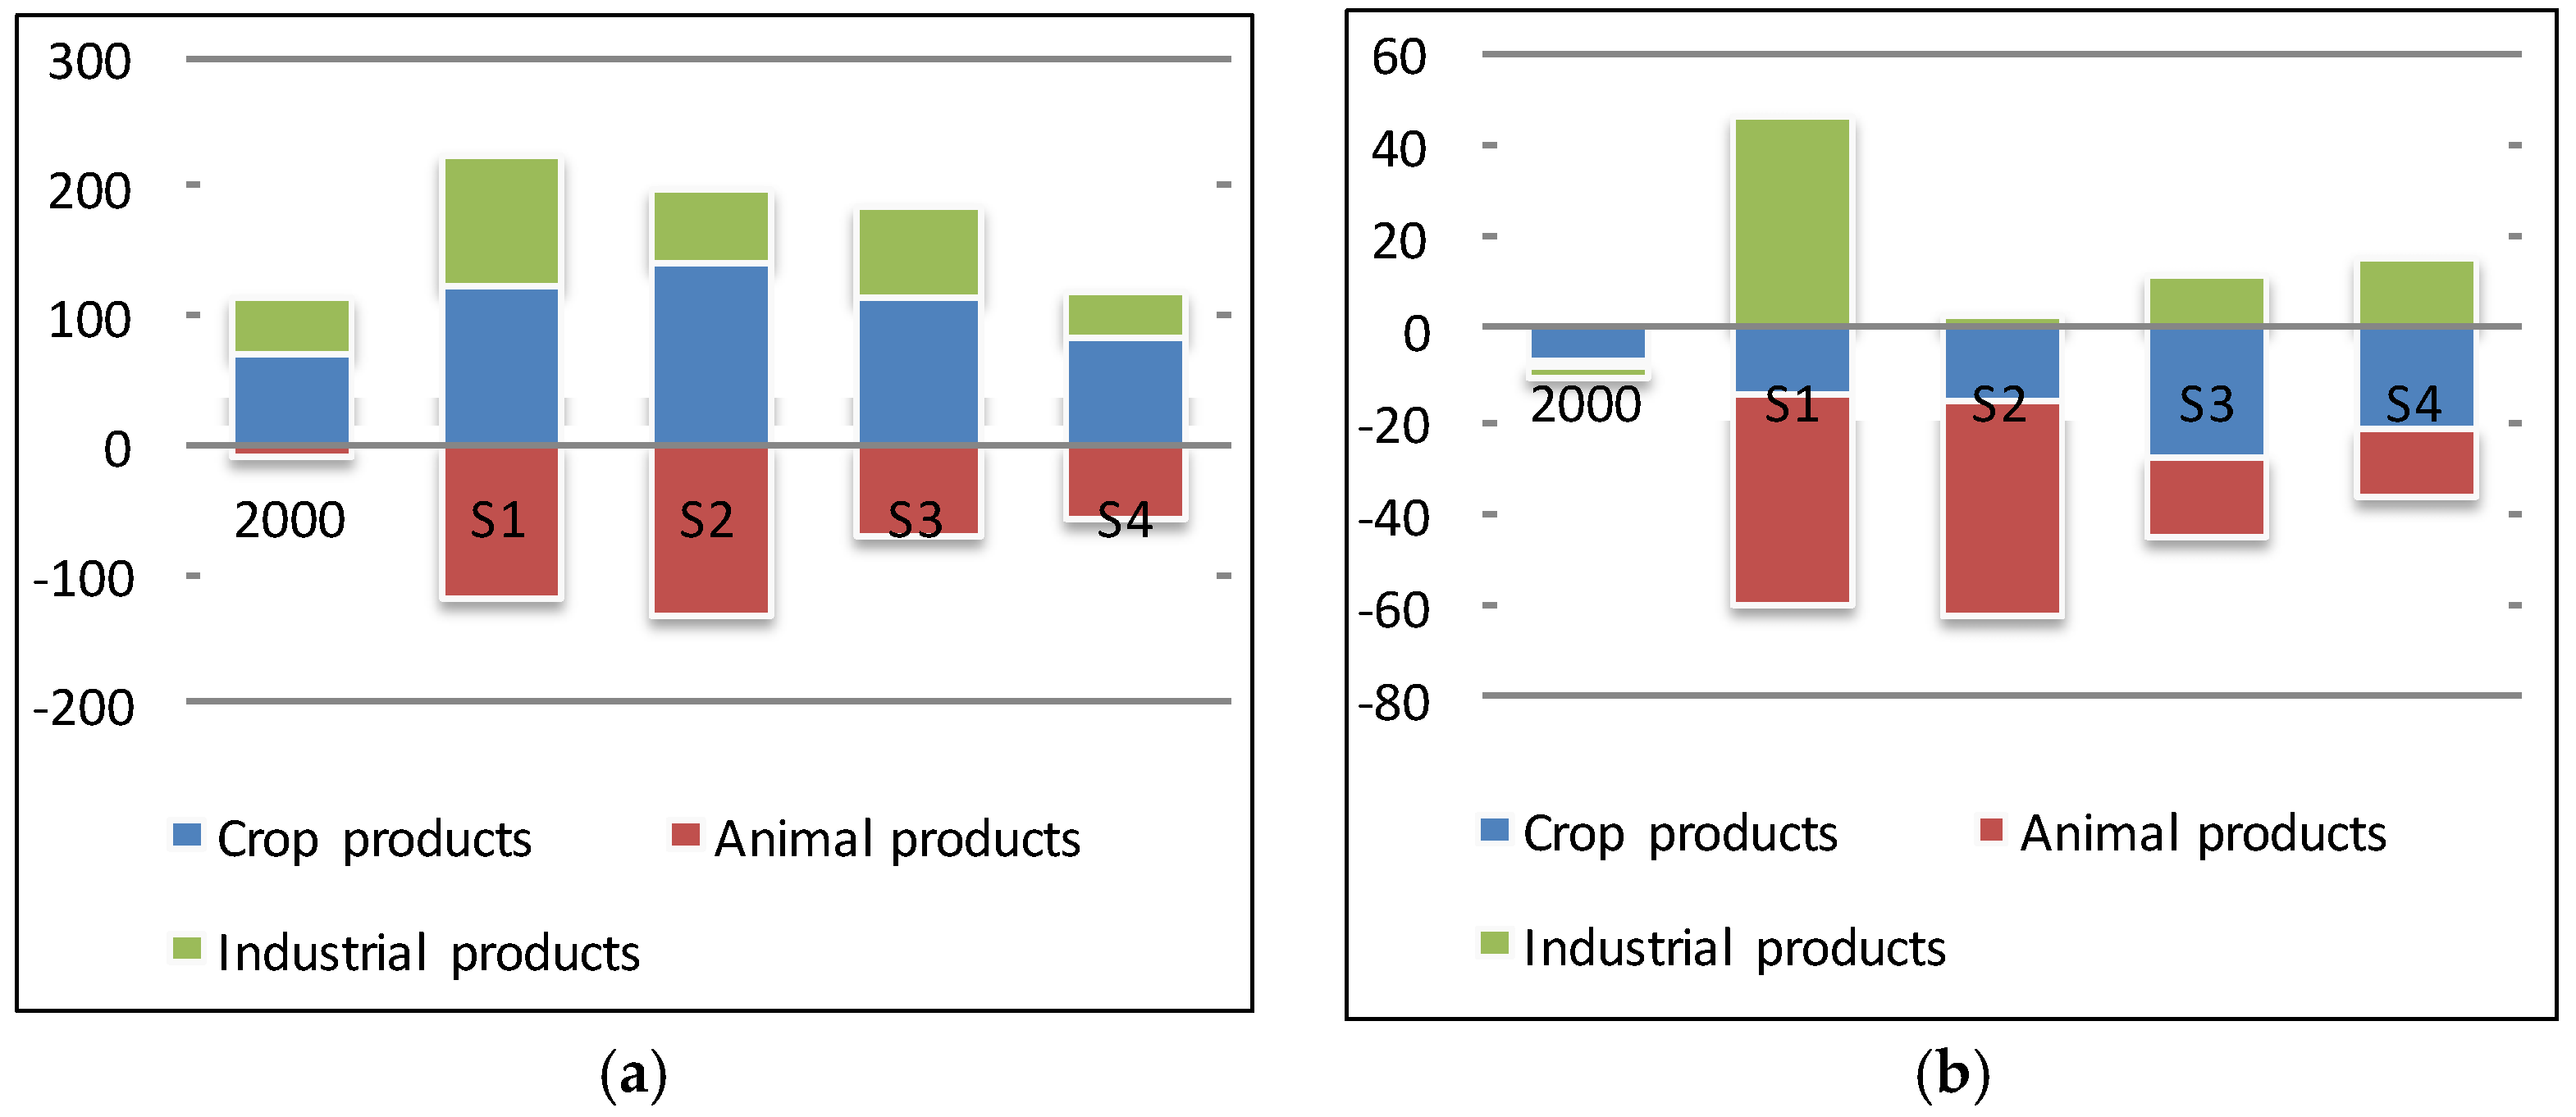
The net virtual water import to WEU is mainly related to crop products and industrial products. The region is a net virtual water exporter considering animal products in 2050 (Figure 7). The net virtual water export related to animal products increases very substantially in EEU as well. Although EEU is a net virtual water exporter in 2000 regarding all product groups, it becomes a net virtual water importer related to industrial products in 2050.
The virtual water export from EEU to WEU is larger than imports, therefore a net virtual water flow from EEU to WEU is observed in 2000. This continues towards 2050 but the net virtual water import by WEU from EEU is reduced largely in S1, by −90%.
Figure 8 shows net virtual water imports per nation in Europe for 2000 and four scenarios. All WEU countries are net virtual water importers in 2000. Countries like France, Spain, Ireland, Denmark, Greece and the Netherlands become net virtual water exporters in S1 and S2. In particular, the change in France is quite large. The UK, Italy, Portugal, Sweden, Norway, Finland, Germany, Austria, Belgium, Switzerland, Malta, Cyprus and Iceland remain net virtual water importers in S1 and S2. The net virtual water flow changes direction for some countries in S3. Spain and the Netherlands are net importers in S3. France, Denmark, Greece, and Ireland are net virtual water exporters in S3 and S4. Romania, Bulgaria, Serbia and Montenegro are net virtual water exporters in 2000 and stay so in 2050. Poland, the Czech Republic and Hungary are net virtual water importers in 2000 and become net virtual water exporters in 2050. Slovakia, Macedonia, Bosnia and Herzegovina, Croatia and Albania are net virtual water importers in 2000 and 2050. Slovenia is a net virtual water exporter in S1 and S2 and a net virtual water importer in S3 and S4.

3.3. Water Footprint of Consumption

The total WF of consumption in WEU increases by 28% and 52% in S1 and S2 compared to 2000. The WF of consumption in WEU decreases by −19% in S3 and −20% in S4. EEU increases its WF of consumption under all scenarios compared to 2000, by +143% in S1, +75% in S2, +17% in S3 and +20% in S4. The WF of consumption per capita in WEU increases by +30% in S1 and +22% in S2 and decreases by −18% in S3 and −28% in S4. EEU has a larger WF of consumption per capita in 2050 than in 2000, with an increase of 186% in S1, 57% in S2, 38% in S3 and 23% in S4. Approximately 70% of the total WF of consumption in WEU is green, in both 2000 and 2050. It is followed by the grey and blue components with shares of 20% and 10%, respectively. The share of green WF of consumption in the total in EEU decreases from 73% in 2000 to 34% in S1, S3 and S4. The share of grey WF of consumption in EEU increases from 23% in 2000 to 60% in S1, S3 and S4. The shares of the green, blue and grey components in the total WF of consumption in EEU in S2 are the same as the shares in 2000.
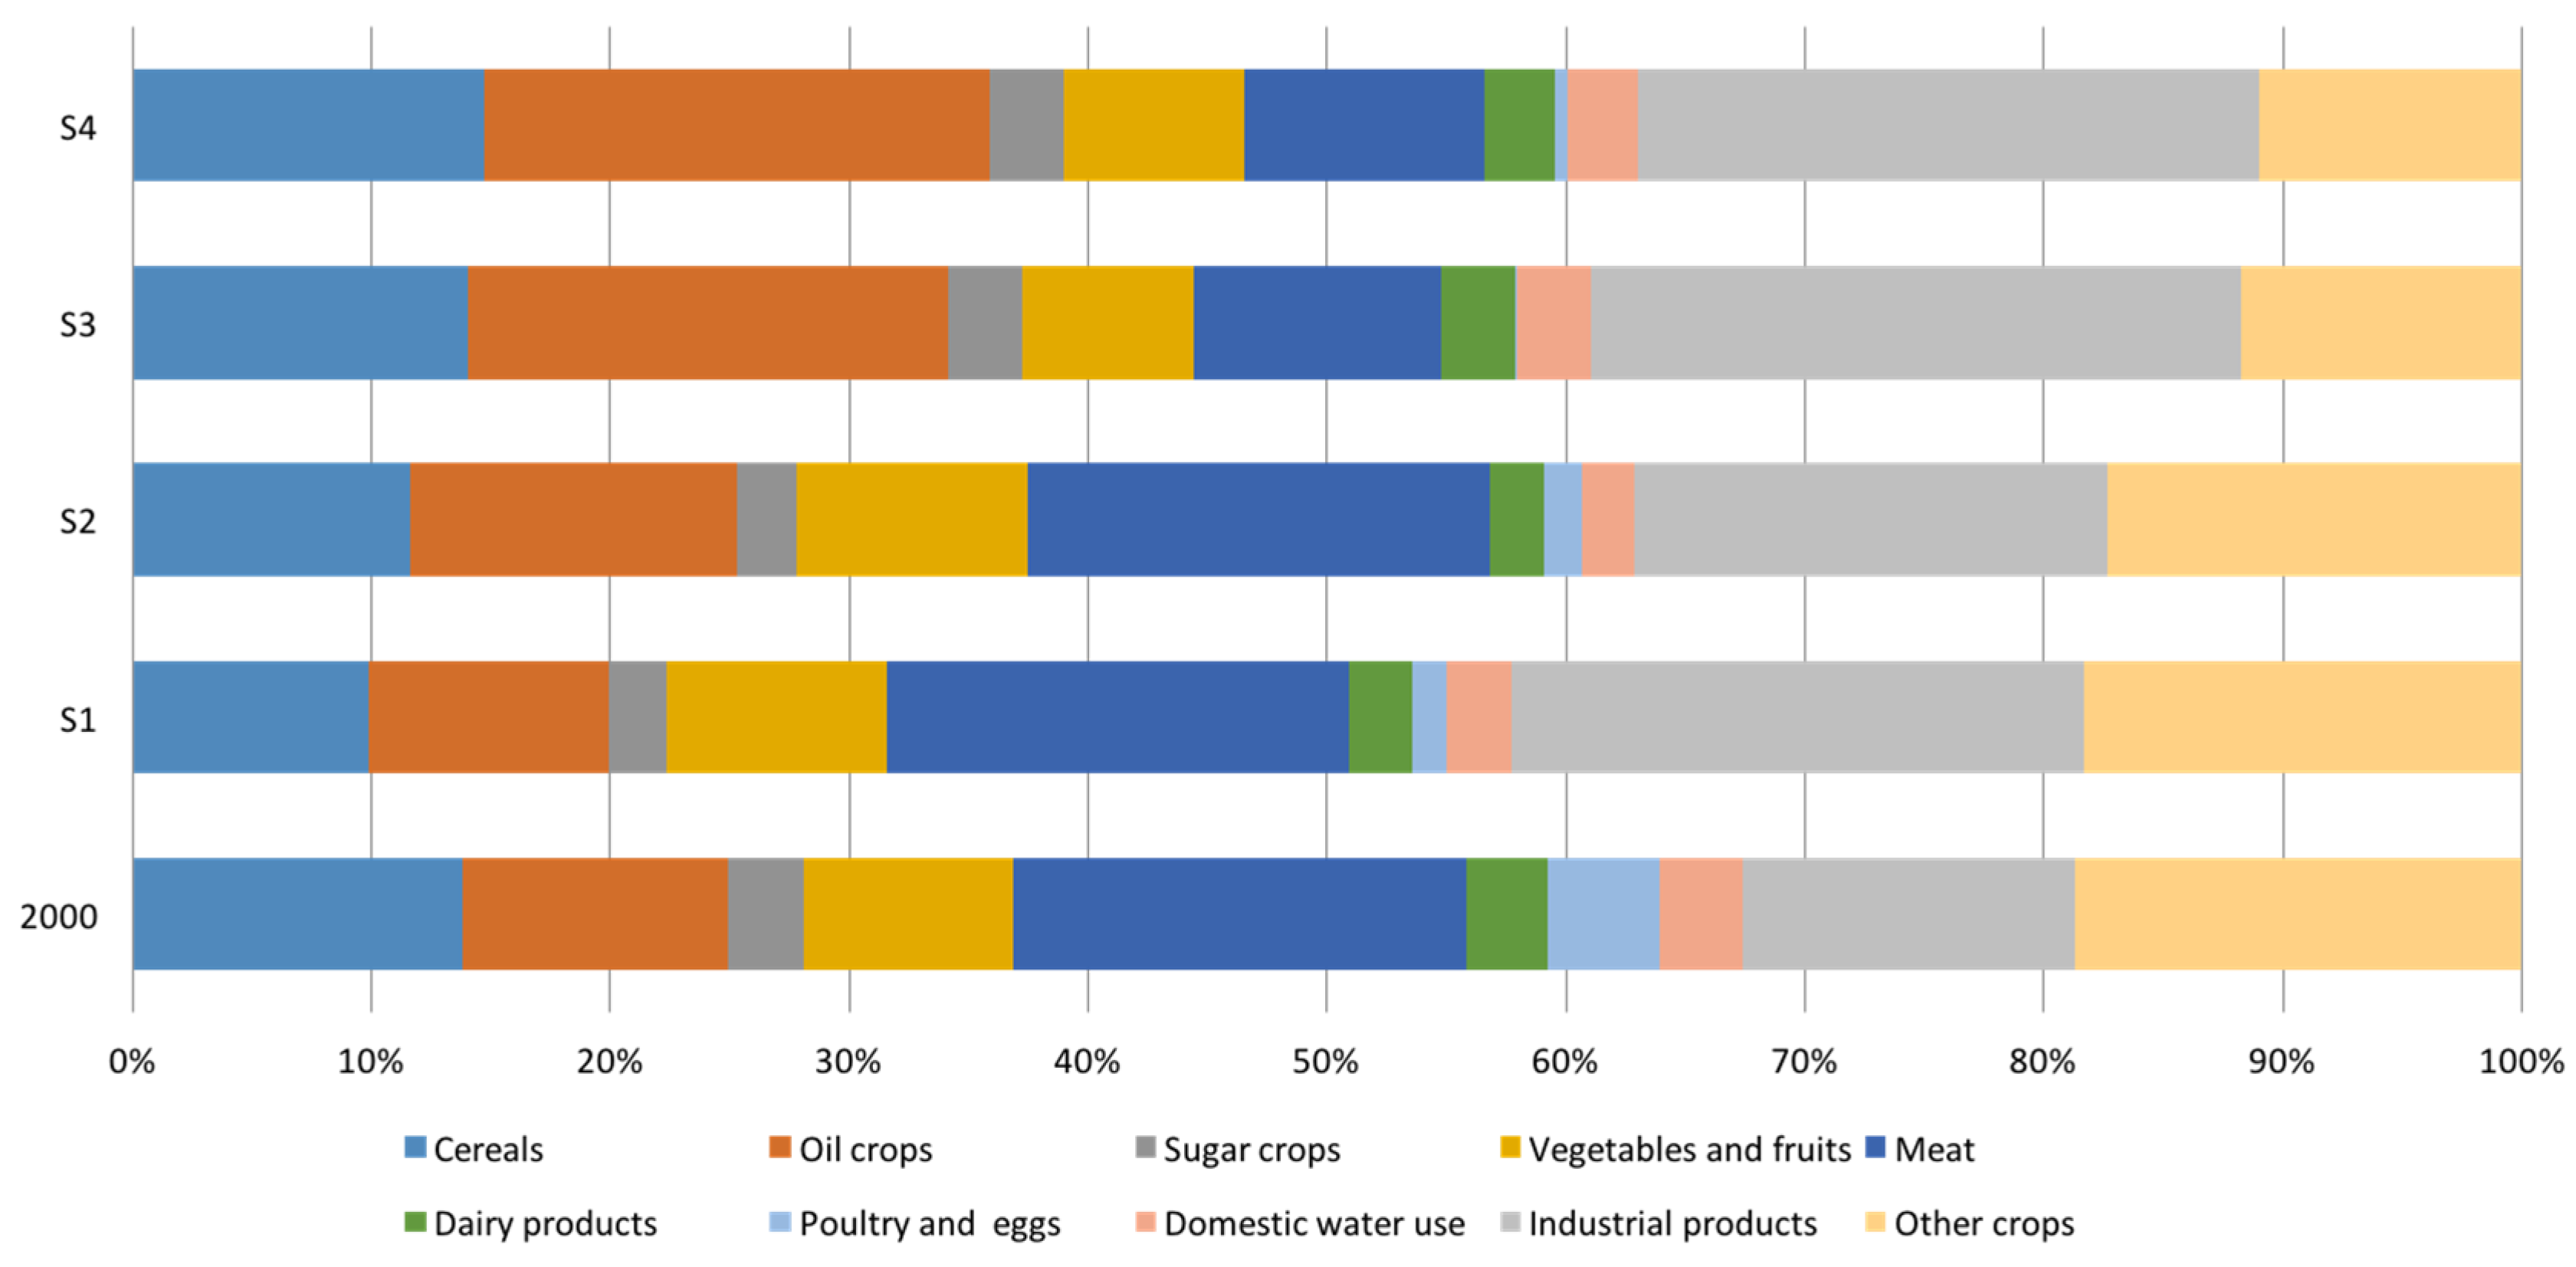
The WF of consumption per commodity group in Europe is given in Figure 9. Meat (from cows, pigs, sheep and goats) and cereals are the product groups with the largest share in the WF of consumption in 2000. The share of meat consumption decreases in S1 and S2. It decreases considerably under the S3 and S4 scenarios. The WF related to the consumption of industrial products doubles its share in 2050 compared to 2000. Other commodities with a large share in the total WF of consumption in 2050 are cereals and oil crops. In particular, the share of oil crops significantly increases in S3 and S4, due to drastic biofuel expansion.
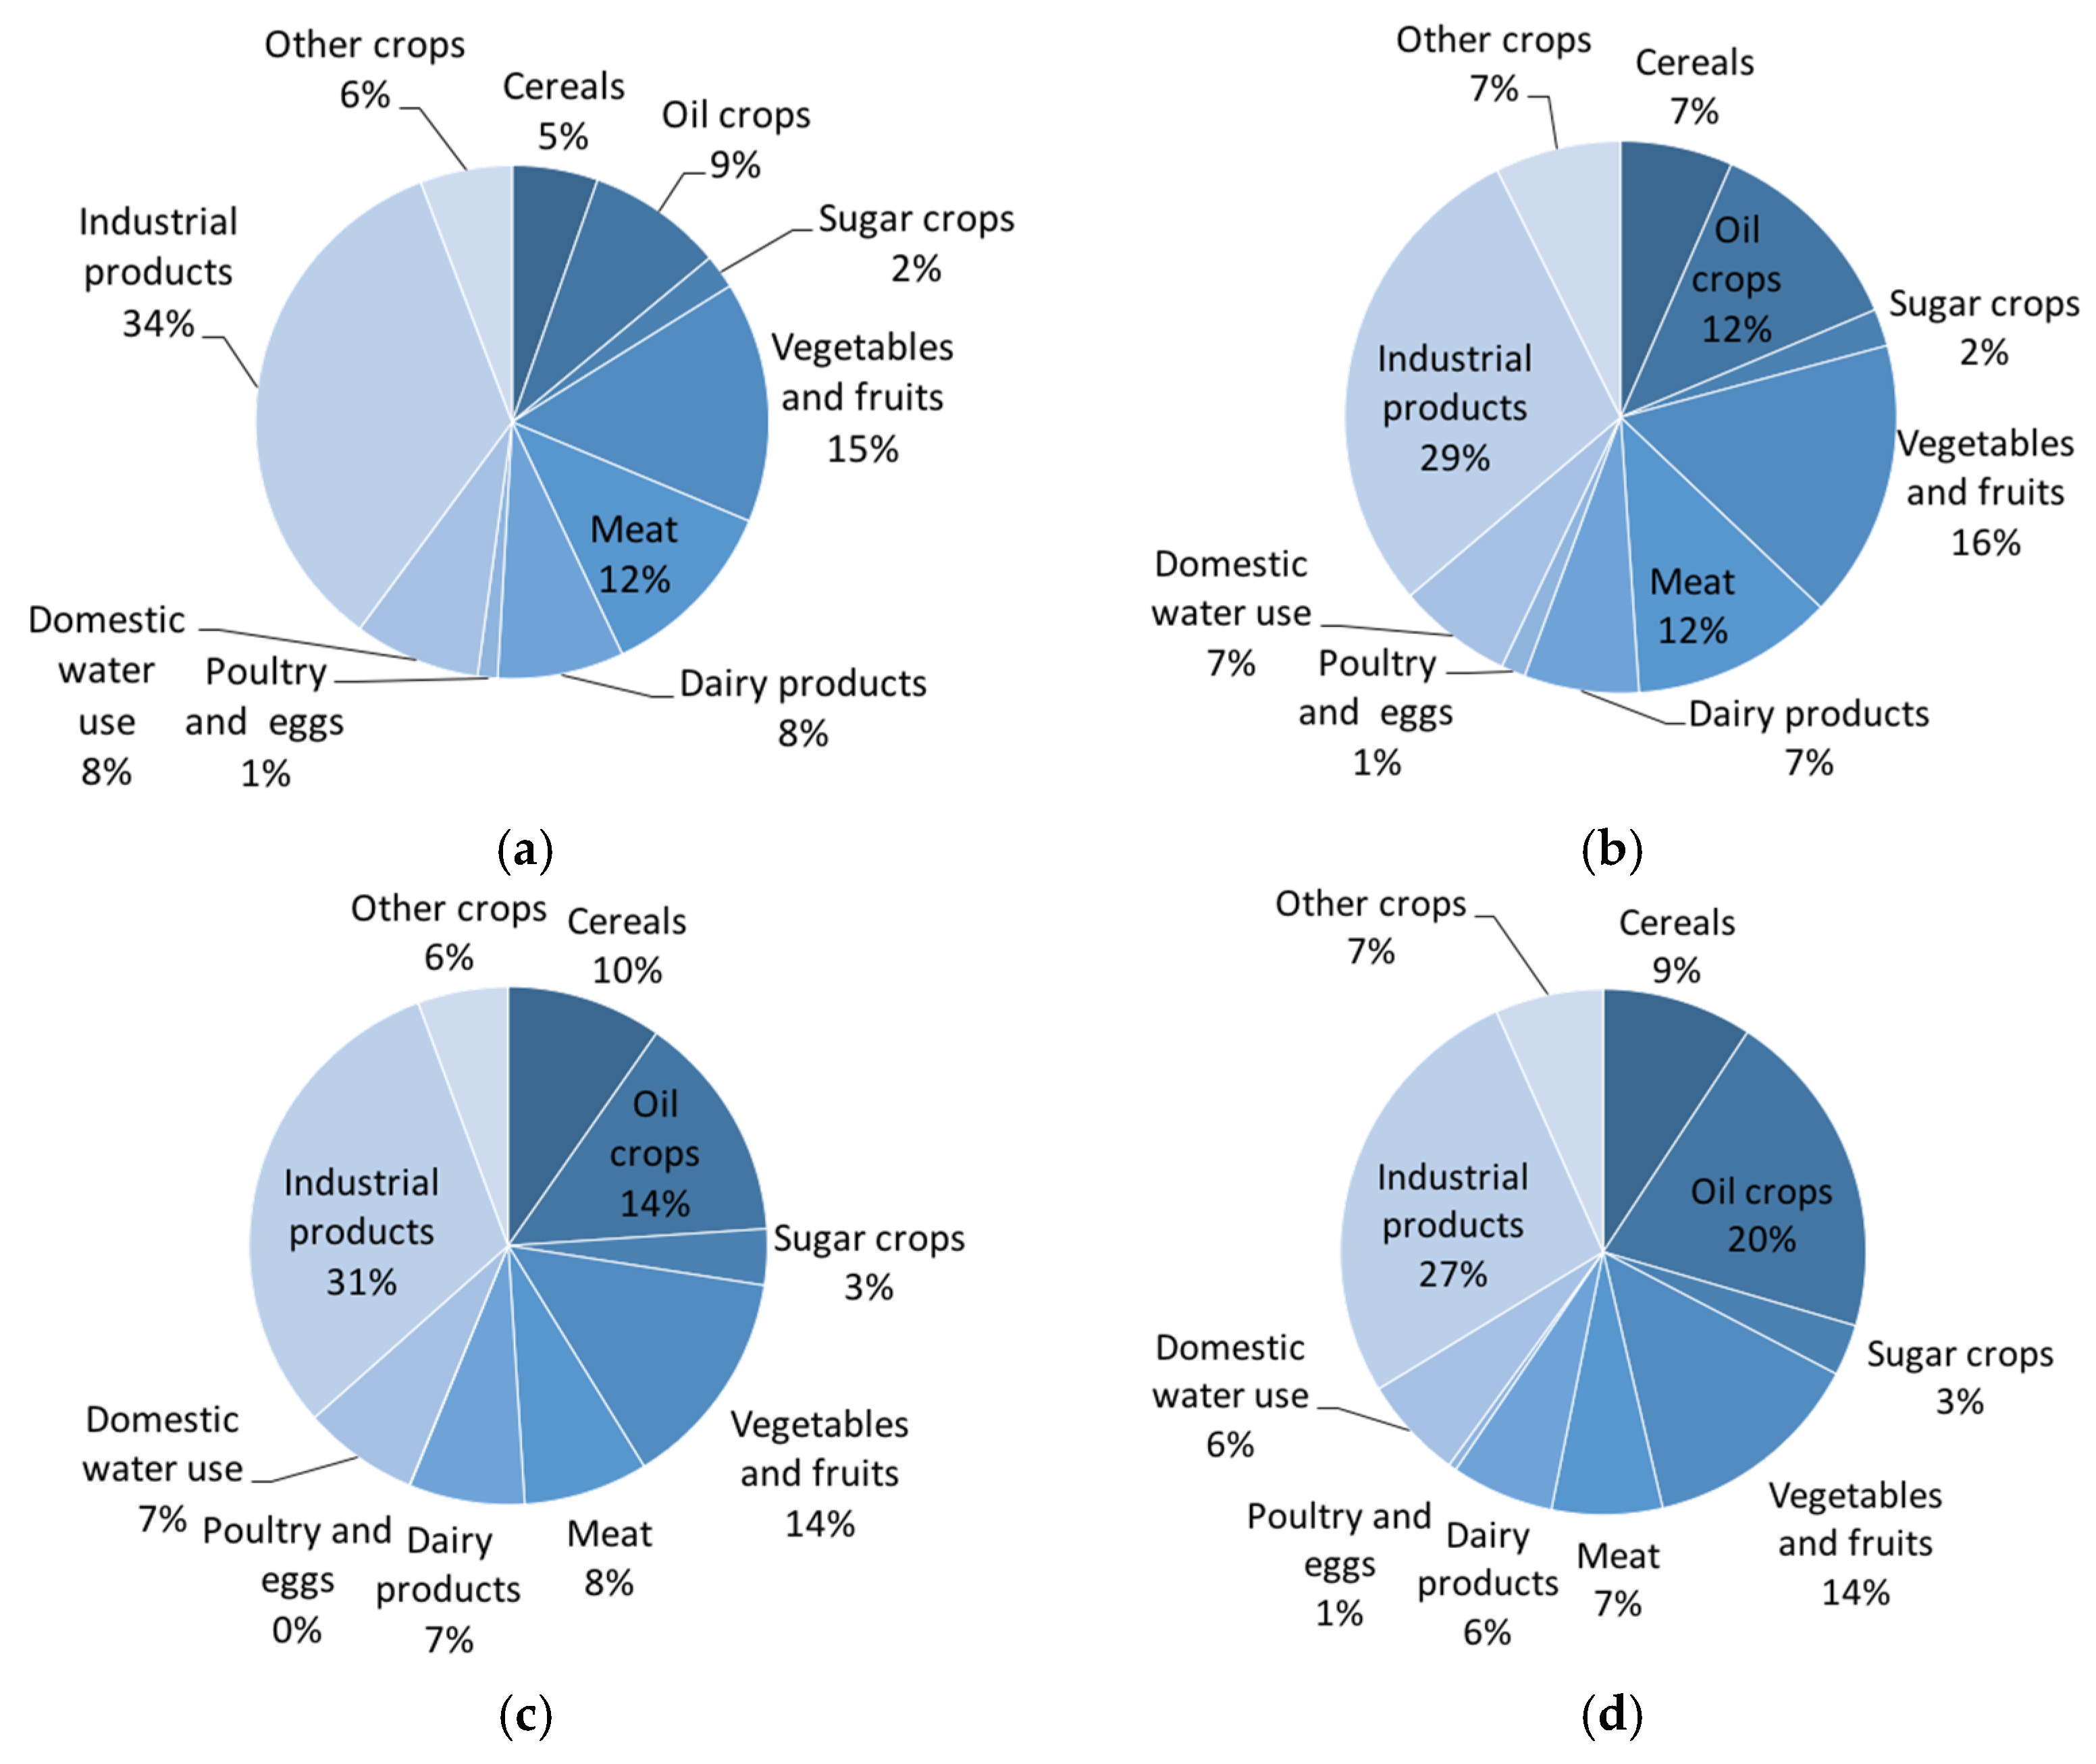
The blue WF of consumption in Europe is mainly due to industrial products in 2050 (Figure 10). Vegetables and fruits are the second biggest contributor to the total blue WF of consumption in 2050 (14%–16%). The share of oil crops in total blue WF of consumption increases with 9% in S1, 12% in S2, 14% in S3 and 20% S4. The share of the blue WF of meat consumption in the total blue WF of consumption is 12% in S1 and S2, 8% in S3 and 7% in S4. Other product groups with a large share in the total blue WF of consumption are dairy products, domestic water supply and cereals, under all scenarios.
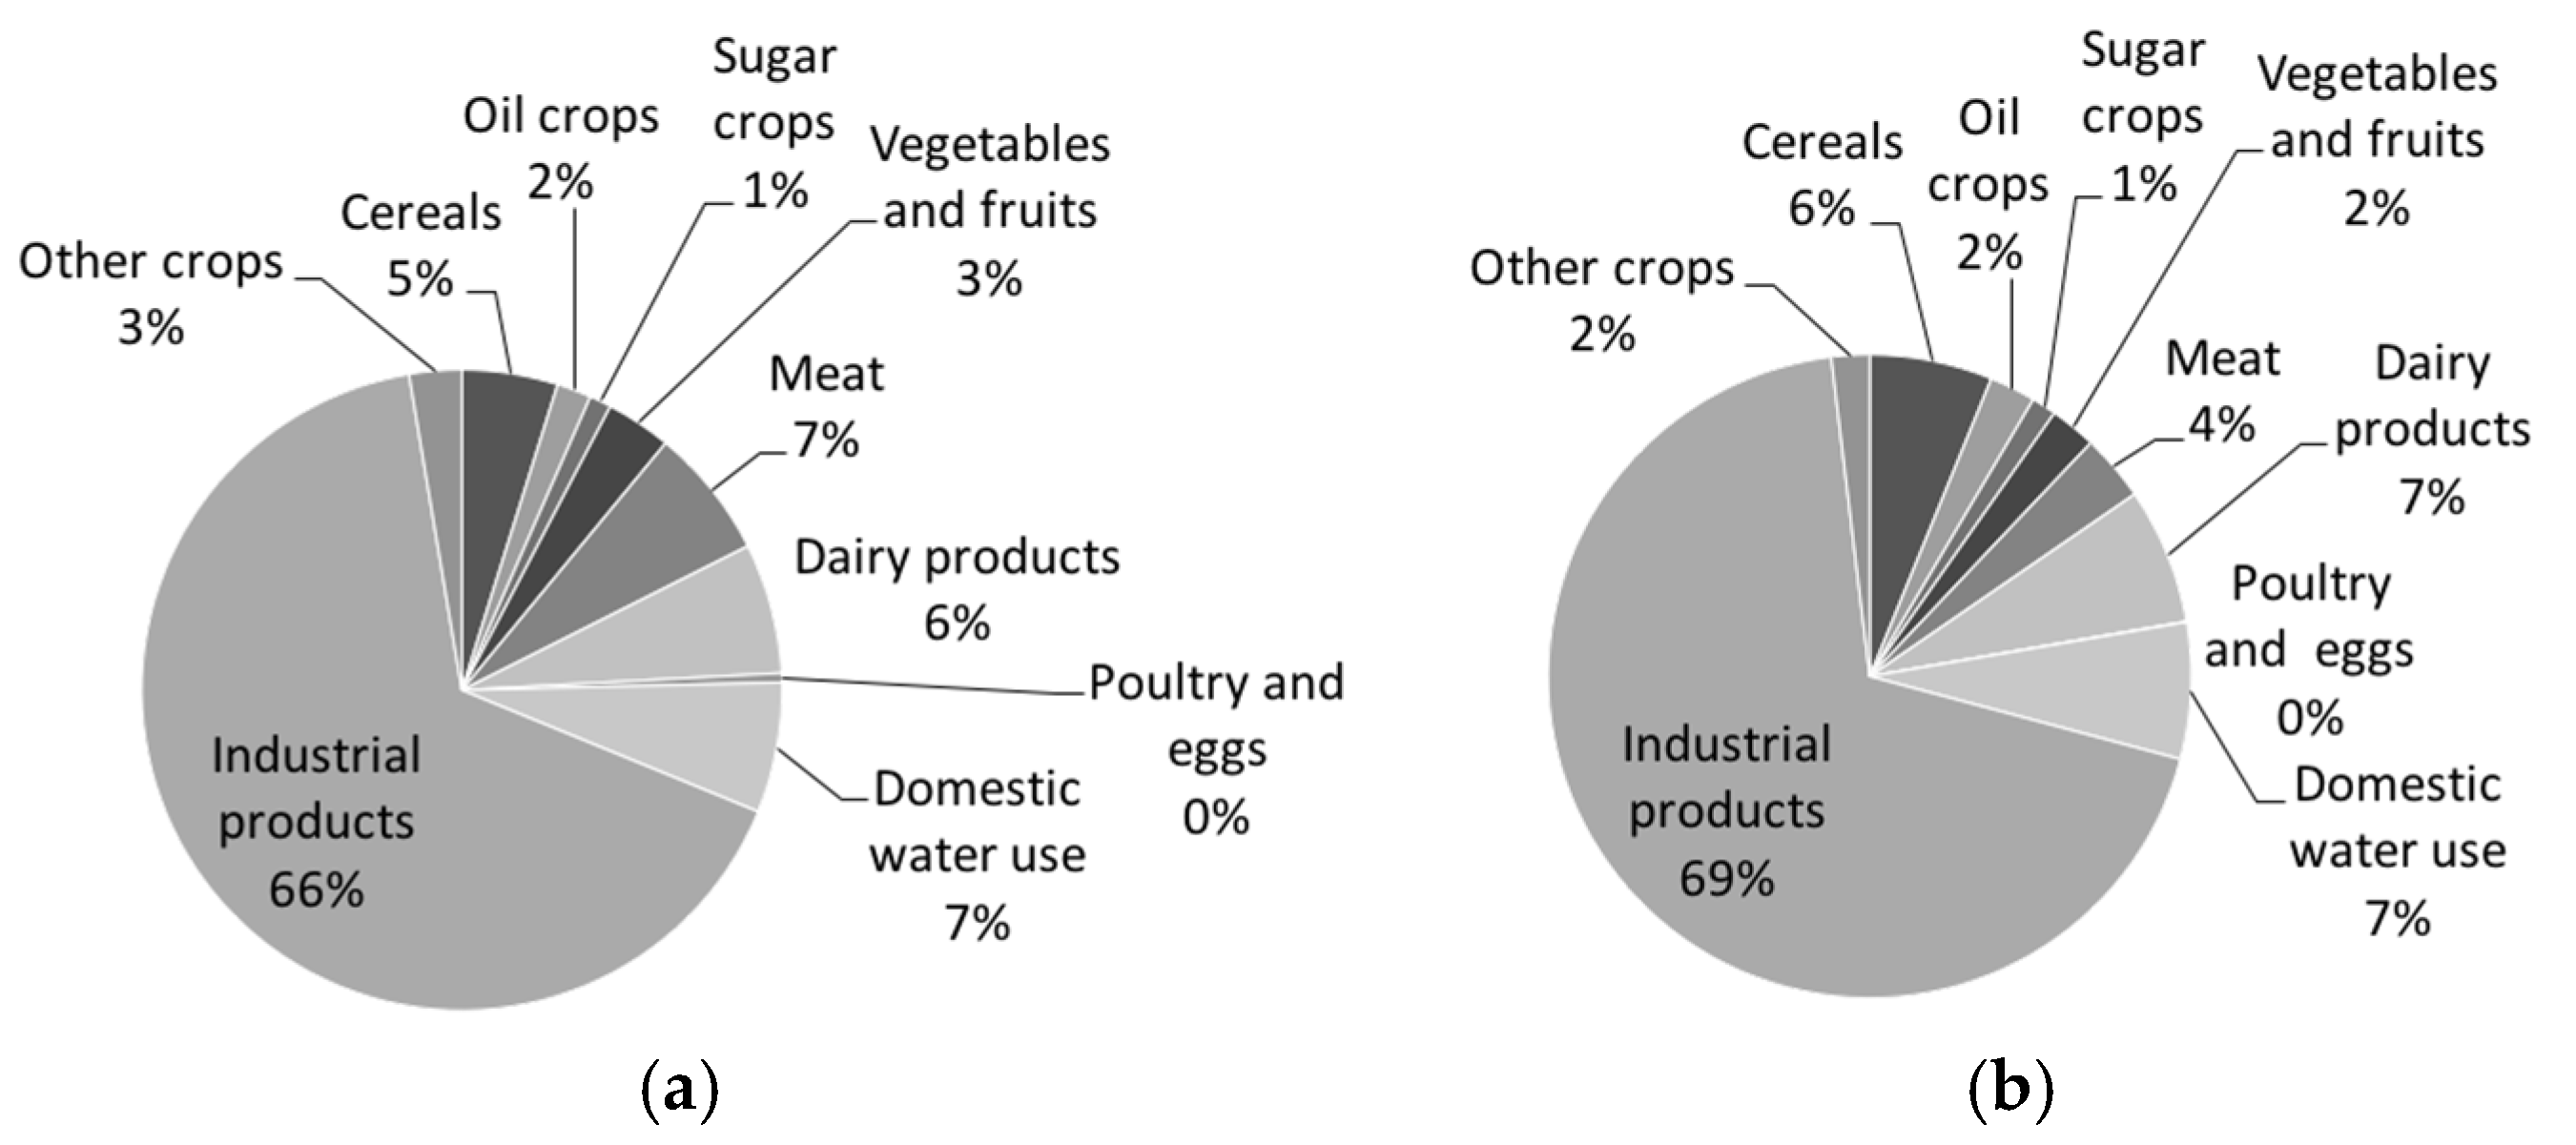
The grey WF of consumption is mainly from industrial products, with a share of 66% in S1 and S2 and 69% in S3 and S4. Domestic water supply is another large contributor to the total grey WF of consumption, i.e., 7% of the total grey WF of consumption under all scenarios. Other product groups with a large share in the total grey WF of consumption are dairy products (6%–7%), cereals (5%–6%), meat (4%–7%) and vegetables and fruits (2%–3%). The composition of the grey WF of consumption does not differ much from scenario to scenario (Figure 11).
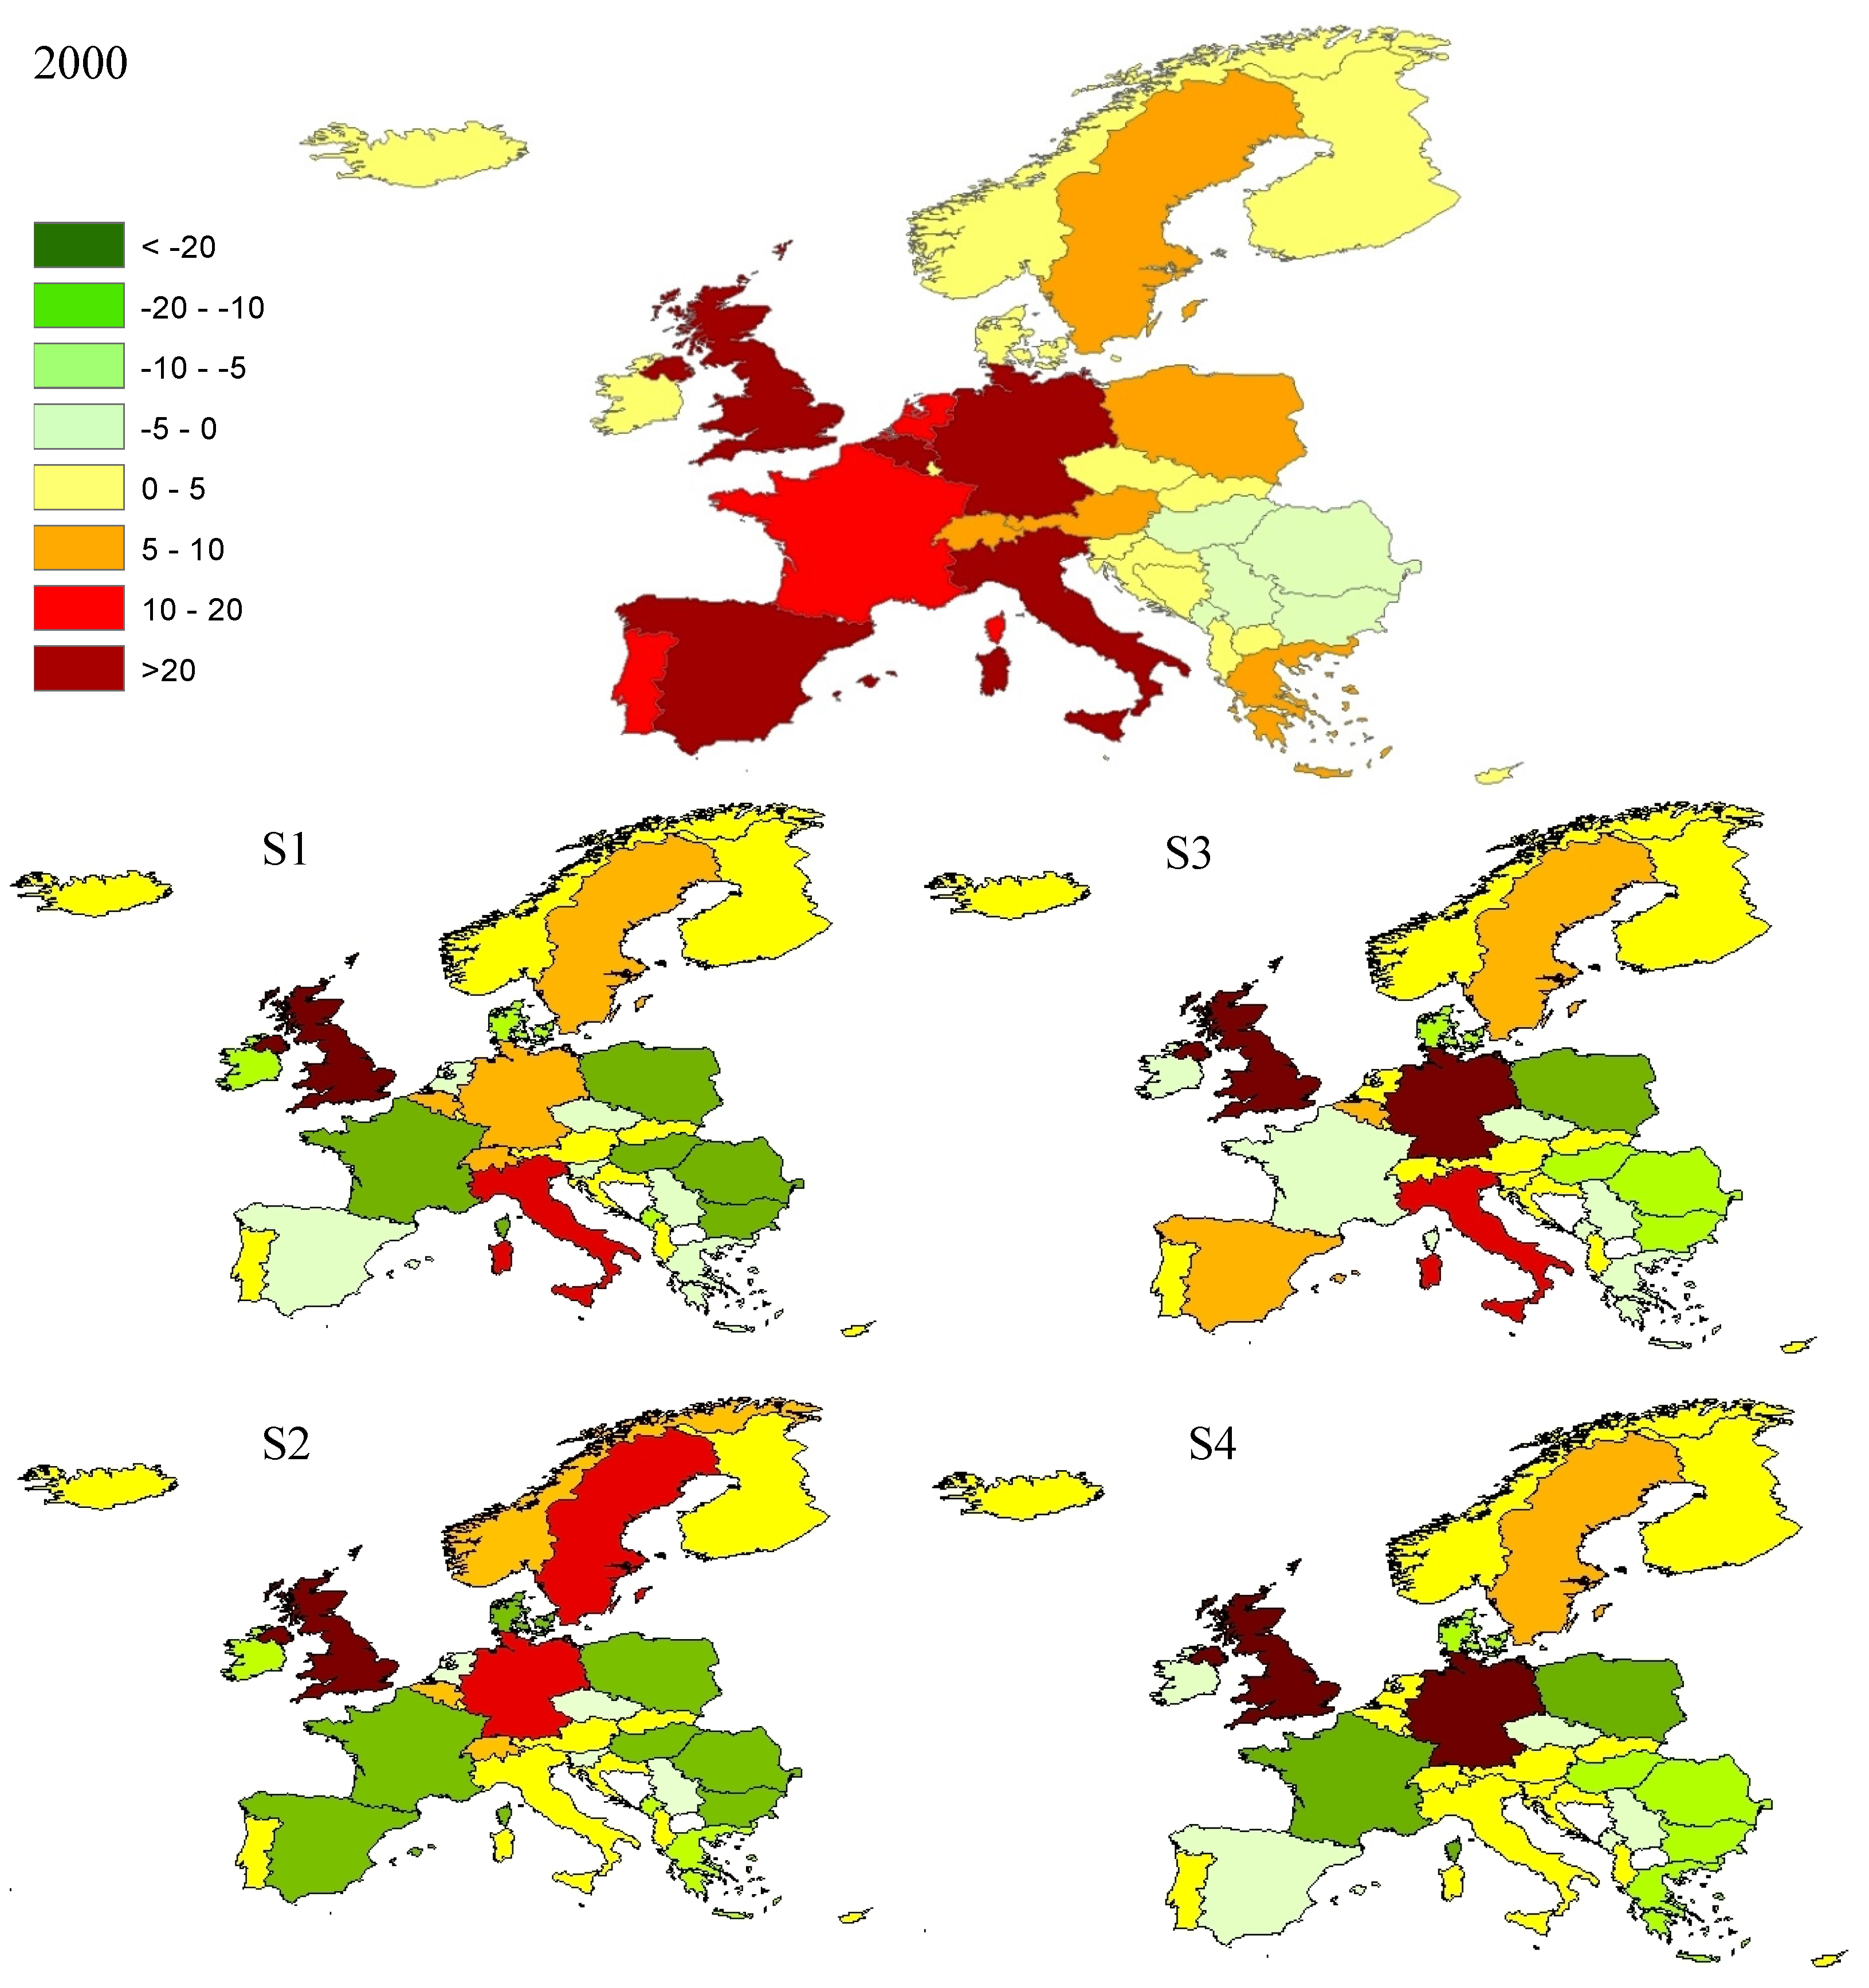
The change in WF of consumption per capita relative to 2000 for the nations of Europe is shown in Figure 12. All WEU countries have a larger WF of consumption per capita in S1 and S2 than 2000, except Denmark, Ireland, Luxembourg and the Netherlands. Belgium, Sweden, Cyprus, Iceland and Malta have a larger WF of consumption per capita in 2050 than in 2000. Austria, France, Greece, Italy, Norway, Portugal, Spain, Switzerland and the UK decrease their WF of consumption in S3 and S4 compared to 2000. Italy, the Netherlands, Spain, Switzerland, Luxembourg and the UK reduce their WF of consumption per capita values by more than −20% in S4. Within WEU, Cyprus, Malta and Iceland significantly increase their WF of consumption per capita in S1 and S2. Spain has the largest WF of consumption per capita in 2000. In 2050, Malta has the largest WF of consumption per capita.
In 2050, EEU countries have a larger WF of consumption per capita than in 2000. Bulgaria, Hungary, Croatia, Macedonia and Bosnia and Herzegovina increase their WF of consumption per capita by more than +100% in S1 and S2. Montenegro is the only country in EEU with a reduction in the WF of consumption per capita in S2.
The share of the external WF of consumption in the total WF of consumption increases in WEU in 2050. However, the countries with a relatively large external WF in 2000, like the Netherlands (94% of the total WF), Malta (90%) and Belgium (90%), significantly reduce this ratio, to below 50% under all scenarios. The UK, Switzerland and Luxembourg have an external WF of more than 60% of the total WF of consumption in all scenarios. Spain significantly reduces its share of external WF of consumption in 2050. All of the EEU counties reduce the share of external WF of consumption in S2, S3 and S4.

4. Discussion and Conclusions

This study is the first European water footprint scenario study showing how the water footprint of Europe will change towards 2050 under four scenarios that differ in terms of the directions of a few main drivers of change. We included the major drivers of change, but we excluded the impact of resource availability. Water and land availability constraints are addressed implicitly in the production and trade scenarios. Furthermore, climate change effects on the water footprint per unit of crop are not addressed: we excluded the effect of increased carbon dioxide concentrations on crop yields and climate change effects on crop water use. Another limitation is that we assumed a homogeneous and single industrial sector in estimating the water footprint of industrial production and consumption. Furthermore, we did not include reducing food waste in any of the scenarios, while the potential water saving through reducing food waste is substantial [19].
The study shows that the most critical driver of change that affects the future WF of production and consumption for Europe is the consumption pattern. The WFs of production and consumption in WEU increase under the high-meat scenarios (S1 and S2) and decrease under the low-meat scenarios (S3 and S4). The criticality of meat consumption in Europe’s future water footprint has been noted before by Vanham et al. [20,21]. The additional water demands resulting from growing biofuel needs will put additional pressure on European water resources (S3 and S4), a finding that supports Gerbens-Leenes et al. [22]. The European countries with a large ratio of external to total WF of consumption in 2000 decrease their dependencies on foreign water resources (e.g., the Netherlands, Belgium and Luxembourg).
The findings from this study may provide a further assessment of how we can reduce future freshwater scarcity. We show that reducing Europe’s water footprint to sustainable levels is possible even with increasing populations, provided that consumption patterns change. This study can help to guide policy development at national and European levels, and to set priorities in order to achieve sustainable and equitable use of our limited fresh water resources.

Acknowledgments

The initial part of the research was carried out as part of the OPEN-EU project, funded by the EU Seventh Framework Programme (Grant No. 227065). The study was completed within the framework of the Panta Rhei Research Initiative of the International Sciences (IAHS). The latter stage of the research was funded by the University of Twente.

Author Contributions

A. Ertug Ercin and Arjen Y. Hoekstra conceived and designed the study; A. Ertug Ercin performed the calculations; A. Ertug Ercin and Arjen Y. Hoekstra analyzed the data and wrote the paper.

Conflicts of Interest

The authors declare no conflict of interest.

References

  1. Alcamo, J.; Döll, P.; Henrichs, T.; Kaspar, F.; Lehner, B.; Rösch, T.; Siebert, S. Global estimates of water withdrawals and availability under current and future “business-as-usual” conditions. Hydrol. Sci. J. 2003, 48, 339–348. [Google Scholar] [CrossRef]
  2. Bruinsma, J. The Resource Outlook to 2050: By How Much Do Land, Water and Crop Yields Need to Increase by 2050, Expert Meeting on How to Feed the World by 2050, 24–26 June 2009; Food and Agriculture Organization of the United Nations: Rome, Italy, 2009. [Google Scholar]
  3. Rosegrant, M.W.; Cai, X.; Cline, S.A. Global Water Outlook to 2025; International Food Policy Research Institute: Washington, DC, USA, 2002. [Google Scholar]
  4. Rosegrant, M.W.; Ringler, C.; Zhu, T. Water for agriculture: Maintaining food security under growing scarcity. Annu. Rev. Environ. Resour. 2009, 34, 205–222. [Google Scholar] [CrossRef]
  5. Vörösmarty, C.J.; Green, P.; Salisbury, J.; Lammers, R.B. Global water resources: Vulnerability from climate change and population growth. Science 2000, 289, 284–288. [Google Scholar] [CrossRef] [PubMed]
  6. De Fraiture, C.; Wichelns, D.; Rockström, J.; Kemp-Benedict, E.; Eriyagama, N.; Gordon, L.J.; Hanjra, M.A.; Hoogeveen, J.; Huber-Lee, A.; Karlberg, L. Looking ahead to 2050: Scenarios of alternative investment approaches. In Water for Food, Water for Life: A Comprehensive Assessment of Water Management in Agriculture; Earthscan: London, UK, 2007; pp. 91–145. [Google Scholar]
  7. De Fraiture, C.; Wichelns, D. Satisfying future water demands for agriculture. Agr. Water Manag. 2010, 97, 502–511. [Google Scholar] [CrossRef]
  8. Ercin, A.E.; Hoekstra, A.Y. Water footprint scenarios for 2050: A global analysis. Environ. Int. 2014, 64, 71–82. [Google Scholar] [CrossRef] [PubMed]
  9. Hoekstra, A.Y.; Chapagain, A.K.; Aldaya, M.M.; Mekonnen, M.M. The Water Footprint Assessment Manual: Setting the Global Standard; Earthscan: London, UK, 2011. [Google Scholar]
  10. UN. World Population Prospects: The 2010 Revision, CD-ROM ed.; United Nations, Department of Economic and Social Affairs, Population Division: New York, NY, USA, 2011. [Google Scholar]
  11. CIESIN. Country-Level GDP and Downscaled Projections Based on the A1, A2, B1, and B2 Marker Scenarios, 1990–2100; Center for International Earth Science Information Network (CIESIN), Columbia University: New York, NY, USA, 2002. [Google Scholar]
  12. Erb, K.-H.; Haberl, H.; Krausmann, F.; Lauk, C.; Plutzar, C.; Steinberger, J.K.; Müller, C.; Bondeau, A.; Waha, K.; Pollack, G. Eating the Planet: Feeding and Fuelling the World Sustainably, Fairly and Humanely—A Scoping Study; Social Ecology Working Paper No. 116; Institute of Social Ecology and PIK Potsdam: Vienna, Austria, 2009. [Google Scholar]
  13. Nakicenovic, N.; Alcamo, J.; Davis, G.; De Vries, B.; Fenhann, J.; Gaffin, S.; Gregory, K.; Grübler, A.; Jung, T.Y.; Kram, T.; et al. Special Report on Emissions Scenarios: A Special Report of Working Group III of the Intergovernmental Panel on Climate Change; IPCC: Cambridge, UK, 2000. [Google Scholar]
  14. Calzadilla, A.; Rehdanz, K.; Tol, R.S.J. Trade liberalization and climate change: A computable general equilibrium analysis of the impacts on global agriculture. Water 2011, 3, 526–550. [Google Scholar] [CrossRef] [Green Version]
  15. FAO. FAOSTAT Commodity Balance Sheets; Food and Agriculture Organization of the United Nations: Rome, Italy, 2012. [Google Scholar]
  16. Mekonnen, M.M.; Hoekstra, A.Y. The green, blue and grey water footprint of crops and derived crop products. Hydrol. Earth Syst. Sci. 2011, 15, 1577–1600. [Google Scholar] [CrossRef]
  17. Mekonnen, M.M.; Hoekstra, A.Y. A global assessment of the water footprint of farm animal products. Ecosystems 2012, 15, 401–415. [Google Scholar] [CrossRef]
  18. Mekonnen, M.M.; Hoekstra, A.Y. Four billion people facing severe water scarcity. Sci. Adv. 2016, 2, e1500323. [Google Scholar] [CrossRef] [PubMed]
  19. Vanham, D.; Bouraoui, F.; Leip, A.; Grizzetti, B.; Bidoglio, G. Lost water and nitrogen resources due to EU consumer food waste. Environ. Res. Lett. 2015, 19, 084008. [Google Scholar] [CrossRef]
  20. Vanham, D.; Hoekstra, A.Y.; Bidoglio, G. Potential water saving through changes in European diets. Environ. Int. 2013, 61, 45–56. [Google Scholar] [CrossRef] [PubMed]
  21. Vanham, D.; Mekonnen, M.M.; Hoekstra, A.Y. The water footprint of the EU for different diets. Ecol. Indic. 2013, 32, 1–8. [Google Scholar] [CrossRef]
  22. Gerbens-Leenes, P.W.; Van Lienden, A.R.; Hoekstra, A.Y.; Van der Meer, T.H. Biofuel scenarios in a water perspective: The global blue and green water footprint of road transport in 2030. Glob. Environ. Chang. 2012, 22, 764–775. [Google Scholar] [CrossRef]
Figure 1. Percentage change in the WF of total production in WEU and EEU relative to 2000.
Water 08 00226 g001
Figure 2. Percentage change of the WF of total production relative to 2000.
Water 08 00226 g002
Figure 3. Percentage change of the blue WF of production relative to 2000.
Water 08 00226 g003
Figure 4. Net virtual water import by Western Europe (WEU) (billion m3/year), specified by world region. Positive values represent net virtual water import to WEU from other regions; negative values represent net virtual water export from WEU to other regions.
Water 08 00226 g004
Figure 5. Net virtual water import by Eastern Europe (EEU) (billion m3/year), specified by world region. Positive values represent net virtual water import to EEU from other regions; negative values represent net virtual water export from EEU to other regions.
Water 08 00226 g005
Figure 6. Net virtual water import by (a) Western Europe (WEU) and (b) Eastern Europe (EEU) (billion m3/year), specified by green, blue and grey components. Positive values represent net virtual water import; negative values represent net virtual water export.
Water 08 00226 g006
Figure 7. Net virtual water import by (a) Western Europe (WEU) and (b) Eastern Europe (EEU) (billion m3/year), specified by commodity group. Positive values represent net virtual water import; negative values represent net virtual water export.
Water 08 00226 g007
Figure 8. Net virtual water import per European country (billion m3 year). Positive values represent net virtual water import; negative values represent net virtual water export.
Water 08 00226 g008
Figure 9. The composition of the total water footprint (WF) of European consumption by commodity.
Water 08 00226 g009
Figure 10. The composition of the blue water footprint (WF) of European consumption by commodity in scenarios (a) S1, (b) S2, (c) S3 and (d) S4.
Water 08 00226 g010
Figure 11. The composition of the grey water footprint (WF) of European consumption by commodity in scenarios (a) S1/S2 and (b) S3/S4.
Water 08 00226 g011
Figure 12. Percentage change in the water footprint (WF) of consumption per capita relative to 2000 in scenarios (a) S1, (b) S2, (c) S3 and (d) S4.
Water 08 00226 g012
Table 1. Drivers and assumptions per scenario (from Ercin and Hoekstra, 2014).
DriverScenario S1Scenario S2Scenario S3Scenario S4
Global MarketRegional MarketsGlobal SustainabilityRegional Sustainability
Population growthLow fertilityHigh fertilityLow fertilityMedium fertility
Economic growth *A1A2B1B2
Consumption patternDietWestern high meatWestern high meatLess meatLess meat
Bio-energy demandFossil-fuel dominationBiofuel expansionDrastic biofuel expansionDrastic biofuel expansion
Global production and trade pattern **Trade liberalization (A1B + TL2)Self-sufficiency (A2 + SS1)Trade liberalization (A1B + TL1)Self-sufficiency (A2 + SS2)
Technology developmentDecrease in blue water footprints in agriculture.Decrease in blue water footprints in agriculture.Decrease in green and grey water footprints in agriculture.
Decrease in blue and grey water footprints in industries and domestic water supply.
Decrease in green and grey water footprints in agriculture.
Decrease in blue and grey water footprints in industries and domestic water supply.
Notes: * The scenario codes refer to the scenarios as used by the IPCC [13]; ** The scenario codes refer to the scenarios as used by Calzadilla et al. [14].

