
Comparing the Life Cycle Energy Consumption, Global Warming and Eutrophication Potentials of Several Water and Waste Service Options


Abstract
:1. Introduction
2. Methods
2.1. Goal and Scope
2.2. Life Cycle Inventory and Impact Assessment
2.3. Variability and Sensitivity Analysis
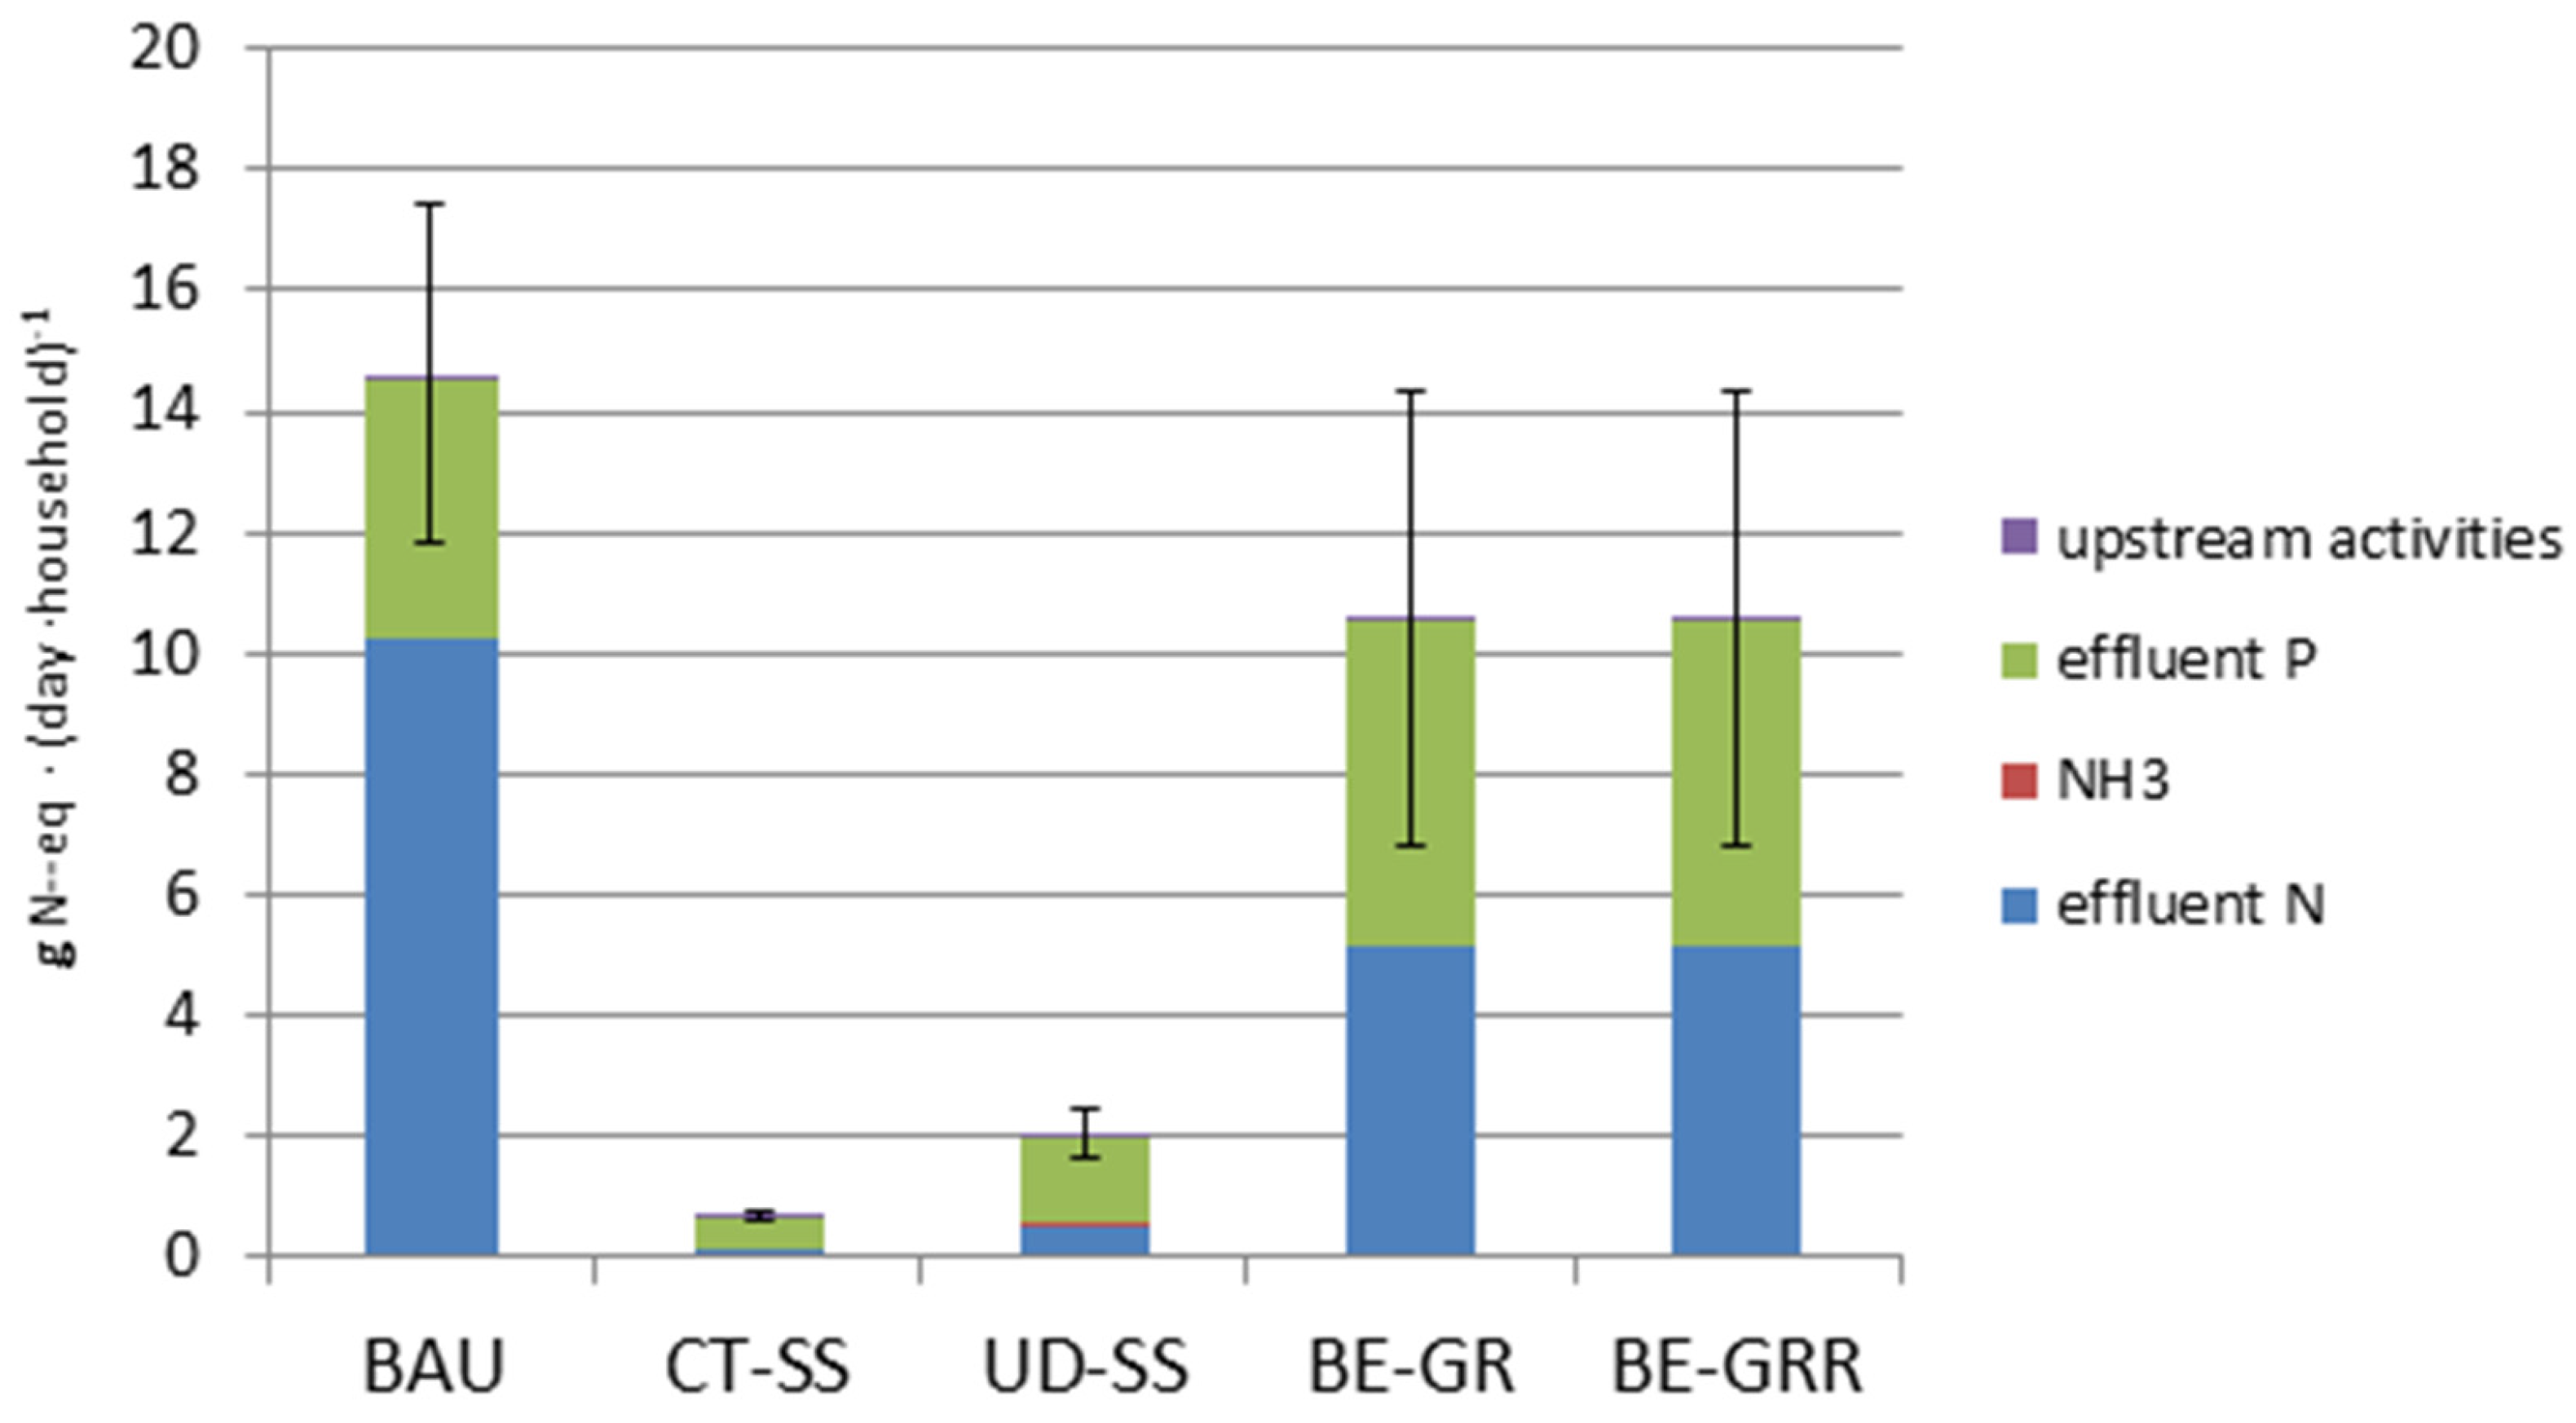
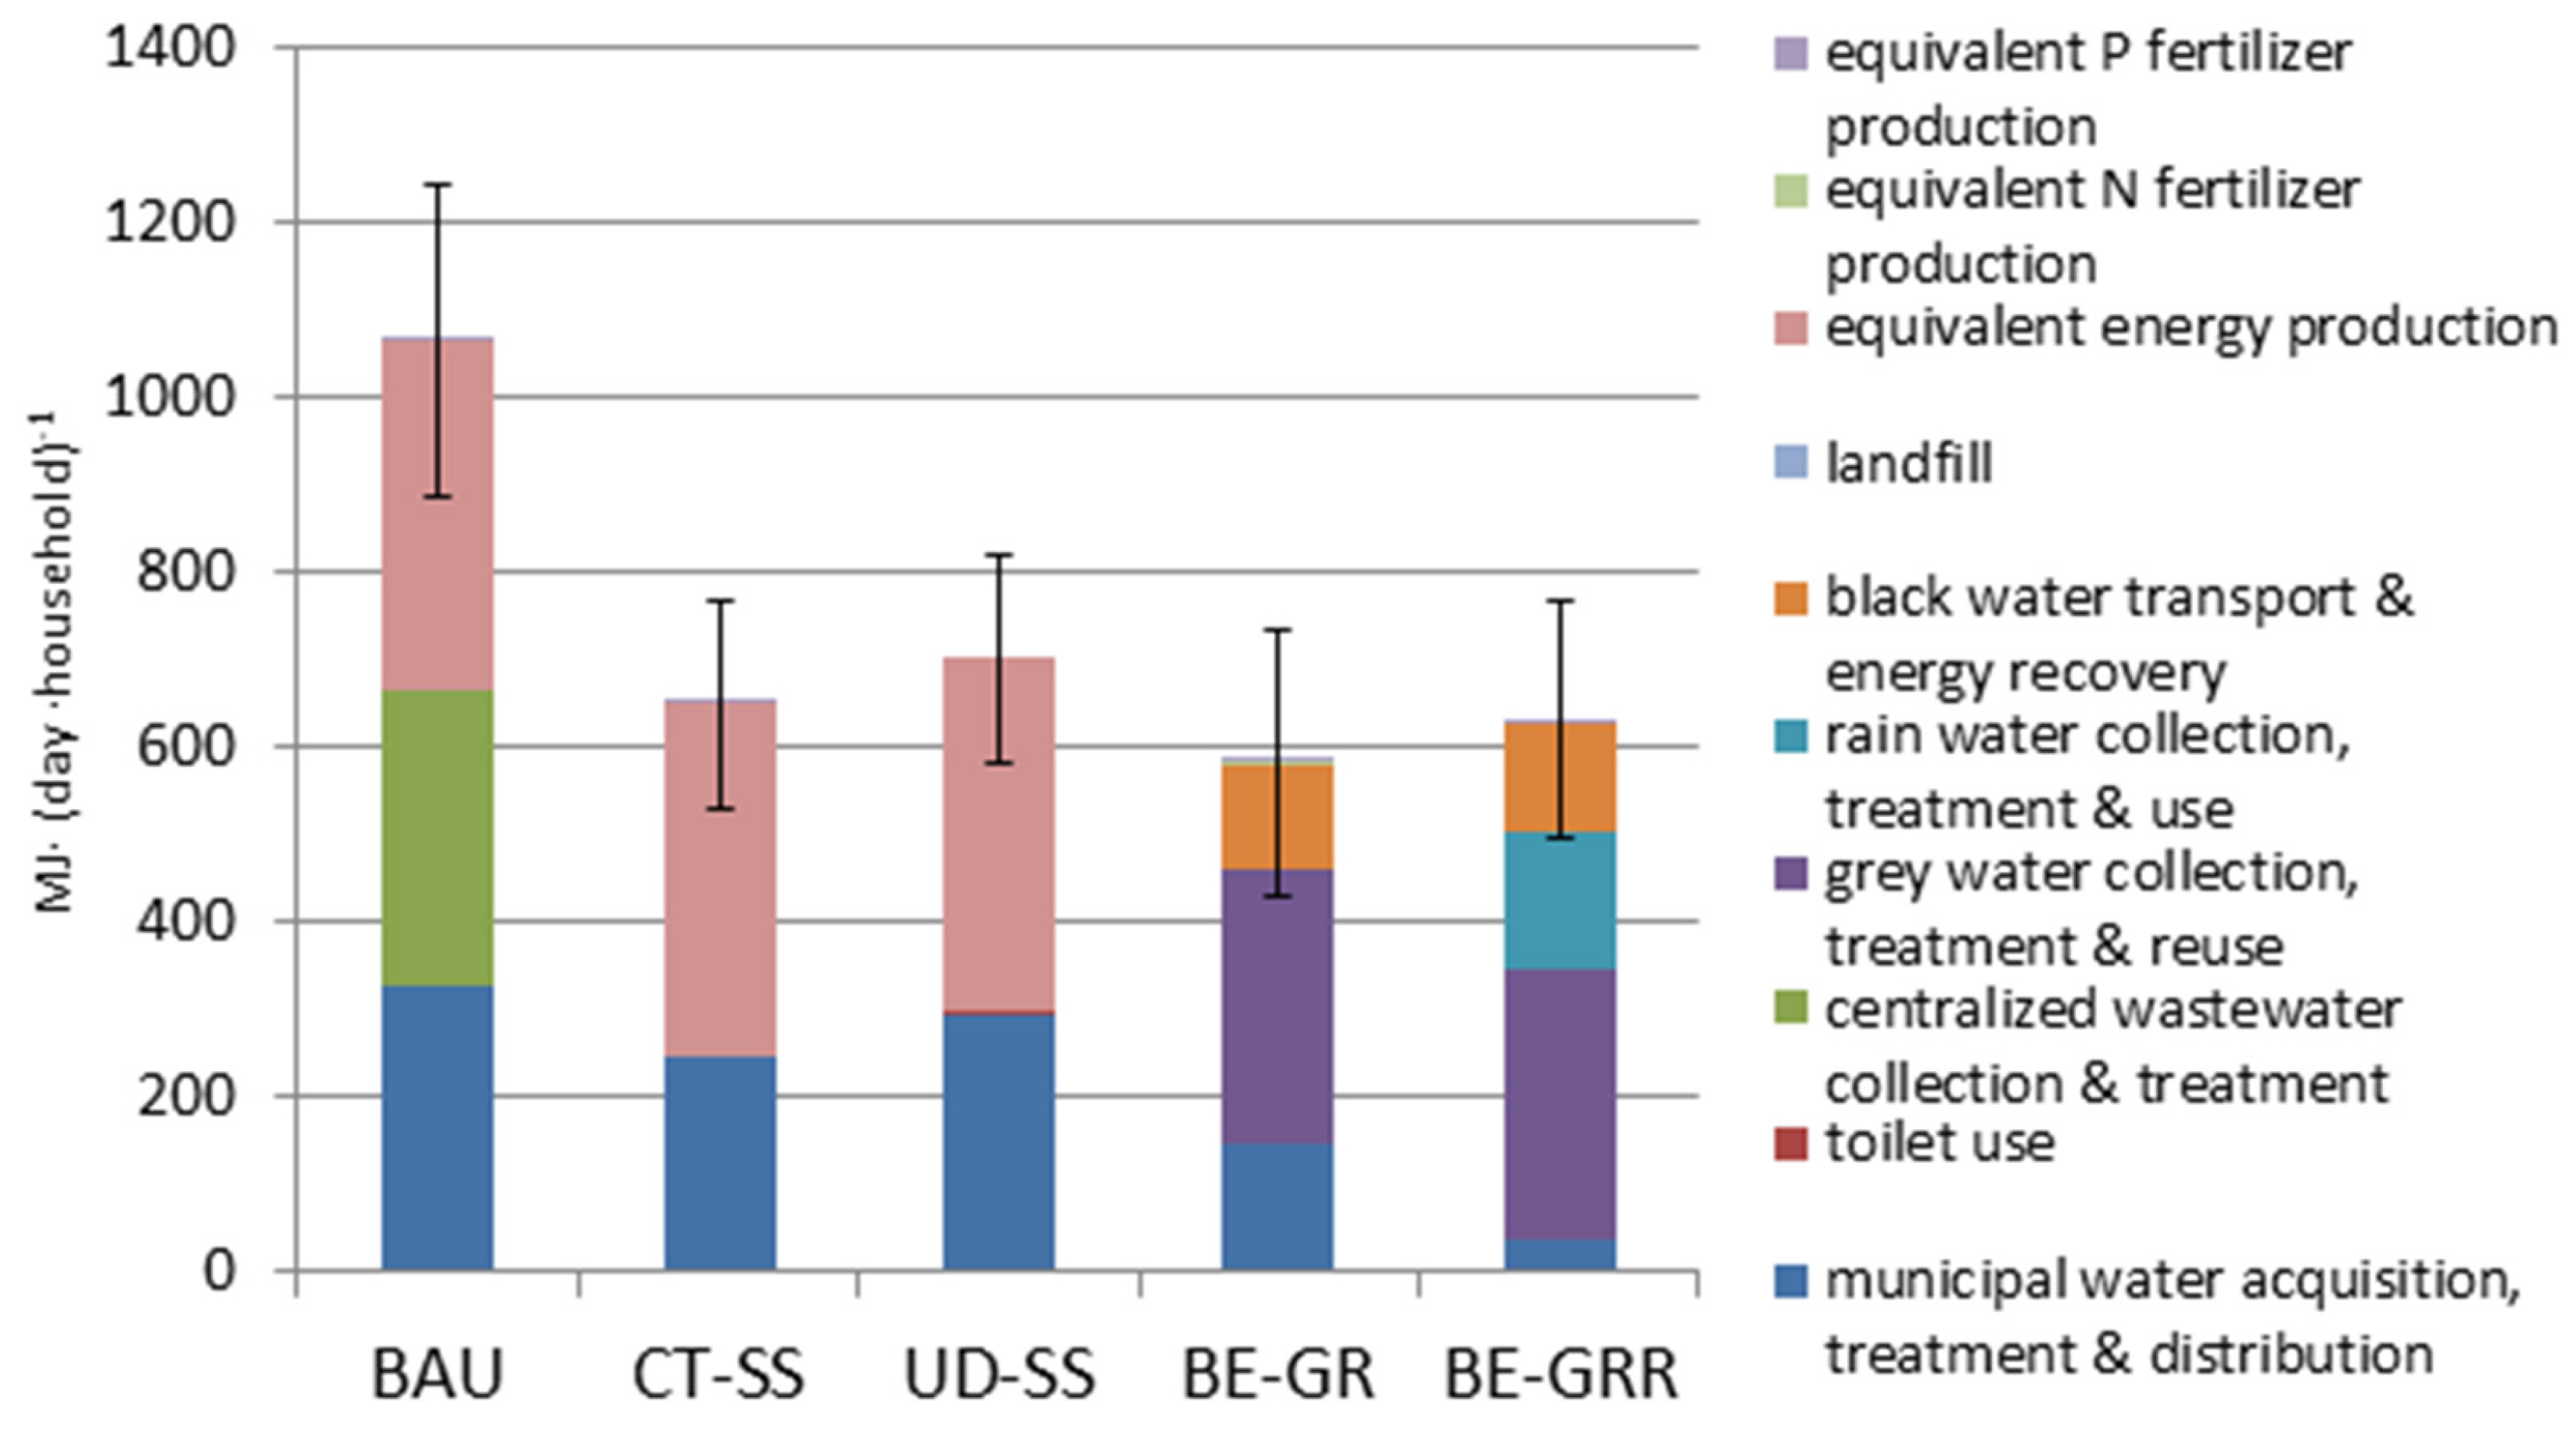
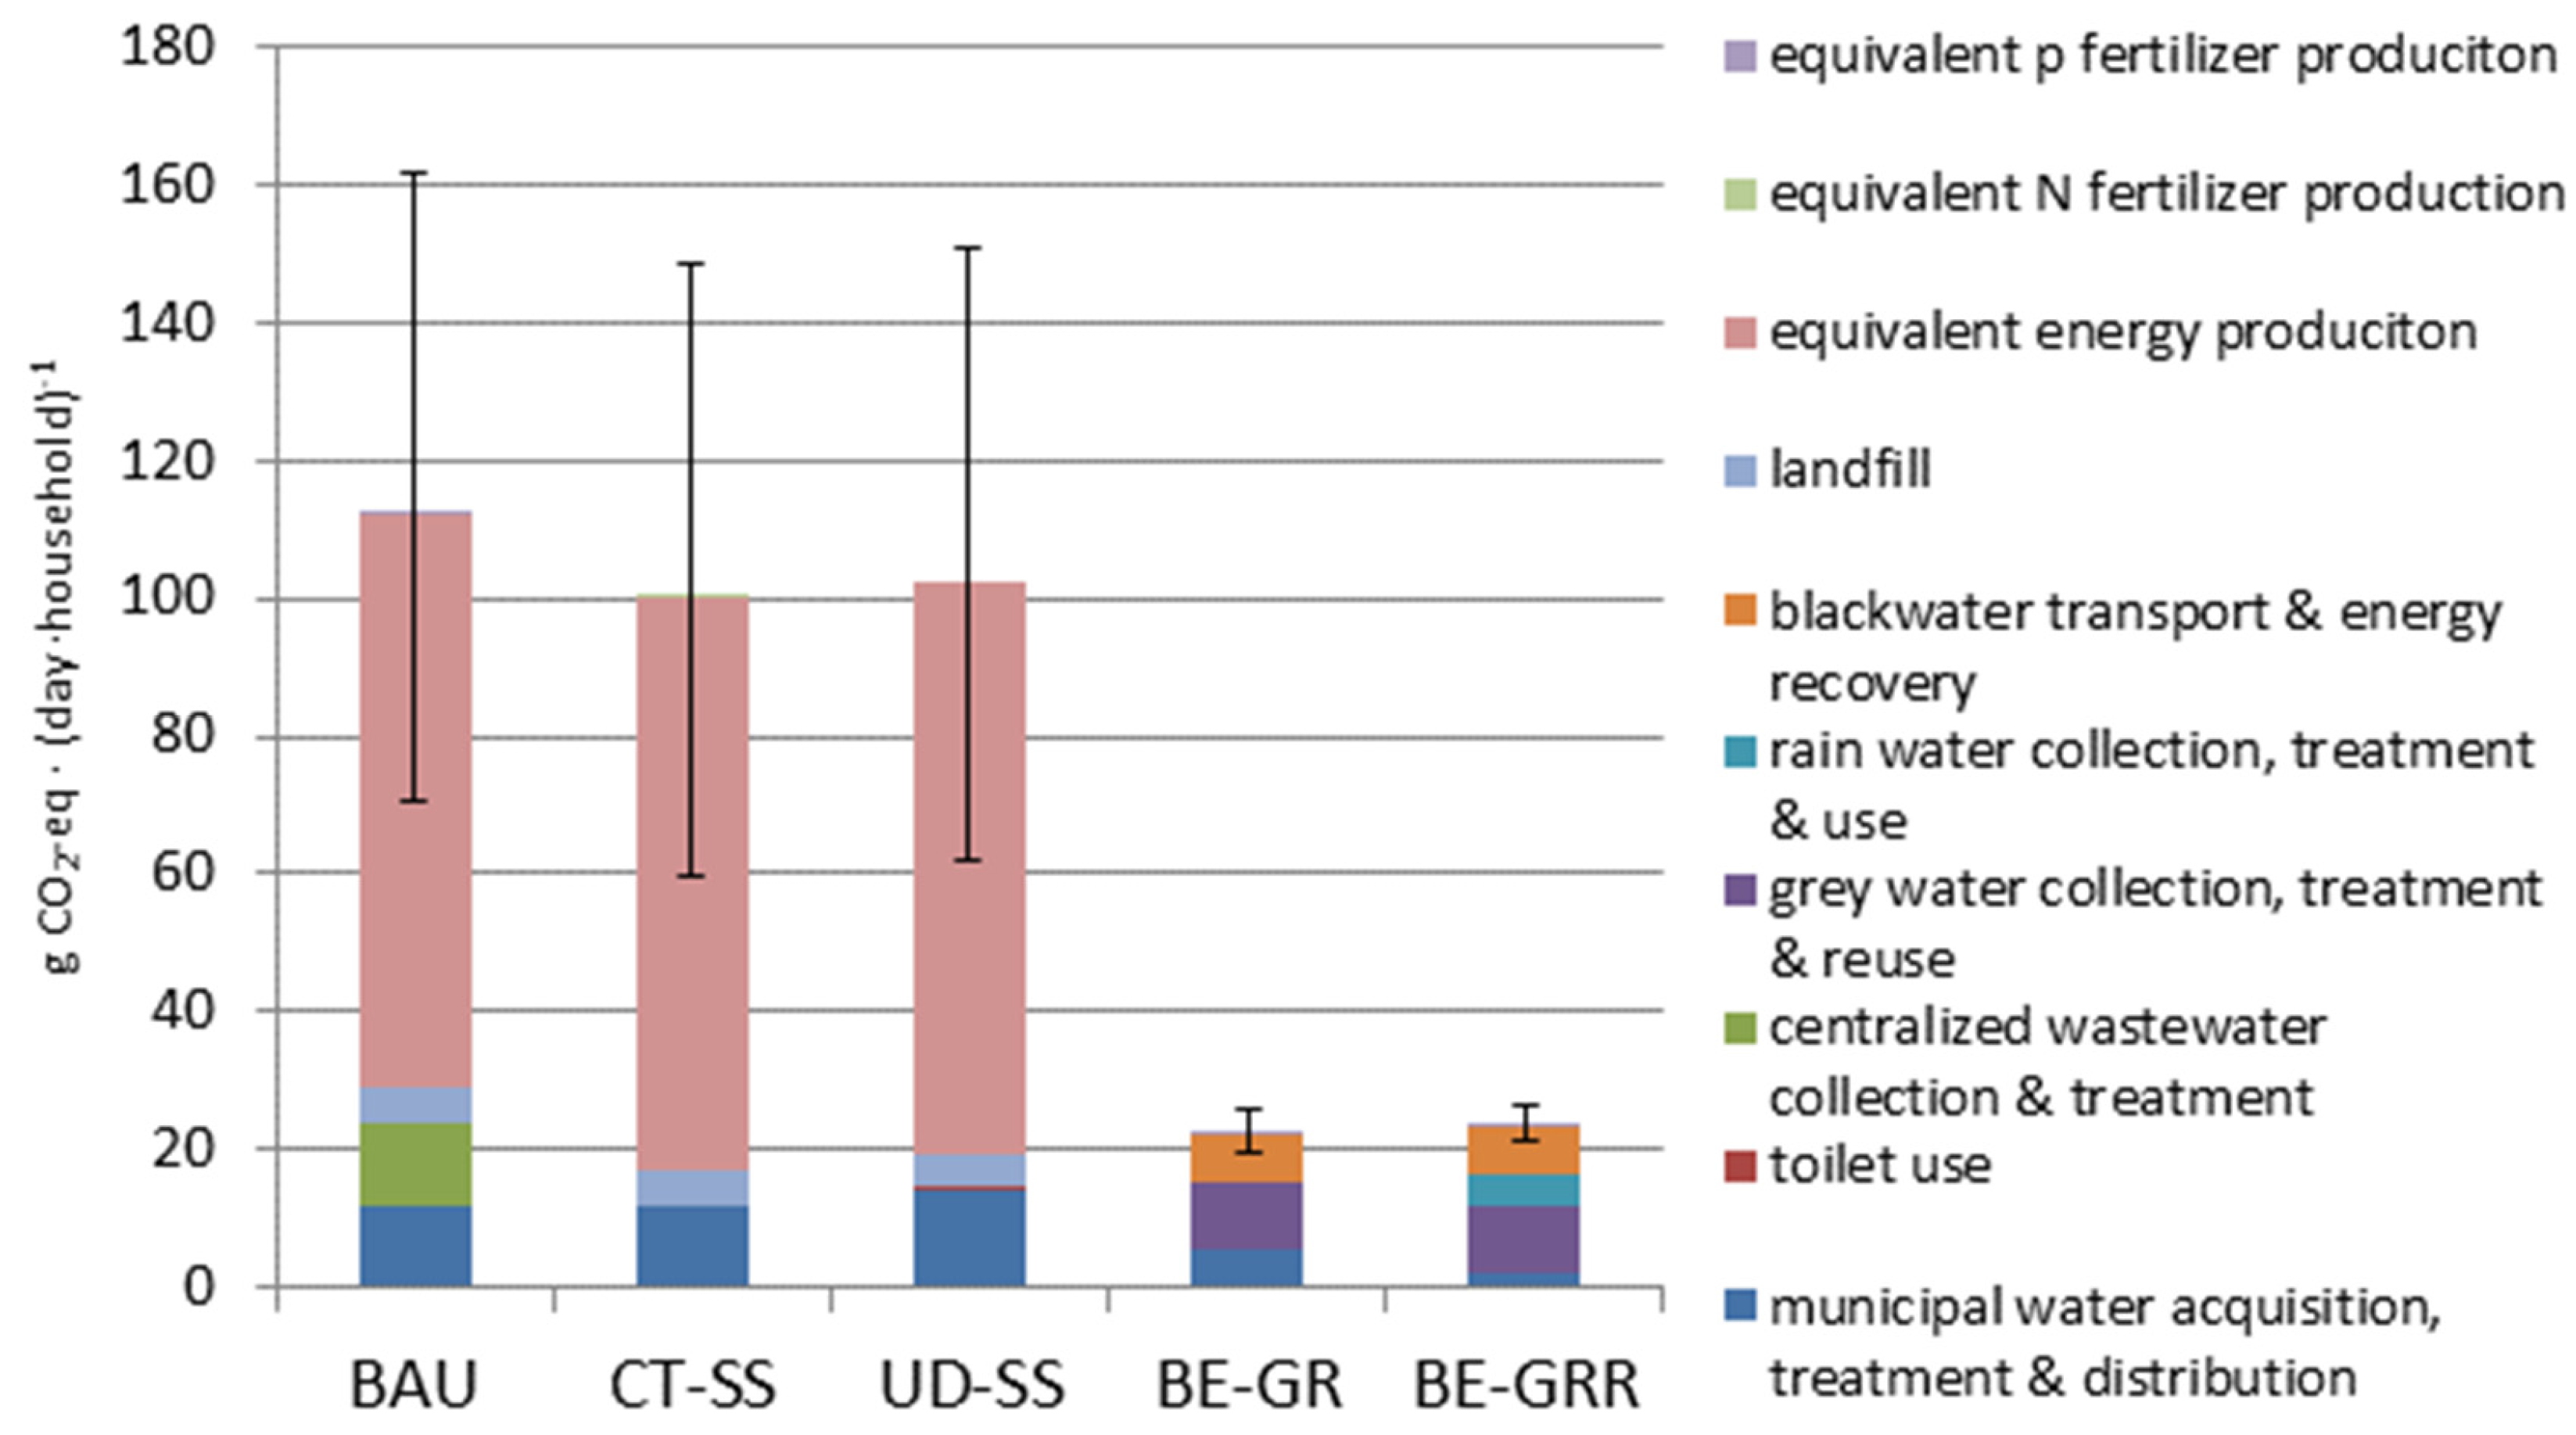
3. Results
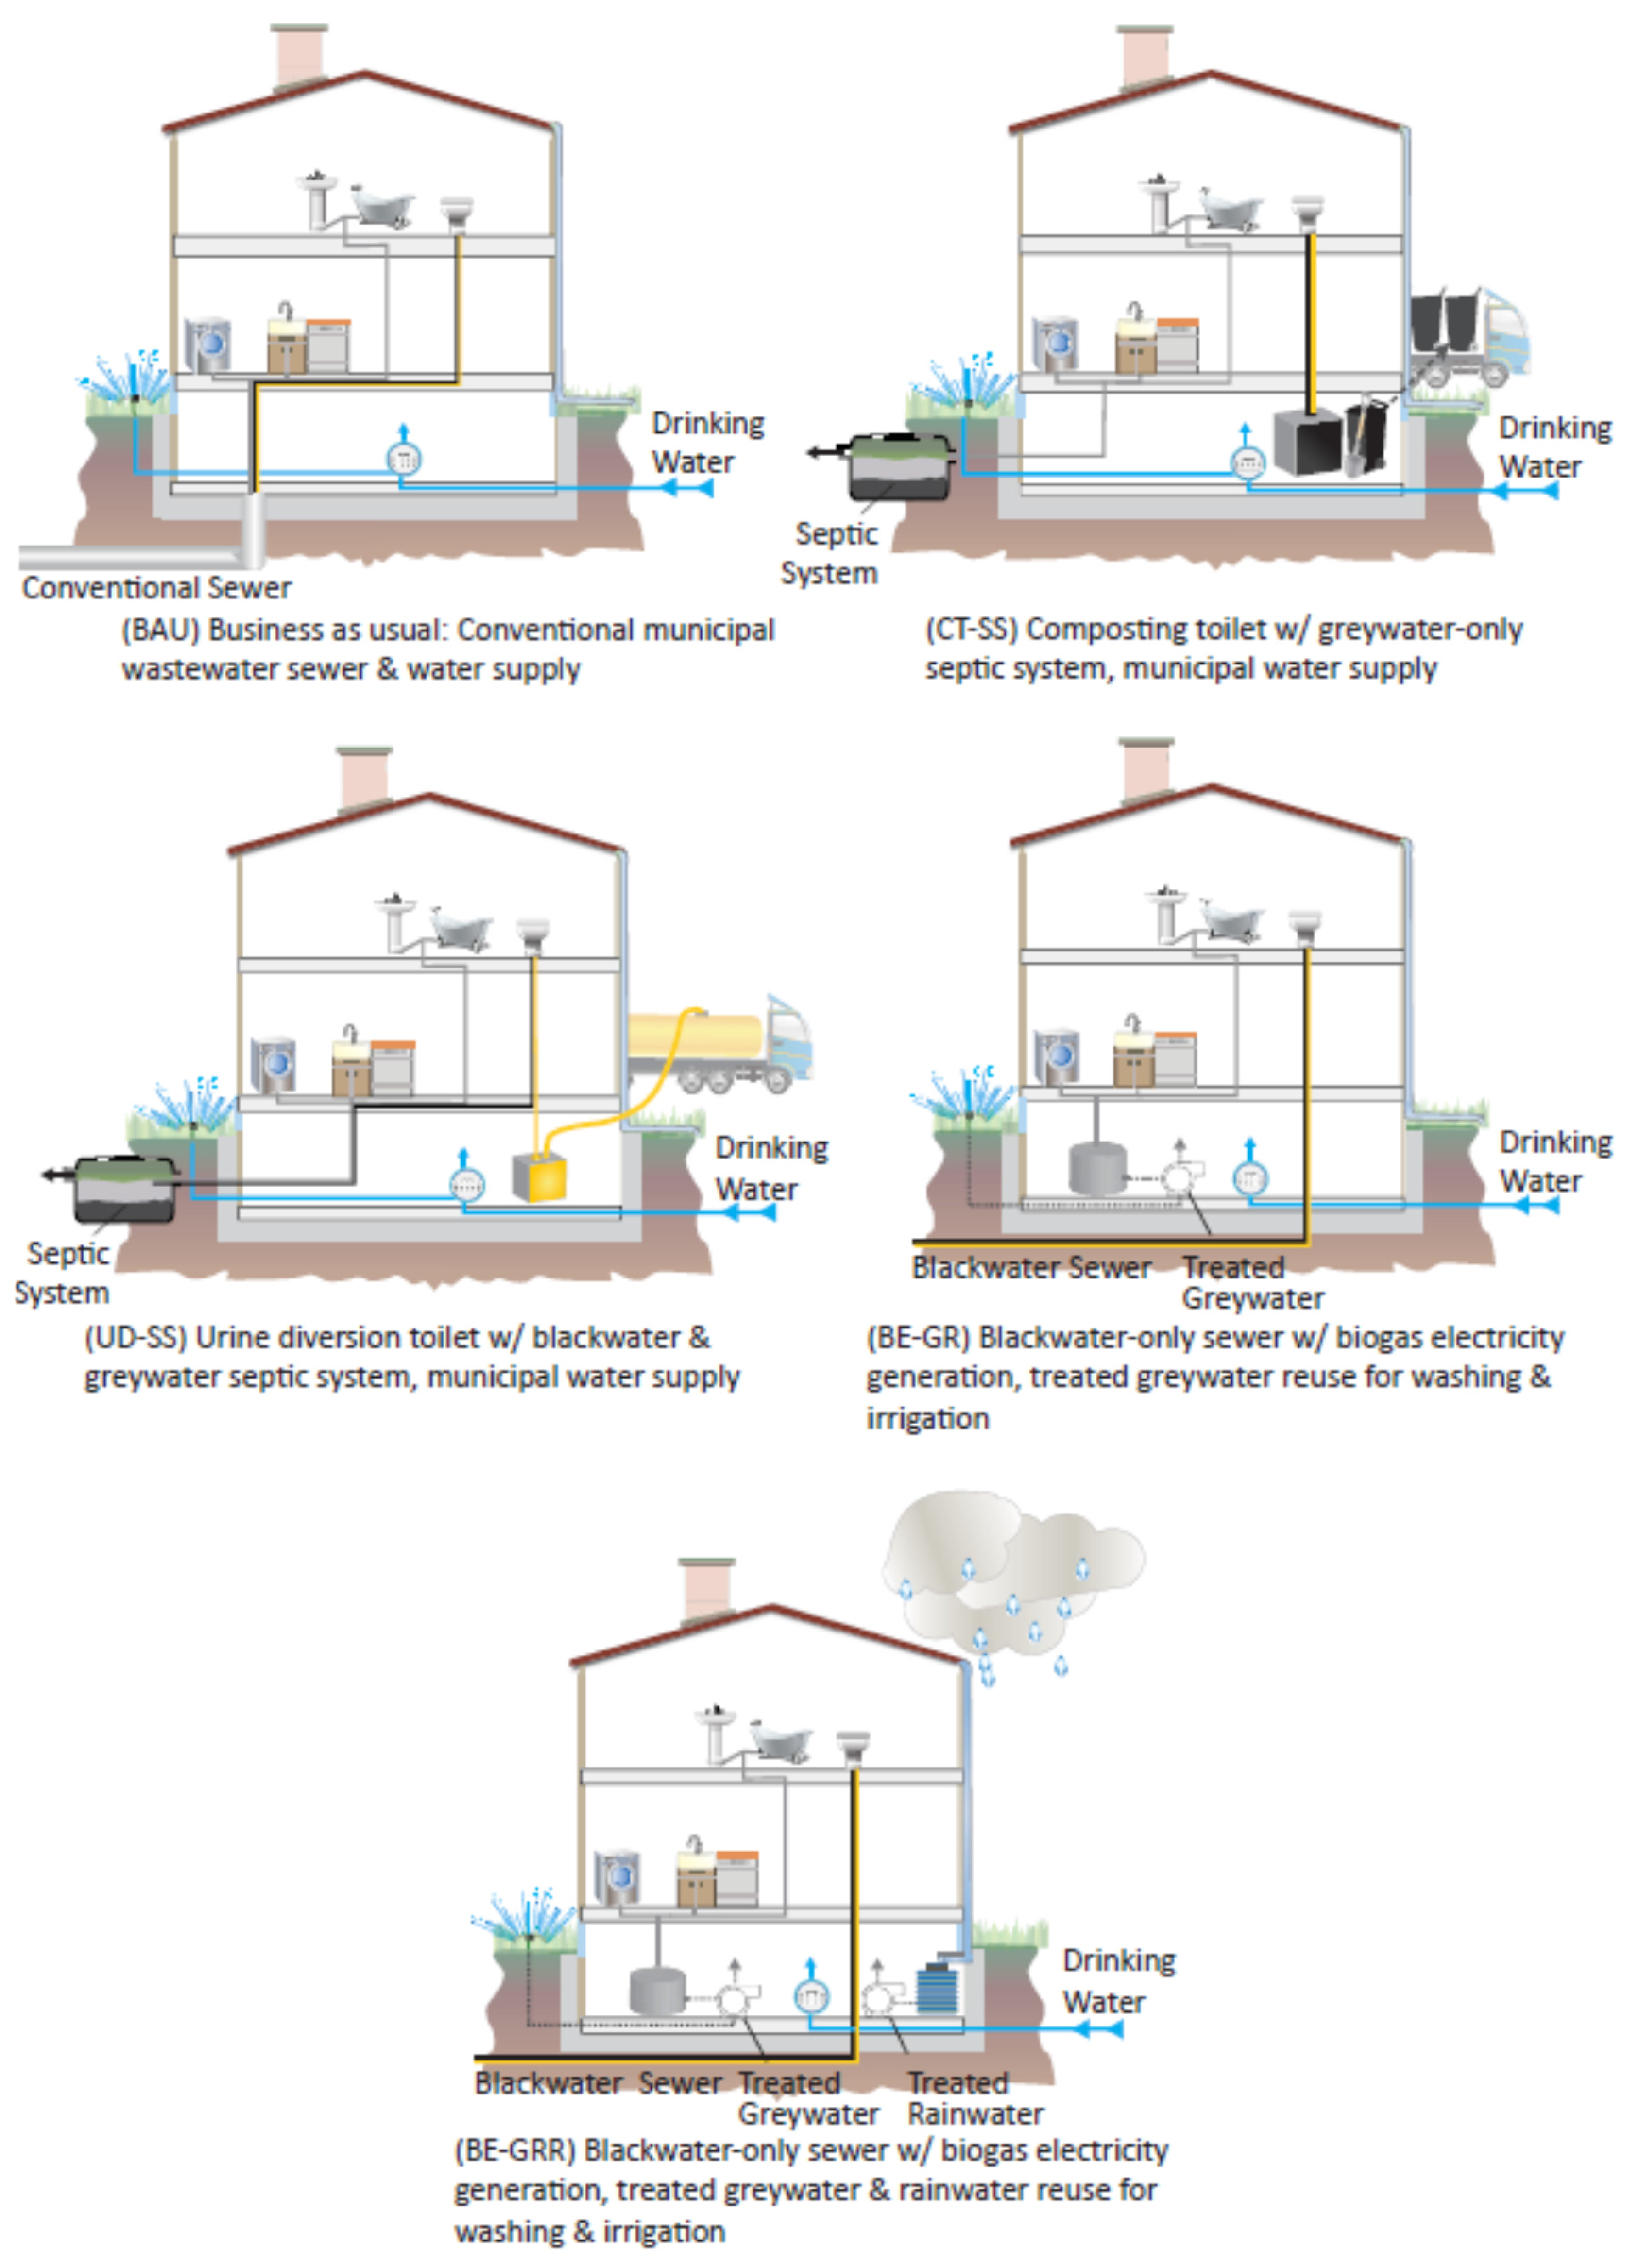
3.1. BAU
3.2. CT-SS and US-SS
3.3. BE-GR and BE-GRR
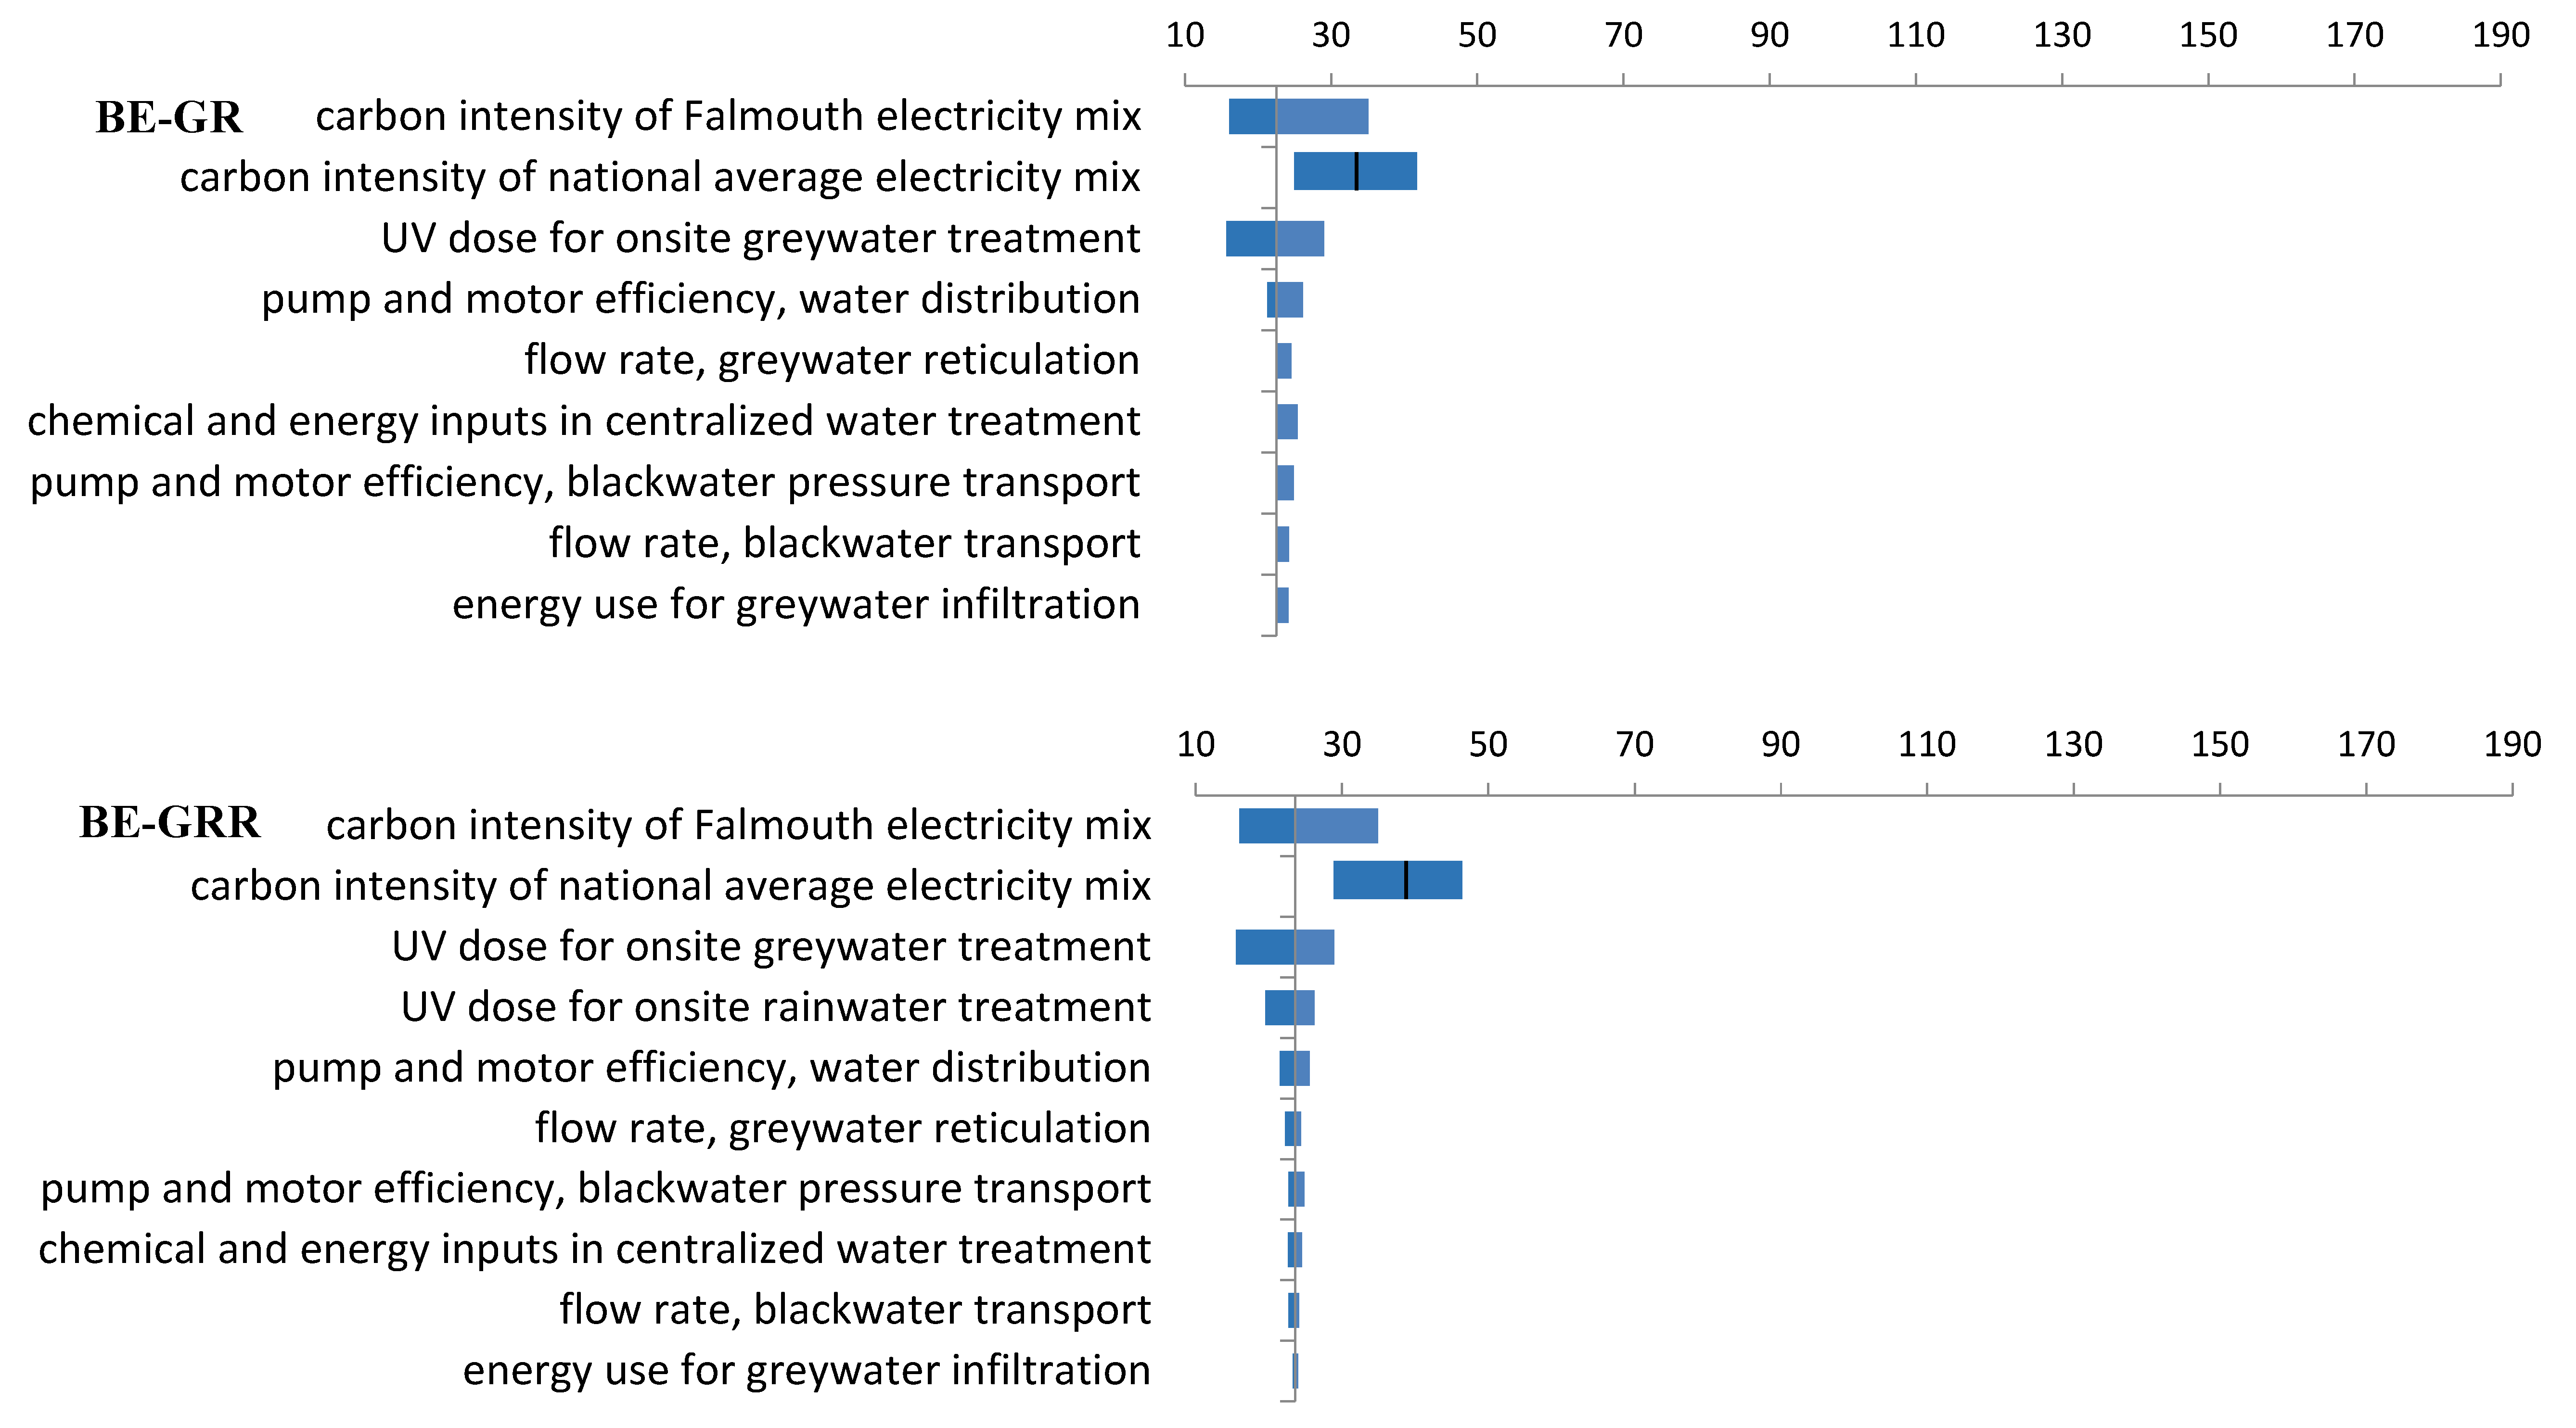
3.4. Carbon Intensity of Different Treatment Stages
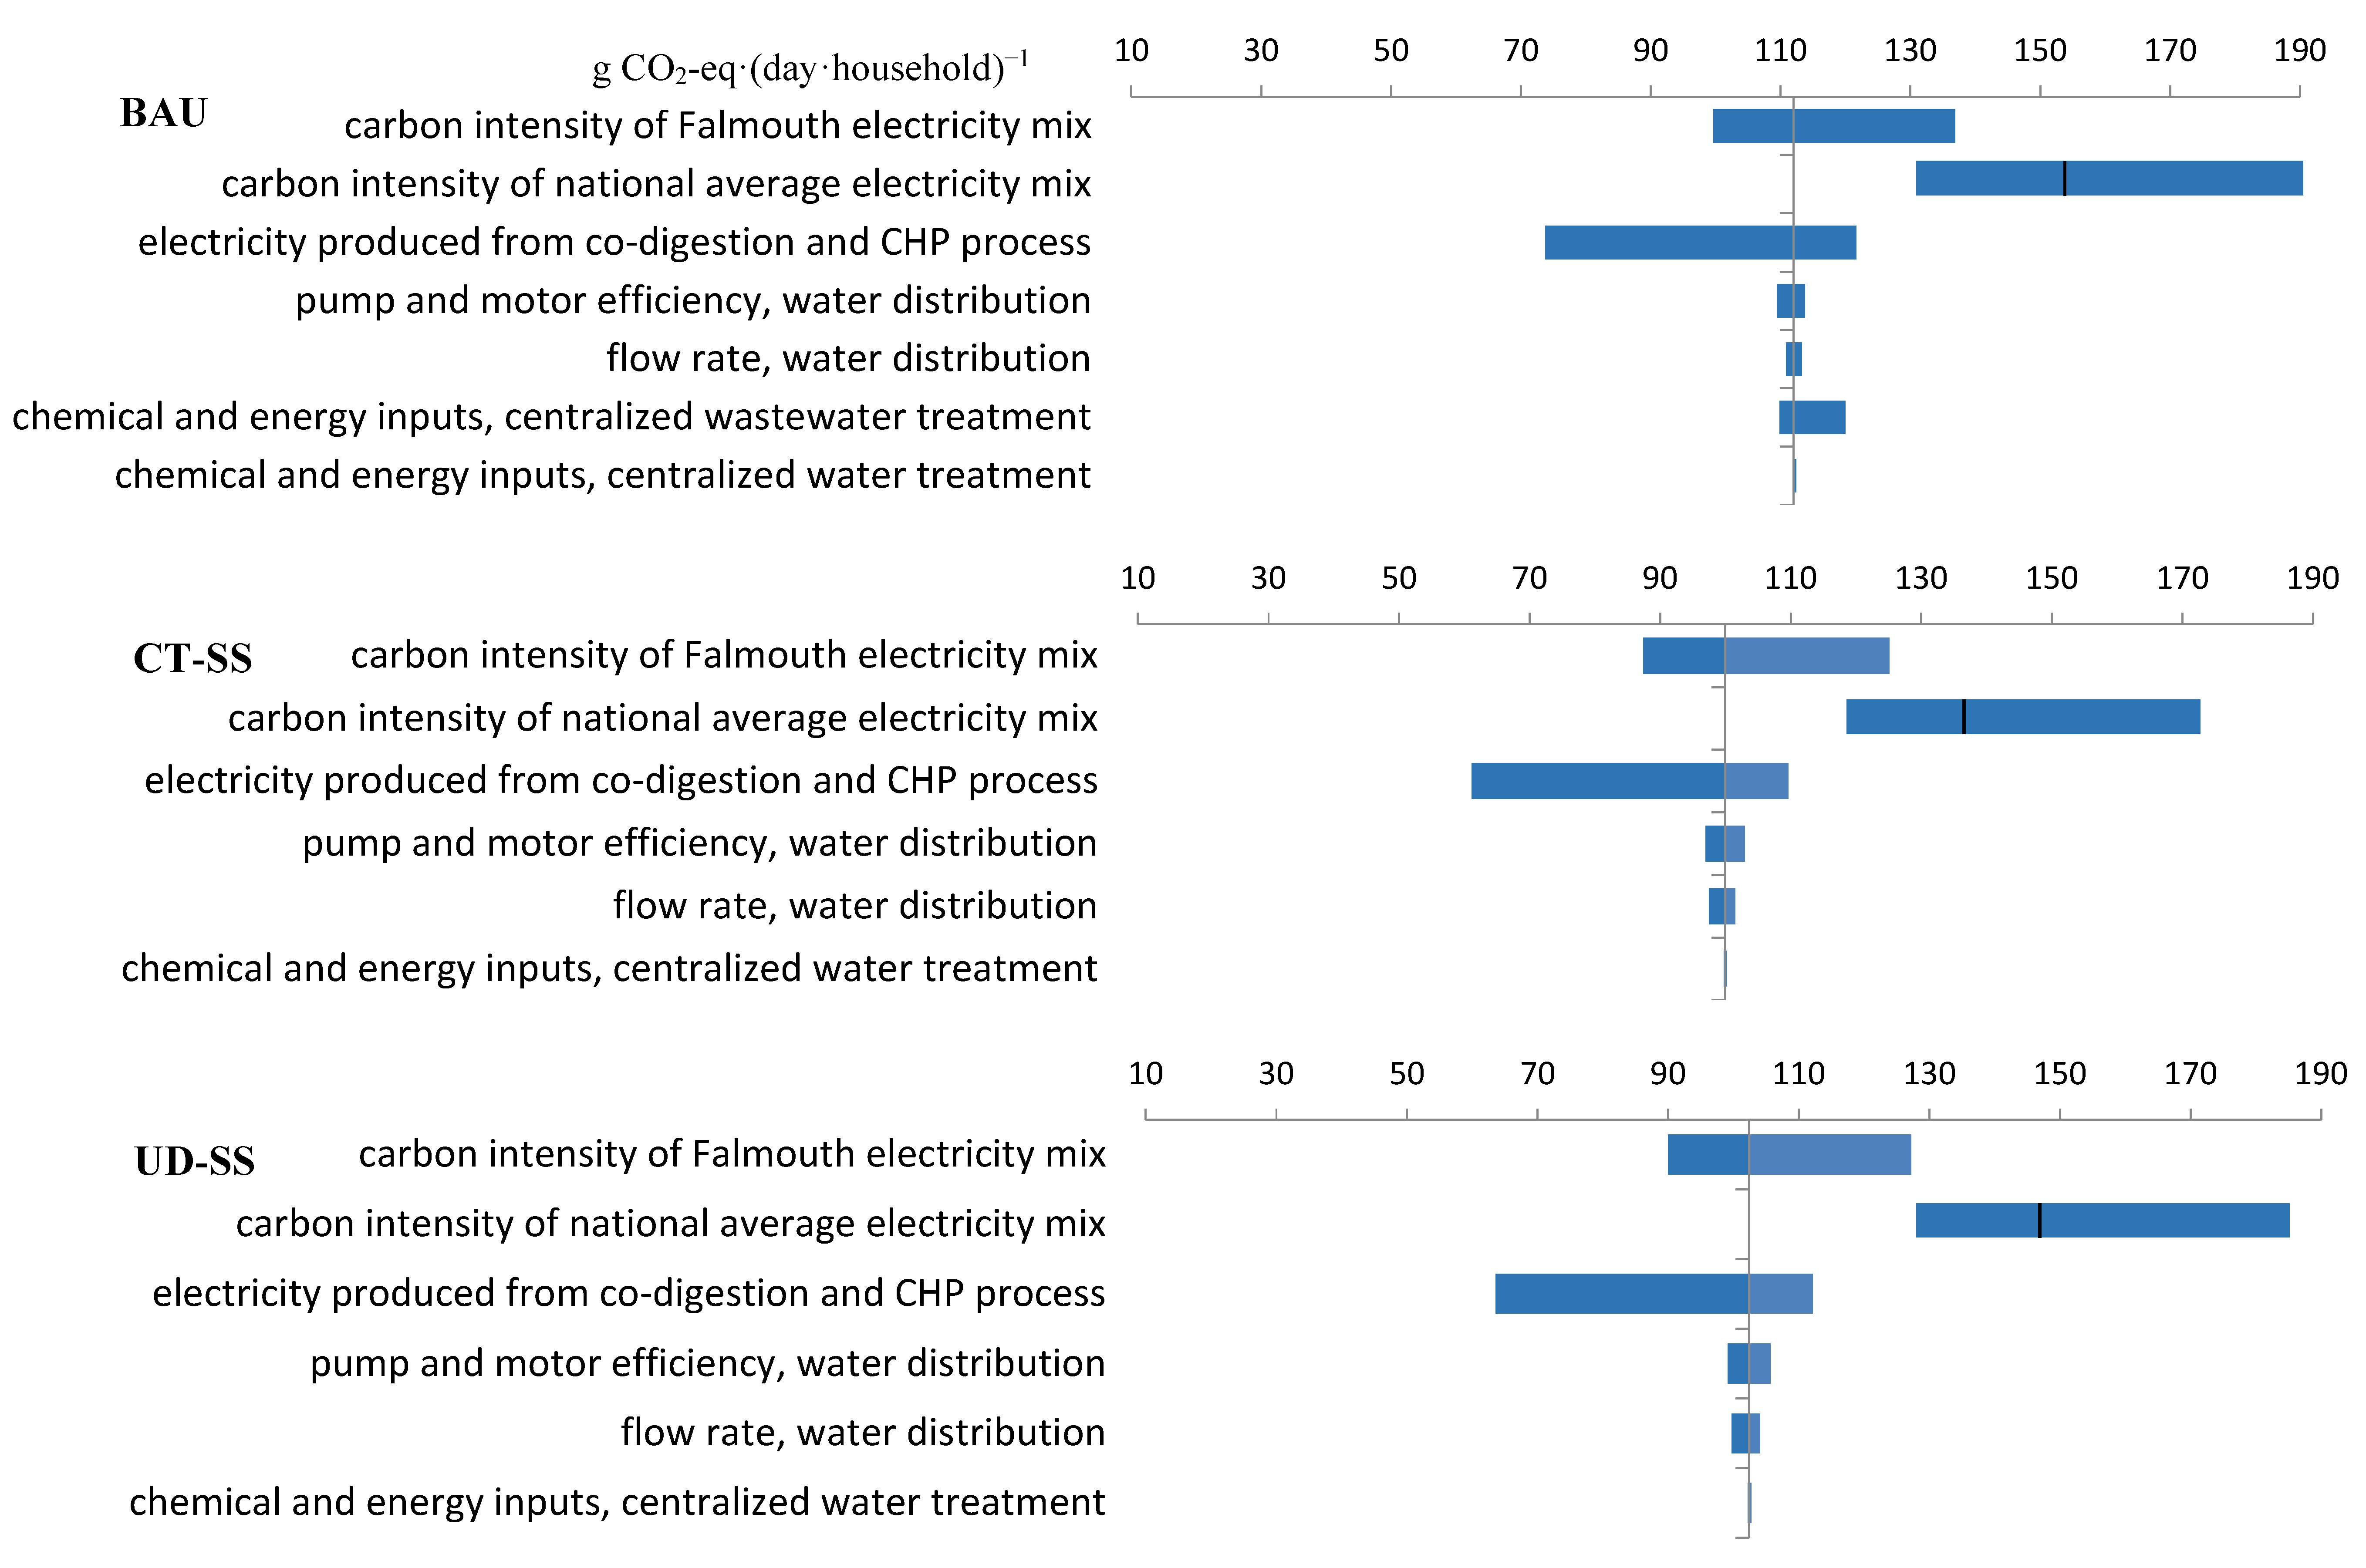
3.5. Variability, Uncertainty and Sensitivity
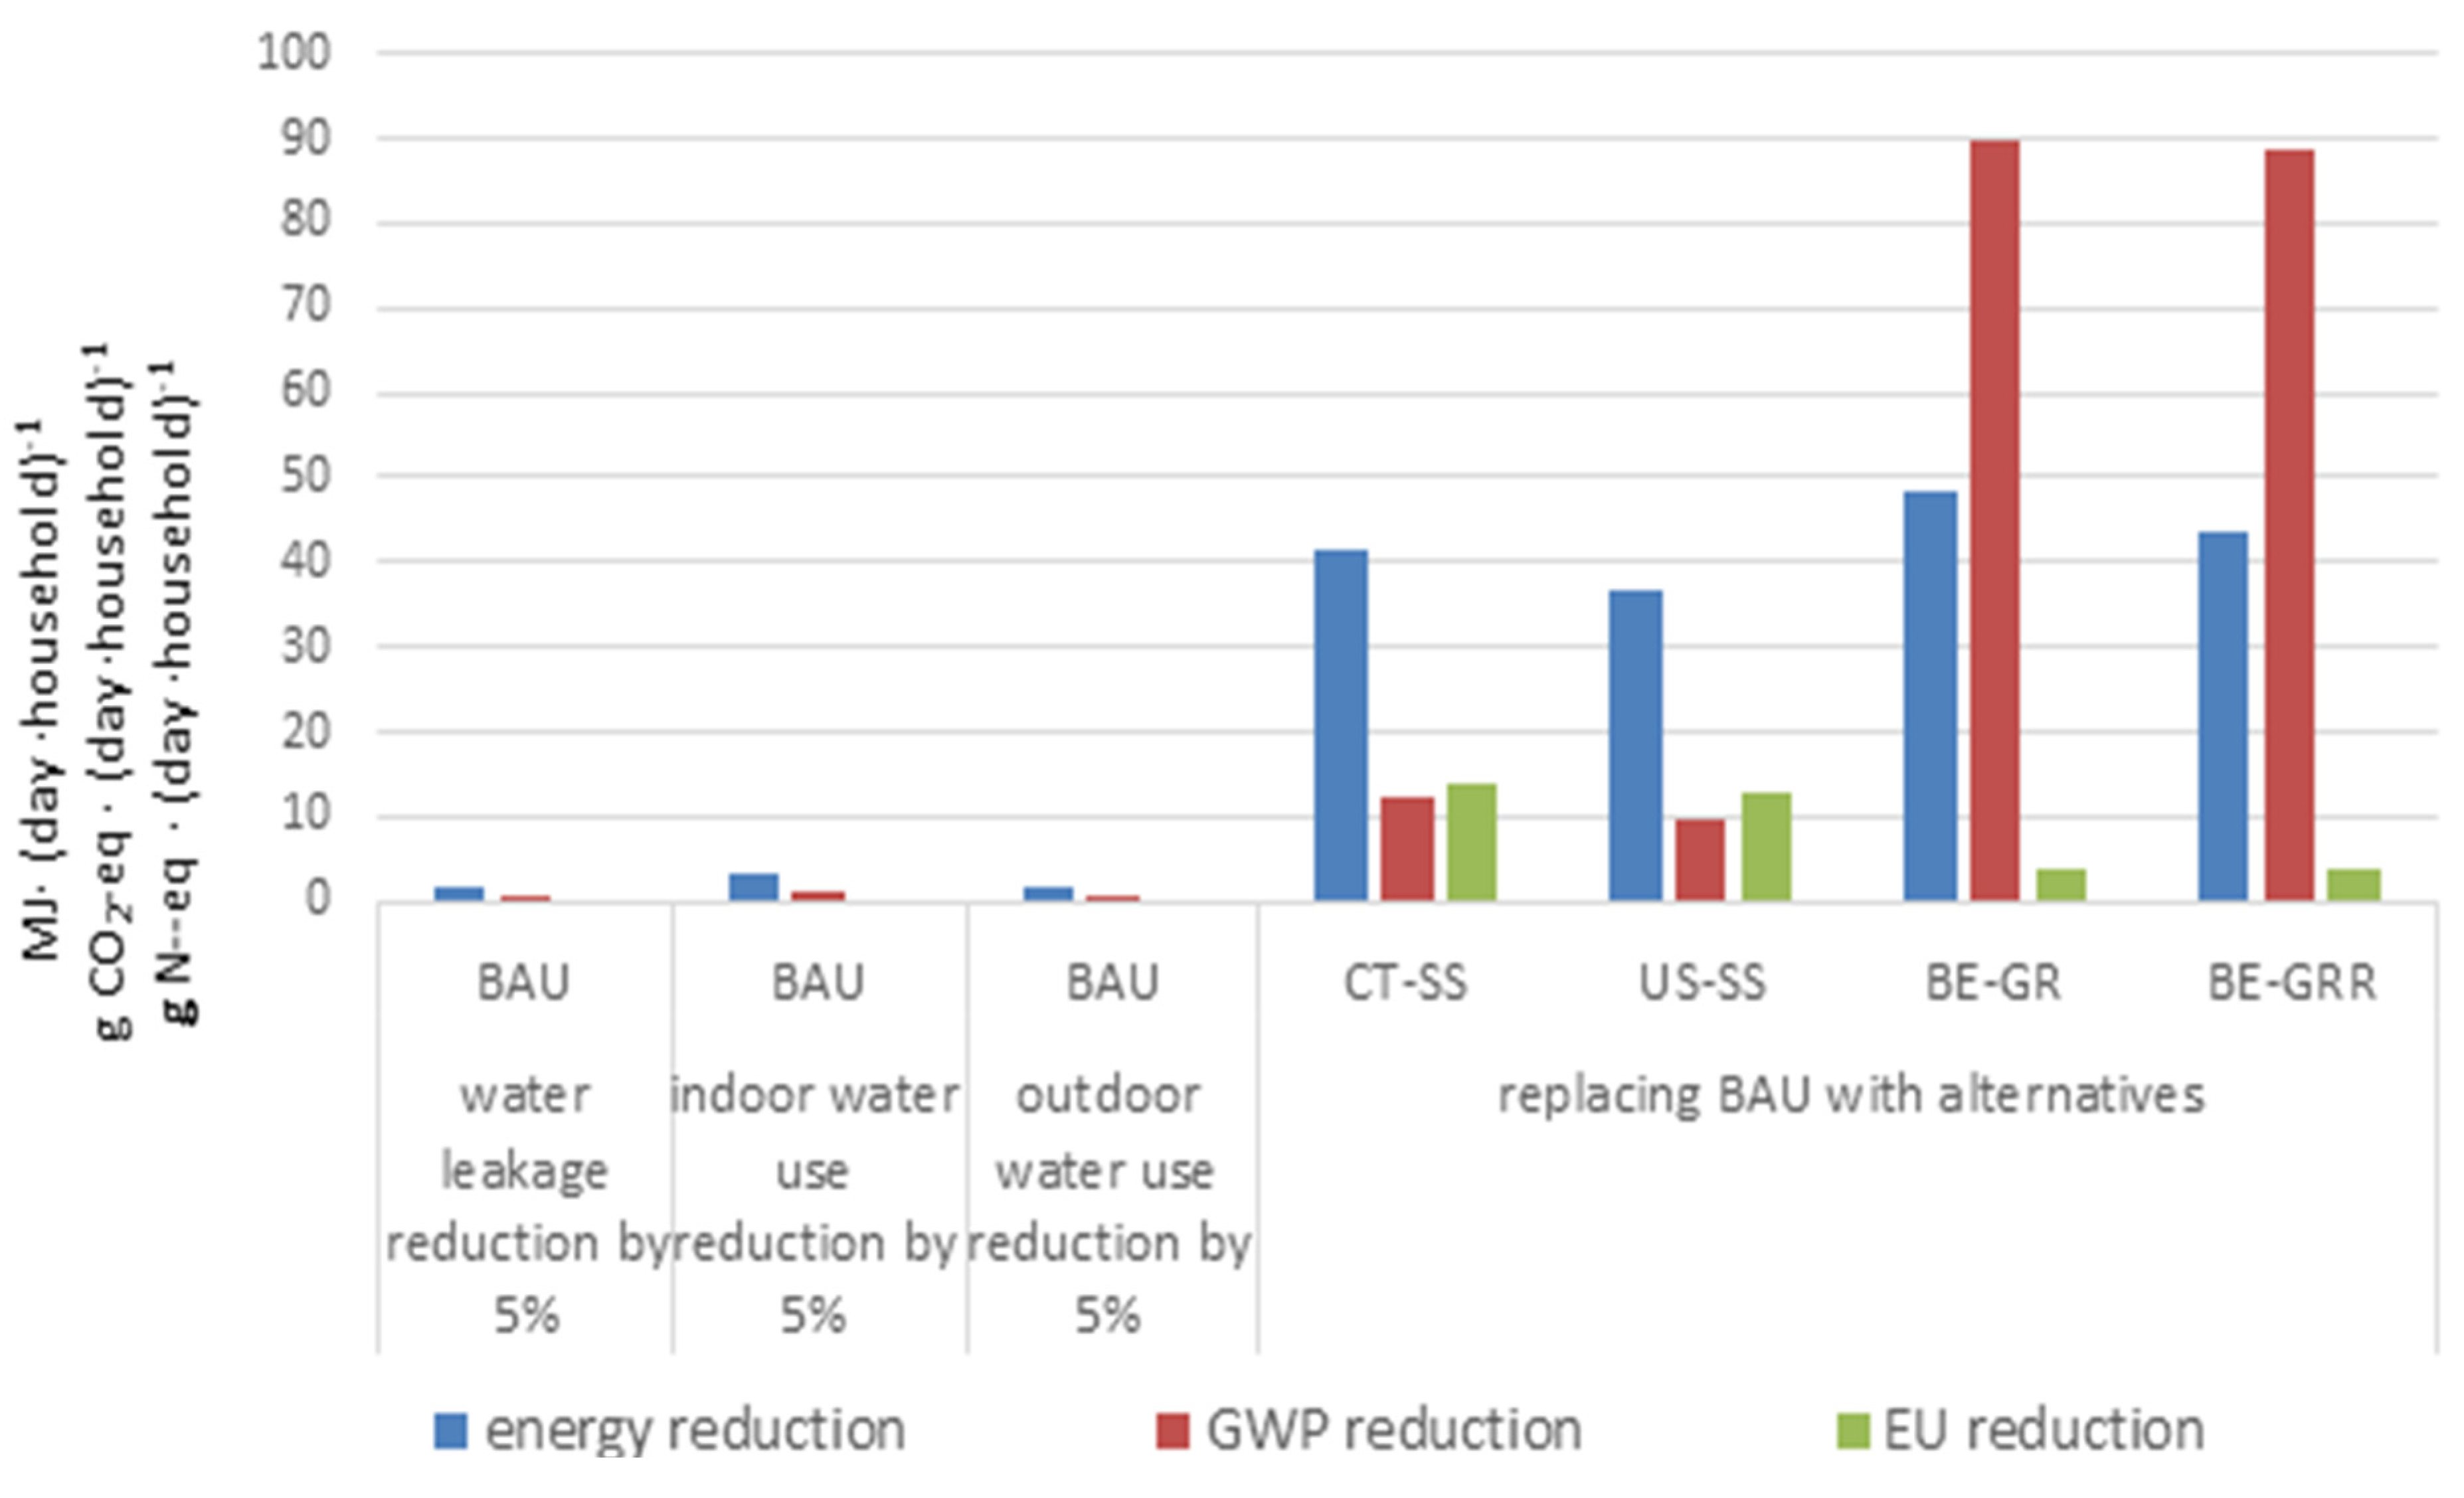
3.6. Opportunities to Reduce Life Cycle Energy and Eutrophication Potentials of Water Systems
4. Discussion
5. Conclusions
Supplementary Materials
Acknowledgements
Author Contributions
Conflicts of Interest
References
- United States Goverment Accountability Office. Amount of Energy Needed to Supply, Use, and Treat Water is Location-Specific and Can be Reduced by Certain Technologies and Approaches; Unitied States Government Accountability Office: Washington, DC, USA, 2011; p. 10.
- Olsson, G. Water and Energy. Threats and Oppurtunities; IWA Publishing: London, UK, 2012. [Google Scholar]
- US EPA. National Rivers and Streams Assessment 2008–2009. A Collaborative Survey. Draft; epa/841/d-13/001; US EPA: Washington, DC, USA, 2013.
- Howe, C.; Mukheibir, P.; Gallet, E. Institutional Issues for Green-Grey Infrastructure based on Integrated “One Water” Management and Resource Recovery; Institute for Sustainable Futures, University of Technology: Sydney, Australia, 2013. [Google Scholar]
- Burn, L.S.; De Silva, D.; Shipton, R.J. Effect of demand management and system operation on potable water infrastructure costs. Urban Water 2002, 4, 229–236. [Google Scholar] [CrossRef]
- Ishii, S.K.; Boyer, T.H. Life cycle comparison of centralized wastewater treatment and urine source separation with struvite precipitation: Focus on urine nutrient management. Water Res. 2015, 79, 88–103. [Google Scholar] [CrossRef] [PubMed]
- Tervahauta, T.; van der Weijden, R.D.; Flemming, R.L.; Hernández Leal, L.; Zeeman, G.; Buisman, C.J. Calcium phosphate granulation in anaerobic treatment of black water: A new approach to phosphorus recovery. Water Res. 2014, 48, 632–642. [Google Scholar] [CrossRef] [PubMed]
- Villarroel Walker, R.; Beck, M.B.; Hall, J.W.; Dawson, R.J.; Heidrich, O. The energy-water-food nexus: Strategic analysis of technologies for transforming the urban metabolism. J. Environ. Manag. 2014, 141, 104–115. [Google Scholar] [CrossRef] [PubMed]
- Brown, V.; Jackson, D.W.; Khalifé, M. 2009 melbourne metropolitan sewerage strategy: A portfolio of decentralised and on-site concept designs. Water Sci. Technol. 2010, 62, 510–517. [Google Scholar] [CrossRef] [PubMed]
- Chen, R.; Wang, X.C. Cost-benefit evaluation of a decentralized water system for wastewater reuse and environmental protection. Water Sci. Technol. 2009, 59, 1515–1522. [Google Scholar] [CrossRef] [PubMed]
- Gikas, P.; Tchobanoglous, G. The role of satellite and decentralized strategies in water resources management. J. Environ. Manag. 2012, 2009, 144–152. [Google Scholar] [CrossRef] [PubMed]
- Kinstedt, K. Optimization of the Collection and Transport of Blackwater in Source-Separated Wastewater Systems; Technical University Hamburg-Harburg: Hamburg, Germary, 2012. [Google Scholar]
- Malisie, A.F.; Prihandrijanti, M.; Otterpohl, R. The potential of nutrient reuse from a source-separated domestic wastewater system in Indonesia—Case study: Ecological sanitation pilot plant in Surabaya. Water Sci. Technol. 2007, 56, 141–148. [Google Scholar] [CrossRef] [PubMed]
- Otterpohl, R.; Braun, U.; Oldenburg, M. Innovative technologies for decentralised water-, wastewater and biowaste management in urban and peri-urban areas. Water Sci. Technol. 2003, 48, 23–32. [Google Scholar] [PubMed]
- Peter-Fröhlich, A.; Pawlowski, L.; Bonhomme, A.; Oldenburg, M. EU demonstration project for separate discharge and treatment of urine, faeces and greywater—Part I: Results. Water Sci. Technol. 2007, 56, 239–249. [Google Scholar] [CrossRef] [PubMed]
- Sharma, A.; Burn, S.; Gardner, T.; Gregory, A. Role of decentralised systems in the transition of urban water systems. Water Sci. Technol. Water Supply 2010, 10, 577–583. [Google Scholar] [CrossRef]
- Kiparsky, M.; Sedlak, D.L.; Thompson, B.H.J.; Truffer, B. The innovation deficit in urban water: The need for an integrated perspective on institutions, organizations, and technology. Environ. Eng. Sci. 2013, 30, 395–408. [Google Scholar] [CrossRef] [PubMed]
- Mo, W.; Nasiri, F.; Eckelman, M.J.; Zhang, Q.; Zimmerman, J.B. Measuring the embodied energy in drinking water supply systems: A case study in the great lakes region. Environ. Sci. Technol. 2010, 44, 9516–9521. [Google Scholar] [CrossRef] [PubMed]
- Mo, W.; Zhang, Q.; Mihelcic, J.R.; Hokanson, D.R. Embodied energy comparison of surface water and groundwater supply options. Water Res. 2011, 45, 5577–5586. [Google Scholar] [CrossRef] [PubMed]
- Stokes, J.R.; Horvath, A. Life cycle energy assessment of alternative water supply systems. Int. J. Life Cycle Assess. 2006, 11, 335–343. [Google Scholar] [CrossRef]
- Stokes, J.R.; Horvath, A. Energy and air emission effects of water supply. Environ. Sci. Technol. 2009, 43, 2680–2687. [Google Scholar] [CrossRef] [PubMed]
- Lassaux, S.; Renzoni, R.; Germain, A. A life cycle assessment of water from the pumping station to the wastewater treatment plant. Int. J. Life Cycle Assess. 2007, 12, 118–126. [Google Scholar]
- Rodriguez-Garcia, G.; Molinos-Senante, M.; Hospido, A.; Hernández-Sancho, F.; Moreira, M.T.; Feijoo, G. Environmental and economic profile of six typologies of wastewater treatment plants. Water Res. 2011, 45, 5997–6060. [Google Scholar] [CrossRef] [PubMed]
- Corominas, L.; Foley, J.; Guest, J.S.; Hospido, A.; Larsen, H.F.; Morera, S.; Shaw, A. Life cycle assessment applied to wastewater treatment: State of the art. Water Res. 2013, 47, 5480–5492. [Google Scholar] [CrossRef] [PubMed]
- Wang, R.; Eckelman, M.J.; Zimmerman, J.B. Consequential environmental and economic life cycle assessment of green and gray stormwater infrastructure for combined sewer systems. Environ. Sci. Technol. 2013, 47, 11189–11198. [Google Scholar] [CrossRef] [PubMed]
- Loubet, P.; Roux, P.; Loiseau, E.; Bellon-Maurel, V. Life cycle assessment of urban water systems: A comparative analysis of selected peer-reviewed literature. Water Res. 2014, 67, 187–202. [Google Scholar] [CrossRef] [PubMed]
- Xue, X.; Schoen, M.E.; Ma, C.; Hawkins, T.R.; Ashbolt, N.J.; Cashdollar, J.; Garland, J. Critical insights for a sustainability framework to address integrated community water services: Technical metrics and approaches. Water Res. 2015, 77, 155–169. [Google Scholar] [CrossRef] [PubMed]
- Remy, C.; Jekel, M. Energy analysis of conventional and source-separation systems for urban wastewater management using life cycle assessment. Water Sci. Technol. 2012, 65, 22–29. [Google Scholar] [CrossRef] [PubMed]
- Benetto, E.; Nguyen, D.; Lohmann, T.; Schmitt, B.; Schossler, P. Life cycle assessment of ecological sanitation system for small-scale wastewater treatment. Sci. Total Environ. 2009, 407, 1506–1516. [Google Scholar] [CrossRef] [PubMed]
- Kärrman, E.; Jönsson, H. Normalising impacts in an environmental systems analysis of wastewater systems. Water Sci. Technol. 2001, 43, 293–300. [Google Scholar] [PubMed]
- Lam, L.; Kurisu, K.; Hanaki, K. Comparative environmental impacts of source-seperation systems for domestic wastewater manageemnt in rural China. J. Clean. Prod. 2015, 104, 185–198. [Google Scholar] [CrossRef]
- Lehtoranta, S.; Vilpas, R.; Mattila, T.J. Comparison of carbon footprints and eutrophication impacts of rural on-site wastewater treatment plants in Finland. J. Clean. Prod. 2014, 65, 439–446. [Google Scholar] [CrossRef]
- Thibodeau, C.; Monette, F.; Bulle, C.; Glaus, M. Comparison of black water source-seperation and conventional sanitation systems using life cycle assessment. J. Clean. Prod. 2014, 67, 45–57. [Google Scholar] [CrossRef]
- Tillman, A.; Svingby, M.; Lundstrom, H. Life cycle assessment of municipal waste water systems. Int. J. Life Cycle Assess. 1998, 3, 145–157. [Google Scholar] [CrossRef]
- NOAA. Cape Cod Precipitation Datasets. Available online: http://www.ncdc.noaa.gov/cdo-web/ (accessed on 15 June 2014).
- Cape Cod Comission. Cape Cod Comission Resource Center. Available online: http://www.capecodcommission.org/index.php?id=62&a=topic&cat=Population (accessed on 15 June 2014).
- Schoen, M.E.; Xue, X.; Hawkins, T.R.; Ashbolt, N.J. Comparative human health risk analysis of coastal community water and waste service options. Environ. Sci. Technol. 2014, 48, 9728–9736. [Google Scholar] [CrossRef] [PubMed]
- Schoen, M.; Hawkins, T.R.; Xue, X.; Ma, C.; Garland, J.; Ashbolt, N.J. Technologic resilience assessment of coastal community water and wastewater service options. Sustain. Water Qual. Ecol. 2015, 6, 75–87. [Google Scholar] [CrossRef]
- Wood, A.; Blackhurst, M.; Xue, X.; Hawkins, T.R.; Ashbolt, N.J.; Garland, J. Cost-effectiveness of nitrogen mitigation by alternative household wastewater management technologies. J. Environ. Manag. 2015, 150, 344–354. [Google Scholar] [CrossRef] [PubMed]
- Water Department in Town of Falmouth. Water Utility. Available online: http://www.falmouthmass.us/depart.php?depkey=water (accessed on 15 June 2014).
- US EPA. Indoor Water Use in the United States. Available online: http://www.epa.gov/WaterSense/pubs/indoor.html (accessed on 15 June 2014).
- US EPA. Water & Energy Efficiency. Available online: http://water.epa.gov/infrastructure/sustain/waterefficiency.cfm (accessed on 15 June 2014).
- US EPA. Evaluation of Energy Conservation Measures for Wastewater Treatment Facilities; US EPA: Washington, DC, USA, 2010.
- Cape Cod Water Protection Colloborative. Comparison of Costs for Wastewater Management Systems Applicable to Cape Cod. Available online: http://www.ccwpc.org/index.php/component/content/article/36-wastewater-reports/78-comparison-of-costs-for-wastewater-management-systems-applicable-to-cape-cod (accessed on 15 June 2014).
- Massachusetts Department of Environmental Protection. Septic Systems. Available online: http://www.mass.gov/eea/agencies/massdep/water/wastewater/septic-systems-title-5.html (accessed on 15 June 2014).
- Memon, F.A.; Zheng, Z.; Bulter, D.; Shirley-Smith, C.; Lui, S.; Makropoulos, C.; Avery, L. Life cycle impact assessment of greywater recycling technologies for new developments. Envion. Monit. Assess. 2007, 129, 27–35. [Google Scholar] [CrossRef] [PubMed]
- Cape Cod Eco-Toilet Center. Urine-diverting, Flush Toilet. Available online: http://capecodecotoiletcenter.com/types-of-eco-toilets/urine-diverting-toilets/ud-flush-toilets/ (accessed on 15 July 2014).
- The Aquionics UV Product. The aquionics uv lamp energy consumption. 2013. Available online: http://www.aquionics.com/main/ (accessed on 15 July 2014).
- Trojan UV products. Trojan uv lamp energy consumption. Available online: http://www.trojanuv.com/ (accessed on 15 July 2014).
- Schulz, M.; Short, M.D.; Peters, G.M. A streamlined sustainability assessment tool for improved decision making in the urban water industry. Integr. Environ. Assess. Manag. 2012, 8, 183–193. [Google Scholar] [CrossRef] [PubMed]
- Hallmann, M.; Grant, T.; Alsop, N. Life Cycle Assessment and Life Cycle Costing of Water Tanks as a Supplement to Mains Water Supply for Yarra Valley Water; Center for Design at RMIT University: Melbourne, Australia, 2003. [Google Scholar]
- Crites, R.; Tchobanoglous, G. Small and Decentralized Wastewater Management Systems; The McGraw-Hill Companies, Inc.: Davis, CA, USA, 1998. [Google Scholar]
- USDA. The food availability data system. Available online: http://www.ers.usda.gov/data-products/food-availability-(per-capita)-data-system.aspx (accessed on 15 September 2014).
- US EPA. Opportunities for Combined Heat and Power at Wastewater Treatment Facilities: Market Analysis and Lessons from the Field; US EPA: Washington, DC, USA, 2011.
- US NREL. Feasibility Study of Anaerobic Digestion of Food Waste in St. Bernard, Louisiana; NREL/TP-7A30-57082; US DOE: Washington, DC, USA, 2013.
- Massachusetts Department of Environmental Protection. Identification, Characterization, and Mapping of Food Waste and Food Waste Generators in Massachusetts. Available online: http://www.mass.gov/dep/recycle/priorities/foodwast.pdf (accessed on 15 June 2014).
- US EPA. Organics: Co-Digestion Economic Analysis Tool (CoEAT). Available online: http://www.epa.gov/region9/organics/coeat/index.html (accessed on 15 June 2014).
- Tchobanoglous, G.; Burton, F.L.; Stensel, H.D. Wastewater Engineering, Treatment and Reuse; The McGraw-Hill Companies, Inc.: Davis, CA, USA, 2003. [Google Scholar]
- US NREL. Coal-Fired Electricity Generation Results—Life Cycle Assessment Harmonization. Available online: http://www.nrel.gov/analysis/sustain_lca_coal.html (accessed on 15 June 2014).
- NIST. The Buidling for Environmental and Economic Sustainability (BEES) Software and Database. Available online: http://www.nist.gov/el/economics/BEESSoftware.cfm (accessed on 15 June 2014).
- US EPA. Nonroad Model (Nonroad Engines, Equipment, and Vehicles); US EPA: Washington, DC, USA, 2009.
- Swiss Centre for Life Cycle Inventories. The Ecoinvent Database. Available online: http://www.ecoinvent.org/database/ (accessed on 15 June 2014).
- US EIA. Electricity. Available online: http://www.eia.gov/electricity/ (accessed on 15 June 2014).
- US EPA. National Emissions Inventory (NEI) Air Pollutant Emissions Trends Data; US EPA: Washington, DC, USA, 2013.
- Meinzinger, F.; Oldenburg, M. Characteristics of source-separated household wastewater flows: A statistical assessment. Water Sci. Technol. 2009, 59, 1785–1791. [Google Scholar] [CrossRef] [PubMed]
- Meinzinger, F.; Londong, J.; Otterpohl, R. Resource Efficiency of Urban Sanitation Systems: A Comparative Assessment using Material and Energy Flow Analysis; Hamburg University of Technology (TUHH): Hamburg, Germany, 2010. [Google Scholar]
- Short, M.D.; Daikeler, A.; Peters, G.M.; Mann, K.; Ashbolt, N.J.; Stuetz, R.M.; Peirson, W.L. Municipal gravity sewers: An unrecognised source of nitrous oxide. Sci. Total Environ. 2014, 468–469, 211–218. [Google Scholar] [CrossRef] [PubMed]
- Xue, X.; Landis, A.E. Eutrophication potential of food consumption patterns. Environ. Sci. Technol. 2010, 44, 6450–6456. [Google Scholar] [CrossRef] [PubMed]
- Xue, X.; Landis, A.E. Evaluating agricultural management practices to improve the environmental footprints of corn-derived bioproducts. Renew. Energy 2014, 66, 454–460. [Google Scholar] [CrossRef]
- GmbH, G. Openlca. Available online: http://www.openlca.org/ (accessed on 15 June 2014).
- US EPA. Tool for Reduction and Assessment of Chemical and Other Environmental Impacts (TRACI); US EPA: Washington, DC, USA, 2015.
- US EPA. How Clean is the Electricity I Use?—Power Profiler. Available online: https://oaspub.epa.gov/powpro/ept_pack.charts (assessed on 23 January 2015).
- Electric Power Research Institute (EPRI). Water And Sustainability (Volume 4): U.S. Electricity Consumption for Water Supply and Treatment—The Next Half Century; EPRI: Concord, CA, USA, 2002. [Google Scholar]
- Otterpohl, R. Options for alternative types of sewerage and treatment systems directed to improvement of the overall performance. Water Sci. Technol. 2002, 45, 149–158. [Google Scholar] [PubMed]
- Zeeman, G.; Kujawa, K.; de Mes, T.; Hernandez, L.; de Graaff, M.; Abu-Ghunmi, L.; Mels, A.; Meulman, B.; Temmink, H.; Buisman, C.; et al. Anaerobic treatment as a core technology for energy, nutrients and water recovery from source-separated domestic waste(water). Water Sci. Technol. 2008, 57, 1207–1212. [Google Scholar] [PubMed]
- Stokes, J.R.; Horvath, A.; Sturm, R. Water loss control using pressure management: Life-cycle energy and air emission effects. Environ. Sci. Technol. 2013, 47, 10771–10780. [Google Scholar] [CrossRef] [PubMed]
- Larsen, T.A.; Alder, A.C.; Eggen, R.I.L.; Maurer, M.; Lienert, J. Source seperation: Will we see a paradigm shift in wastewater handling? Environ. Sci. Technol. 2009, 43, 6121–6125. [Google Scholar] [CrossRef] [PubMed]
- Asano, T.; Levine, A.D. Wastewater reclamation, recycling and reuse: Past, present and future. Water Sci. Technol. 1996, 33, 1–14. [Google Scholar] [CrossRef]
- Cordell, D. The Story of Phosphorus: Sustainability Implications of Global Phosphorus Scarcity for Food Security. Ph.D. Thesis, Linköping University, Linköping, Sweden, 2010. [Google Scholar]


| Input Parameter | Input Statistic | Range for the Sensitivity Analysis | References | |
|---|---|---|---|---|
| Distribution2 | Low (5th Percentile) | High (95th Percentile) | ||
| Carbon intensity of national average electricity mix, kg CO2-eq·(kWh)−1 | Triangular (0.51, 0.67, 0.84) | 0.56 | 0.80 | [59,72] |
| Carbon intensity of Falmouth average electricity mix, kg CO2-eq·(kWh)−1 | Triangular (0.31, 0.41, 0.53) | 0.28 | 0.49 | [59,72] |
| Electricity from co-digestion and CHP processes, kWh·(household·day)−1 | Triangular (270, 320, 385) | 285 | 370 | [46,53,54,55,56,57,58,60,63] |
| Flow rate for water distribution system, m3·(household·day)−1 | Normal (1.7, 0.2) | 1.4 | 2.0 | [1,73] |
| Pump and motor efficiencies for water distribution system | Triangular (0.65, 0.78, 0.85) | 0.69 | 0.82 | [1,73] |
| Chemical and energy inputs for centralized water treatment plant, MJ·(household·day)−1 | Normal (0.5, 0.06) | 0.40 | 0.65 | [1,73] |
| Chemical and energy inputs for centralized wastewater treatment plant, MJ·(household·day)−1 | Normal (0.94, 0.24) | 0.75 | 1.7 | [43] |
| Flow rate for greywater distribution, m3·(household·day)−1 | Normal (0.84, 0.08) | 0.68 | 1.0 | [50] |
| Pump and motor efficiencies for greywater distribution | Triangular (0.68, 0.78, 0.85) | 0.69 | 0.82 | [50] |
| Flow rate for blackwater transport m3·(household·day)−1 | Normal (0.06, 0.004) | 0.029 | 0.043 | [12,15] |
| Pump and motor efficiencies for blackwater transport | Triangular (0.68, 0.78, 0.85) | 0.69 | 0.82 | [12,15] |
| Flow rate for rainwater transport, m3·(household·day)−1 | Normal (0.68, 0.07) | 0.54 | 0.82 | [50] |
| Pump and motor efficiencies for rainwater transport | Triangular (0.68, 0.78, 0.85) | 0.69 | 0.82 | [50] |
| Electricity use for on-site filtration treatment, MJ·m−3 | Normal (3.6, 0.99) | 1.44 | 5.4 | [46,50,51] |
| UV dose for on-site UV treatment, MJ·m−2 | Triangular (0.02, 0.04, 0.08) | 0.03 | 0.07 | [48,49] |
© 2016 by the authors; licensee MDPI, Basel, Switzerland. This article is an open access article distributed under the terms and conditions of the Creative Commons Attribution (CC-BY) license (http://creativecommons.org/licenses/by/4.0/).
Share and Cite
Xue, X.; Hawkins, T.R.; Schoen, M.E.; Garland, J.; Ashbolt, N.J. Comparing the Life Cycle Energy Consumption, Global Warming and Eutrophication Potentials of Several Water and Waste Service Options. Water 2016, 8, 154. https://doi.org/10.3390/w8040154
Xue X, Hawkins TR, Schoen ME, Garland J, Ashbolt NJ. Comparing the Life Cycle Energy Consumption, Global Warming and Eutrophication Potentials of Several Water and Waste Service Options. Water. 2016; 8(4):154. https://doi.org/10.3390/w8040154
Chicago/Turabian StyleXue, Xiaobo, Troy R. Hawkins, Mary E. Schoen, Jay Garland, and Nicholas J. Ashbolt. 2016. "Comparing the Life Cycle Energy Consumption, Global Warming and Eutrophication Potentials of Several Water and Waste Service Options" Water 8, no. 4: 154. https://doi.org/10.3390/w8040154
APA StyleXue, X., Hawkins, T. R., Schoen, M. E., Garland, J., & Ashbolt, N. J. (2016). Comparing the Life Cycle Energy Consumption, Global Warming and Eutrophication Potentials of Several Water and Waste Service Options. Water, 8(4), 154. https://doi.org/10.3390/w8040154