1. Introduction
Worldwide, diarrheal disease is a leading cause of mortality [
1] and accounts for 15% of all deaths among children under the age of 5. In recent decades, the number of diarrheal deaths has dropped due to improved case management and effective oral rehydration therapy [
2]. However, the prevalence of early childhood enteric infection has been correlated with subsequent diminished school performance as well as impaired cognitive and physical function [
1,
3]. Such stunting has been termed environmental enteropathy [
4]. Early studies suggest that chronic exposure to fecal pathogens leads to intestinal inflammation and blunting of the intestinal villi. Furthermore, long-term inflammation can cause permanent structural changes in the intestinal wall, contributing to malnutrition, poor nutrient absorption, and impaired immune response [
5]. Studies in South America have shown that enteroaggregative
E. Coli and
Cryptosporidium infections, even without diarrheal symptoms, predispose children to growth stunting [
6].
Drinking water treatment is an important step to reduce the risk of diarrheal disease and environmental enteropathy. Point-of-use (POU) water treatment is lauded as a low-cost, effective, and scalable method for water disinfection; a meta-analysis demonstrated that POU water treatment is more effective than centralized water treatment systems in resource-limited regions at improving water quality, and thus reducing diarrheal disease [
7]. The World Health Organization recognizes the important role of POU water treatment and recommends, “properly formulated and locally relevant performance specifications are needed to protect users and inform decision-making regarding selection of technologies or approaches” [
8]. Ceramic water filters have been at the center of many studies with good results in social acceptability, economic viability, and environmental sustainability—the so-called "triple bottom line" [
9]. Even so, in their recent water filter evaluation report, MIT reported that low-priced water filters are not sufficient for reaching many rural populations and more non-electric treatment technologies are needed [
10].
In an effort to reduce environmental enteropathy and diarrheal infection, researchers at the University of Virginia developed a silver-impregnated porous ceramic technology (
Figure 1), an entirely new water treatment technology that diffuses silver ions to reduce pathogens [
11,
12]. Ceramic cubes that contain silver nanopatches within their pores are placed in a household bucket or jerry can, and silver ions diffuse out of the ceramic matrix and into the stored water. Treatment takes eight hours; the instructions suggest filling the container at night in order for the water to be ready for consumption in the morning. The ceramic cubes last for six months of daily use. Users can leave the ceramic cubes in the water container so treatment does not require any additional steps. Ceramic cubes only need to be removed when cleaning the container.
Silver ions are effective against bacteria [
13,
14,
15] and protozoa [
16]; furthermore, they are more effective than chlorine against
Cryptosporidium [
17,
18,
19]. Viruses [
20] and helminthes [
21] are also susceptible to silver ions. Silver, at safe yet effective concentrations, imparts no taste or color to the treated water. Dissolved oxygen concentration controls the release rate of silver ions [
22]; although, other substances have been shown to affect silver availability, such as pH, chloride, and organic material [
23].
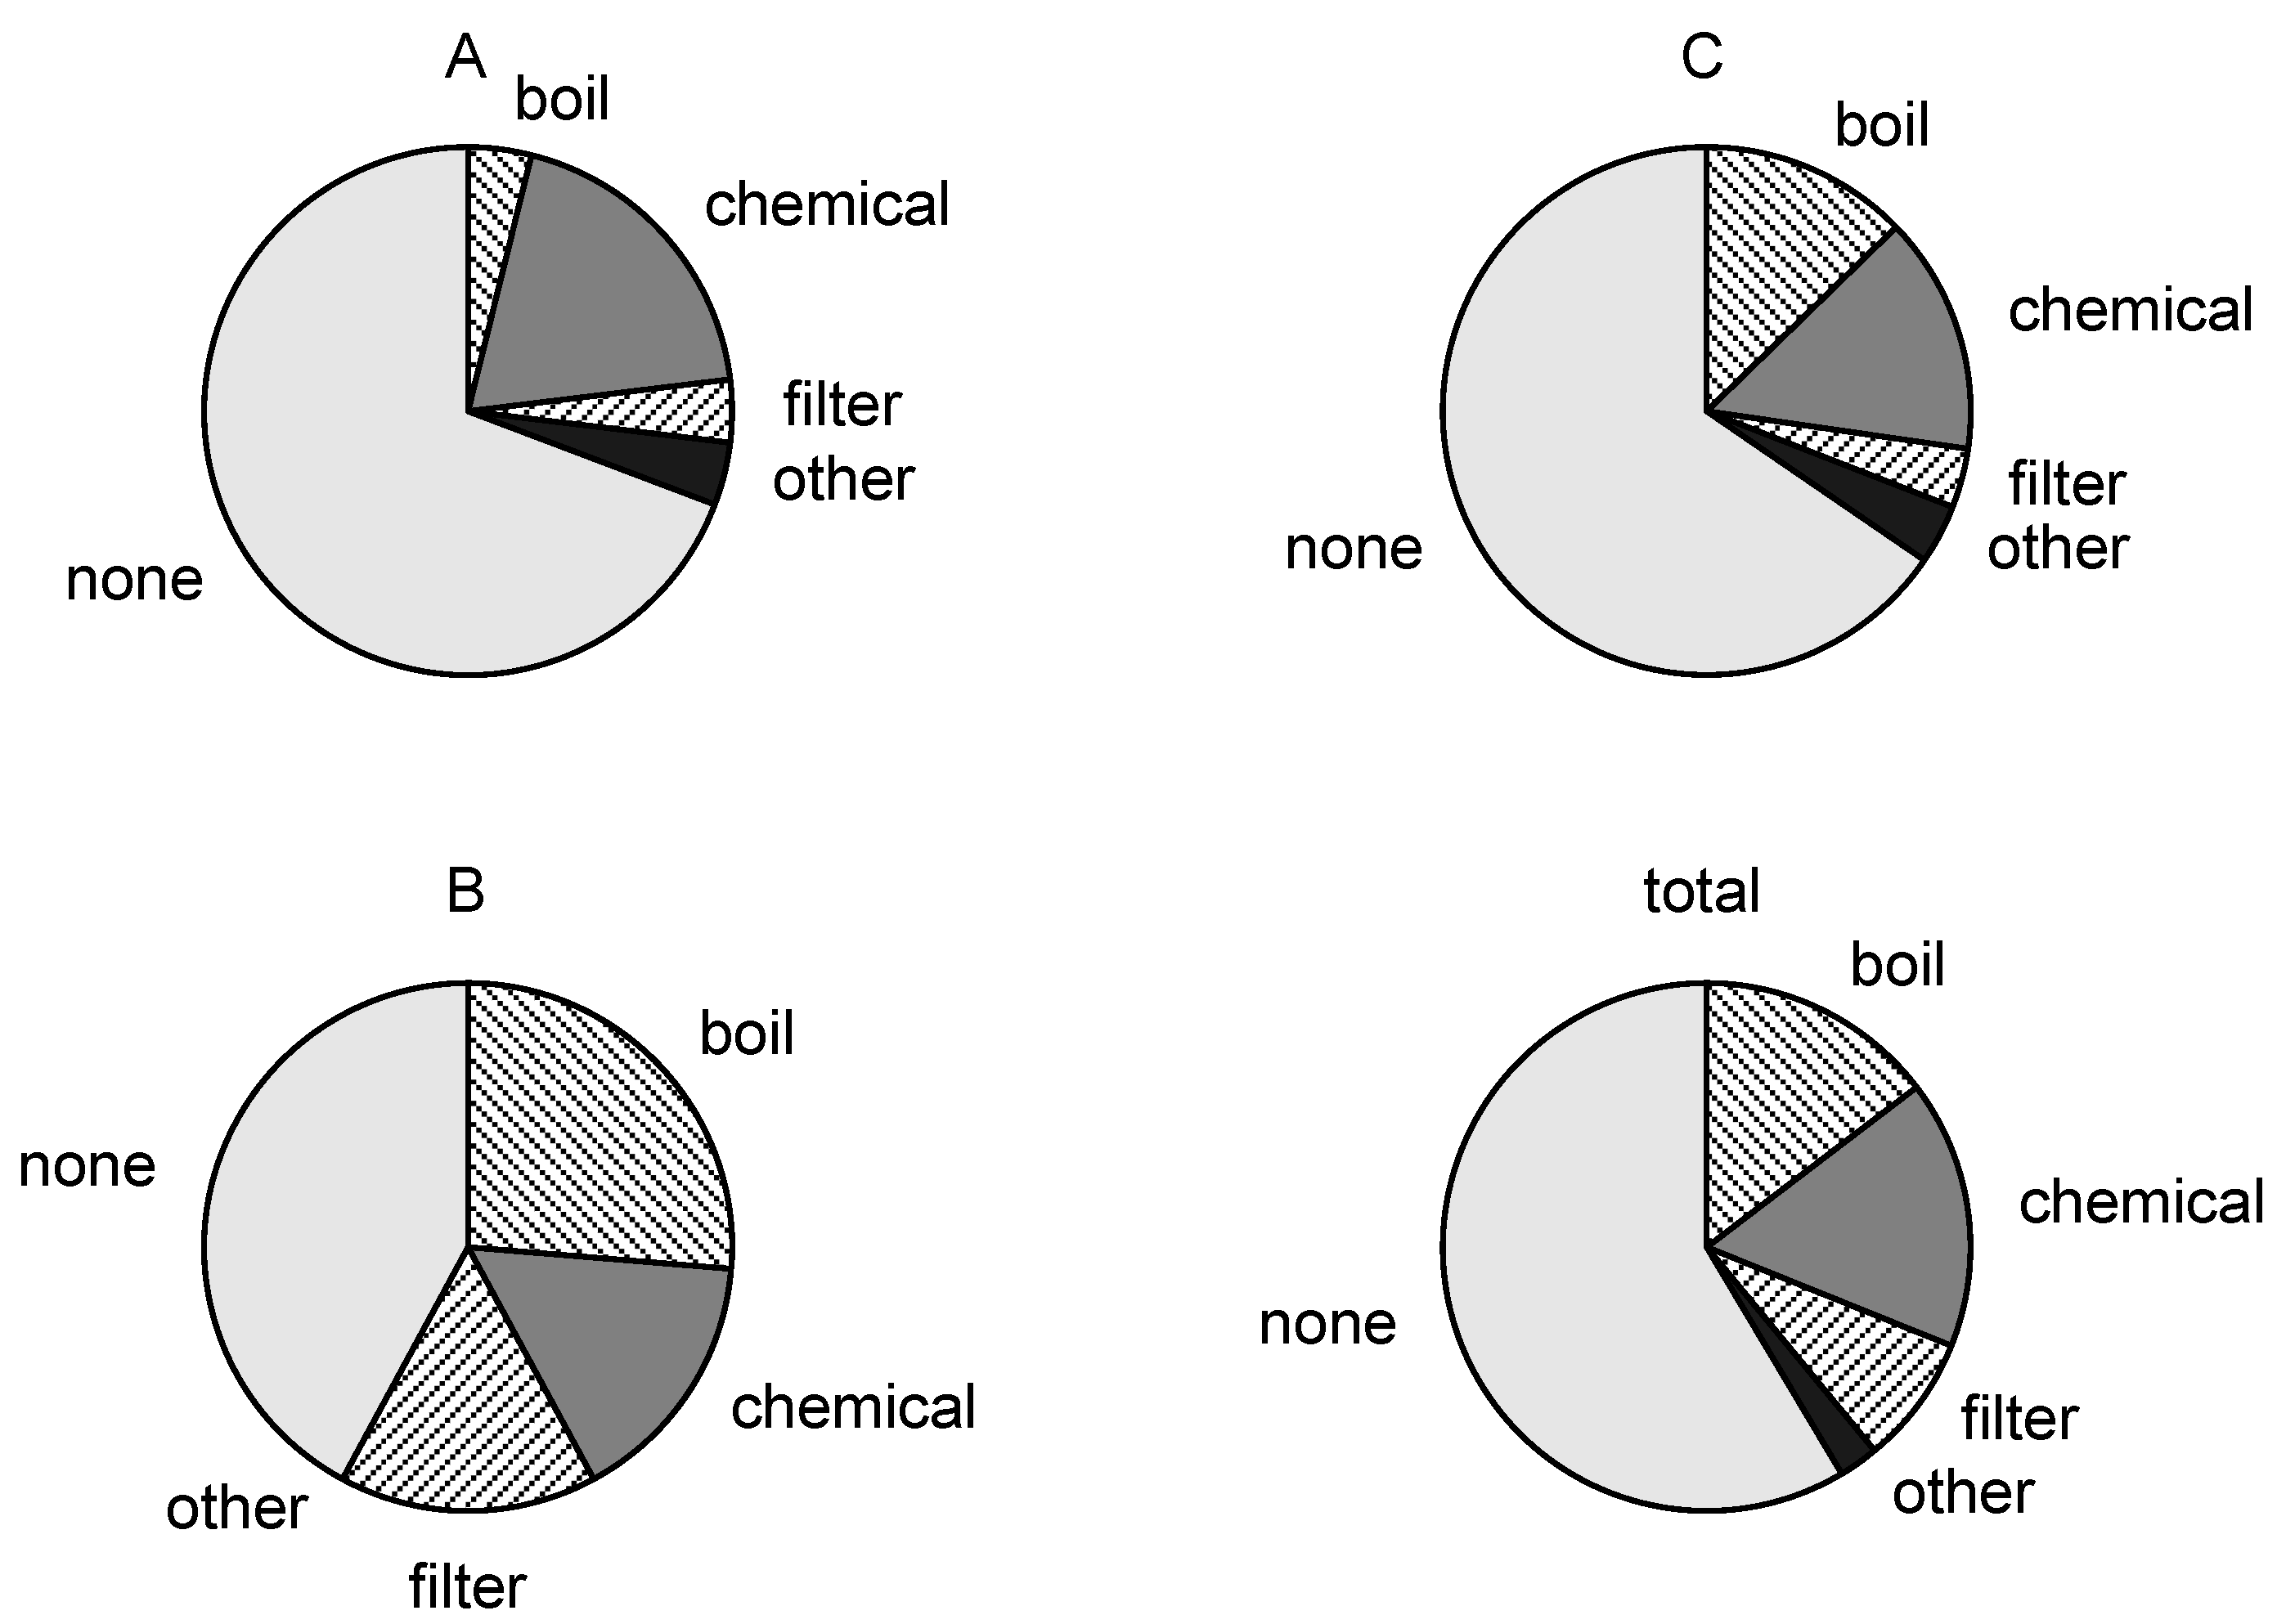
The other options for water treatment include filtration, boiling, and the use of other chemicals. Filters can be made locally with local materials [
24]. However, filters are also large and fragile; researchers observed that in the rural communities of South Africa, where most of this work was conducted, filters frequently fractured in transit over rough dirt roads. Furthermore, filters are still too expensive or not available for many rural residents [
10]. Boiling is another effective means for water treatment; however, it requires burning fuel, which can decrease indoor air quality and increase greenhouse gases. Perhaps most important to the consumer in the short-term, boiling water requires time and leaves the water less palatable. Chlorine is the most common POU treatment chemical. Unfortunately, devices that automatically provide the proper dose of the chemical are expensive and manual methods rely on the consumer to remember to obtain and dose each batch of water. Additionally, some people dislike the taste of chlorine so much that they discontinue routine use [
25,
26,
27,
28,
29].
1.1. Demographics
This research was conducted in three communities: communities A and B in the Vhembe District of Limpopo Provence, South Africa, and community C in the Dodoma Region, Tanzania. According to the 2001 census of South Africa, communities A and B have 584 and 471 households respectively, with a population of 2610 and 1952, respectively [
30]. According to data from the Tanzania Ministry of Water, Dodoma Region office, community C has a population of 3316 people [
31]. Researchers obtained demographic and water use data from 50 households in each of these communities. Communities A and B have customary chiefs as community leaders and fall under a complex cultural leadership organization with familial succession. All communities have water committees that manage various aspects of drinking water provision.
Basic demographic information was collected in a brief census conduced prior to the surveys in each of the communities. There is a characteristic youth bulge in all of the communities with 55%, 65%, and 59% of the population under 30 years of age in communities A, B, and C, respectively (
Figure S1a–c). There are notable differences in the income level between communities A and B, and community C; specifically, respondents from communities A and B generally have higher incomes than those from community C (
Figure S2). Communities A and B are connected through public transportation options multiple times a day to urban centers where there are employment options and cash-based trade opportunities. Community C has limited public transportation to urban centers. The community leaders and interpreters informed researchers that community C and the surrounding area rely almost entirely on agriculture and bartering; cash transactions are rare. In addition to income, there are notable differences in the level of formal education between communities A and B, and community C; specifically, respondents from communities A and B generally have attained a higher level of formal education than those in community C (
Table S1).
1.2. Water Access
Community A has its own self-funded water distribution system where water is drawn from a borehole and distributed through a community pipe network. The community water committee manages the water distribution system; operations and maintenance are funded through general fees that are not associated with consumption amount. Some sections of the community have water available each day although most sections have availability two to three days per week. Residents predominantly collect water from public standpipes. When the community boreholes are dry or contaminated, residents purchase water from wealthy neighbors’ private boreholes. Six percent of families in community A reported having a private borehole.
Community B has a water treatment and distribution system, located approximately 10 km away, that is operated by the municipality and funded by taxes. Water services are scheduled for two days per week in the study community and rotate to other communities on other days. In practice, the supply is inconsistent; when this research was conducted, the water treatment plant had been shut down for over a month because of a broken intake pipe. Most members of community B collect water from public standpipes. When the public standpipes are off, residents must gather water from the irrigation canal above community B, a spring, or the nearby river. Use of these surface water resources, compared to standpipe water, increases the travel time by a factor of ten for most households.
Community C has a deep well with a diesel-powered pump that supplies two large holding tanks that are connected to a distribution system. Access to the community taps is regulated; every standpipe is locked and residents who want to gather water must call a member of the water committee to unlock it. Residents pay a fee based on the number of jerry cans filled. Of those surveyed, 78% reported that they believe the tap water is of high quality; although only 40% use the public tap as their primary water source while 58% use a shallow, hand-dug well in the dry season. The shallow, hand-dug wells are not as productive in the dry season and more residents obtain water from the community taps; however, in the wet season, the shallow wells are more productive and more residents use them. Water from the shallow wells is collected by shoveling sand away from the bottom and transferring the water, less than one liter at a time, into a bucket. It is customary to filter turbid or cloudy water with two layers of commonly available cloth called a kanga.
2. Materials and Methods
The protocol described in this manuscript was approved by the Institutional Review Boards (IRB) of the University of Virginia: No. SBS-2015018100 and the University of Venda: No. SMNS/15/MBY/08/0306.
This study investigated the performance of a novel silver-impregnated ceramic for water disinfection [
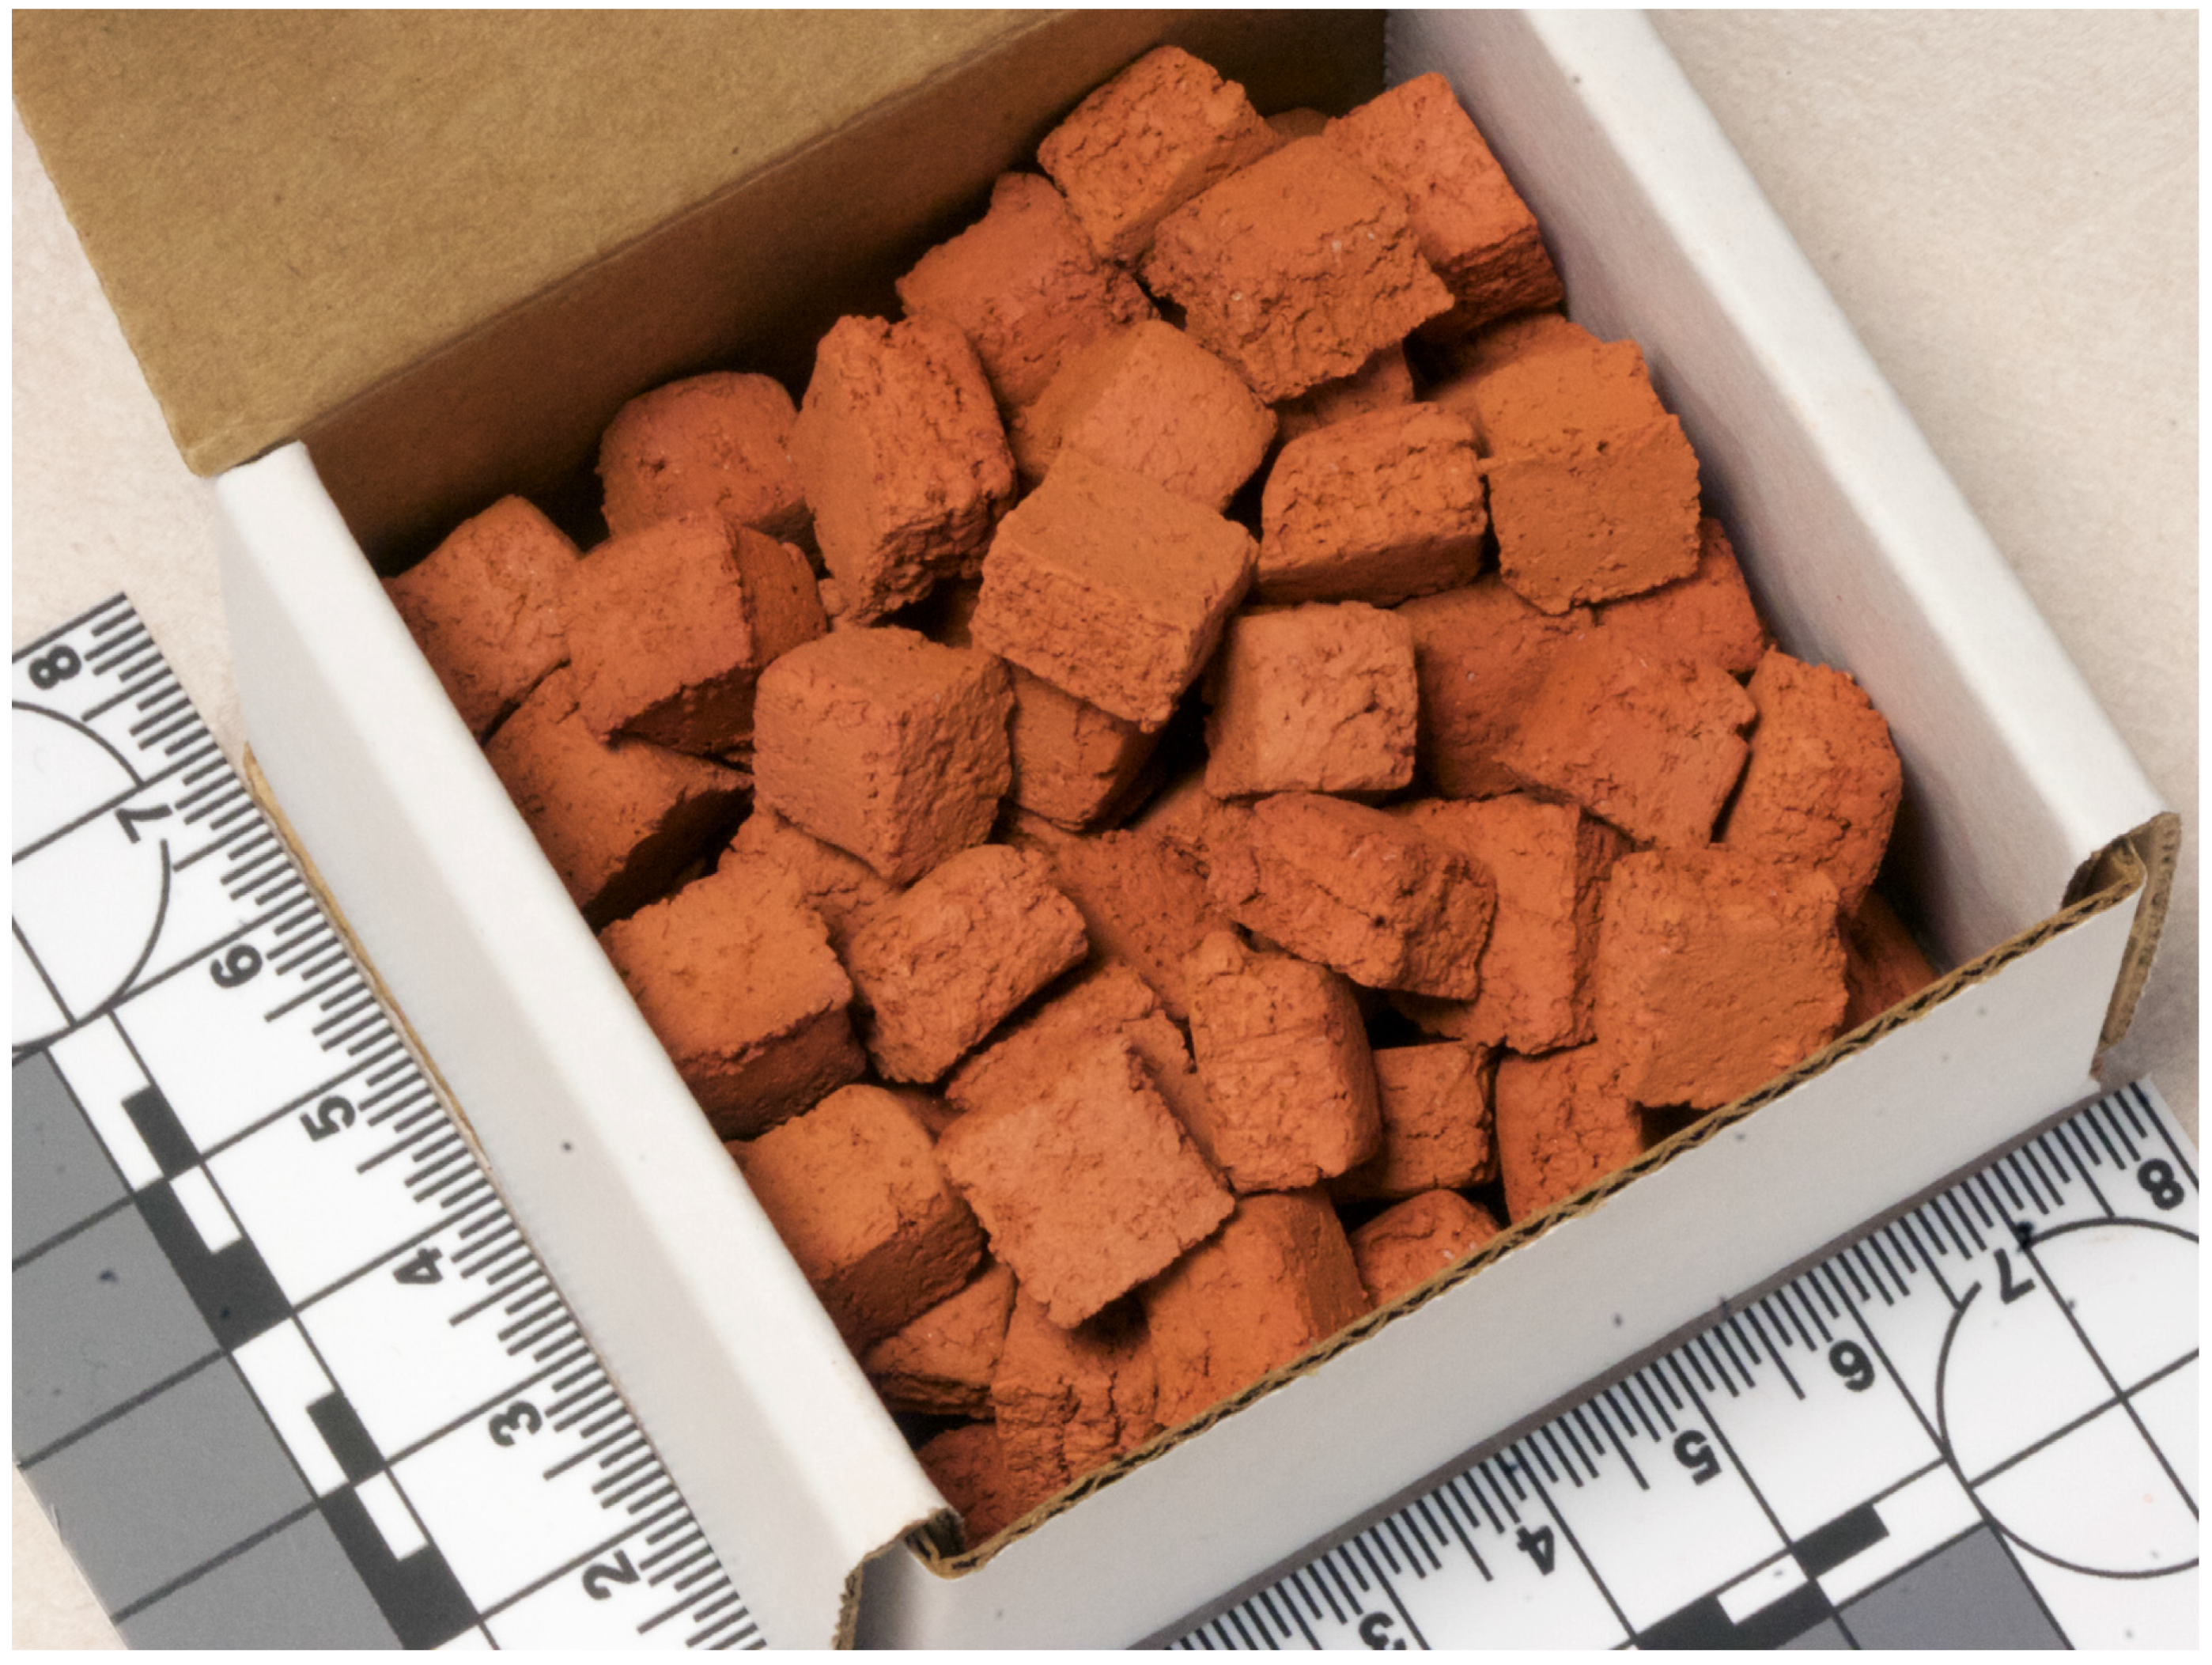
32]. The water treatment intervention tested here consisted of approximately 100 ceramic cubes, each approximately 1 cm
3 in volume, and packaged in a single box of about 130 g (
Figure 1). Additionally, the ceramic technology was distributed with locally available 22 L plastic buckets that had lids and spigots to reduce the risk of recontamination during retrieval of water. The cubes were produced at a facility at the University of Virginia according to the method described by Ehdaie
et al. [
33]. To disinfect 5–15 L of water, the ceramic cubes were placed in a bucket of water for at least eight hours. The dissolved oxygen in the water oxidized the silver nanopatches, which released silver ions. The silver ions diffused out of the porous ceramic and into the water.
2.1. Performance Testing
Researchers conducted performance tests in primary schools in communities A and C, and in the laboratory with highly contaminated water from a source near University of Venda not used as a drinking water supply. Buckets were cleaned to remove any manufacturing residue and a set of ceramic pieces was placed in the bottom. Any ceramic used for treating water for consumption was soaked for a minimum of 10 h prior to use.
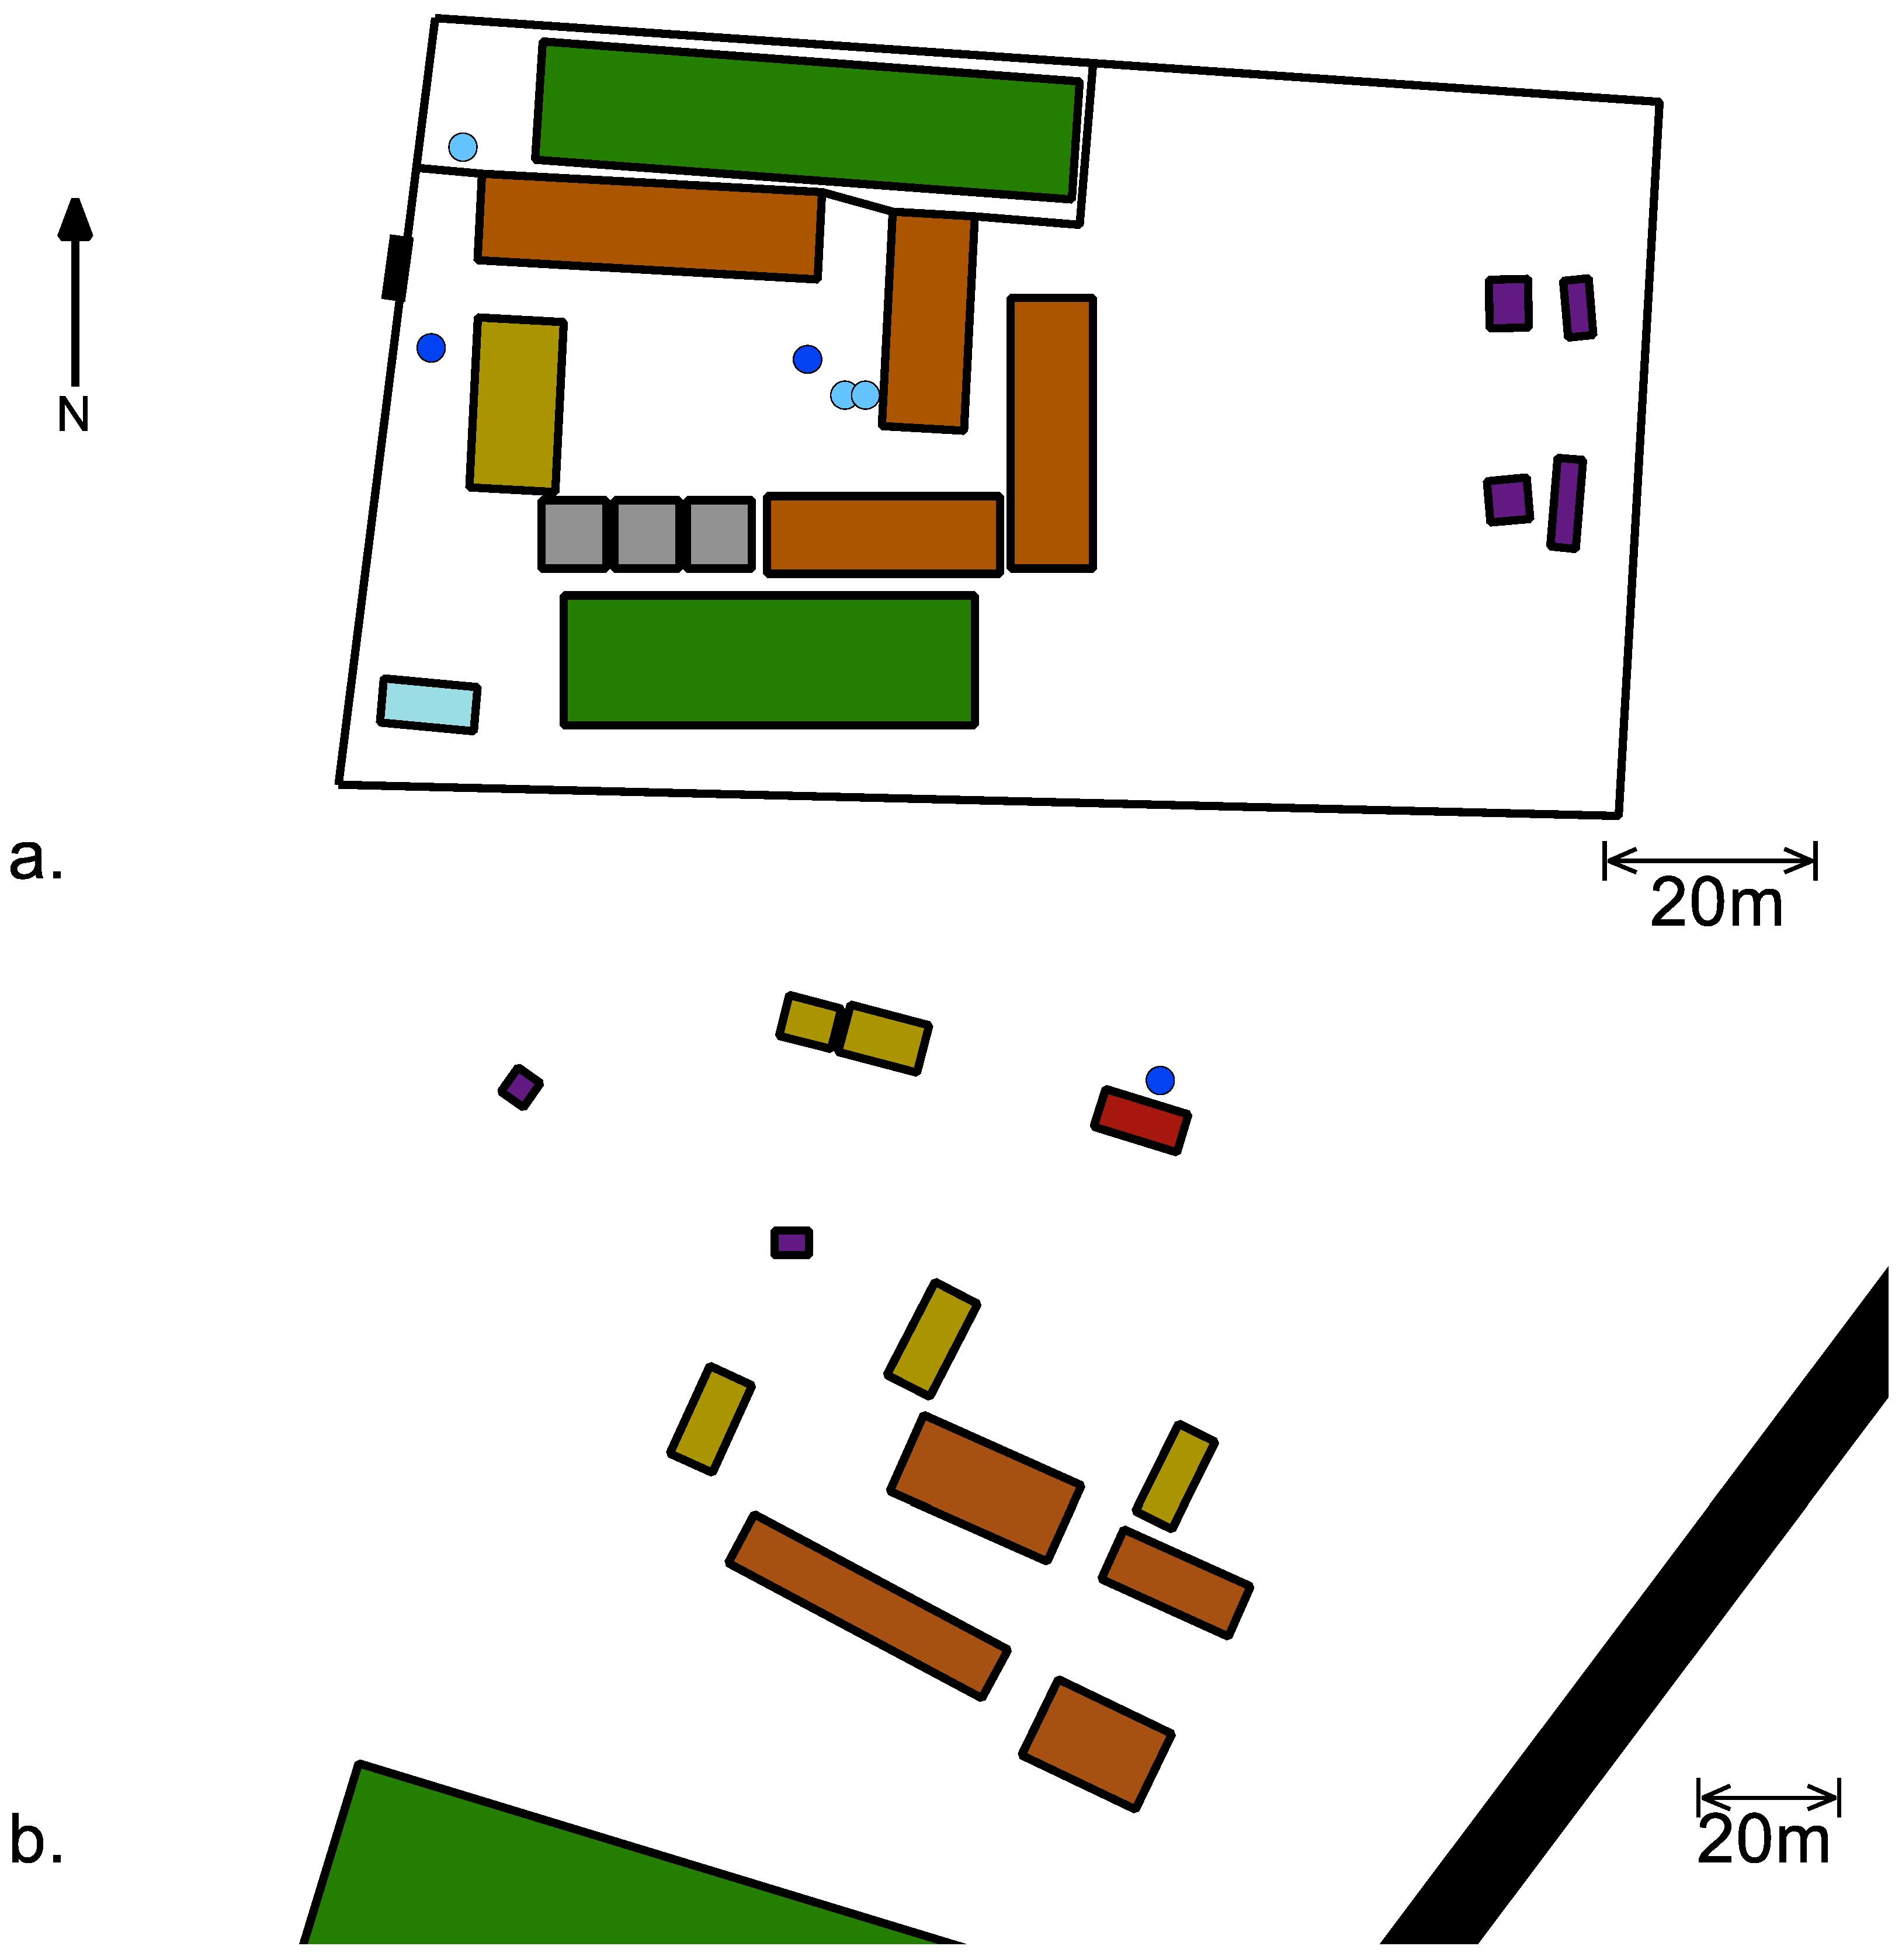
The water source at the primary school in community A was a deep borehole, separate from the community system, that was pumped into two 10,000 L tanks that supply a central tap in the school courtyard and two other taps near the administration building and the kitchen (
Figure 2a). A separate 10,000 L tank and tap were located on the perimeter of the property and supply a small garden. Each classroom had a drinking water bucket in front of the door with a communal cup. Students dipped the cup into the bucket to retrieve drinking water. At the primary school in community C (
Figure 2b), students and staff had access to the community water supply; there was no water placed closer to the classrooms. At the time of intervention, researchers supplied a bucket with spigot and ceramic cubes for the fourth and seventh grade intervention classrooms. Students provided their own cups.
Buckets were filled with approximately 15 L of water for the school (school tap for community A and community tap for community C) and 5–15 L of highly contaminated water in the laboratory. After the buckets were filled, water quality parameters were obtained. Water quality parameters were measured at most fillings via pH probe (pH), a chloride ion-selective electrode (Cl− concentration), dissolved oxygen probe (concentration dissolved O2), and turbidity meter (turbidity in Nephelometric turbidity units or NTUs). These probes connected to a Vernier LabView 2 console (Vernier Software and Technology, Beaverton, OR, USA). Due to sensor failure at the community C site, dissolved oxygen and temperature were obtained from a Fisher Scientific field probe (Fisher Scientific, Pittsburgh, PA, USA), while pH and turbidity were obtained from samples stored until replacement sensors were available at the field site.
The test buckets for the four classrooms (one bucket each) had a set of ceramic pieces inside and stored in the classroom overnight and placed in front of the door during class; the control buckets had no ceramics and were stored in the administration building in community A and in the clinic in community C. The buckets in the schools were filled at the conclusion of each school day, usually between 13:00 and 17:00, and not used until 07:30 the next morning. In the case of the water for Mondays, the buckets were filled at the end of classes on Friday. Samples were obtained at approximately 09:30 in community A and 08:30 in community C. Due to the distance between community C and the laboratory in Dodoma, bacterial samples were only obtained on Fridays. Samples from each of the buckets were obtained through a clean catch through the spigot by opening the spigot in the bucket fully open for at least 30 s, closing the spigot, and opening it again to fill the sample bag for microbiological analysis and vial for silver analysis.
Microbiological measurements were made based on the U.S. Environmental Protection Agency method 10023; occasionally, due to the remote location of the sites, some samples were measured outside of the recommended six-hour limit. Samples were transported in an insulated container between collection and testing sites. Microbiological samples were tested for total coliform and E. Coli via membrane filtration. At the South African laboratory, the sample cups of the manifold were rinsed and placed in a hot water bath set to 100 °C for a minimum of 20 minutes and flushed with reverse osmosis water. At the Tanzanian laboratory, the manifold and sample cups were cleaned with local municipal tap water and two complete flushes of boiling reverse osmosis water. Boiling water flushes were allowed to rinse through the junction of the sample cup and filter paper holder to ensure a completely clean surface. Sterile, individually packaged, 4.5 × 10⁻⁷ m pore filter paper disks (EMD Millipore, Billerica, MA, USA) were transferred to the surface of the manifold with forceps with an aseptic technique. Depending on the precision desired, 100–300 mL of treated water samples or 0.1 mL (10−3 dilution) to 100 mL of control sample were passed through the filters. The filter paper was transferred by aseptic technique to a sterile petri dish with absorbent pad. A sterile, 2 mL ampule of selective growth media solution (m-ColiBlue24, EMD Millipore) was added to the petri dish. The petri dishes were incubated at 35 °C for 23–25 h.
Water samples analyzed for silver content. Researchers added 0.14 mL of 70% nitric acid (Fisher Chemical) to the 5 mL samples to reduce silver ion chelation. Total silver was measured with a graphite furnace (HGA 900, Perkin-Elmer, Waltham, MA, USA) atomic absorption spectrometer (AA2100, Perkin-Elmer).
2.2. Chloride Interaction Tests
Researchers prepared a stock E. Coli solution and divided it into batch reactors plus one control reactor of 100 mL each. The batch reactors were divided into two sets and dosed with silver ions of different concentrations. Within each set, a range of chloride ion concentrations was introduced. After eight hours, samples from the disinfection sets and control were tested for bacteria.
To obtain viable E. Coli, frozen stock (IDEXX Laboratories, Inc., Westbrook, ME, USA) was thawed and mixed with Luria-Bertani (LB) Broth. To make the LB Broth,10 g/L yeast extract (Sigma-Aldrich, St. Louis, MO, USA) was mixed with 10 g/L sodium chloride (Fisher Chemical, Fair Lawn, NJ, USA) and 5 g/L bacto-tryptic soy broth (Becton, Dickson and Company, Sparks, MD, USA) in deionized water (≈18 MΩ, Thermo Fisher, Fair Lawn, NJ, USA) and sterilized in an autoclave (Tuttnauer Brinkmann, 3545E-B/L, Hauppauge, NY, USA). The bacteria in LB broth was incubated at 37 °C for 24 h. Each reactor was inoculated with 0.1 mL of the E. Coli LB broth mixture. The bacteria were mixed in a phosphate buffer (PB) solution to maintain bacterial viability but retard growth before disinfection experiments. The PB solution was formulated with 1.12 g/L of phosphate dibasic (Fisher Chemical) and 0.48 g/L of potassium phosphate monobasic (Sigma-Aldrich) in deionized water and sterilized. Each batch reactor was treated with silver ions (from silver nitrate, Acros Organics, NJ, USA); one set at 6 ppb and the other set at 12 ppb. Each reactor was also dosed with a range of chloride concentrations (from calcium chloride, Fisher Chemical). A control bucket, without silver or chloride was compared to the buckets with silver and chloride ions. Samples were taken and the antibacterial activity of the silver was quenched by the addition of 2.64 mL of 60 g/L of sodium thiosulfate (Fisher Chemical). The bacterial levels were measured by the most-probable number technique with Colilert Quanti-Tray, Standard Method 9223B with Colilert media and IDEXX Quanti-Trays (IDEXX Laboratories, Inc.).
2.3. Acceptance
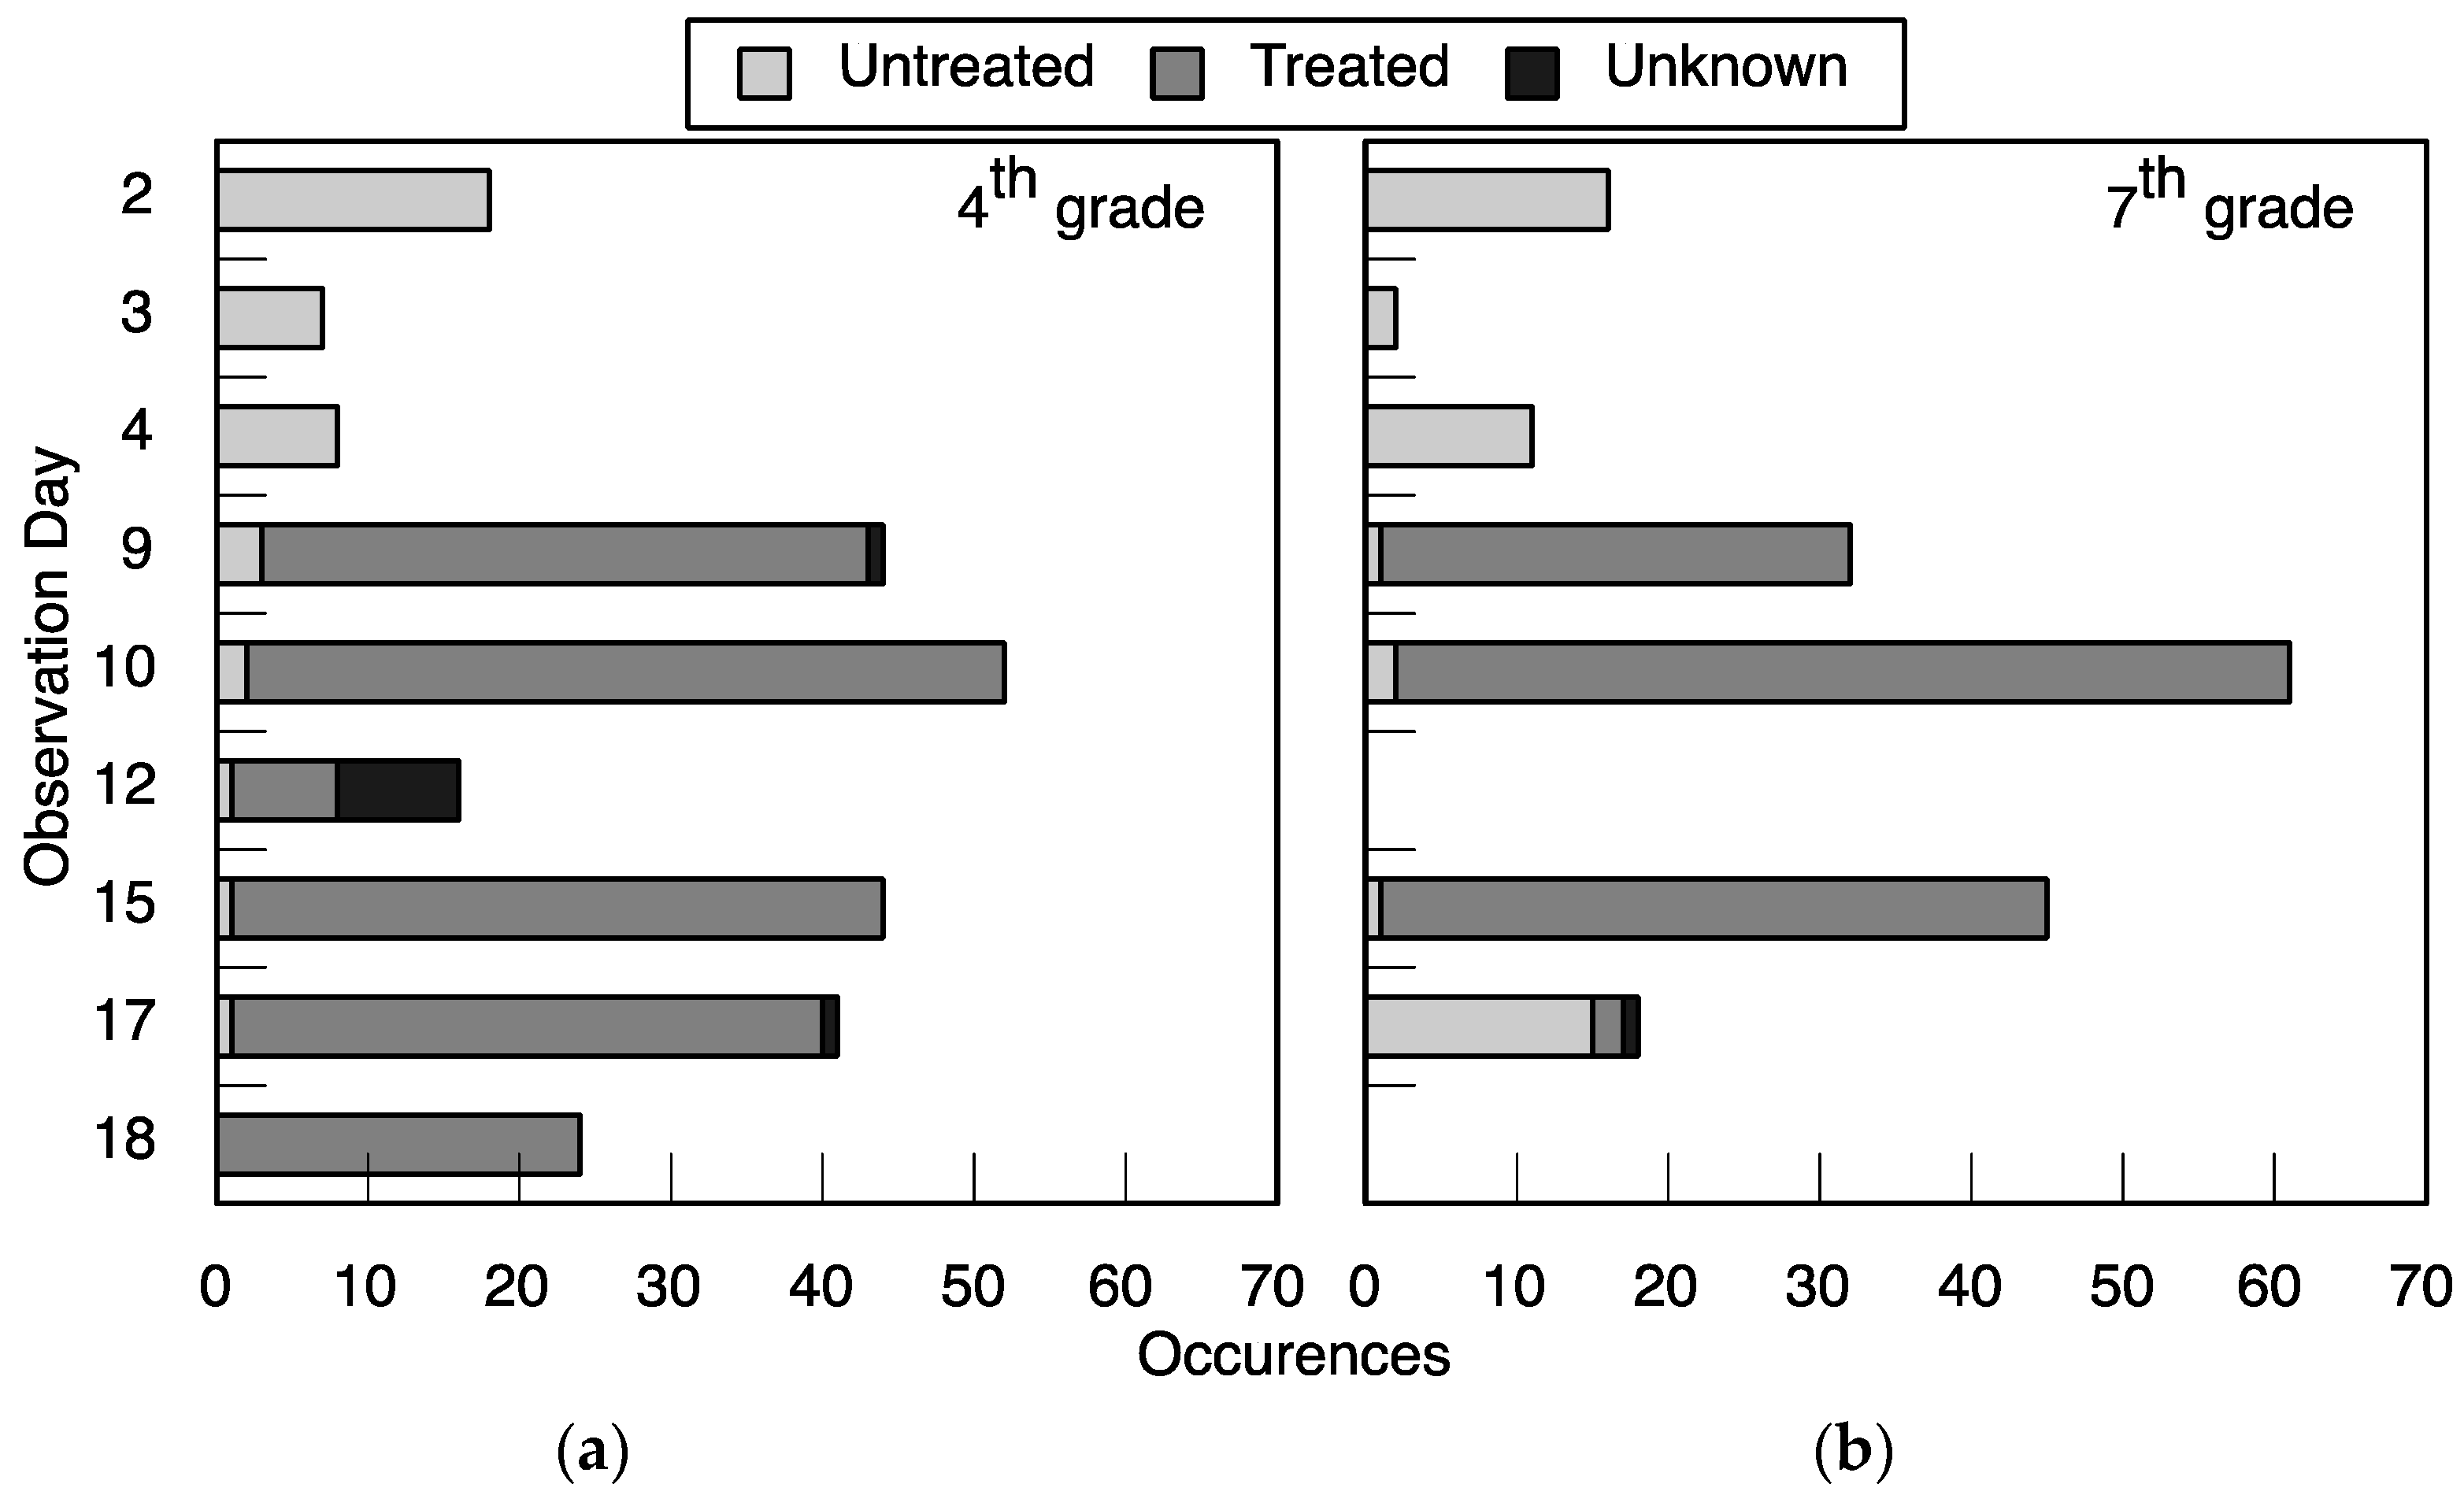
A primary school in community A was used to test the local acceptance of the water treatment technology through a drinking water intervention. At the school, four classrooms were observed, two classes in fourth grade and two in seventh grade. Each class had about 30 students. Before starting the study, researchers notified students and parents of the study and informed them how to exercise their option to not participate.
Observations occurred over three periods of one week each, identified here at T1, T2, and T3. Researchers observed and recorded the hygiene and drinking water habits of students from a central vantage point in the school courtyard (
Figure 2). Researchers observed students for three days in each observational period. The first observation period, T1, established baseline behavior. Students used their usual drinking water facilities; the water treatment was not yet offered. Researchers observed the drinking water consumption of the students. In the second observation period, T2, water treated with the silver-embedded ceramic technology was offered adjacent to the students’ normal drinking water containers. Students were not instructed on the technology’s use, and students still had access to their usual drinking water source. The researchers or school administrators refilled the water buckets and placed them in the classrooms overnight. In the morning, the students placed the buckets with treated water outside the classrooms next to the bucket with untreated water. Researchers observed if there were any changes in use of the drinking water. In the final observation period, T3, researchers delivered an educational module in their classrooms, provided the treated water, and observed drinking water use.
The one-hour module was instructed in the local language, Tshivenda, by one of the research assistants during regular school hours while the teacher observed each classroom. To develop the curriculum, researchers first consulted with the teachers to discuss appropriate topics and activities for the location and age groups and used available educational resources (Document S1). The curriculum covered the health benefits of drinking water, germ theory, basic microbiology, healthy hand-washing methods, water treatment methods, and proper water storage. In the water treatment section, researchers explained locally common water treatment techniques and, specifically, the ceramic water treatment technology used in the school and how it functions. The lessons were delivered with hands-on activities to engage the students throughout the module.
2.4. Priorities and Valuation
In communities A and B, researchers met with the traditional chiefs and identified several sections of the community where they were allowed to conduct surveys; within each section, houses were chosen at random. Researchers verified that the sections of houses were distributed geographically throughout the communities. In community C, the Anglican Church, a parish of the Anglican Diocese of Central Tanganyika, operates an orphan placement program with volunteer families in the community. Survey subjects were selected from the group of families that have accepted orphans; it is not possible to determine that these families were a representative sample.
Researchers administered a survey to 50 households in each of the three communities that included questions about their current water treatment practices and a willingness-to-pay study. Native speakers of the community languages (Tshivenda in communities A and B, and Kigogo in community C) who were also fluent in English interpreted the survey and responses. In communities A and B, the survey was performed in conjunction with the demographic surveys reported in
Section 2. In community C, the survey was administered to families separately from the demographic study. The survey questions were intended to determine the behaviors around drinking water procurement and storage. The key questions that we report were:
“What, if anything, do you use to treat your water?”
“What do you use to retrieve water from its storage vessel?”
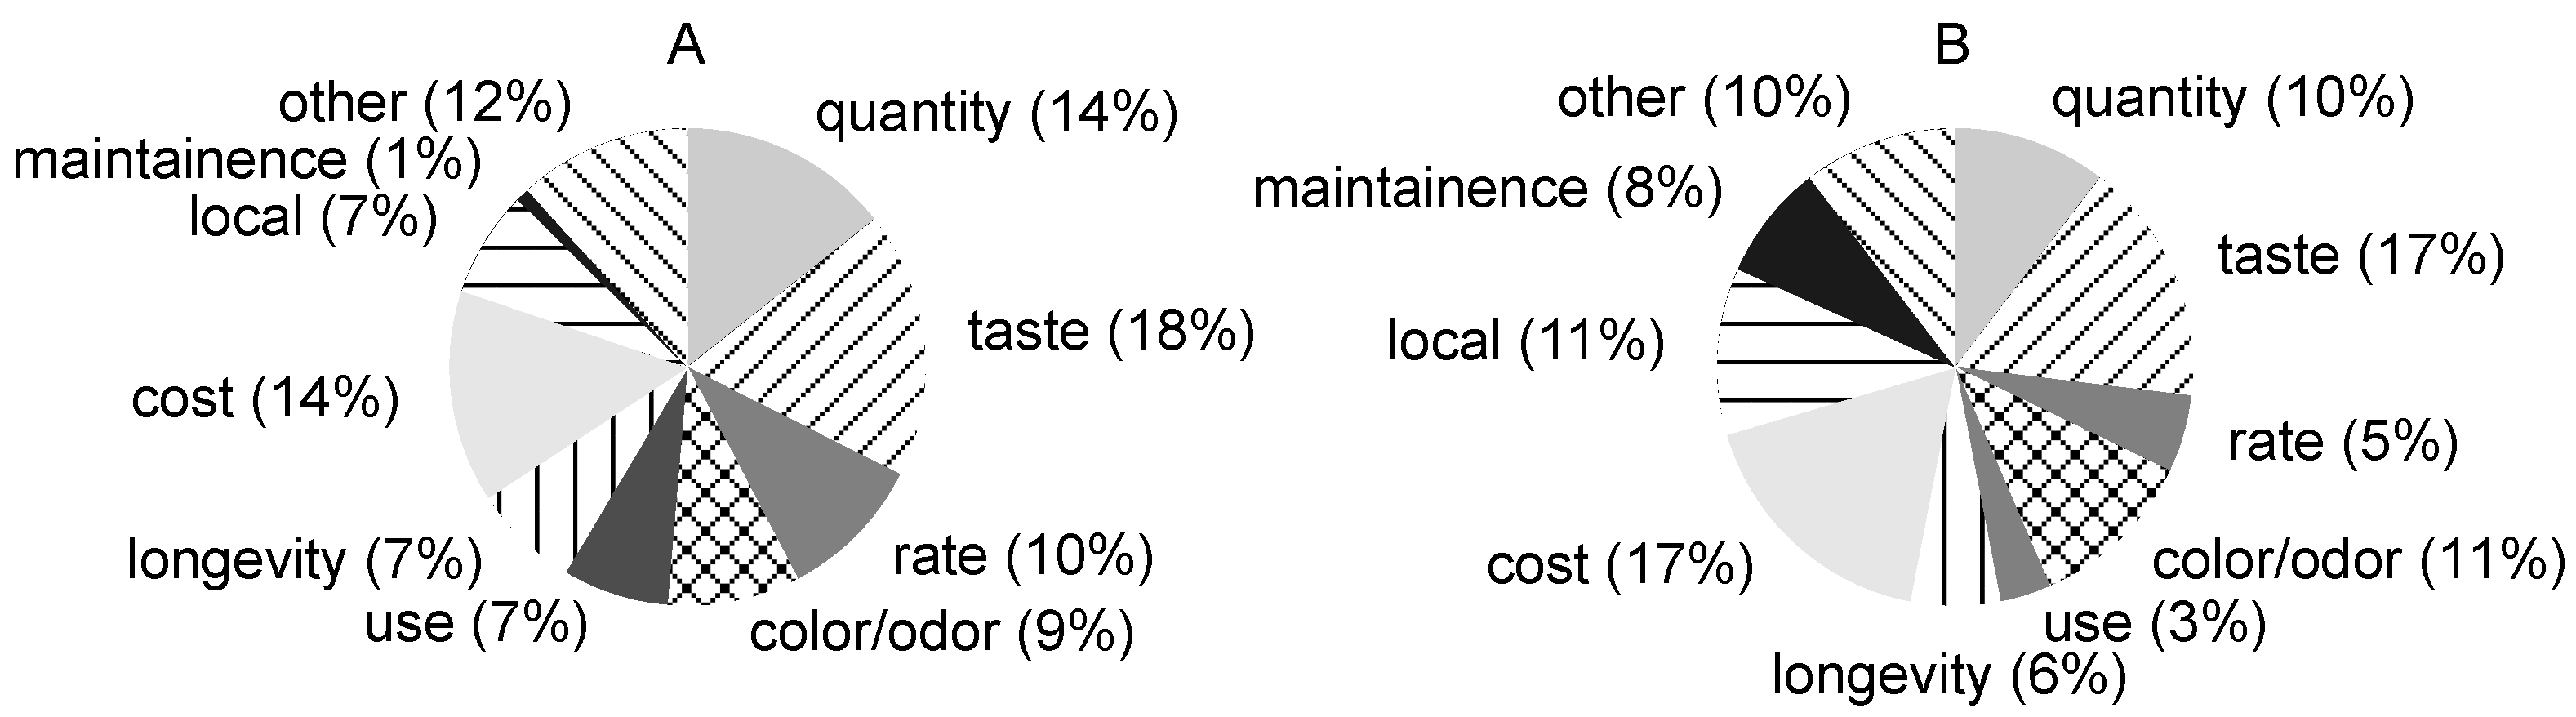
“What are the three most important water treatment characteristics, in no particular order, to you and your family?”
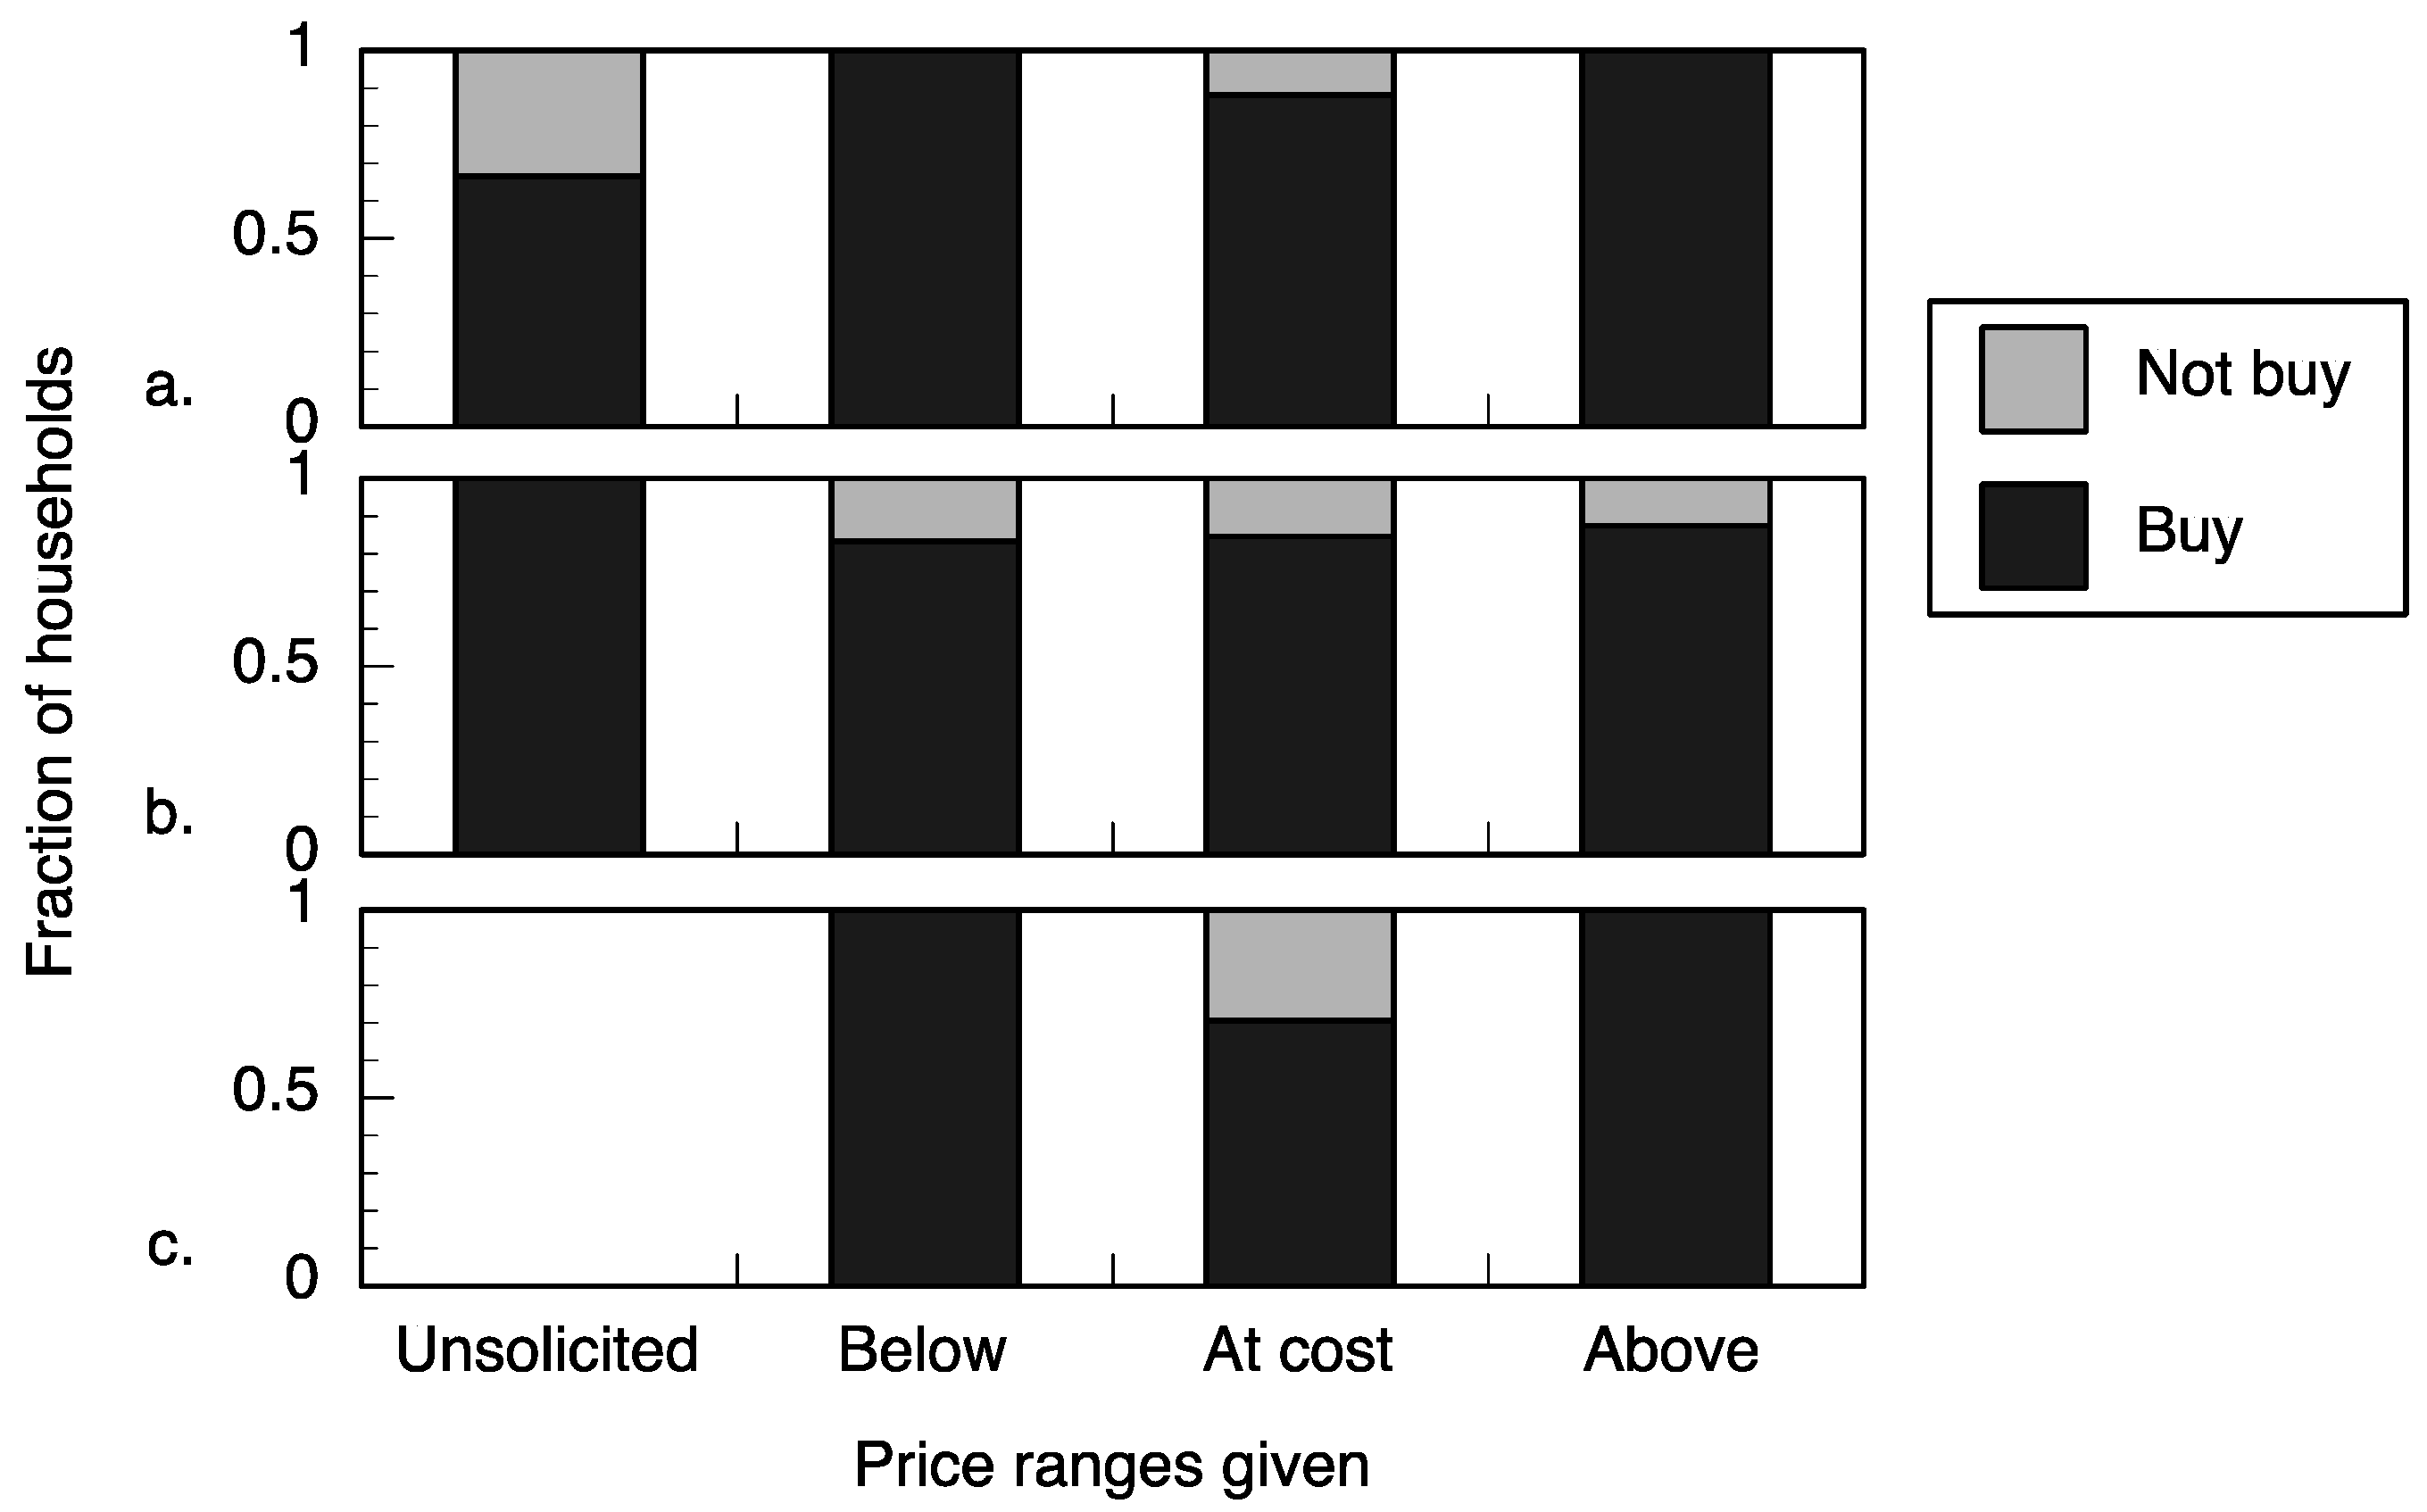
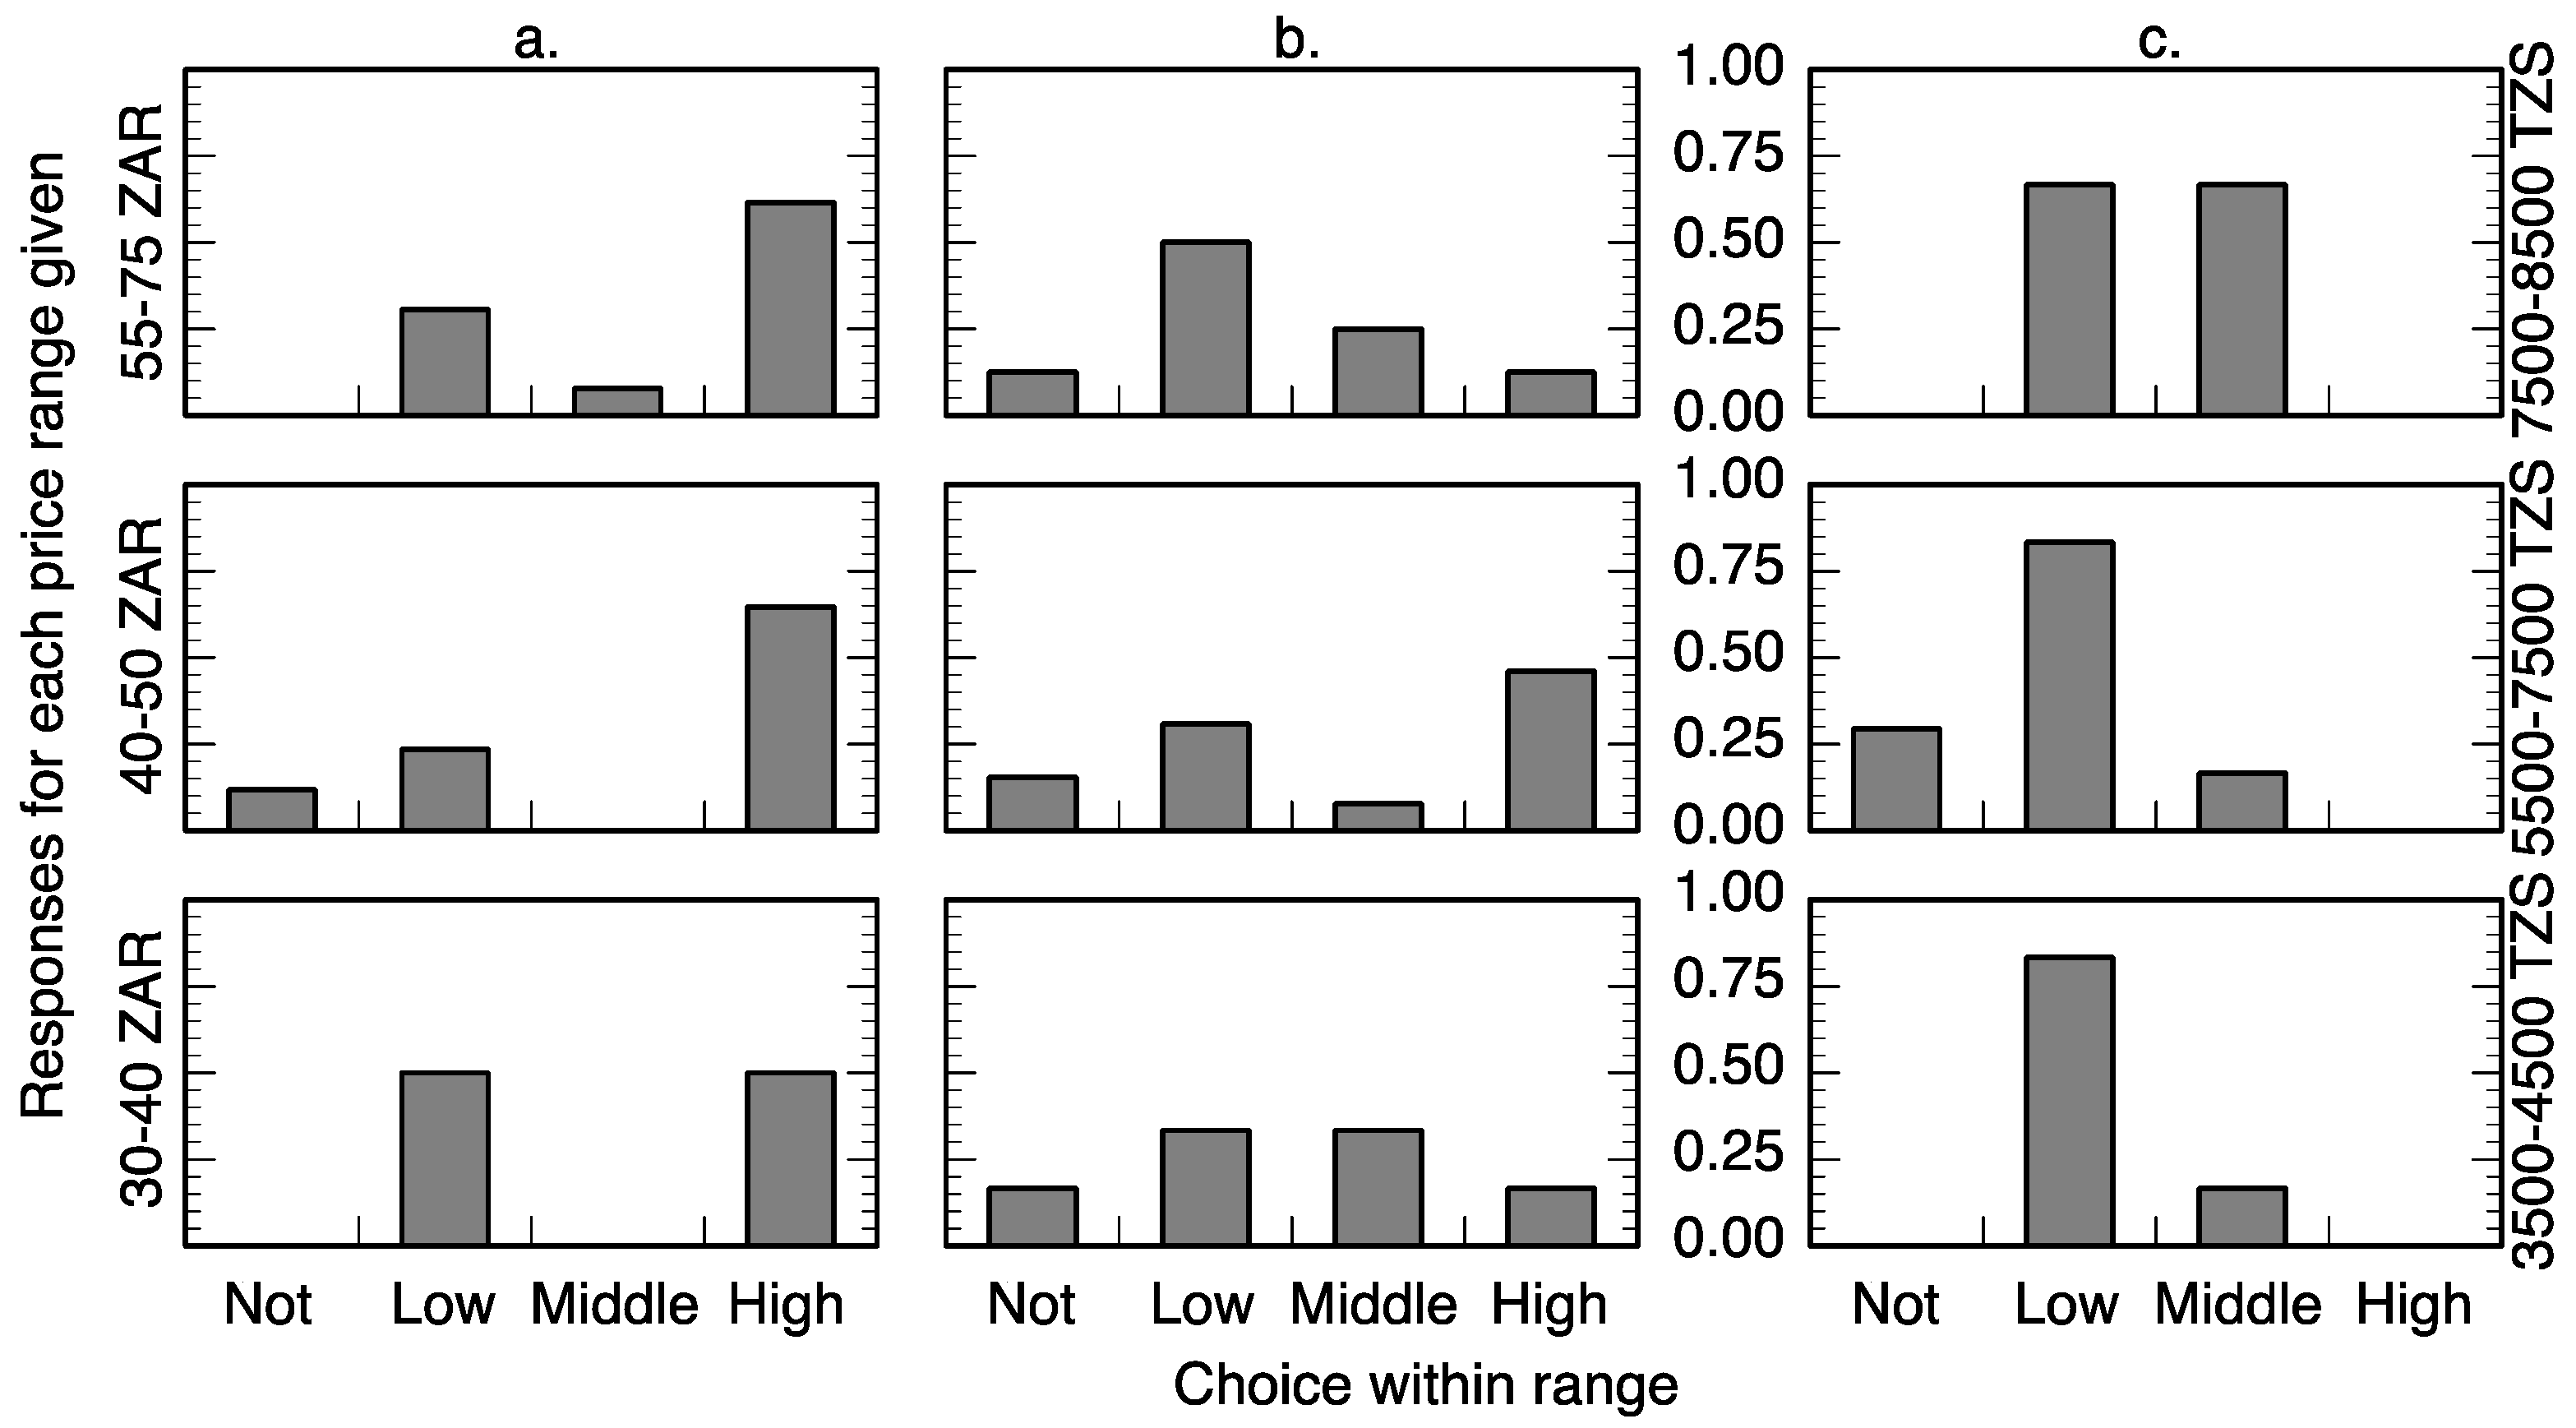
After the survey questions, the researchers explained the function and proper usage of the silver-impregnated porous ceramic technology to the household respondent. The household respondent was then presented with a range of potential prices for the ceramic technology as well as the option to not pay any of the choices. There were three ranges of prices presented based on the cost of production of the technology, which is approximately 3 USD. The purpose of these ranges in the willingness-to-pay survey was to determine if the technology could be sold at a price above the cost of production (unknown profit margin, sustainable business model), at the cost of production (little to no profit margin but may cover costs), or below the cost of production (subsidies required to distribute the technology). Respondents were presented with an above cost, at cost, or below cost range (
Table 1) and were asked to choose which price in the range they would be willing to pay for the ceramic technology.
To validate the willingness-to-pay study, researchers offered the technology for sale at the price evaluated in the survey; if the household agrees to purchase the technology, the price evaluated is a valid measurement of willingness-to-buy. In all of the communities included, sales were not done at the time of survey because households typically do not have cash available. Sales were conducted at predetermined times and respondents and community leaders were notified of those times in advance. In community A, the ceramic cubes were sold at the local ceramic factory for three Fridays during the month in which the research was conducted. The surveyed community members were informed that the ceramic technology was available for purchase on these days at the price that they selected in the survey. Due to the small number of research subjects and their geographic proximity, respondents were not actually sold the technology at different prices but charged a uniform price to reduce potential conflicts. When the respondent attempted to purchase the technology at their reported price, they were sold the product at a standard rate of 30 ZAR (approximately 2.48 USD). Respondents that arrived to purchase were counted as “willing to buy.” Community B was not included in the willingness-to-buy component because residents were receiving ceramic water filters made possible by a philanthropic organization separate from this study. In community C, the ceramic cubes were sold at the local church for one week at the end of the survey period. In addition to the methodology and prices described for community A, respondents from community C were offered a work-for-pay option to purchase the technology. The community C work option was three hours of manual labor, which at the local labor rates was approximately worth 6000 TZS (approximately 3.02 USD) [
34].
4. Discussion
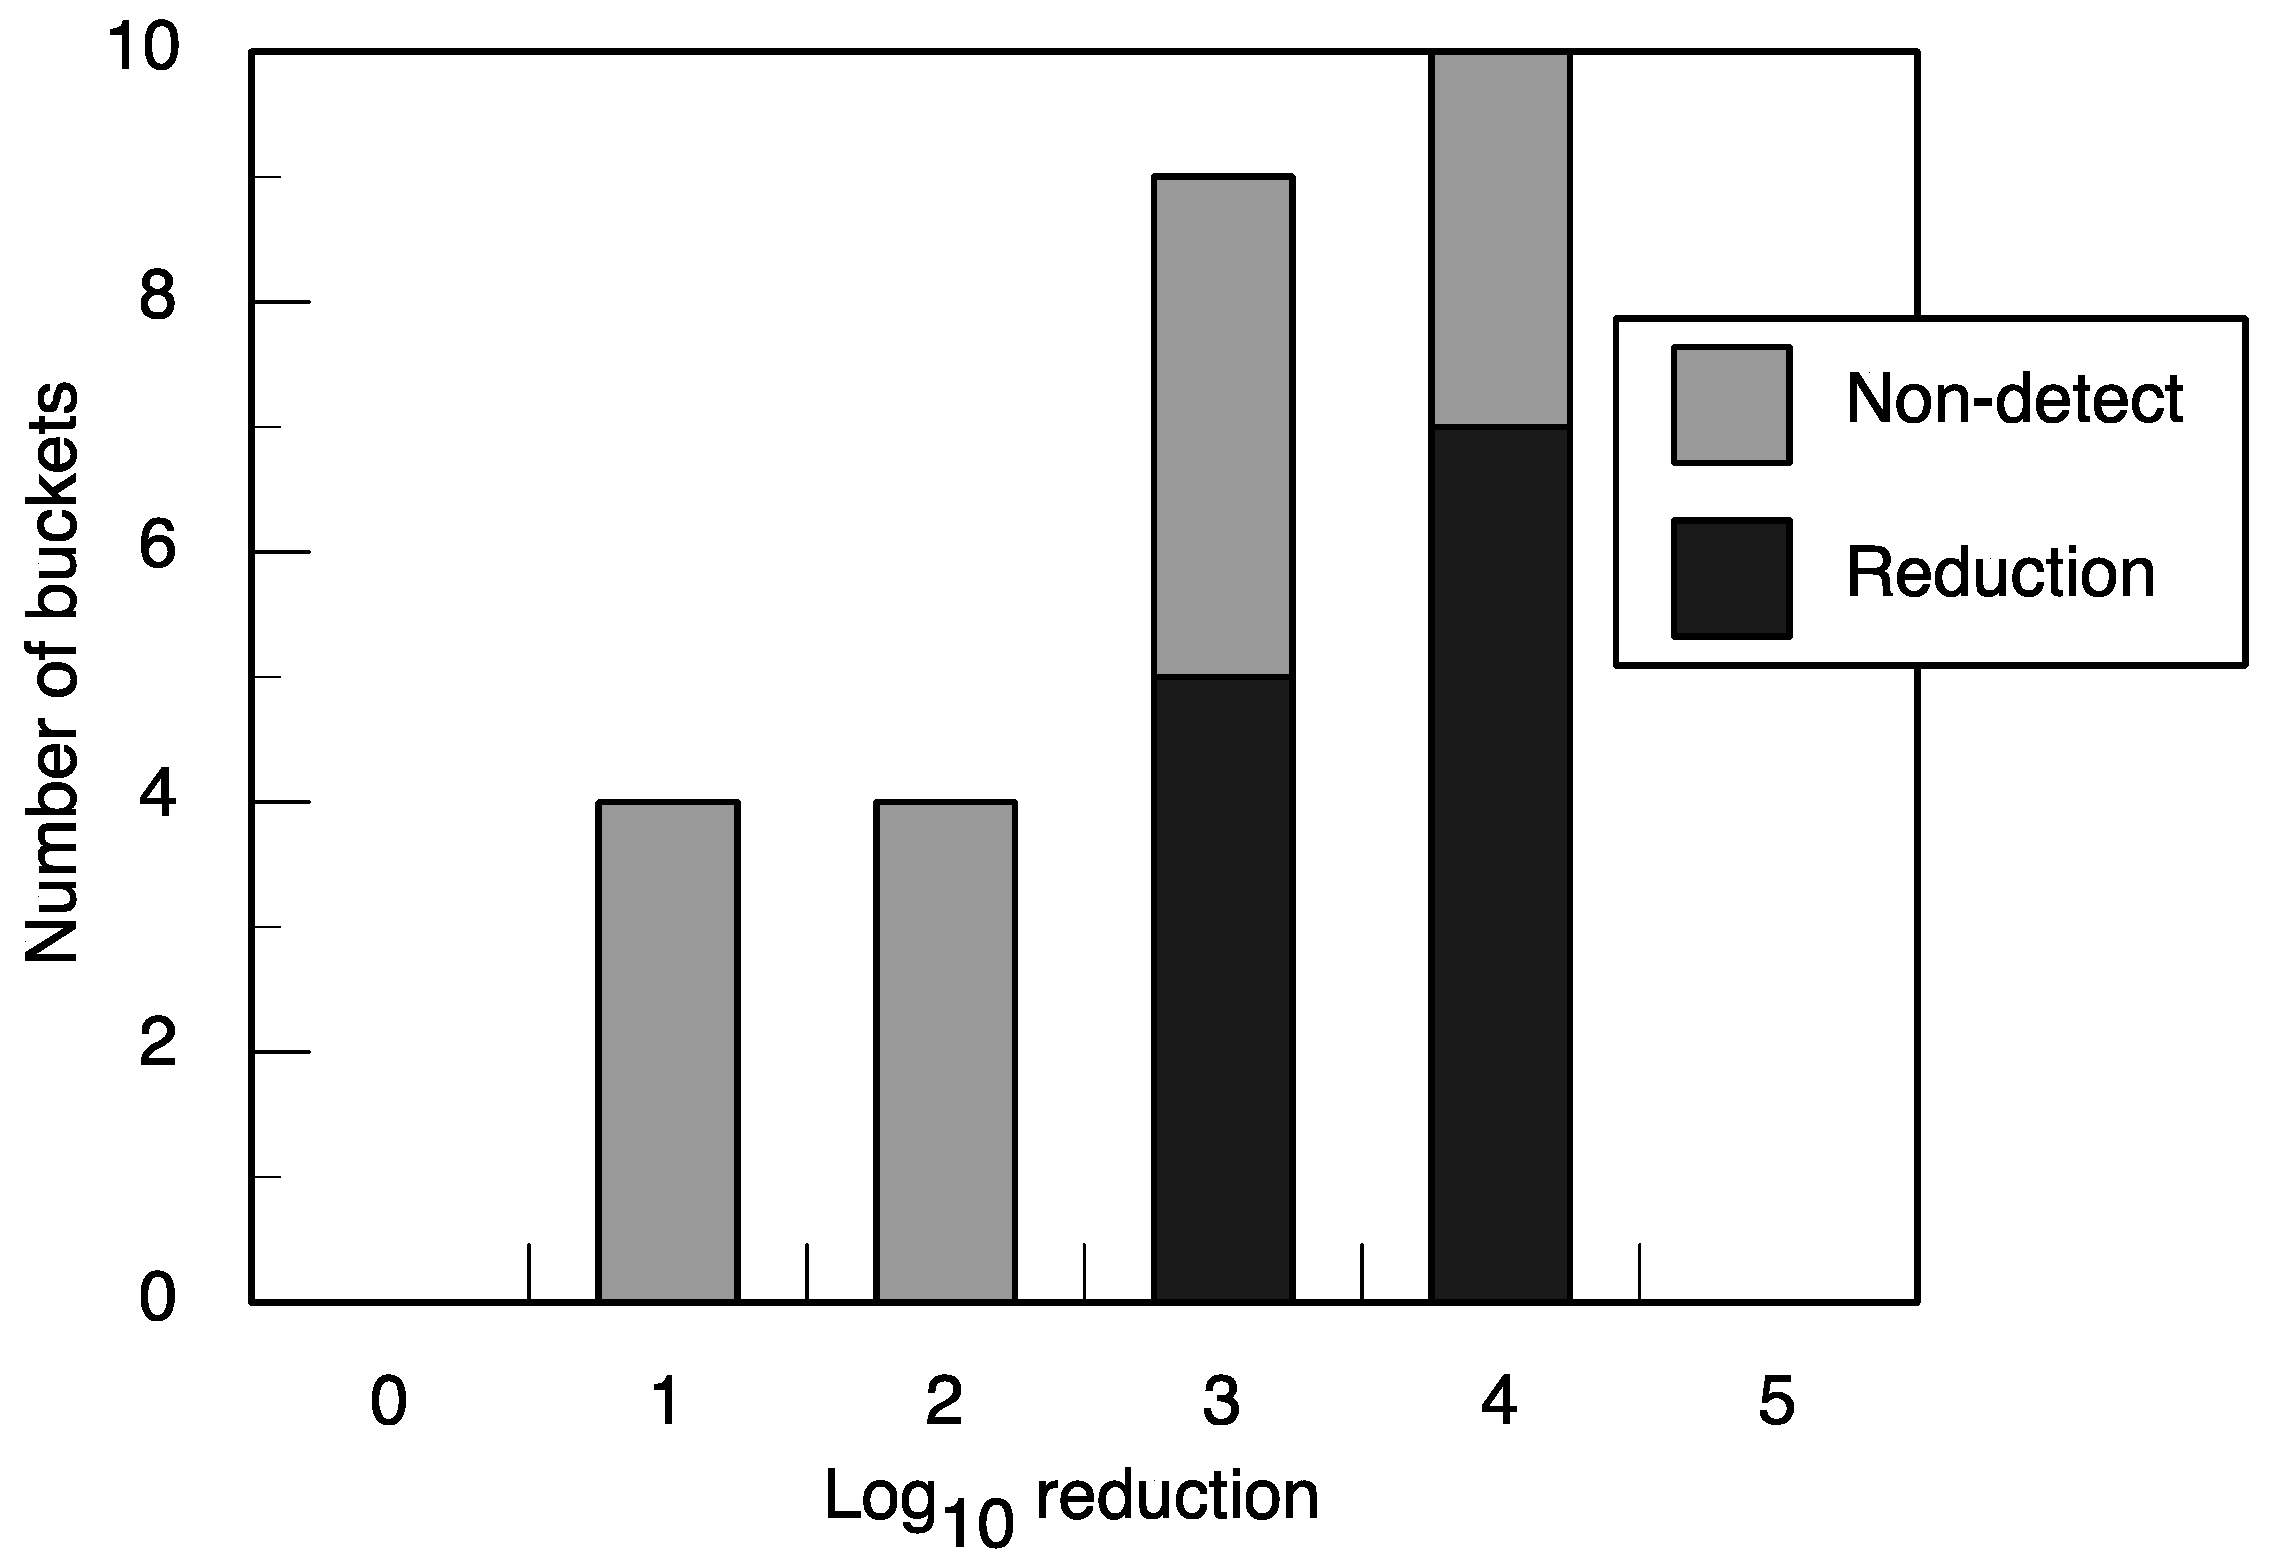
This study measured the performance and acceptance of a silver-based point-of-use water treatment. The performance testing demonstrated that the water treatment is effective at coliform bacteria reduction of a factor of 10
−3–10
−4 while maintaining safe levels of silver for human consumption. Both primary schools had minimal
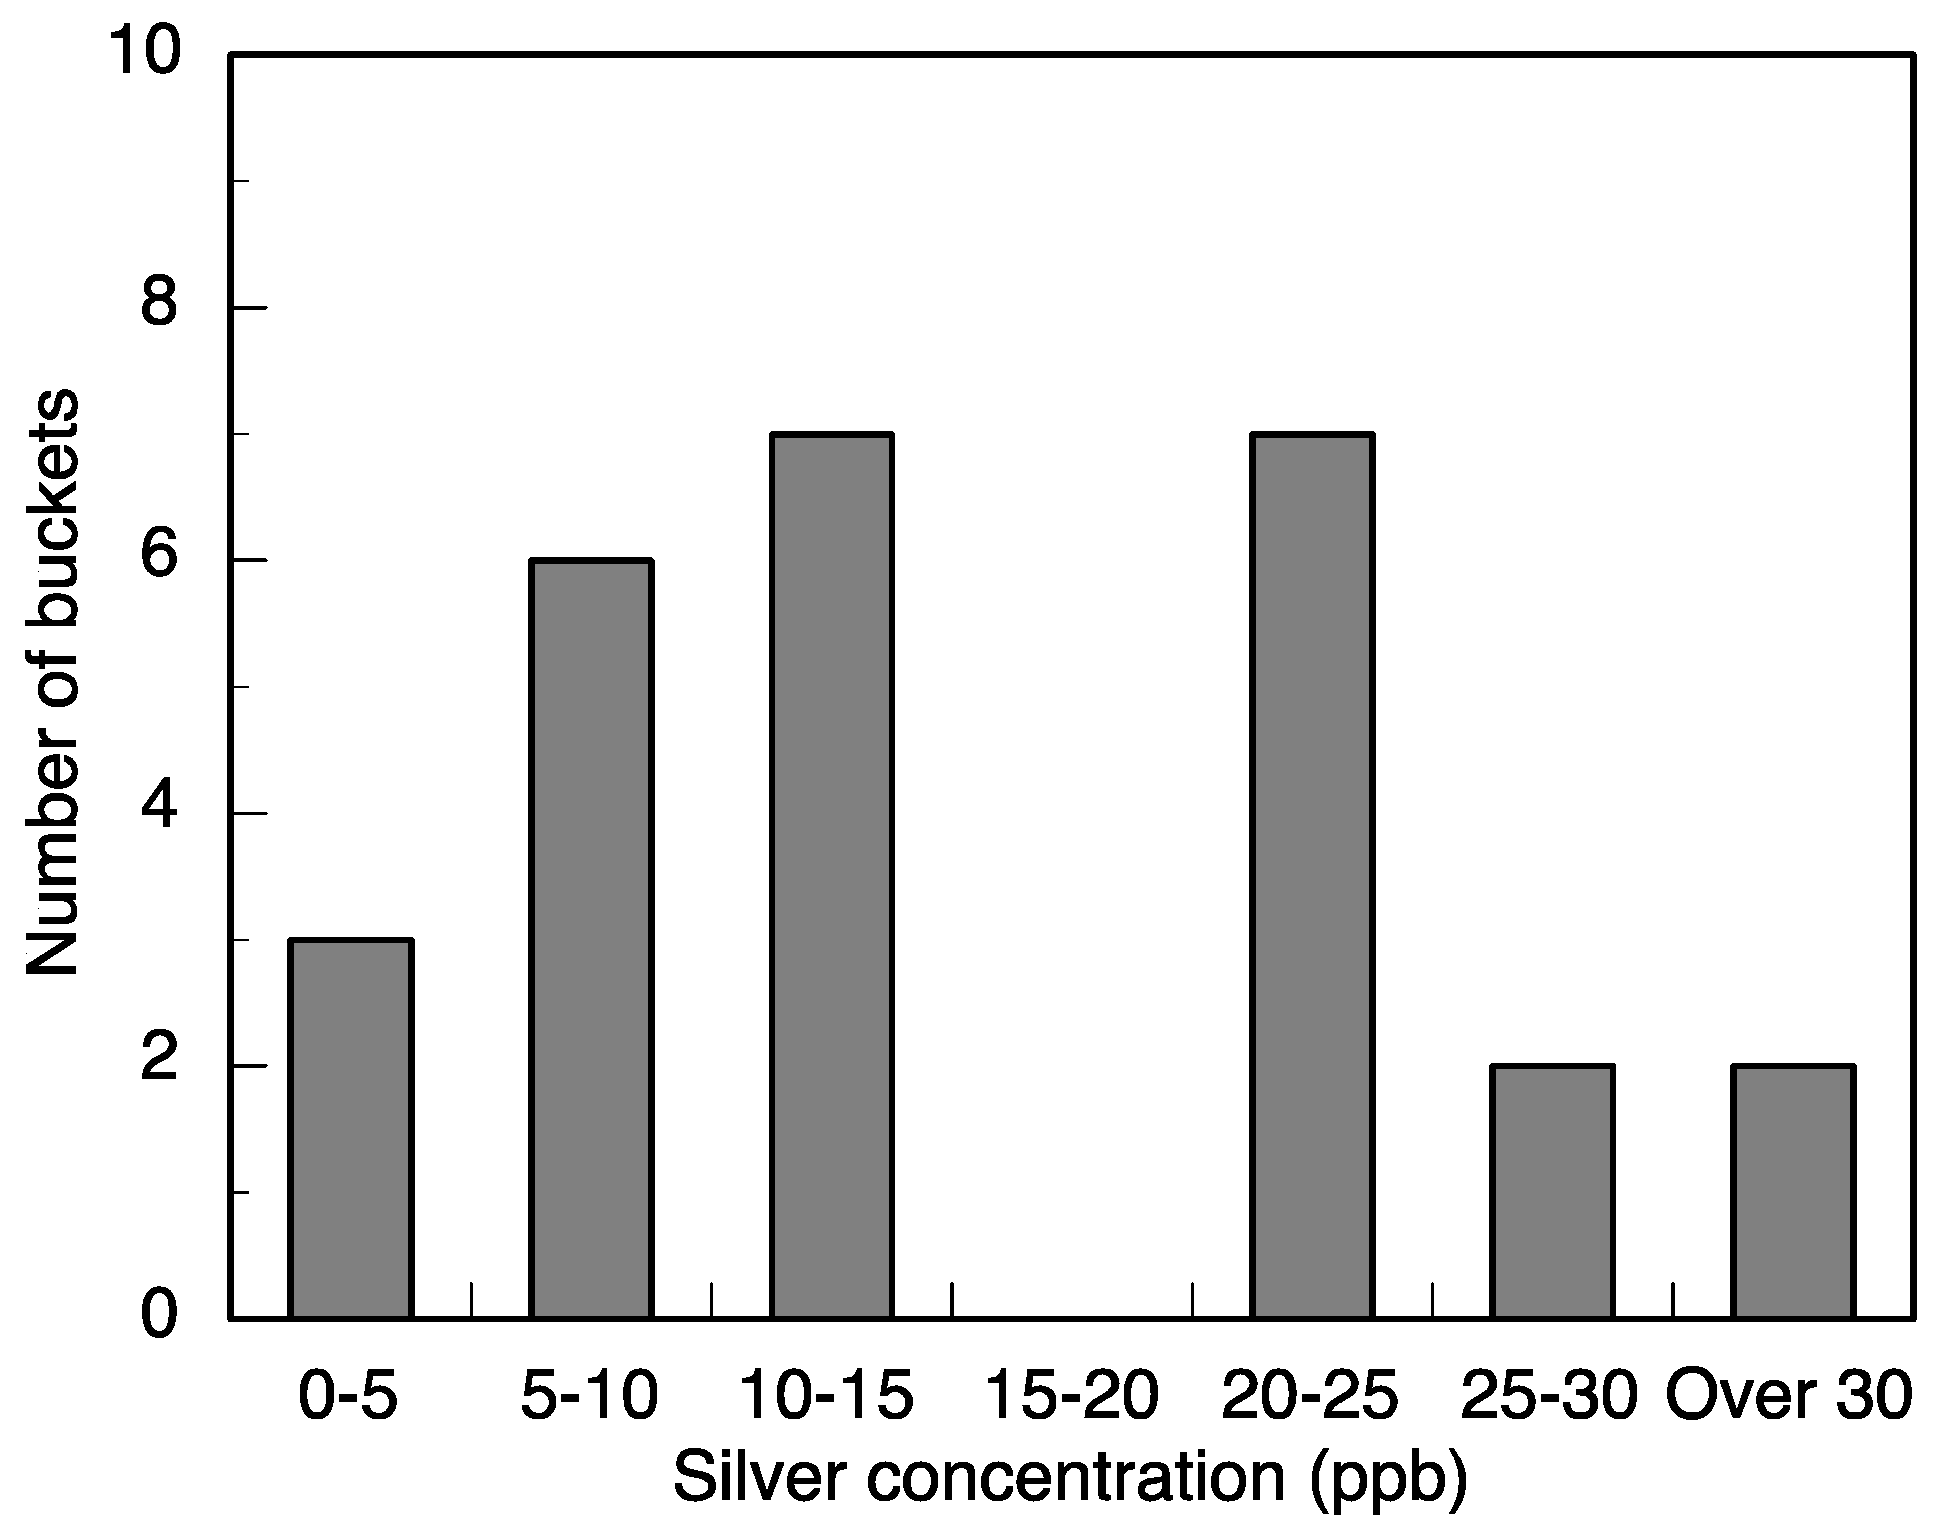
E. coli contamination. We present total coliform here to demonstrate the potential for bacterial removal in general. The reduction of all buckets that researchers filled to below detectible limits suggests additional training and care is required for ideal use. The overall disinfection levels are likely greater because the averages include the trials that brought the total coliform to below detectible limits (
Figure 5). We did not detect a statistically significant relationship between the amount of silver in the water and the amount of disinfection.
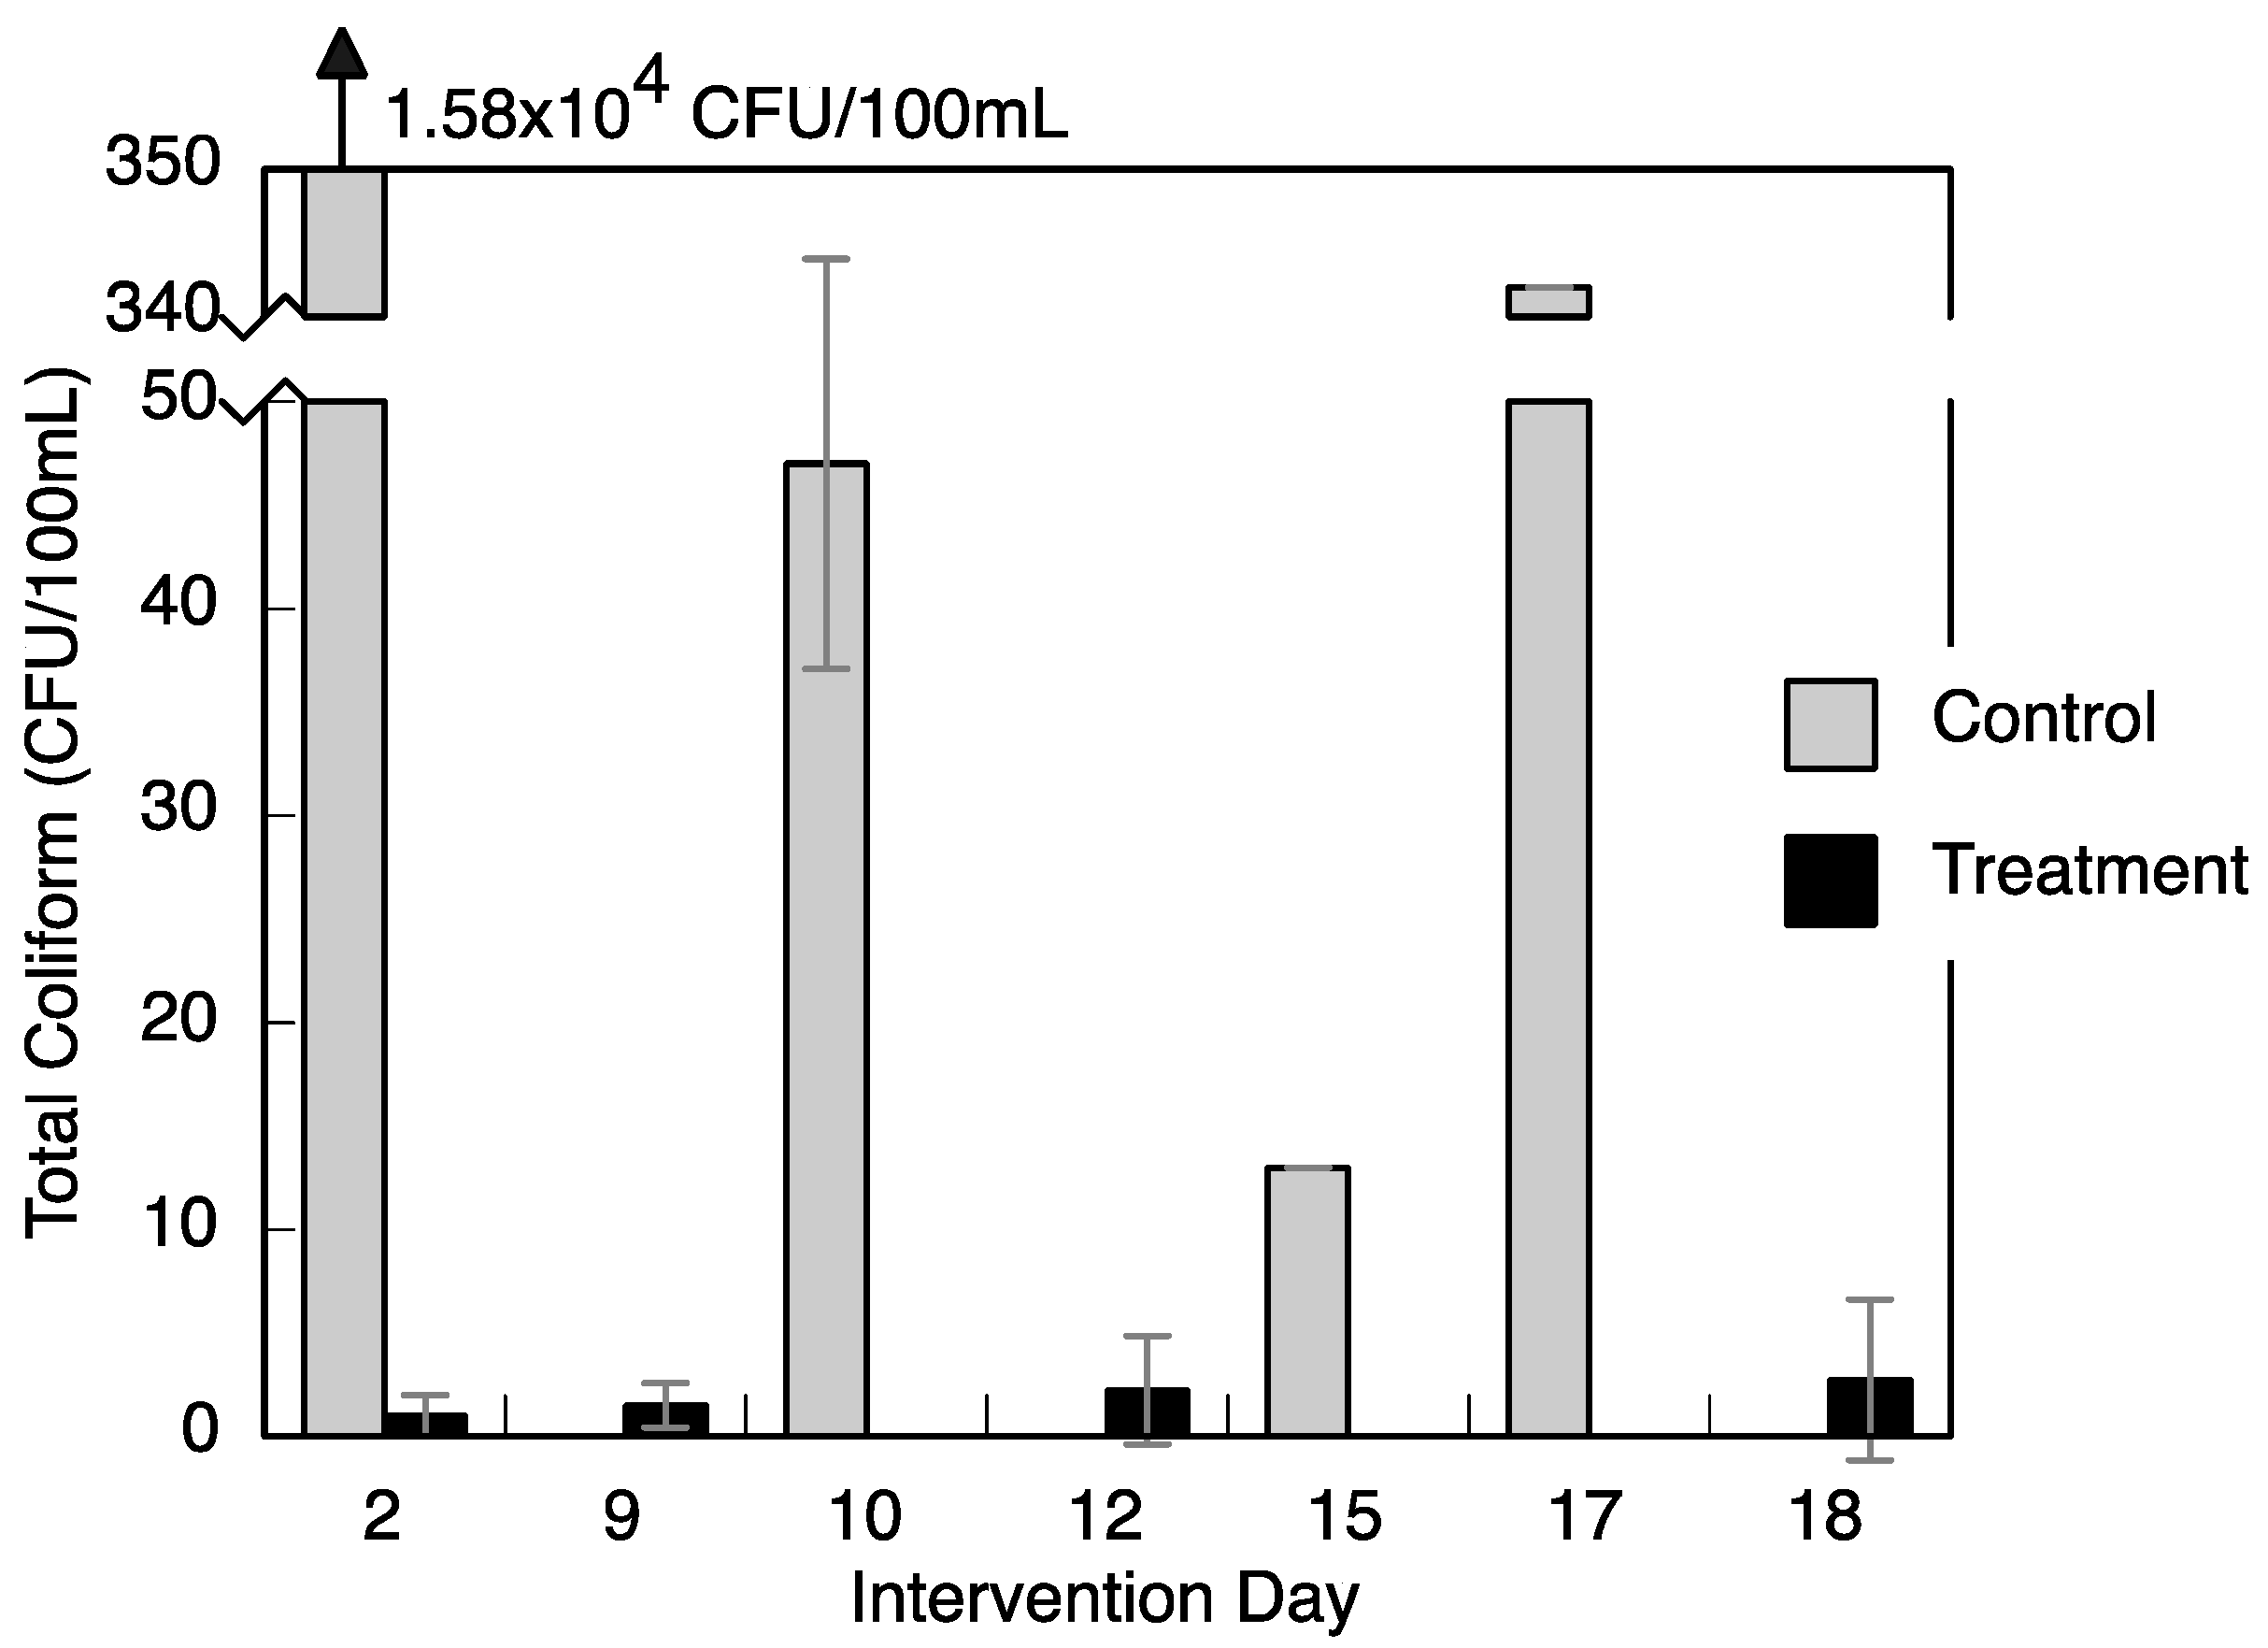
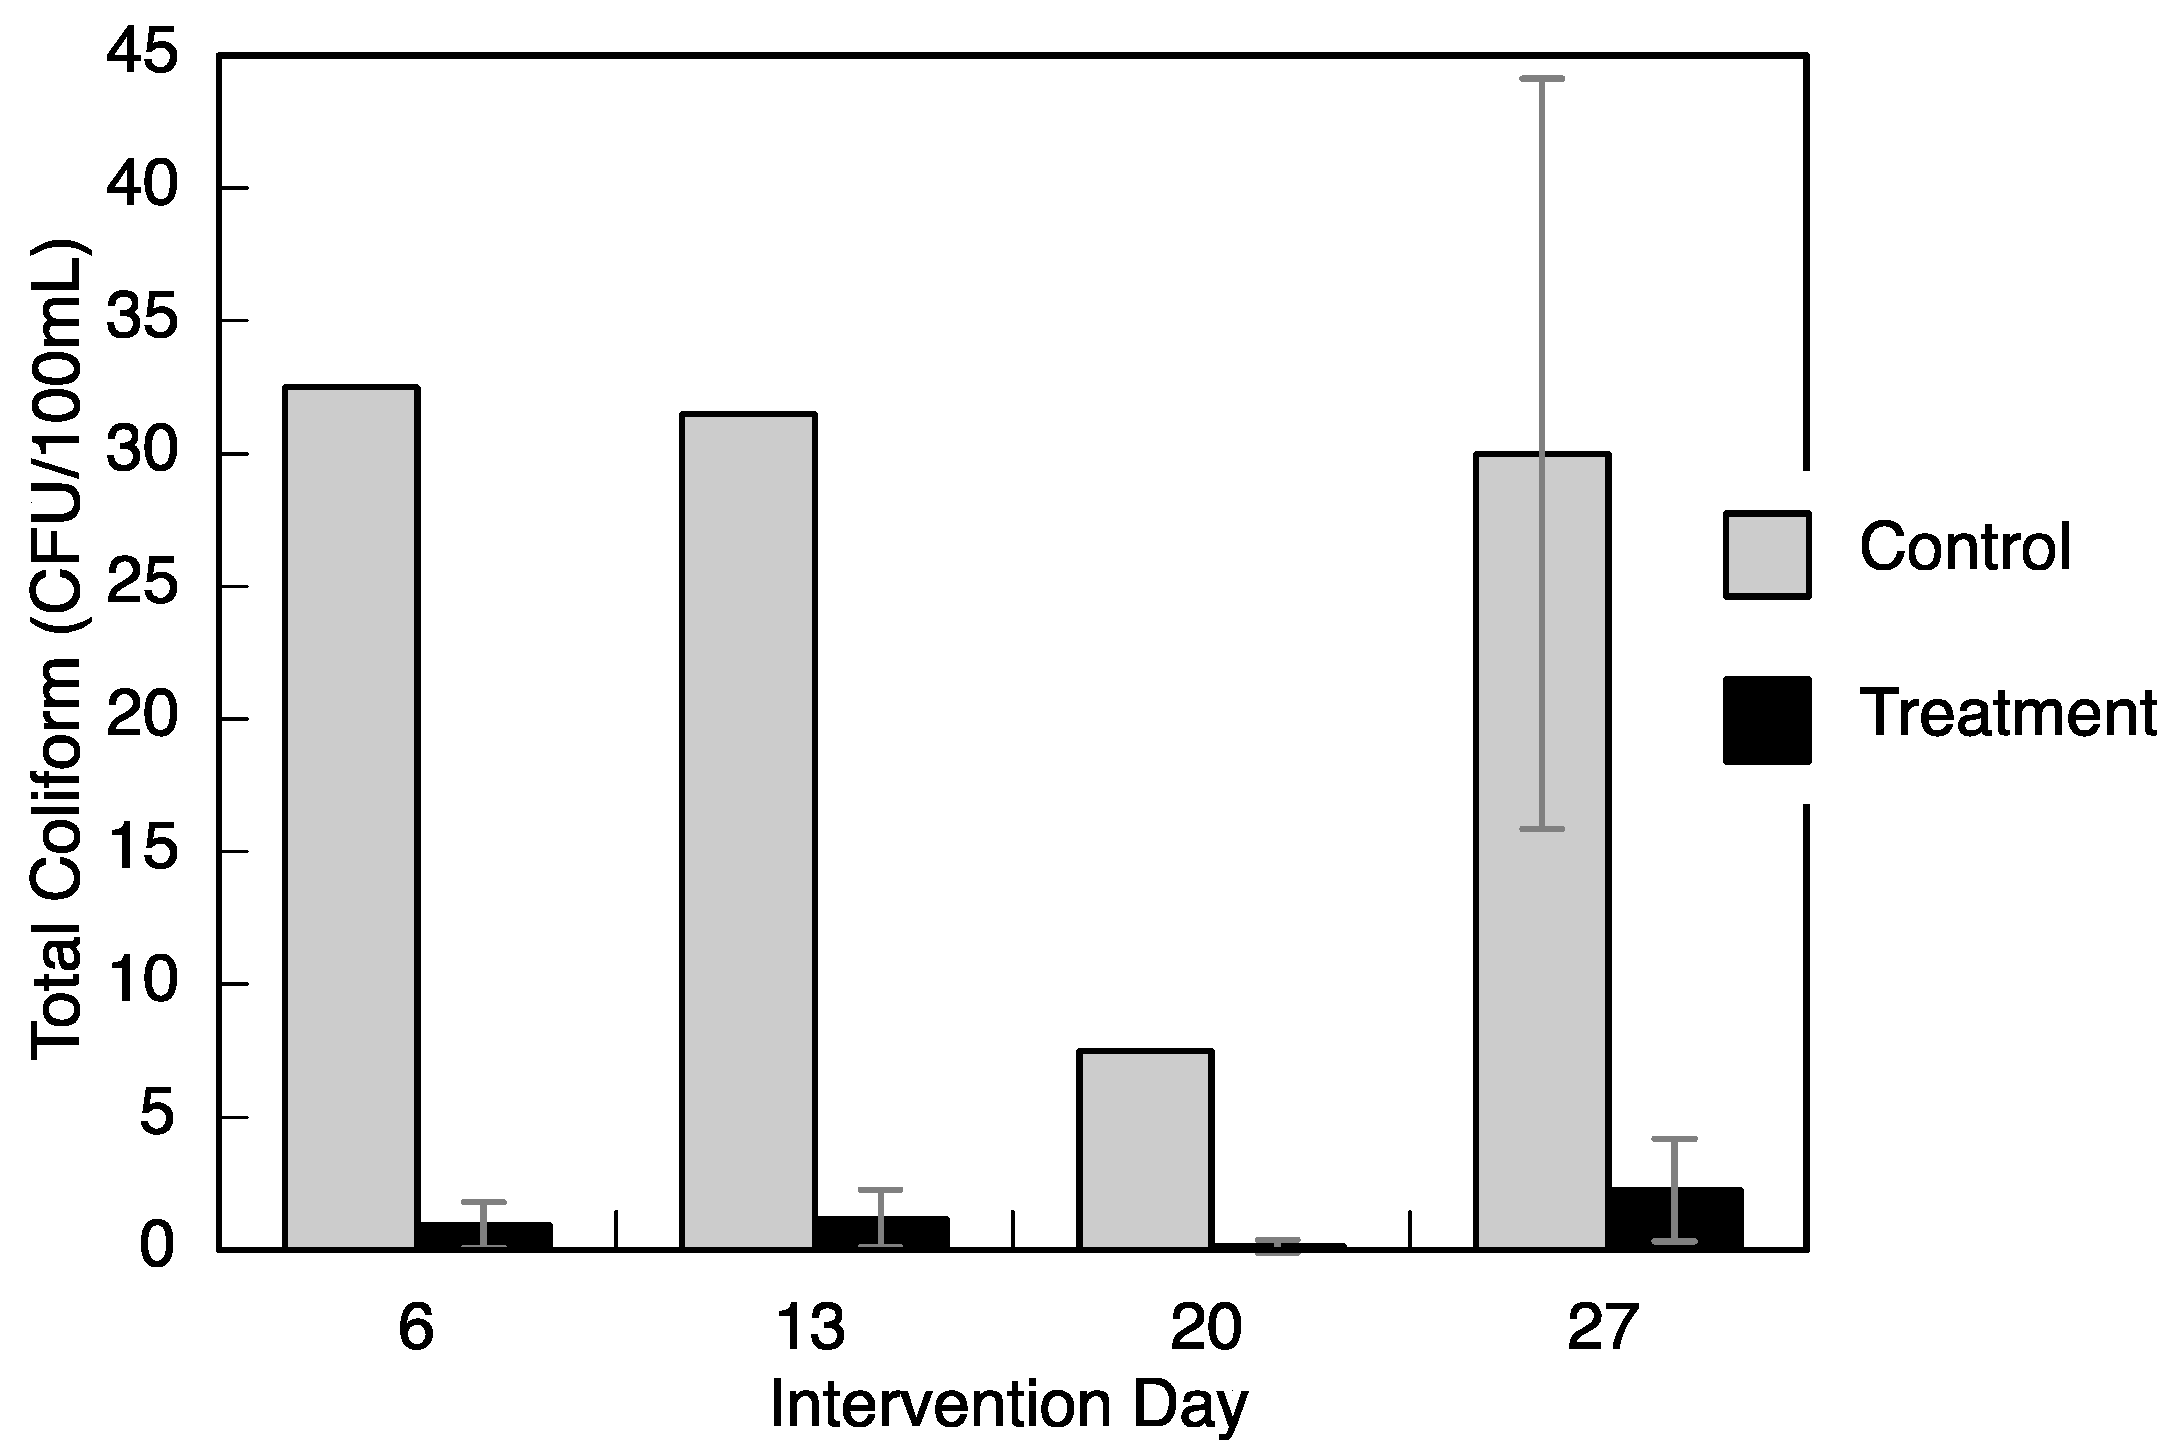
The level of total coliform bacteria changed in community A over time. Researchers began measurements after a three-week school vacation.
Figure 3 shows that the total coliform was high in the days after the vacation, which suggests that stagnant water in the school’s tanks may have grown bacteria.
The source water used at both schools had turbidity within or close to drinking water standards. The water used in laboratory experiments had higher turbidity. The technology performed best when the water was of low turbidity whether naturally or diluted to a lower turbidity. Particles may interfere with disinfection by providing cracks and pores for bacteria to live that take longer for silver ions to diffuse into or by sorbing the silver ions before they can act upon microorganisms. Dissolved organic material was not measured but also may play a role in the action of the silver ions.
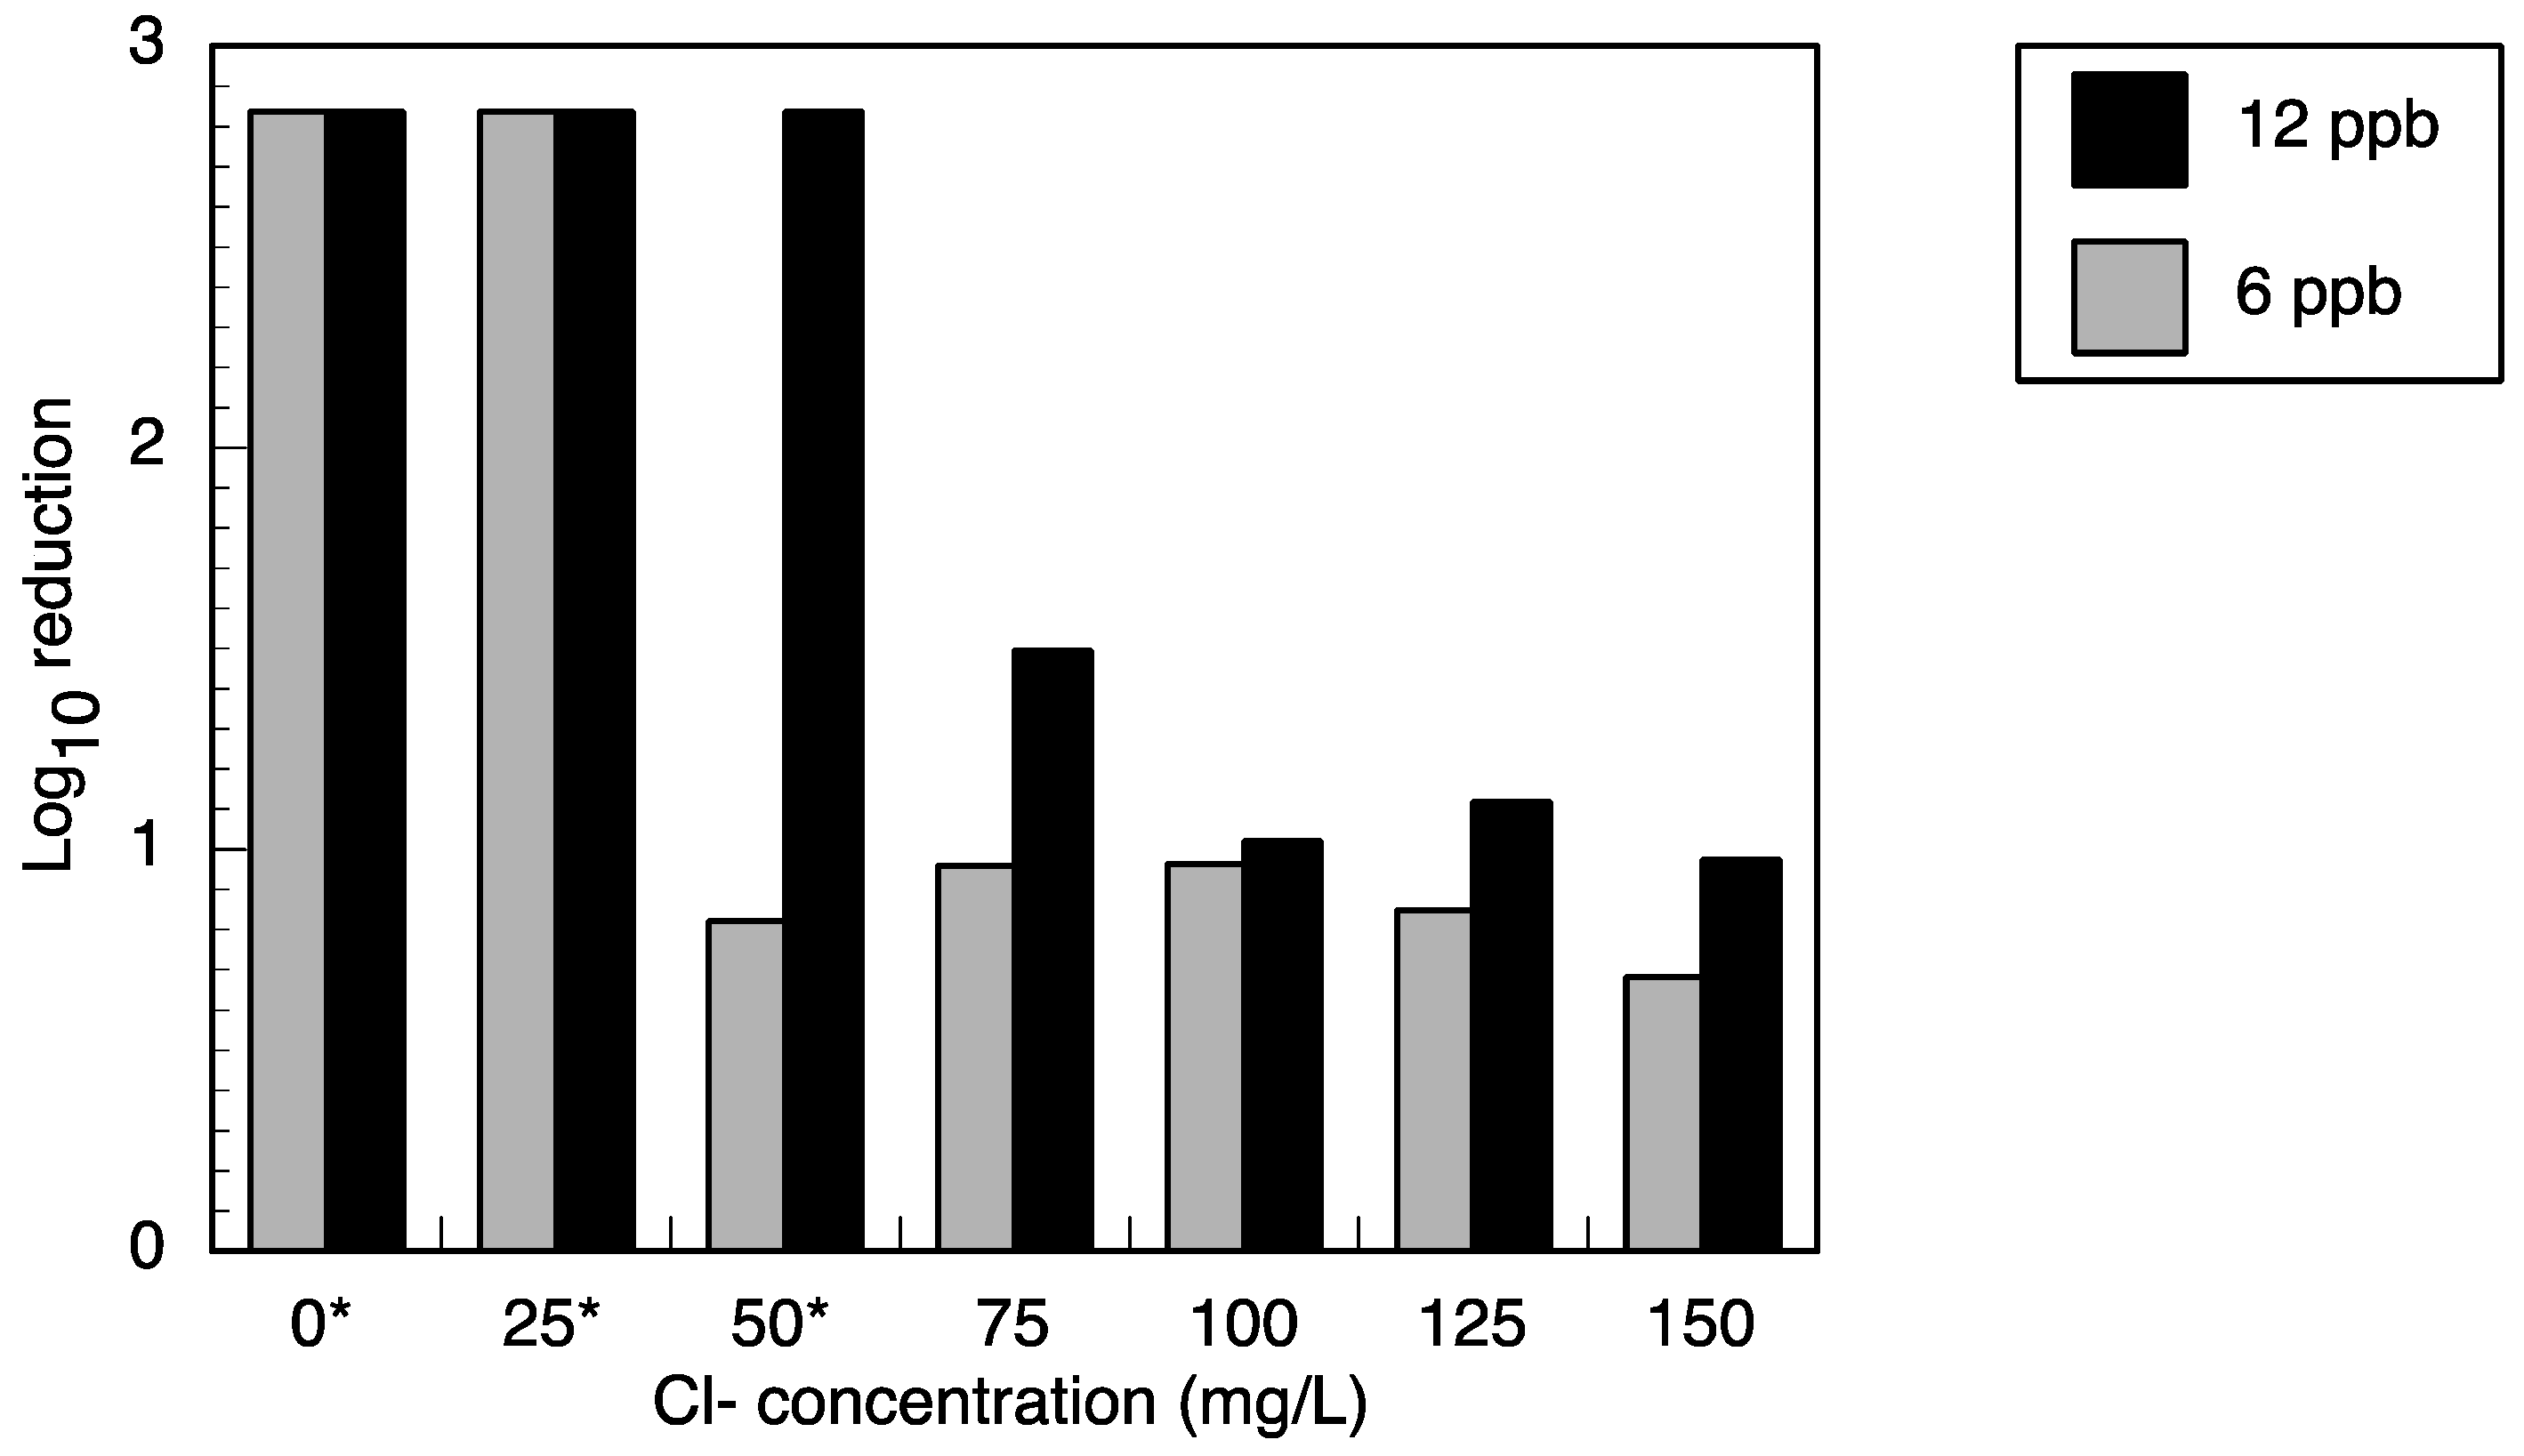
Trials in community C showed lower bacterial reduction than in community A; additionally, researchers measured high chloride concentrations in community C. One possible explanation for this phenomenon is that the higher chloride levels caused insoluble silver chloride to precipitate. In laboratory experiments, silver ion (from silver nitrate) disinfection of
E. coli was decreased with the addition of chloride (
Figure 7). Silver chloride is less toxic to heterotrophic bacteria [
35] and the insoluble form settles to the bottom of the batch reactor or bucket, where it does not mix effectively with the bulk water. Levard
et al. [
22] showed that dissolved silver from silver nanoparticles increased with chloride concentration; although, insoluble silver chloride preferentially formed followed by soluble silver chlorides, however, in deionized water, ionic silver was formed. Deionized water produced a similar amount of silver as the chloride mixture of molar ratio Cl/Ag ≈ 2675 [
22]. The chloride levels for the trials presented here were 1.0 × 10
4 in community A and 1.1 × 10
5 in community C. Given the range of soluble silver formation determined by Lavard
et al., the water from community C should produce more soluble silver during treatment; however, it is hard to determine the disinfection activity because of confounding factors such as the types of silver chloride compounds formed (insoluble
versus soluble) during treatment, large reaction vessel, and other ions present. Further work is needed to determine the behavior and disinfection potential of the technology under high ionic mixtures. Silver chloride precipitate was not recorded in the field trials; however, it would be nearly impossible to visualize the white precipitate because the buckets in community C were white. The presence of chloride in community C may have reduced the overall bacterial reduction.
The acceptance testing at the local primary school indicated that students in fourth and seventh grade overwhelmingly chose the treated water when it was offered even before they were instructed on the function of the treatment method. This may indicate a bias towards choosing the novel option, but the students’ persistent preference for the treated water over the remainder of the observation interval indicates its sustained acceptance, if not preference, amongst the students. The only day that students chose the untreated over the treated water was when the treatment bucket was not filled the night before, which students told researchers voluntarily. This observation day occurred after the educational intervention was delivered (during T3). While anecdotal, this indicates that students understood the limitations of the technology.
The surveys, answered by adult family members, revealed that most of respondents collect water from storage with a cup with handle and do not use any method of water treatment. The distinction between handle and no-handle is important because when the cups have a handle, bacteria on the water drinker’s hand is less likely to touch the water. Researchers observed that many of the residents dipped a cup into the water storage container to drink, even when the storage container had a spigot. This may suggest that the residents had little knowledge of germ theory and the contamination they were causing by putting their hands into the drinking water. Respondents indicated that they regarded taste of water, cost of water treatment, and treatable quantity as the three most important characteristics in a potential water treatment technology. The silver-impregnated porous ceramic has an advantage because it imparts no taste to water, treats the average amount of water required by one family in a day (15 L), and costs roughly 3 USD to produce. Though education and income levels varied across the communities, the majority of respondents indicated they were willing to pay for technology at or above the production cost, which suggests that a sustainable and scalable business model is possible.
Given the option to purchase a product at three prices, as we provided in the willingness-to-pay survey, bias is possible if consumers choose a lower price in an attempt to purchase the product at a lower price in the future. This did not occur in community A. While the sample size is not large enough to generalize, potential consumers chose higher prices, which may indicate a stronger willingness-to-pay at a higher price. This result could be explained by the higher socioeconomic status of community A (
Figure S2).
While there were few people who attempted to purchase the technology (willingness-to-buy), there were many confounding factors in community A. The ceramic factory where sales were offered was located on the edge of the community; it is possible that community members did not have the time or energy to walk 30 minutes each way to make the purchase. People in community A live on monthly salaries and are paid on the last day of the month. Many community members may not have had available or budgeted funds due to the timing of the sales.
Many members of community C purchased the technology. This may have also been affected by several factors. Respondents in community C were offered more buying options including being able to work rather than pay money and also receiving a discount for multiple unit purchases. Additionally, the location of sales was more centrally located to members of community C.
The U.S. Environmental Protection Agency (EPA)
secondary drinking water standard for silver is set at 100 ppb (10
−4 kg m
−3) [
36] and this technology delivers a dose of silver that is below half of this level. This level was determined based on a review of the literature of ingested silver. Silver accumulates and resides primarily in the skin and liver, although can be found in lower concentrations in other organs; however, there appears to be a half-life in the body of up to 50 days [
37]. The adverse effect of silver consumption is argyria: a condition where the skin turns blue-gray [
38], other adverse effects occur at higher doses. The World Health Organization has not officially published a guideline value for silver due to inadequate data; however, they cite the same
no observed adverse effect level (NOAEL) as the U.S. EPA, based on argyria, and suggest that 100 ppb in drinking water will yield an accumulation of half of the NOAEL value over 70 years of use.
High concentrations of silver can affect intestinal microbiota, which includes beneficial bacteria. Williams
et al. [
39] found that rats dosed with 9–400 mg/day (1.04 × 10
−10 to 4.63 × 10
−9 kg s
−1) per kg body weight of metallic silver had decreased levels of beneficial intestinal bacteria. We showed here that the silver-impregnated ceramic disk delivers less than 50 ppb of silver, which is less than half of the drinking water standard designed to protect against argyria. As a comparison, a 50 kg human that consumes an extraordinary 10 L (10
−2 m
3) of treated drinking water will consume less than 0.01 mg/day per kg body weight, which is a factor of 10
−3–10
−4 less than the amount that altered the rat’s microbiota (adjusted for body weight). The silver concentration delivered by the silver-impregnated ceramic technology is significantly lower than this level and below the drinking water standard and recommendation discussed here.
The silver ion concentration in the treated water because the solution, either directly from the treatment vessel or as human waste effluent, will likely be diluted to near the detection limit and near the typical environmental background [
38]. Disposal of the technology could introduce a silver source into the environment; however, we feel that this dose will be inconsequential. Nevertheless, we recommend that the cubes not be discarded in aquatic environments. Recycling may also be an option in the future; however, this is an area of future research.
Research on environmental fate and animal toxicity has been limited and largely focused on the presence of silver nanoparticles themselves. As previously described, silver nanoparticles in this product are bonded to the ceramic matrix, which makes them generally unavailable for transport in the environment or consumption by animals. Coleman
et al. [
40] investigated the introduction of silver nanoparticles into planter boxes in the form of a biosolid mixture with added silver nanoparticles. The soil microbial community changed compared to the control trials and N
2O flux from the soil increased. The overall plant biomass did not change significantly; however, the biomass of specific species was altered. The experiments were based on 0.14 mg·Ag·kg
−1 soil (1.4 × 10
−7 Ag/soil), which is not directly comparable to the silver-impregnated ceramic cubes for two reasons. First, the silver nanoparticles are bonded to the ceramic matrix and not free to move about the soil. Second, because the silver nanoparticles are within the ceramic matrix, the production of silver ions and delivery outside the ceramic is rate limited by diffusion of oxidants into and silver out of the pore spaces. Nevertheless, even low silver ion concentrations can prove hazardous for very small aquatic animals. Febrega
et al. [
41] reviewed pertinent literature on silver nanoparticles in aquatic environments and reported that some freshwater fish species are susceptible to silver ion concentrations as low as 800 ppb. Since our treated water concentrations are over one order of magnitude less than this level, this is unlikely to present a significant hazard.
The results from this study indicate that this novel ceramic water treatment technology is effective, safe, acceptable, and appropriate for the study communities. Indeed, the silver-impregnated porous ceramic technology is appropriate to treat contaminated water that has low turbidity (limits on dissolved matter requires additional studies) and low chloride levels. The economic data suggest that most households are willing to pay for the technology at a rate that could support a business model distribution; however, some communities may need alternative purchasing options such as installments or work options. This could be a role that non-governmental, charitable, and aid organizations could play to provide flexible purchasing or work options. Future studies can examine the potential to scale-up sales to new communities, regions, and countries where environmental enteropathy remains an issue that is unresolved by current water treatment technologies.


 ,
, 


