Article

The Mass Balance of Glacier No. 1 at the Headwaters of the Urumqi River in Relation to Northern Hemisphere Teleconnection Patterns

1
State Key Laboratory of Hydrology Water Resources and Hydraulic Engineering, Hohai University, Nanjing 210098, China
2
Department of Water Resources Engineering and Center for Middle Eastern Studies, Lund University, Box 118, SE-221 00 Lund, Sweden
3
Division of Hydrologic Science, Desert Research Institute, Las Vegas, 89119 NV, USA
4
Arid Land Research Center, Tottori University, 1390 Hamasaka, Tottori 680-0001, Japan
*
Author to whom correspondence should be addressed.
Water 2016, 8(3), 100; https://doi.org/10.3390/w8030100
Submission received: 21 January 2016 / Revised: 7 March 2016 / Accepted: 9 March 2016 / Published: 11 March 2016

Abstract

:
Most small glaciers in the world have significantly decreased their volume during the last century, which has caused water shortage problems. Glacier No. 1, at the headwaters of the Urumqi River, Tianshan, China, has been monitored since 1959 and similarly has experienced significant mass and volume losses over the last few decades. Thus, we examined the trend and potential abrupt changes of the mass balance of Glacier No. 1. Principal component analysis and singular value decomposition were used to find significant relations between the mass balance of Glacier No. 1 and Northern Hemisphere teleconnection patterns using climate indices. It was found that the mass balance of Glacier No. 1 had a significantly decreasing trend corresponding to −14.5 mm/year from 1959 to 2010. A change point was detected in 1997 with 99% confidence level. Two time periods with different mass balances were identified as 1959–1996 and 1997–2010. The mass balance for the first period was −136.4 mm/year and up to −663.9 mm/year for the second period. The mass balance of Glacier No. 1 is positively related to the Scandinavian Pattern (SCA), and negatively related to the East Atlantic Pattern (EA). These relationships are useful in better understanding the interaction between glacier mass balance and climate variability.

1. Introduction

Glaciers are essential fresh water resources that contribute to agricultural productivity and industrial water supply. Loss in glacier volume on a global scale was noted in the middle of the 19th century and continued in several stages of ever-increasing rates [1,2]. Glaciers are also sensitive indicators of climate change and natural archives of atmospheric variability [3]. The importance of understanding the relation between glacier mass balance and climate variability has long been recognized [4,5,6]. Glacier No. 1 is of immense importance for Urumqi as a water supply source, and its change and sustainability have drawn wide attention in recent years.
Climate variability is closely linked to patterns of flood and drought in different areas of the world and strongly affecting local and regional scale climate through teleconnections. Teleconnections are statistical associations among climate variables separated by large distances and are a consequence of the large-scale dynamics of the ocean and atmosphere linking disparate regional climates into one unified, global climatic system [7,8]. Numerous studies have shown that climate variability has a strong impact on basin water resources through changes in hydrologic variables [9,10,11,12]. The glacier mass balance variability could be a reflection of low-frequency climatic fluctuations. Understanding the linkage between glacier mass balance and teleconnection patterns is essential for glacier water supply and could improve the ability to predict the glacier mass balance based on physical reasoning.
Several recent studies have dealt with the Glacier No. 1 change over time. Li et al. [13] analyzed the long-term changes in climate and streamflow at the headwaters of the Urumqi River and paid particular attention to the change in the glacier’s runoff. Ye et al. [14] analyzed long-term climate and glacier records to examine climate change and glacier response over the past 45 years. Han et al. [15] examined characteristics of the winter mass balance of Glacier No. 1 during 1988–2006. Wu et al. [16] applied a degree-day model to simulate the mass balance of Glacier No. 1 during 1987/1988–2007/2008 based on temperature and precipitation data. Li et al. [17] analyzed the generic mechanisms of acceleration of shrinkage of continental mountain glaciers taking glacier No. 1 as an example. Xu et al. [18] investigated the responses of two branches of Glacier No. 1 to climate change from 1993 to 2005. Cui et al. [19] investigated the degree-day factor variation on the mass balance of Glacier No. 1. Gao et al. [20] examined the characteristics of the daily melt water discharge from the Glacier No. 1 basin and the relation between melt water discharge, air temperature, and precipitation. Wang et al. [21] compared glaciological and geodetic methods for measuring the mass balance of Glacier No. 1. Moore and Demuth [5] investigated the relationship between the mass balance variability of Place Glacier and recent climate fluctuations and found that the Place Glacier’s winter mass balances are correlated with the Pacific Decadal Oscillation. The Svalbard glacier summer melt was found to be associated with the East Atlantic Jet Pattern in the boreal spring [6]. Diolaiuti et al. [22] explored the correlation of local climate variables against the North Atlantic Oscillation to better understand the glacier changes in the Italian Alps.
The most recent research has focused on the change of Glacier No. 1 and its response to regional climate change. However, little effort has been dedicated to how atmospheric variability affects glaciers and the link between the mass balance of Glacier No. 1 and climatic fluctuations. Thus, this study analyzes the mass balance trend and abrupt change point, and explores the linkage between the mass balance at the headwaters of the Urumqi River and Northern Hemisphere teleconnection patterns. Principal component analysis (PCA) and singular value decomposition (SVD) were used to find the relation between the mass balance and teleconnection patterns using climate indices. The results can be used for a better understanding of the physical interaction between glaciers in this high mountain area and climate fluctuations, and for the future water availability in the source region of the Urumqi River.

2. Study Area and Methods

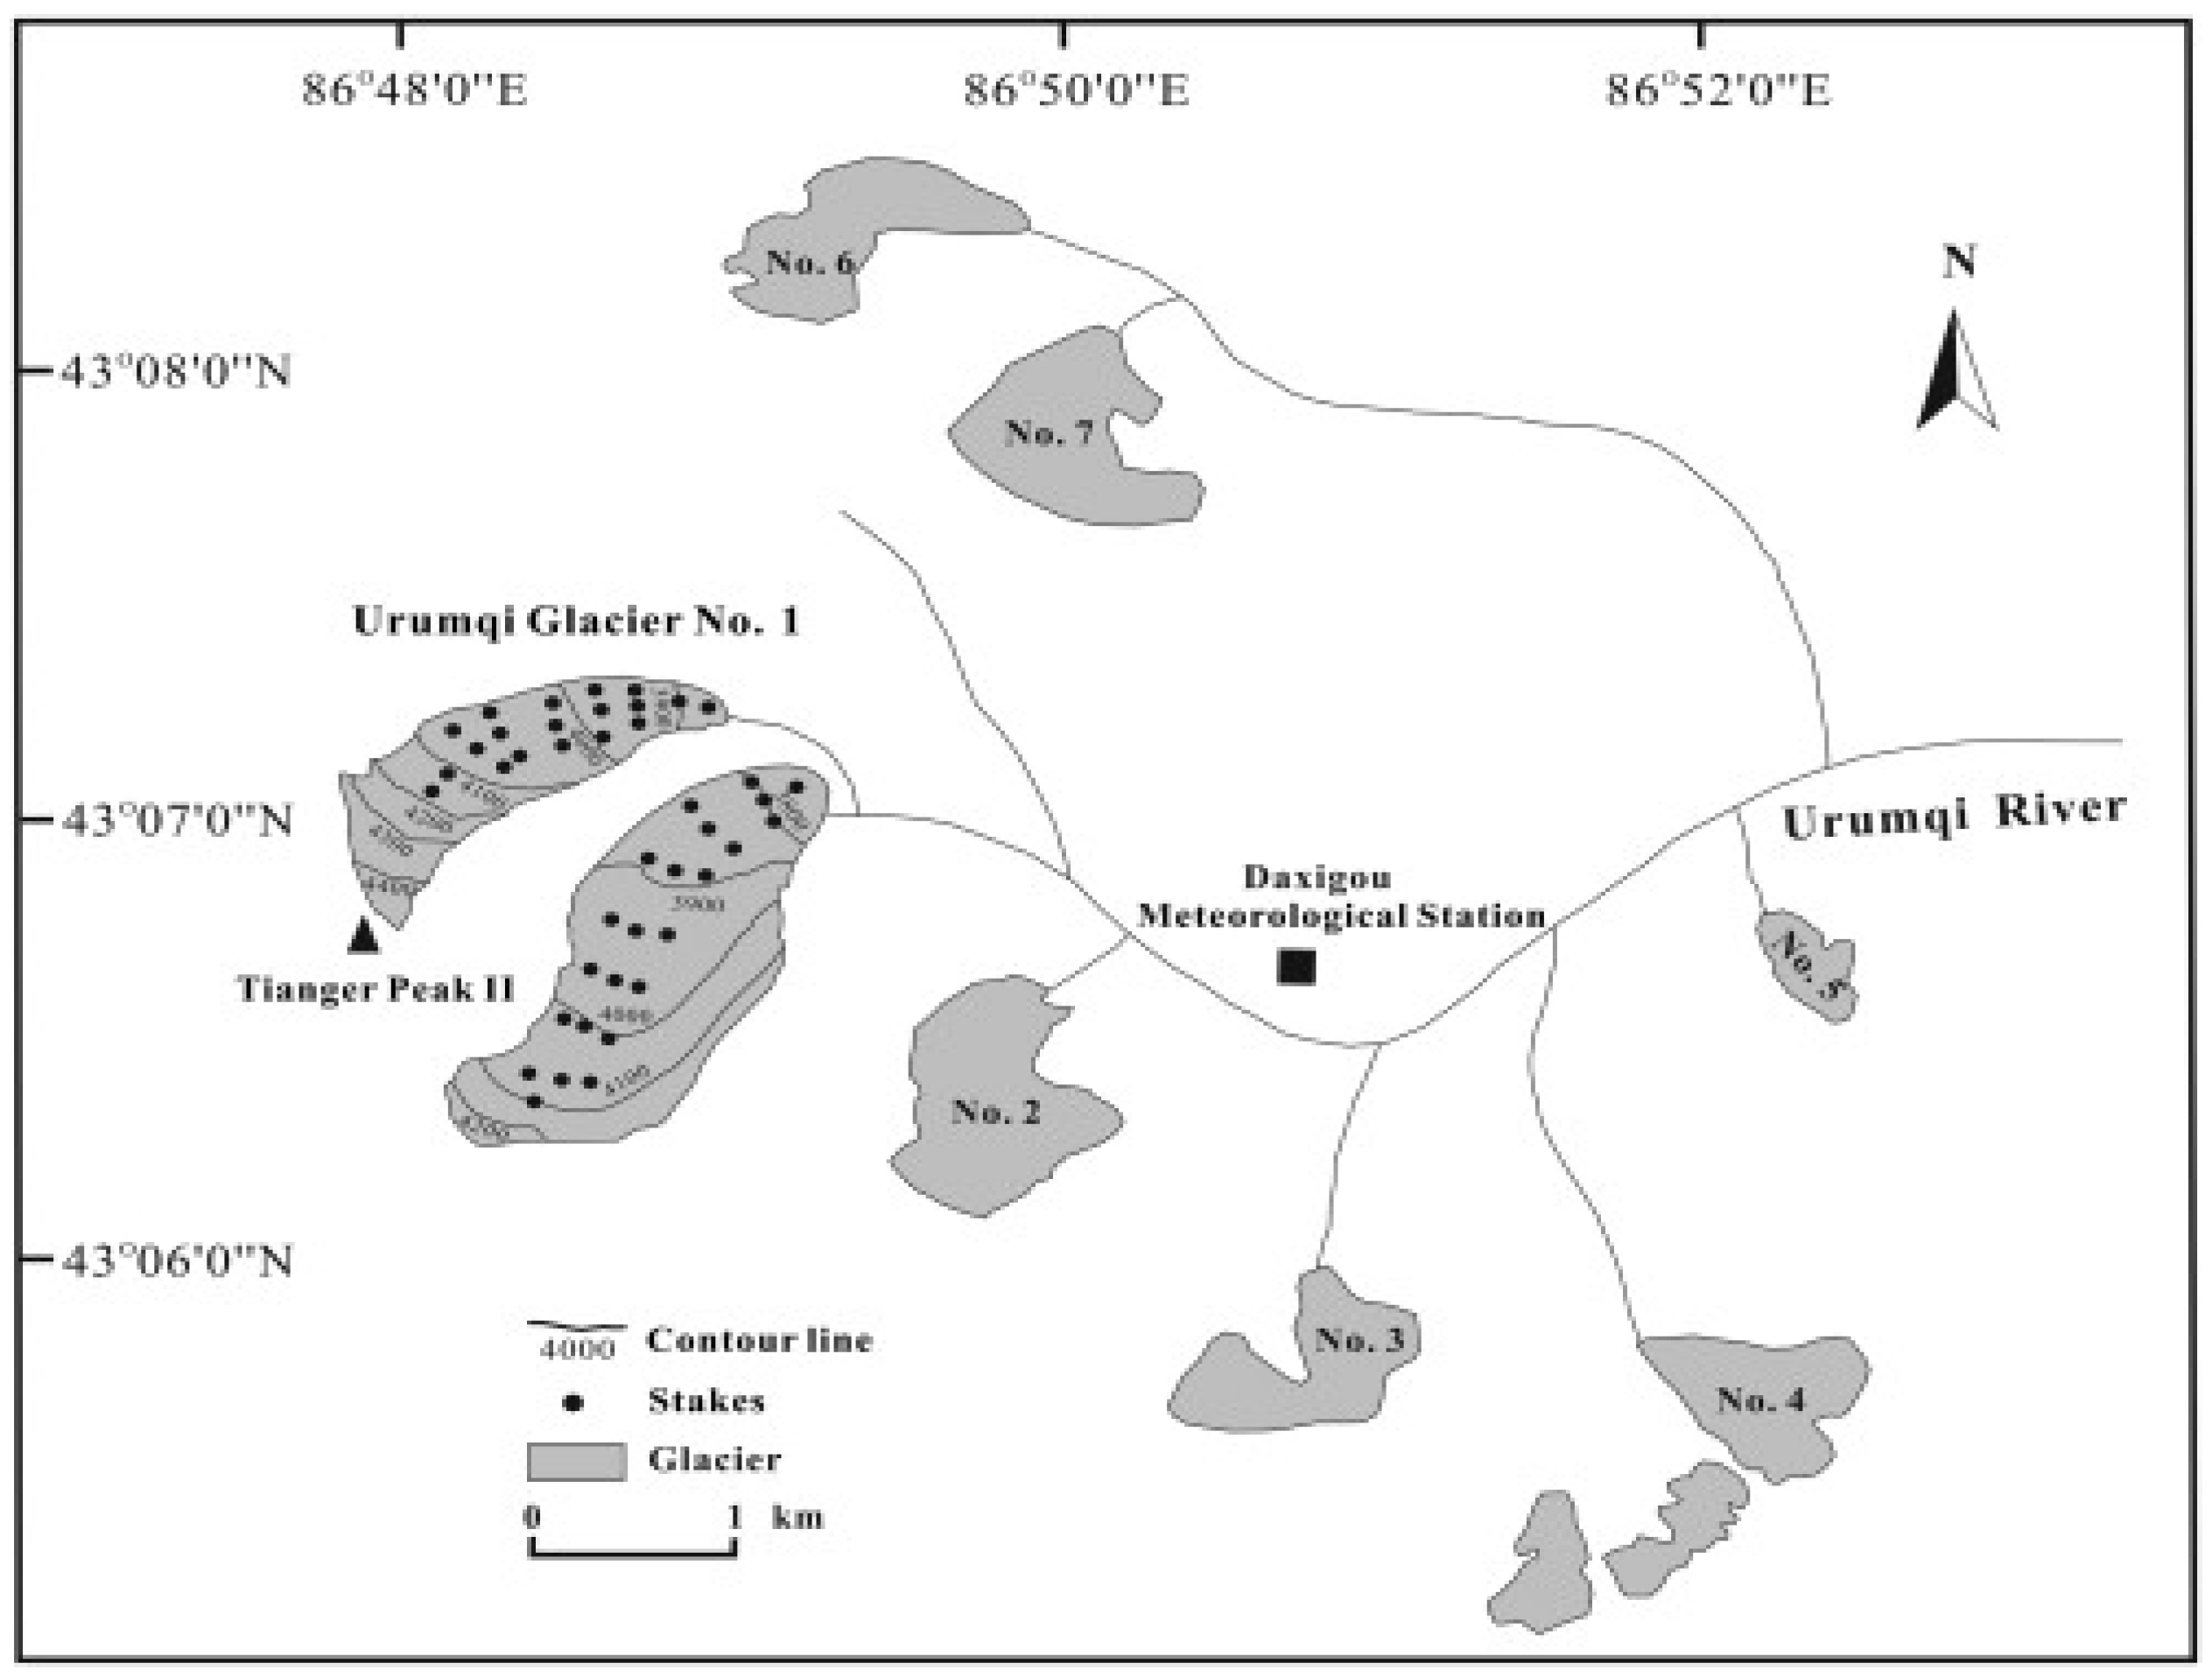
2.1. Study Area and Data

Glacier No. 1 (43.05°N, 86.49°E) is located at the headwaters of the Urumqi River as seen in Figure 1, Eastern Tianshan Mountain, China. It is a small northeast-facing valley glacier with an elevation between 3740 m and 4486 m [14,21]. The glacier is surrounded by barren rock with sparse vegetation and has east and west branches with an area of 1.646 km2 and length of 2.41 km [13,21]. These two branches were separated into two small independent glaciers in 1994 due to continued glacier shrinkage [14]. Urumqi Glacier No. 1 is classified as a summer-accumulation-type glacier because both accumulation and ablation occur during the summer. About 80% of the annual precipitation in this region fall from May to September [21,23]. Climatically, the area is dominated by the westerly circulation and the Siberian High [24]. It has a typical continental climate with a westerly jet prevailing across the high mountains, and the local valley winds prevail from March to September from the northeast and east-northeast flow [25,26]. Aizen et al. [3] found that the isotopic component in precipitation of Central Tianshan is related to differing moisture contributions from either easterly or southerly (southwest monsoon) air mass trajectories. Most of the low-elevation areas of Northwest China are arid due to rain shadow effect. However, high elevation mountains like the Tianshan regions intercept considerable moisture due to the southwest monsoon [27]. The annual mean precipitation and annual mean air temperature were 456 mm and −5 °C during 1959–2010 at the Daxigou Meteorological station, respectively [21].
Data for the annual mass balance of Glacier No. 1 from 1959 to 2010 were used in this study. The mass balance data have been published in annual reports of the Tianshan Glacier Station. Data have also been reported in the Glacier Mass Balance Bulletin compiled by the World Glacier Monitoring Service of the International Commission on Snow and Ice. Mass balance observations for Glacier No. 1 were carried out from 1959 with interruptions during 1967–1979, and the missing data were extrapolated from glaciological observations and records of the Daxigou Meteorological Station during other years [14,21]. The mass balance of Glacier No. 1 was calculated by contour maps of accumulation and ablation, using data from the permanent stake network on the glacier (about 45–80 stakes, in 8–9 rows) and from snow pits [19]. It is converted to water equivalent by using the measured densities for snow and ice. Further details of the mass balance of Glacier No. 1 measurement are described elsewhere [21].
Northern Hemisphere teleconnection patterns and related climate indices were identified using rotated PCA [29]. These were applied to monthly mean standardized 500-mb height anomalies in the analyzed region 20°N–90°N. Monthly values of climate indices, including the North Atlantic Oscillation (NAO), the East Atlantic Pattern (EA), the West Pacific Pattern (WP), the Pacific/North American Pattern (PNA), the East Atlantic/West Russia Pattern (EA/WR), the Scandinavian Pattern (SCA), the Polar/Eurasia Pattern (POL) and the Pacific Decadal Oscillation (PDO), were obtained from the National Weather Service, Climate Prediction Centre (NOAA). Further physical explanation for each climate pattern can be found elsewhere [6,29].

2.2. Methods

Mann-Kendall Test. The trend in the time series of the mass balance of Glacier No. 1 was examined with the Mann-Kendall test. This method is independent of the statistical distribution of the data. The test has been widely used in hydroclimatic time series for identifying trends [30,31,32]. In this paper, statistical significance of the trend was evaluated at the 5% statistical significance level against the null hypothesis that there is no trend for the data series. A detailed procedure for this statistical test can be found elsewhere [33].
Change-Point Analyzer. To investigate the potential abrupt changes in time for the mass balance of Glacier No. 1, Change-Point Analyzer [34] was used to detect change points. Change-Point Analyzer is a software package for analyzing time ordered data to determine whether a change has taken place, and it detects multiple changes and provides confidence levels for each of these. It iteratively uses a combination of time varying cumulative sum charts (cusums) and bootstrapping to detect changes [34]. The method can handle the outliers and is only based on the assumption of an independent error structure. It has been widely used for detecting change points in hydro-climatic area [35,36,37].
PCA and SVD were used to find relationships between the mass balance of Glacier No. 1 and teleconnection patterns using climate indices. PCA is a multivariate data analysis tool that offers a way to present complex data in a simplified way to identify relationships between investigated parameters. PCA maximizes variance explained by the weighted sum of elements in two or more fields and identifies linear transformations of the dataset that concentrates as much of the variance as possible into a small number of variables [38,39]. The PCA biplot was used to visualize the magnitude and sign of each variable’s contribution to the first two principal components, and how each observation is represented in terms of those components.
SVD is applied to the cross-covariance matrix of two datasets and isolates the combinations of the linearly related variables to one another by maximizing the covariance between them [38,40]. Here, SVD was applied to the cross-covariance matrix of the s(t,x) matrix of x climatic indices (called the predictand) at t years and the z(t,y) matrix composed by the mass balance of Glacier No. 1 at t years. The latter one is called the predictor. All time series were standardized to zero mean and unit standard deviation prior of use in the SVD. The SVD of the cross-covariance matrix of two fields yields two matrices of singular vectors and one set of singular values. A singular vector pair describe spatial patterns for each field which have an overall covariance given by the corresponding singular value [41]. In our case, the data time series s(t) and z(t) for each variable can be expanded in terms of a set of N vectors, called patterns [42]. Thus, we tried to estimate the predictor on basis of the predictand according to:
s ( t ) s ˜ ( t ) k = 1 N a k ( t ) p k
z ( t ) z ˜ ( t ) k = 1 N b k ( t ) q k
The time series ak(t) and bk(t) are called expansion coefficients; pk and qk are the patterns [42]. The expansion coefficients are calculated as weighted linear combination of variables in data.
a k ( t ) = i = 1 N s u ik s i ( t ) = u K T s ( t )
b k ( t ) = j = 1 N z v jk z i ( t ) = v K T z ( t )
The vectors uk and vk are called weight vectors. Together, each pair of patterns, the corresponding pair of weight vectors and the pair of expansion coefficients defines a mode, which combines the variability observed in the different fields. The variables in the s and z fields are subscripted by i and j, respectively, and individual modes by k. Heterogeneous correlation maps of the left and right fields from SVD show the correlation coefficients between the values of one field and the singular vector of the other field [41]. In our case, the patterns shown by the heterogeneous correlation maps for the kth SVD expansion mode indicate how well the pattern of the anomalies of the mass balance of Glacier No. 1 relate to the kth singular vector of climate indices. The correlation coefficients are a good indication of strength of the relationship between the two fields. This can be used to compare the relative importance of a particular mode in the expansion. A detailed procedure for this statistical test can be found elsewhere [40,42].

3. Results and Discussion

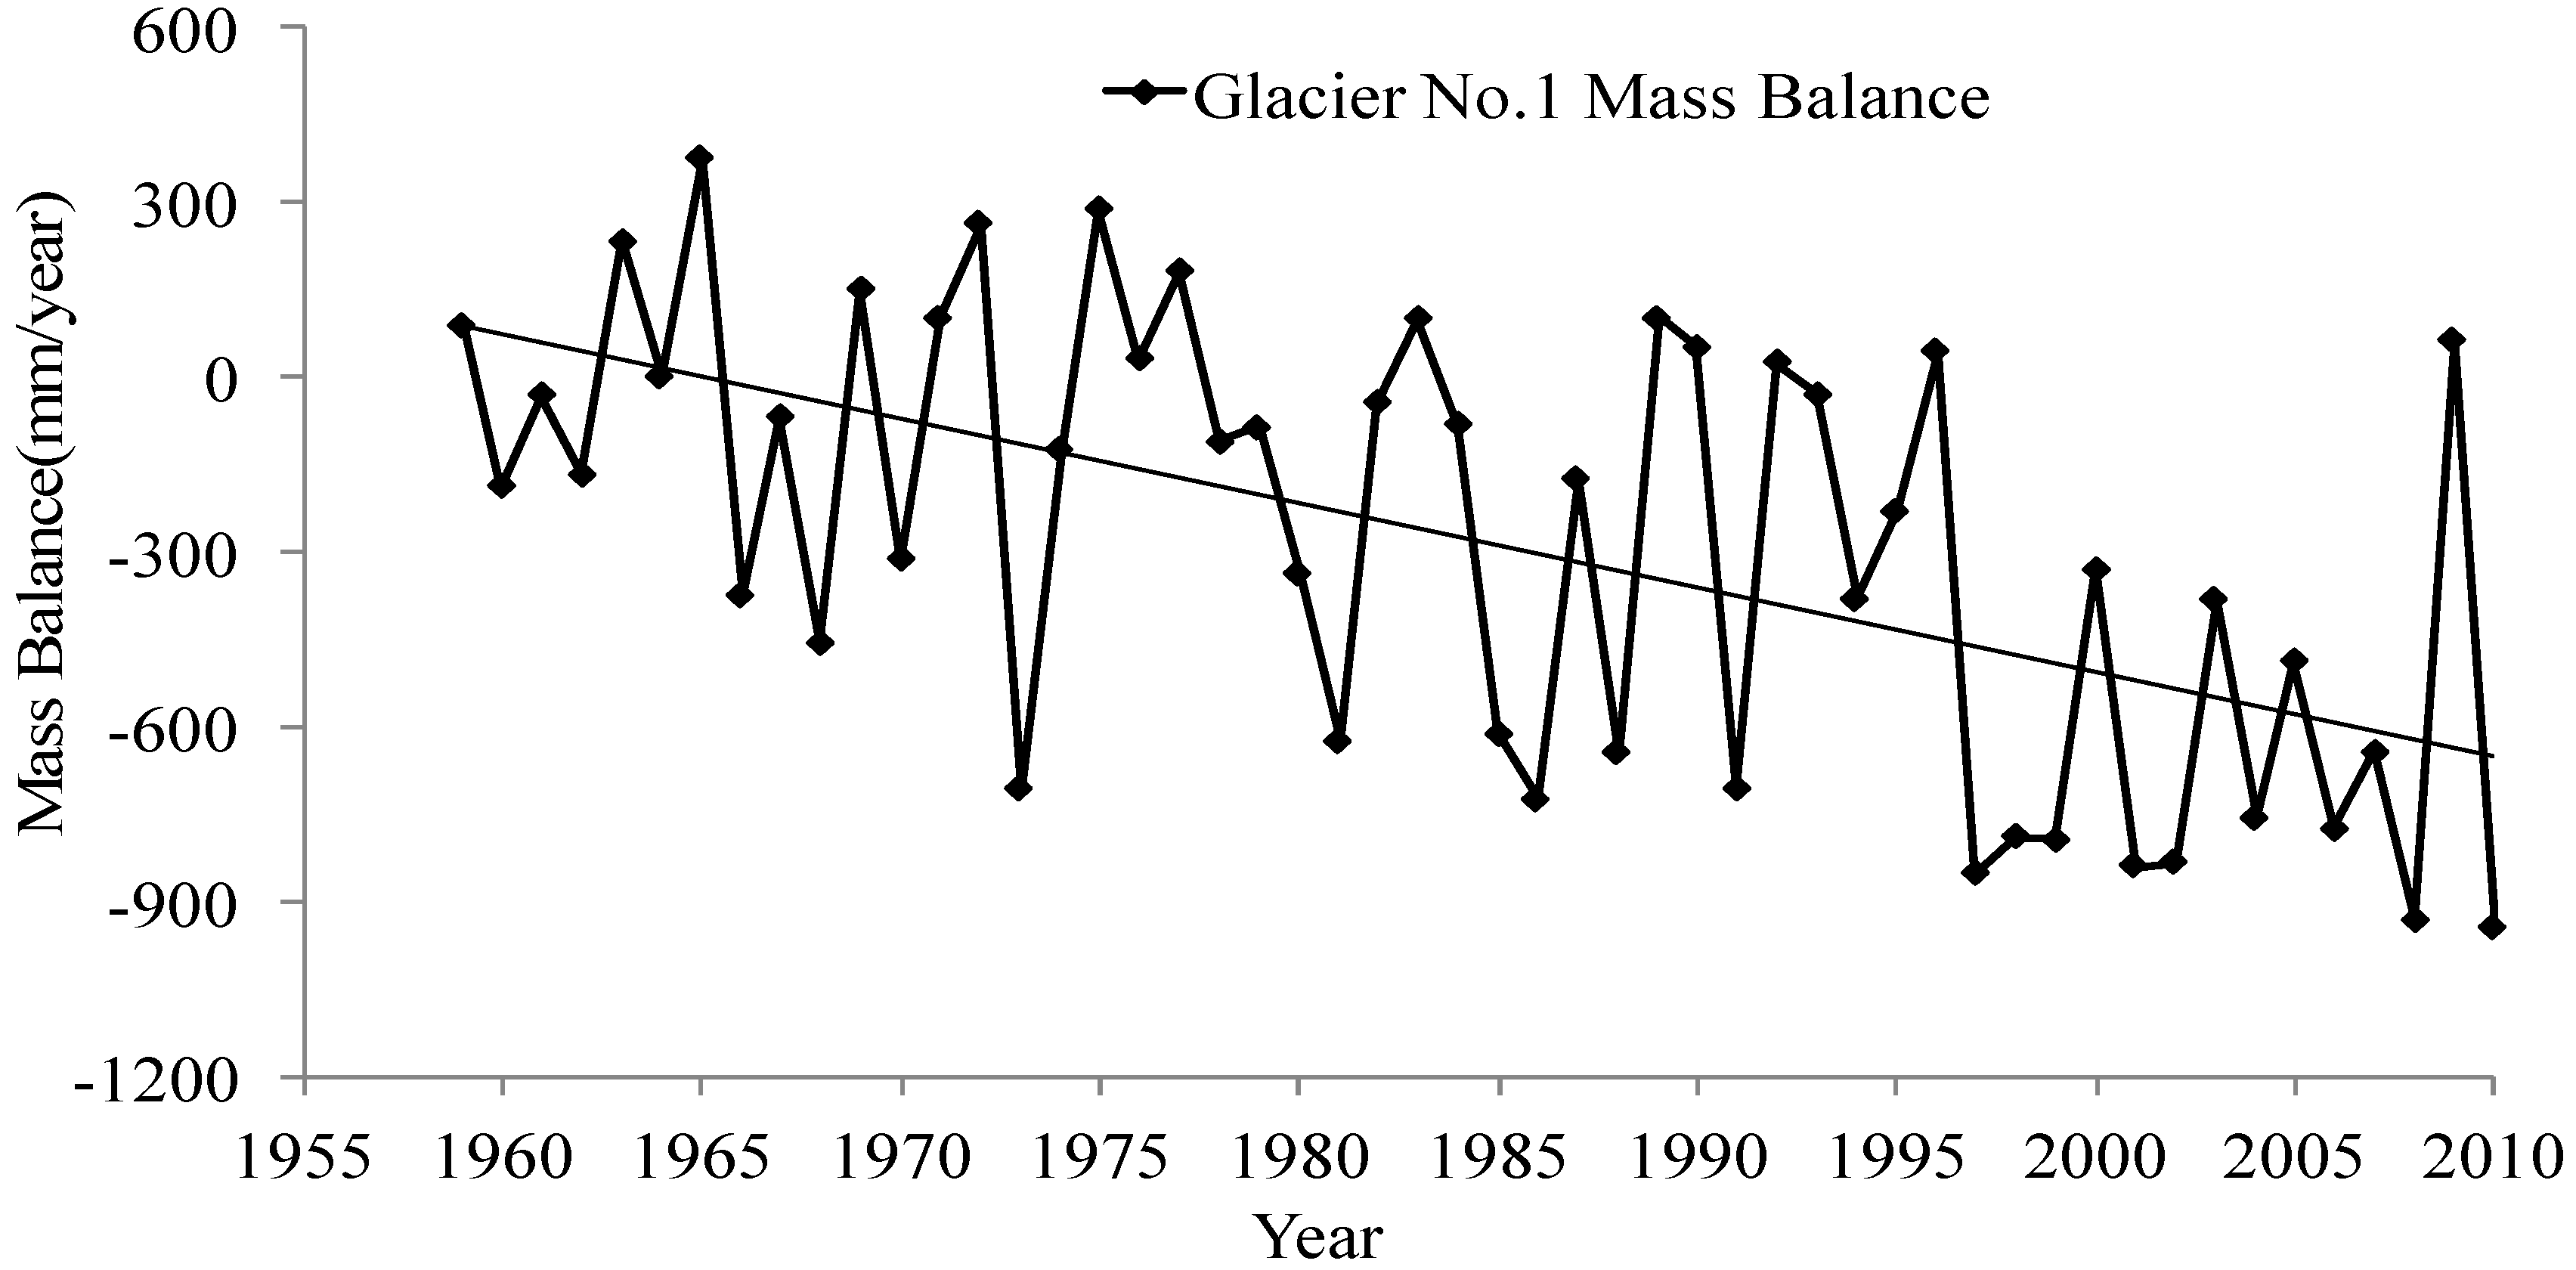
3.1. The Change in the Mass Balance of Glacier No. 1

Figure 2 shows the annual mass balance of Glacier No. 1 from 1959 to 2010. It can be seen that the mass balance has an obviously decreasing trend. The negative trend corresponds to −14.5mm/year. The Mann-Kendall test result corroborates this by an established decreasing trend at the 0.05 significance level. Change-Point Analyzer was applied to time series of the the mass balance of Glacier No. 1 to further explore possible abrupt change points. Table 1 shows the mass balance based on the change point result. A change point was detected in 1997 with 99% confidence level. The accumulated mass balance is about −14479 mm from 1959 to 2010. Thus, two time periods with different melting rates were identified as 1959–1996, 1997–2010. The mass balance for the first period was −136.4 mm/year, and it was up to −663.9 mm/year for the second period. It was seen that the acceleration of melting was becoming more vigorous.
Glacier mass balance is driven by the effects of hydroclimatic change. Li et al. [13] examined precipitation and temperature at the Daxigou meteorological station from 1959 to 2006 and found that the temperature demonstrated an overall increase, especially during 1997–2006. The mean temperature was −4.4 °C for the period of 1997–2006 as compared to −5.3 °C for 1959–1996. The corresponding precipitation increase was about 83.4 mm during 1959–2006 [13]. The remarkable rise in both temperature and precipitation after 1996 indicates a warm-humid climate pattern over the area. In fact, the region was experiencing the wettest and warmest climate during the past 48 years [13]. Thus, hydroclimatic warm period is corroborated by results from the change point analysis. Increased precipitation enhances glacier accumulation, and increased temperature enhances glacier ablation. Zhang et al. [28] linked the mass balance of Glacier No. 1 with climatic factors and found that mass balance decrease was controlled mainly by mainly summer temperature. It seems that significantly increased temperature after 1997 is the dominant factor for Glacier No. 1’s accelerated melting. Liu et al. [43] tested a temperature index mass balance model for Glacier No. 1 and found that the mass balance is more sensitive to temperature changes than changes in precipitation. Zhang et al. [28] examined that the averaged annual mass balance before 1986 and found it to be −94 mm/year. This changed to −242 mm/year during 1986–1996. During 1997–2000, strong ablation occurred with large mass losses.

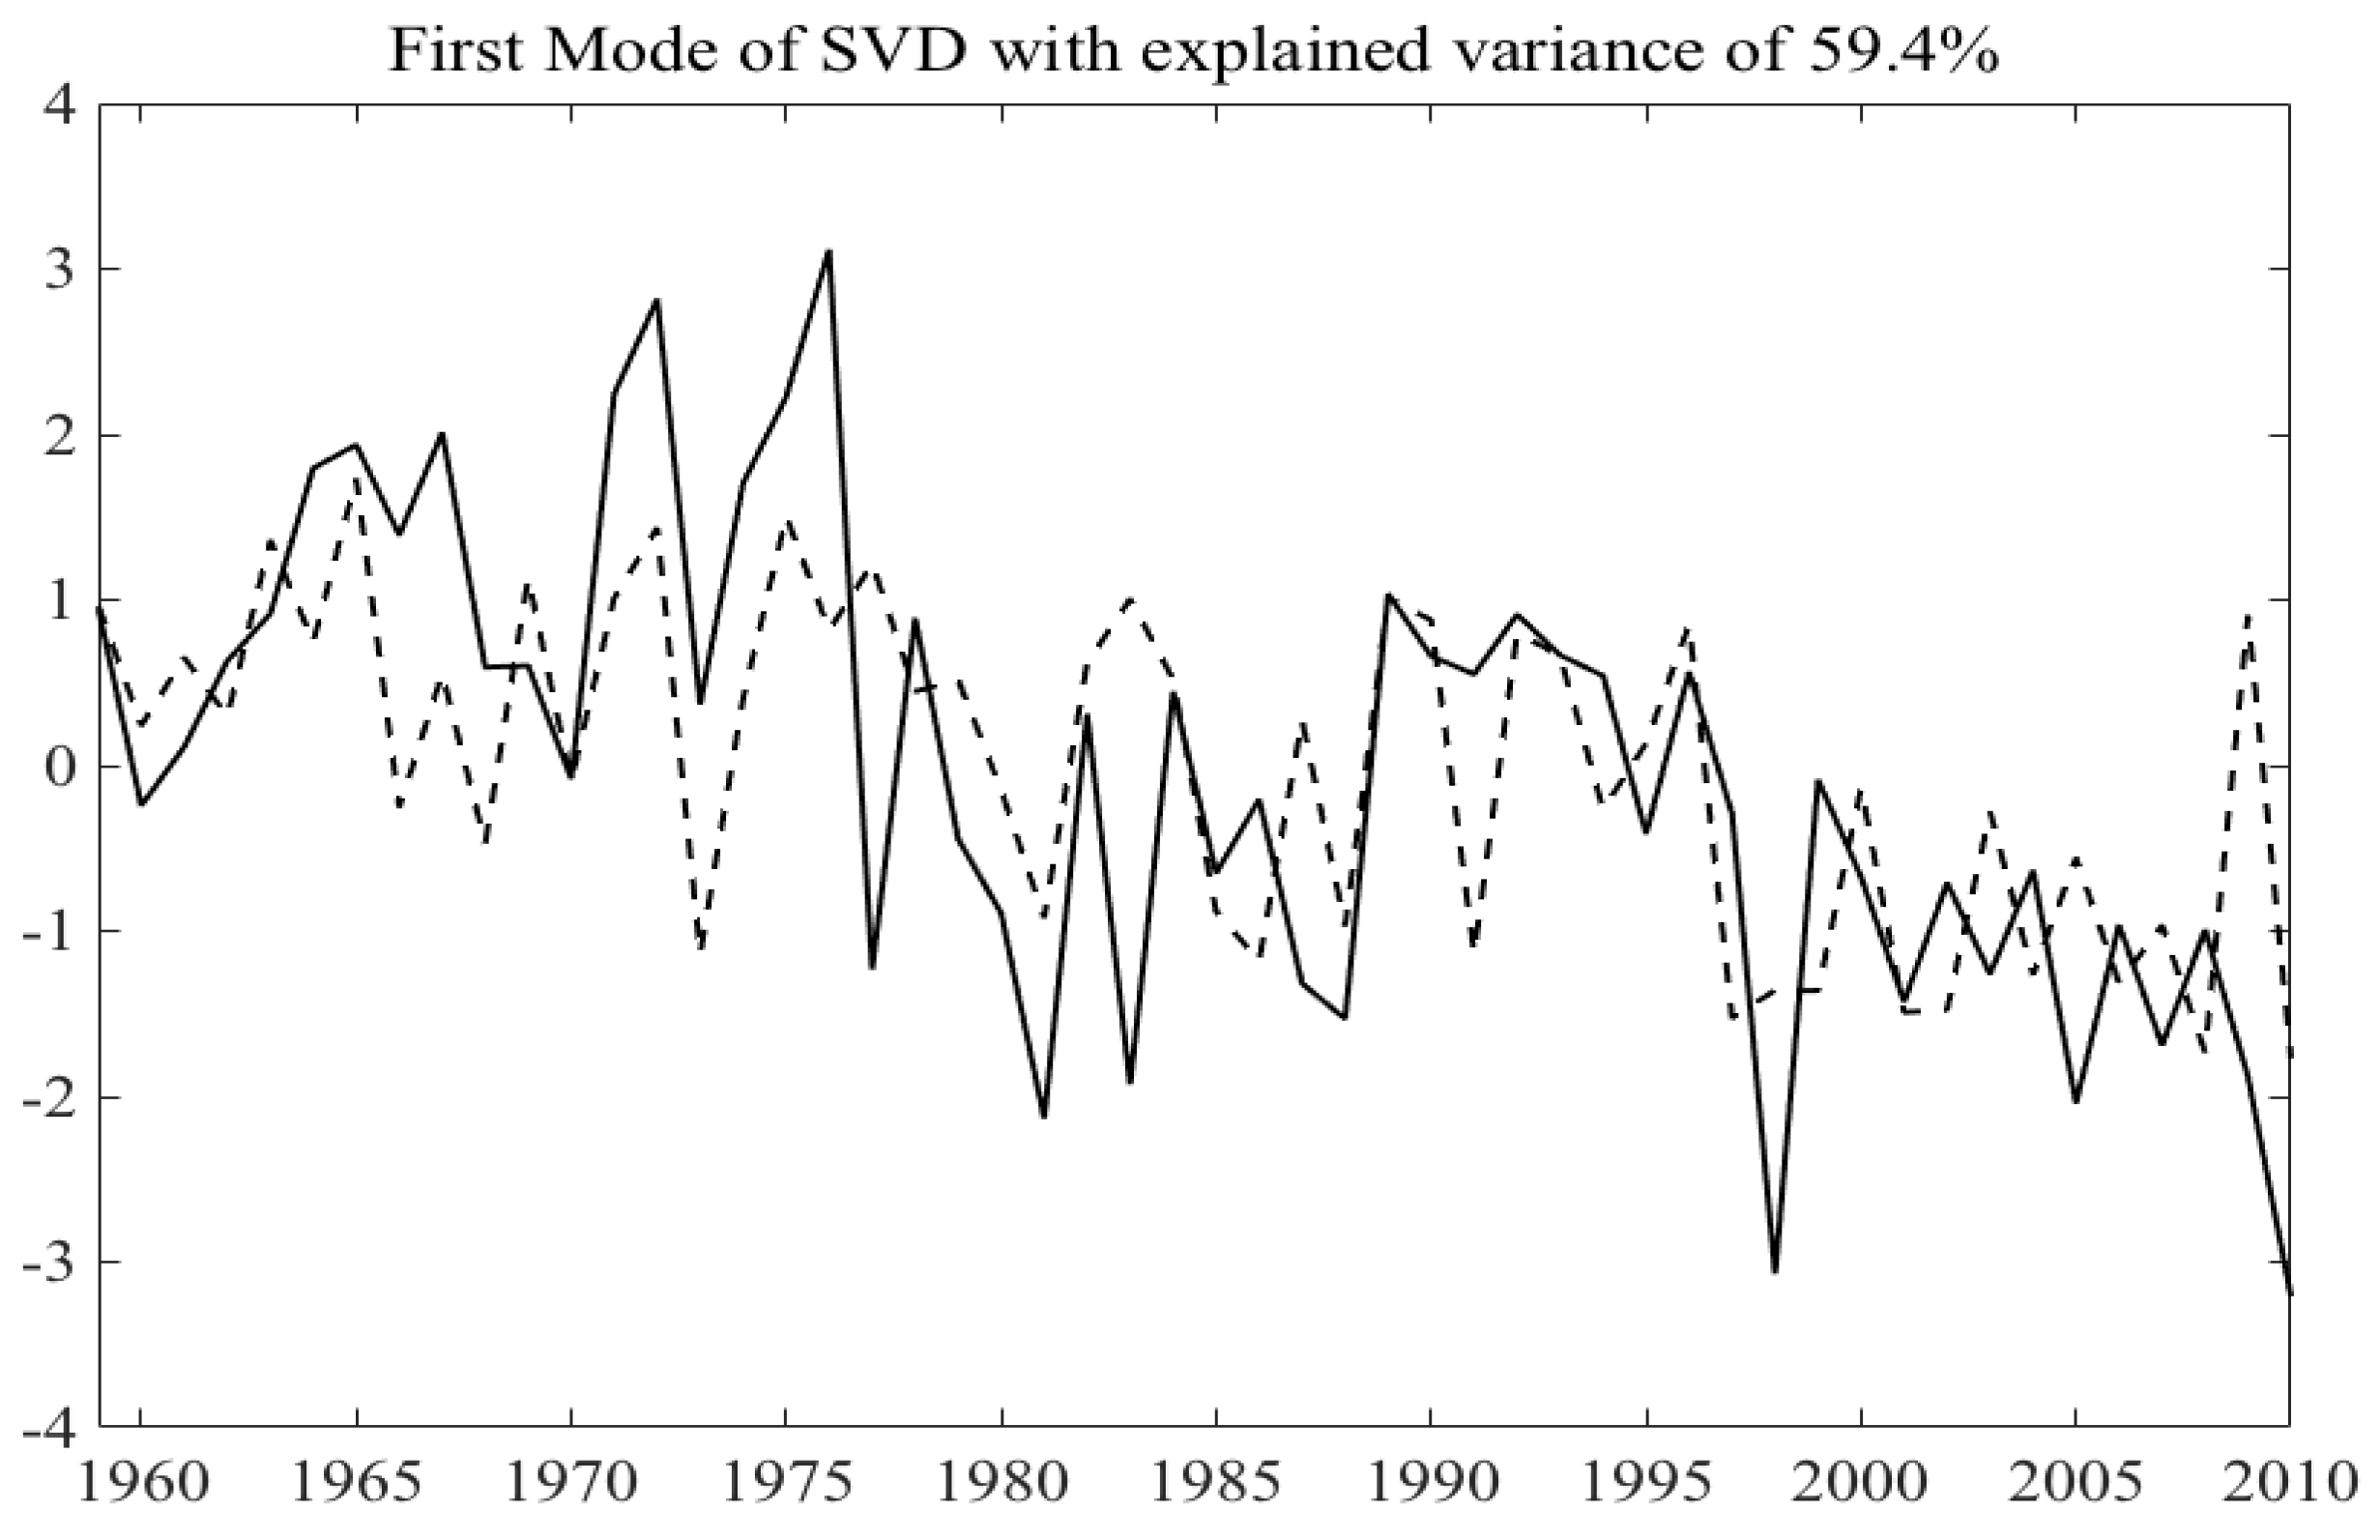
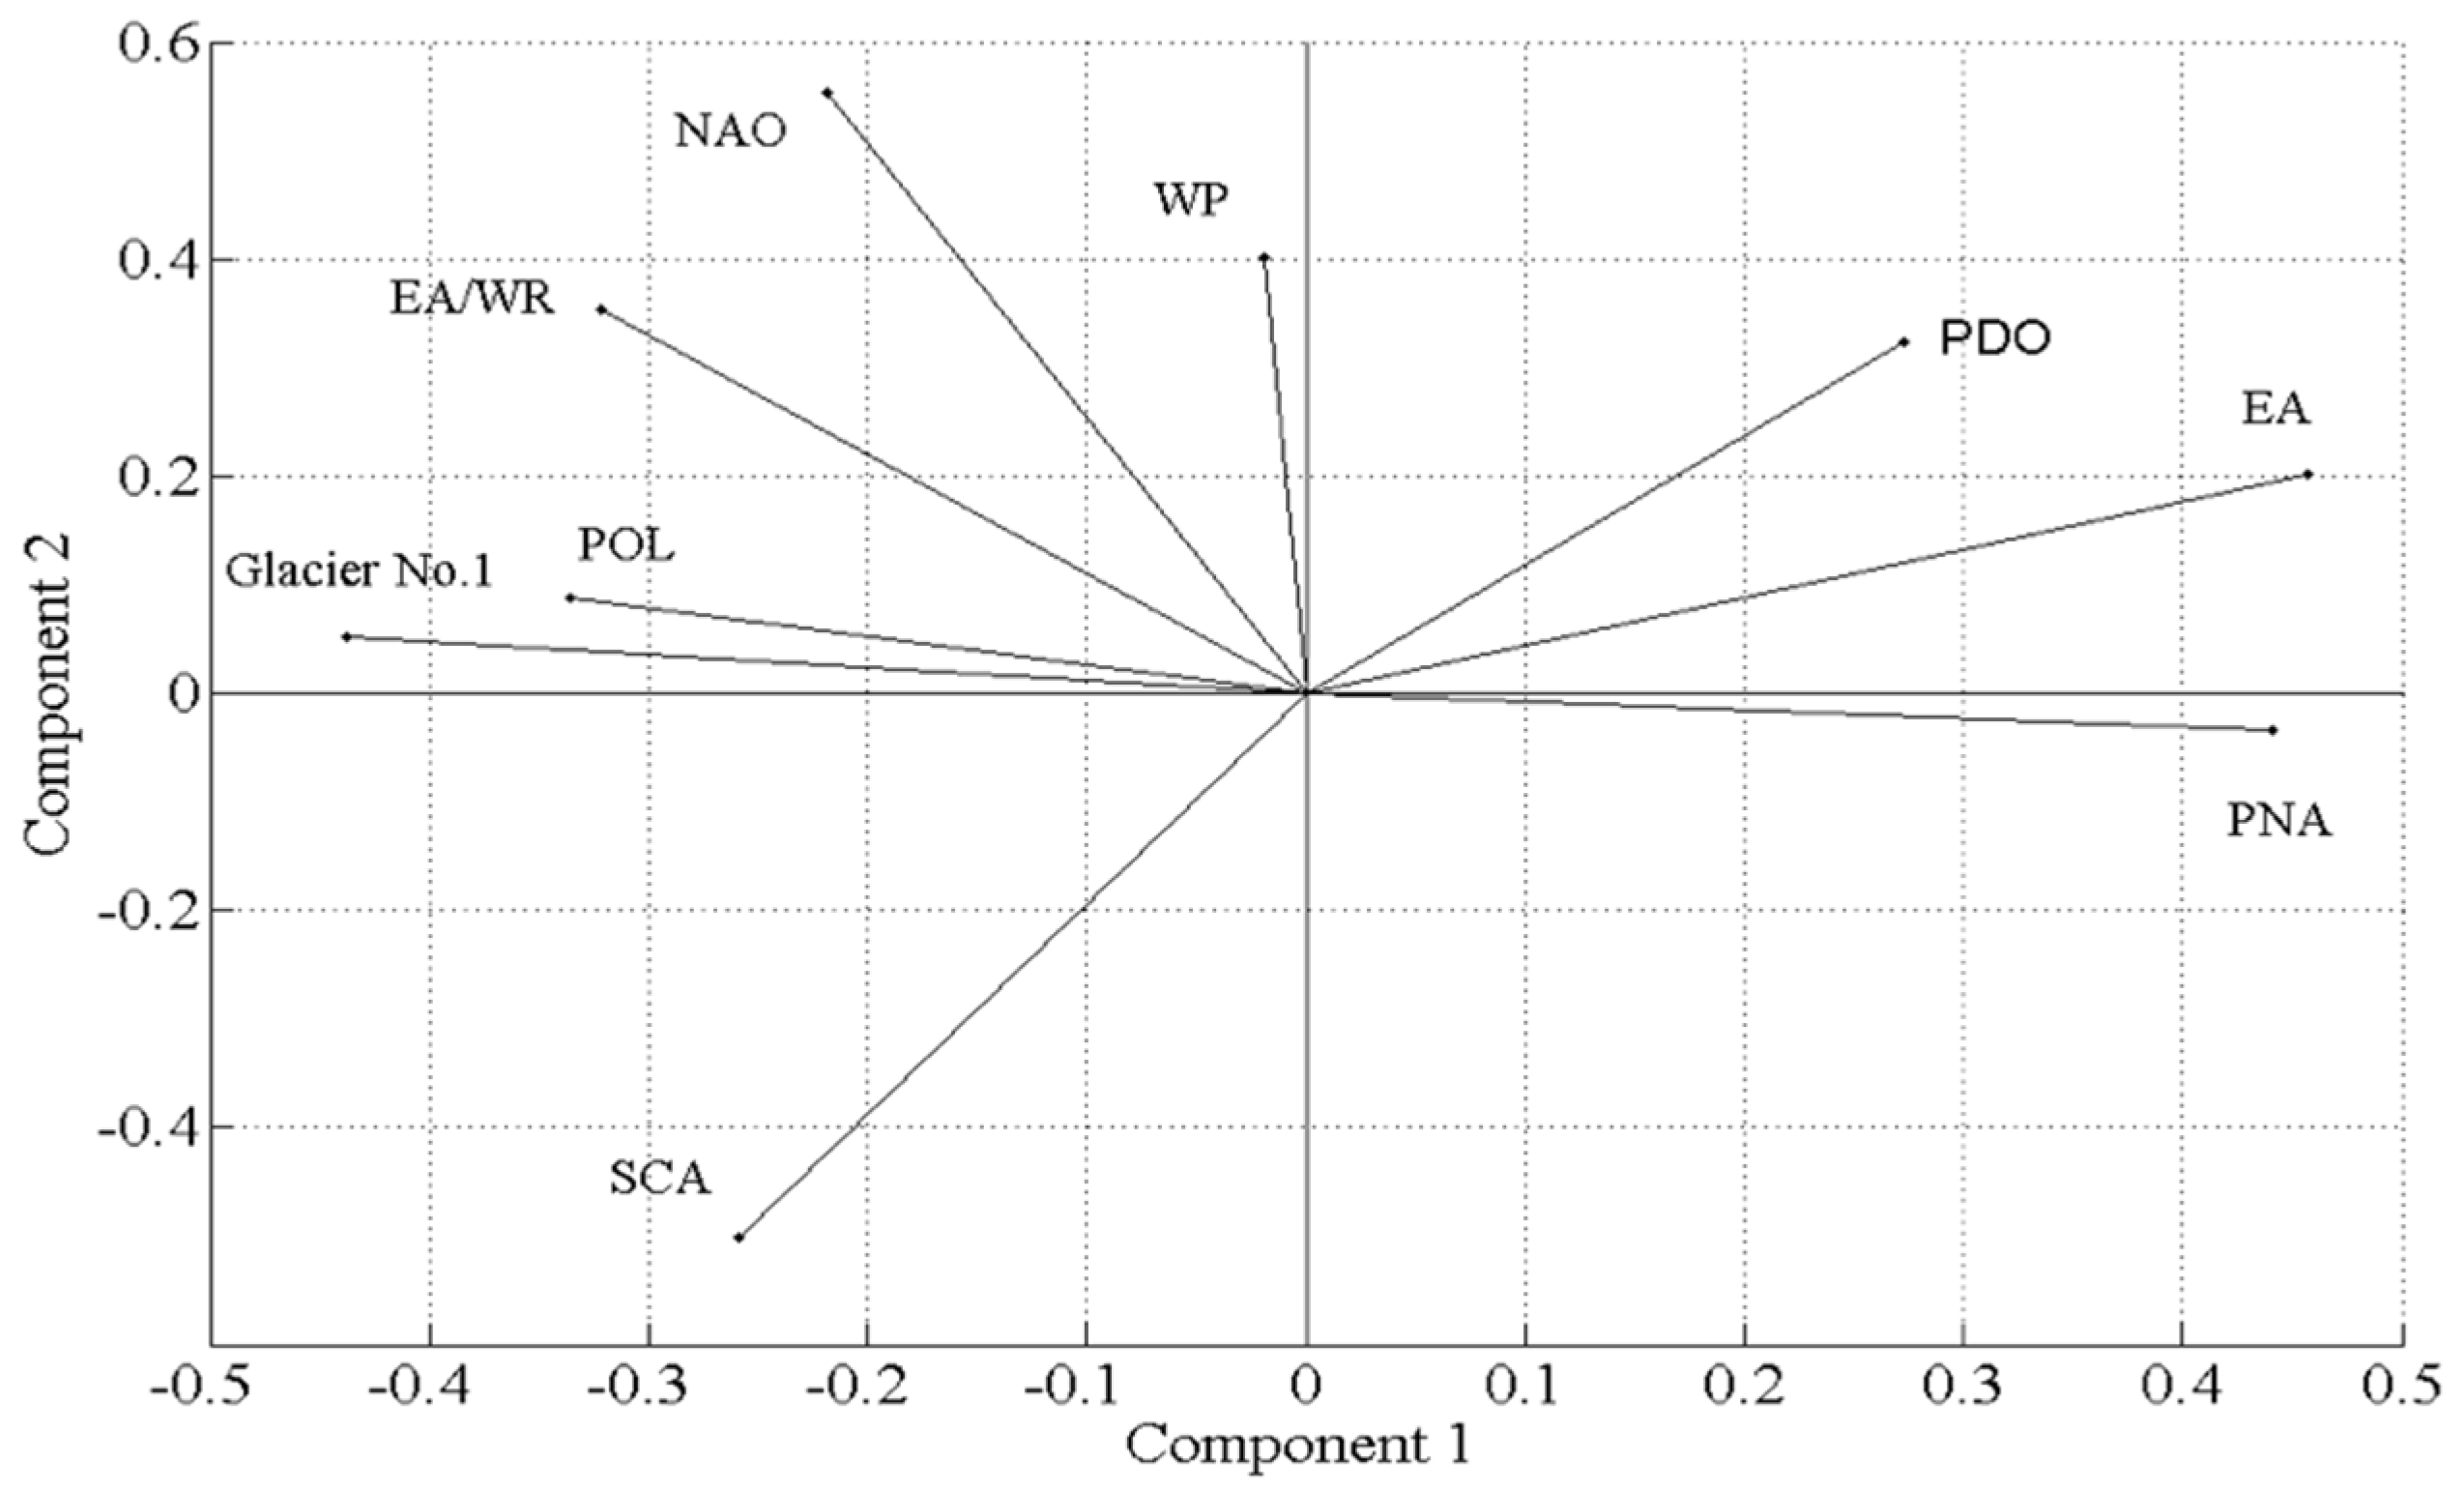
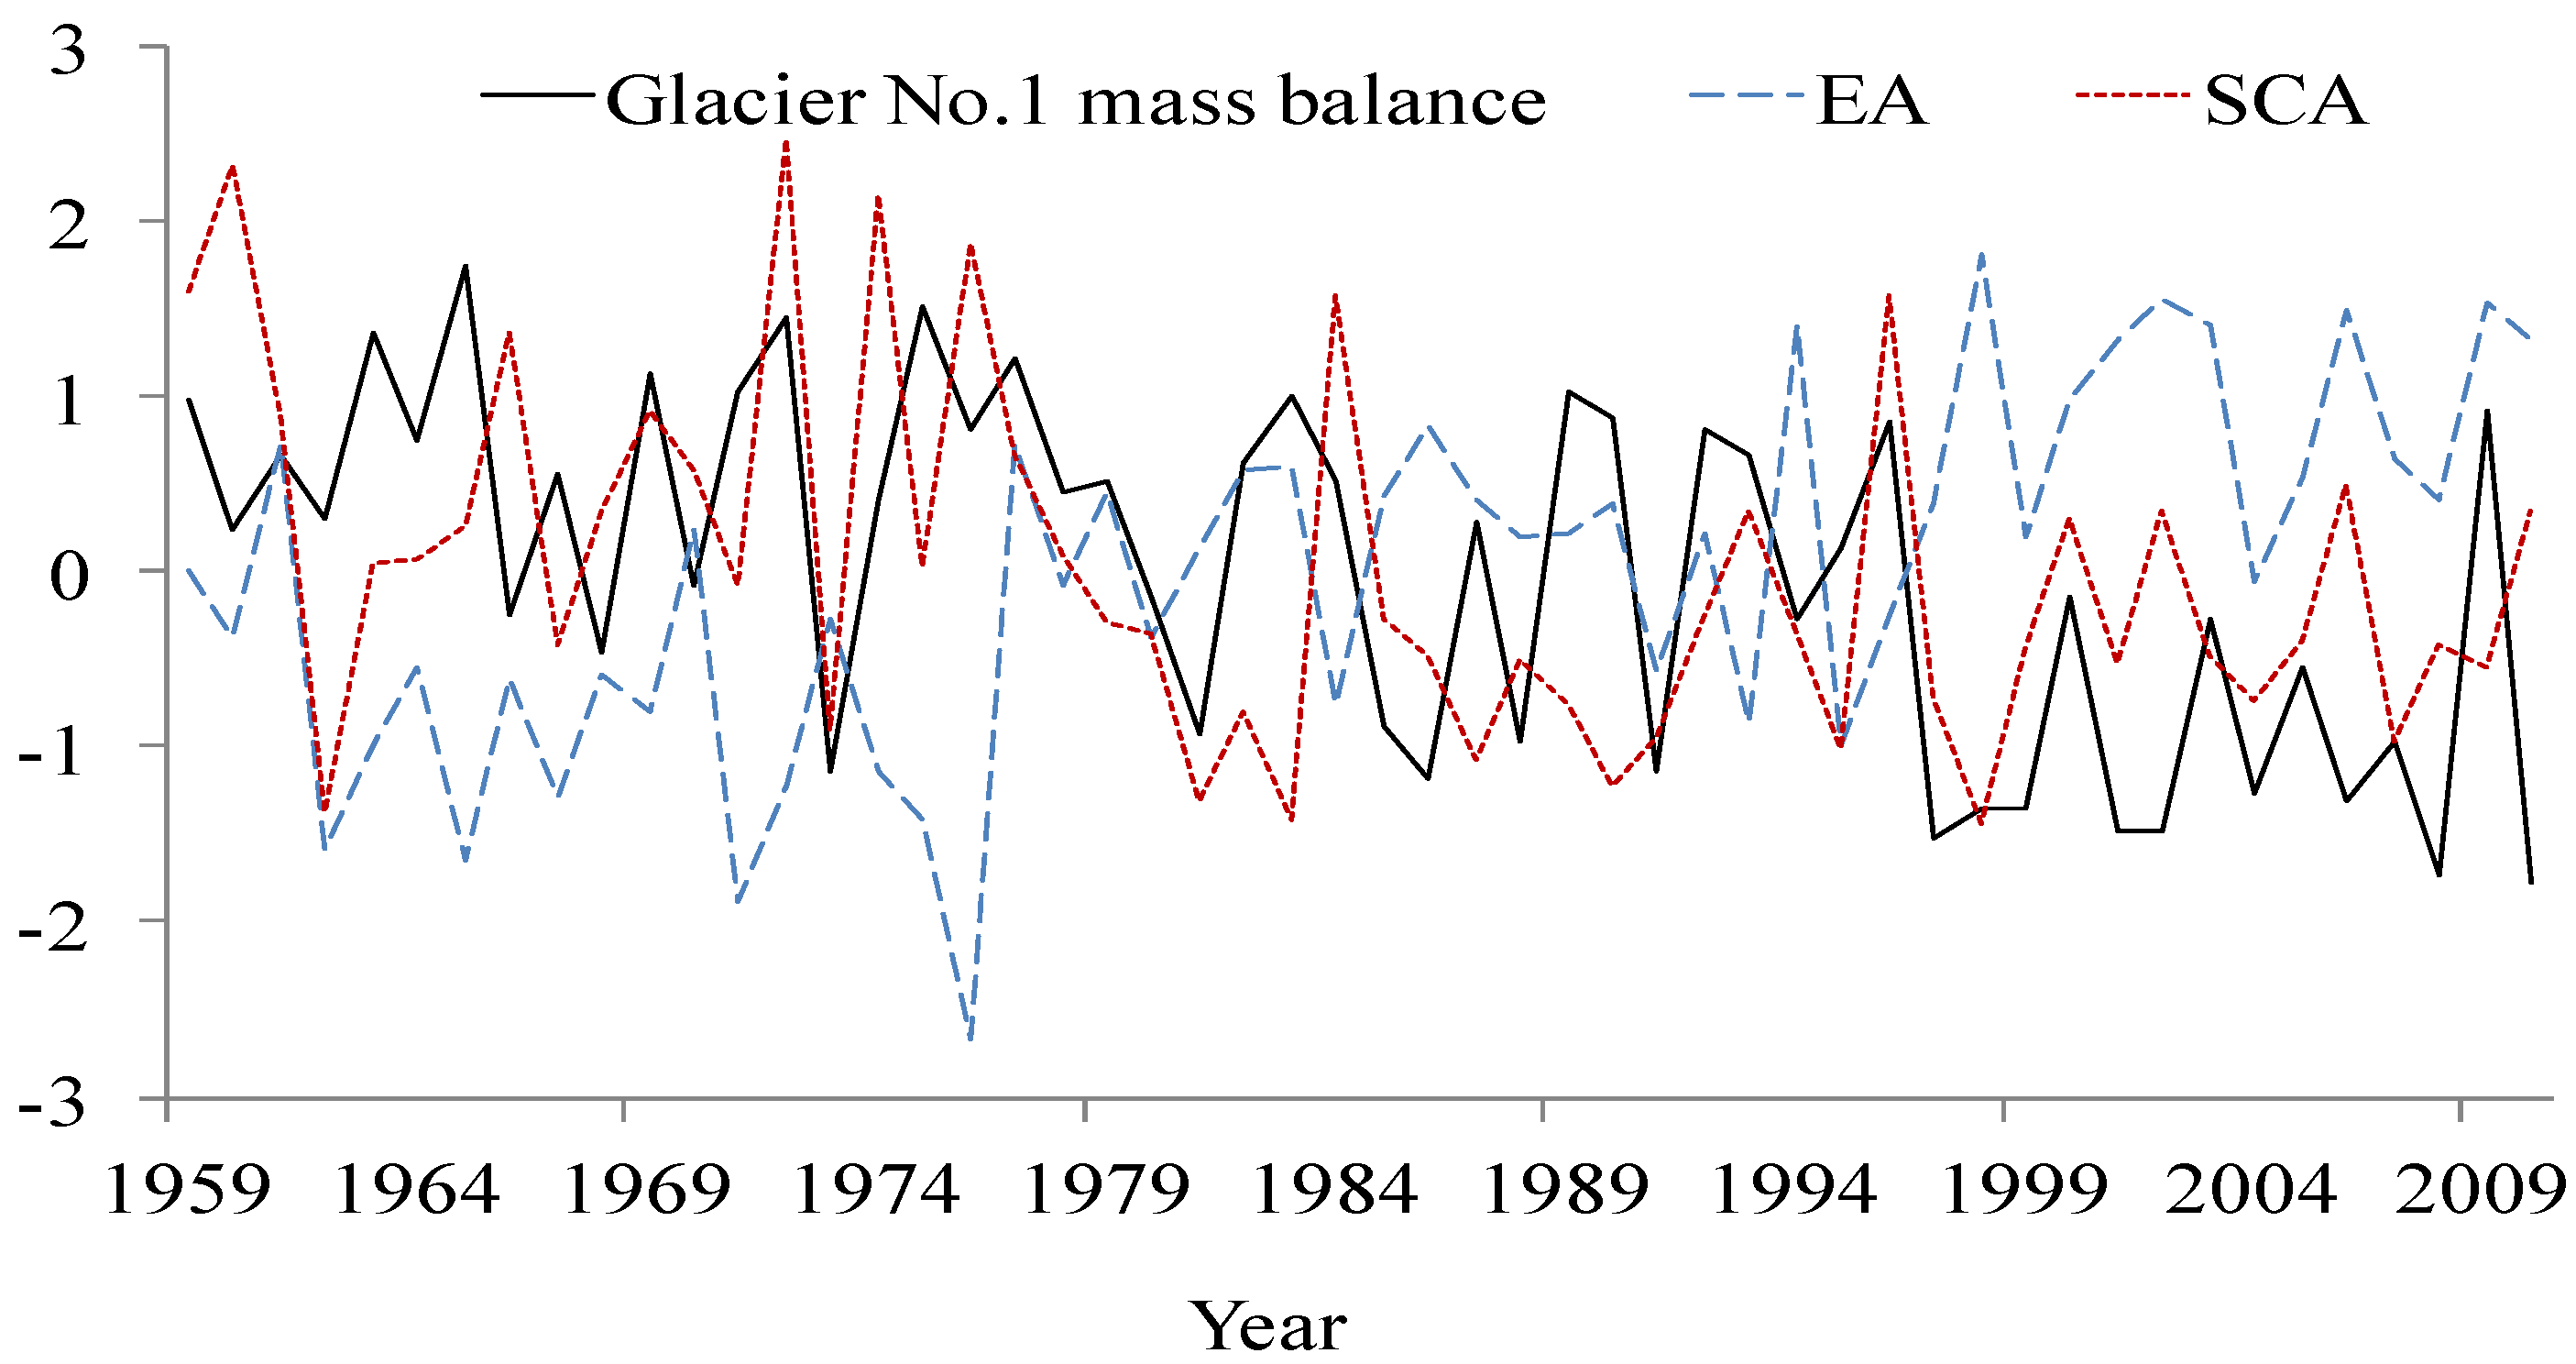
3.2. Relationships between the Mass Balance of Glacier No. 1 and Teleconnection Patterns

The mass balance of Glacier No. 1 was tested for relationships with different climate indices using PCA and SVD during 1959 to 2010. PCA revealed a close direct or inverse relationship between the mass balance and climate indices. The first two modes of PCA were analyzed as they represent a explained variance, 29.5% and 15.4%, respectively. Figure 3 shows the PCA biplot, and it can be seen that mass balance is in general represented in the first PCA mode. This is positively related to POL, SCA, and ER/WR, and negatively related to EA and PNA. The PCA analysis shows strong evidences that the mass balance is closely related to different teleconnection patterns.
SVD was applied to the cross-variance matrix between mass balance and climate indices to identify the correlations. Figure 4 presents the time series of mass balance and climate indices in the first mode of SVD with an explained variance of 59.4%. The similarity in variation shows that the mass balance is closely related to the teleconnection patterns. This means that the mass balance variability is mainly due to global climate phenomena. Table 2 shows the heterogeneous correlation to explore this relationship. It is noteworthy that the mass balance is positively related to SCA and negatively related to EA at 0.01 significance level. The result of SVD confirms the relationship between the mass balance and climate indices from PCA results. The standardized data of the mass balance is plotted against the standardized data of significantly related climate indices in Figure 5 to further visualize the findings. The figure shows that the mass balance of Glacier No. 1 is directly related to SCA and inversely related to EA.
Glaciers are sensitive indicators for the variations of atmospheric process and could provide information on atmospheric circulation such as responses to climatic fluctuations [3]. Bueh and Nakamura [44] studied the Scandinavian Pattern and its climatic impact and found that it appeared to be related to the climate in Northwest China. Feng et al. [45] examined the moisture source for precipitation in the upper Urumqi River, showing a dominant effect of westerly air masses in summer and the integrated influence of westerly and polar air masses in winter. Yang et al. [46] examined the mass loss of Southeast Tibetan glaciers and Glacier No. 1 and suggested that these glaciers mass balance spatial changes corresponded to the anticyclonic/cyclonic circulations causing temperature and precipitation variations. Bothe et al. [47] studied the precipitation climate of Central Asian and the large-scale atmospheric circulation and showed that SCA represent one of the most distinct influence on regional precipitation in Central Asia. Thus, these results corroborate the finding in this study that the mass balance of Glacier No. 1 is significantly correlated to SCA and EA.

4. Conclusions

In this study, the trend and change point of the mass balance of Glacier No. 1 were examined. It was found that the mass balance of Glacier No. 1 had a significantly decreasing trend between 1959 to 2010, namely, −14.5 mm/year. A change point was detected in 1997 with 99% confidence level. Based on the change point results, the mass balance was examined for the two measuring periods. It was seen that the acceleration of melting was becoming more vigorous. Previous research has shown that the significant temperature increase leads to an enhanced glacier retreat even if precipitation increases, and the summer temperature (June to August) increase is mainly responsible for glacier change. Glacier mass balance reflects an important signal of climate change. The link between the mass balance of Glacier No. 1 and Northern Hemisphere atmospheric variability covering the period 1959–2010 was investigated. Results showed that the mass balance of Glacier No. 1 is positively related to the SCA and negatively related to EA. These relationships are important for a better understanding of the interaction between glacier mass balance and climate variability. Consequently, the glacier mass balance can be predicted using these relationships.

Acknowledgments

The Key Program of National Natural Science Foundation of China (Grant No. 41371047) is gratefully acknowledged. The funds for covering the costs to publish in open access is received.

Author Contributions

Feifei Yuan planned the work together with the co-authors, performed the statistical analysis, analyzed the results and wrote the paper together with the co-authors. The co-authors participated in discussions and helped to revise the paper.

Conflicts of Interest

The authors declare no conflict of interest.

References

  1. Dyurgerov, M.B.; Meier, M.F. Twentieth century climate change: Evidence from small glaciers. P. Natl. Acad. Sci. USA 2000, 97, 1406–1411. [Google Scholar] [CrossRef]
  2. Diolaiuti, G.A.; Bocchiola, D.; Vagliasindi, M.; D’Agata, C.; Smiraglia, C. The 1975–2005 glacier changes in aosta valley (italy) and the relations with climate evolution. Prog. Phys. Geogr. 2012, 36, 764–785. [Google Scholar] [CrossRef]
  3. Aizen, V.; Aizen, E.; Melack, J.; Martma, T. Isotopic measurements of precipitation on central asian glaciers (southeastern tibet, northern himalayas, central tien shan). J. Geophys. Res. Atmos. 1996, 101, 9185–9196. [Google Scholar] [CrossRef]
  4. Bitz, C.M.; Battisti, D.S. Interannual to decadal variability in climate and the glacier mass balance in washington, western canada, and alaska. J. Clim. 1999, 12, 3181–3196. [Google Scholar] [CrossRef]
  5. Moore, R.D.; Demuth, M.N. Mass balance and streamflow variability at place glacier, canada, in relation to recent climate fluctuations. Hydrol. Process. 2001, 15, 3473–3486. [Google Scholar] [CrossRef]
  6. Washington, R.; Hodson, A.; Isaksson, E.; MacDonald, O. Northern hemisphere teleconnection indices and the mass balance of svalbard glaciers. Int. J. Climatol. 2000, 20, 473–487. [Google Scholar] [CrossRef]
  7. Leathers, D.J.; Yarnal, B.; Palecki, M.A. The pacific north-american teleconnection pattern and united-states climate. Part I. Regional temperature and precipitation associations. J. Clim. 1991, 4, 517–528. [Google Scholar] [CrossRef]
  8. Jiang, P.; Gautam, M.R.; Zhu, J.; Yu, Z. How well do the GCMs/RCMs capture the multi-scale temporal variability of precipitation in the southwestern united states? J. Hydrol. 2013, 479, 75–85. [Google Scholar] [CrossRef]
  9. Luo, P.; Apip; He, B.; Duan, W.; Takara, K.; Nover, D. Impact assessment of rainfall scenarios and land-use change on hydrologic response using synthetic area idf curves. J. Flood Risk Manag. 2015. [Google Scholar] [CrossRef]
  10. Chaffe, P.L.B.; Takara, K.; Yamashiki, Y.; Apip; Luo, P.; Silva, R.V.; Nakakita, E. Mapping of japanese areas susceptible to snow cover change. Hydrol. Sci. J. 2013, 58, 1718–1728. [Google Scholar] [CrossRef]
  11. Luo, P.; Takara, K.; Apip; He, B.; Nover, D. Palaeoflood simulation of the kamo river basin using a grid-cell distributed rainfall run-off model. J. Flood Risk Manag. 2014, 7, 182–192. [Google Scholar] [CrossRef]
  12. Luo, P.P.; He, B.; Takara, K.; Xiong, Y.E.; Nouer, D.; Duan, W.L.; Fukushi, K. Historical assessment of chinese and japanese flood management policies and implications for managing future floods. Environ. Sci. Policy 2015, 48, 265–277. [Google Scholar] [CrossRef]
  13. Li, Z.Q.; Wang, W.B.; Zhang, M.J.; Wang, F.T.; Li, H.L. Observed changes in streamflow at the headwaters of the urumqi river, eastern tianshan, central asia. Hydrol. Process. 2010, 24, 217–224. [Google Scholar] [CrossRef]
  14. Ye, B.S.; Yang, D.Q.; Jiao, K.Q.; Han, T.D.; Jin, Z.F.; Yang, H.A.; Li, Z.Q. The Urumqi River source Gacier No. 1, Tianshan, China: Changes over the past 45 years. Geophys. Res. Lett. 2005, 32. [Google Scholar] [CrossRef]
  15. Han, T.D.; Ding, Y.J.; Ye, B.S.; Jiao, K.Q. Characteristics of winter mass balance of Glacier No.1 at the headwaters of the urumqi river, tianshan mountains. Environ. Earth Sci. 2011, 63, 695–700. [Google Scholar] [CrossRef]
  16. Wu, L.; Li, H.; Wang, L. Application of a degree-day model for determination of mass balance of urumqi Glacier No. 1, eastern Tianshan, China. J. Earth Sci. 2011, 22, 470–481. [Google Scholar] [CrossRef]
  17. Li, Z.; Li, H.; Chen, Y. Mechanisms and simulation of accelerated shrinkage of continental glaciers: A case study of Urumqi Glacier No. 1 in eastern Tianshan, central Asia. J. Earth Sci. 2011, 22, 423–430. [Google Scholar] [CrossRef]
  18. Xu, X.; Pan, B.; Hu, E.; Li, Y.; Liang, Y. Responses of two branches of Glacier No. 1 to climate change from 1993 to 2005, Tianshan, China. Quat. Int. 2011, 236, 143–150. [Google Scholar] [CrossRef]
  19. Cui, Y.H.; Ye, B.S.; Wang, J.; Liu, Y.C. Influence of degree-day factor variation on the mass balance of Glacier No. 1 at the headwaters of Urumqi River, China. J. Earth Sci. 2013, 24, 1008–1022. [Google Scholar] [CrossRef]
  20. Gao, M.J.; Han, T.D.; Ye, B.S.; Jiao, K.Q. Characteristics of melt water discharge in the Glacier No. 1 basin, headwater of Urumqi River. J. Hydrol. 2013, 489, 180–188. [Google Scholar]
  21. Wang, P.Y.; Li, Z.Q.; Li, H.L.; Wang, W.B.; Yao, H.B. Comparison of glaciological and geodetic mass balance at Urumqi Glacier No. 1, Tianshan, central Asia. Glob. Planet Chang. 2014, 114, 14–22. [Google Scholar] [CrossRef]
  22. Diolaiuti, G.; Bocchiola, D.; D’agata, C.; Smiraglia, C. Evidence of climate change impact upon glaciers’ recession within the Italian Alps. Theor. Appl. Climatol. 2012, 109, 429–445. [Google Scholar] [CrossRef]
  23. Sun, M.P.; Yao, X.J.; Li, Z.Q.; Zhang, M.J. Hydrological processes of glacier and snow melting and runoff in the Urumqi River source region, eastern Tianshan mountains, China. J. Geogr. Sci. 2015, 25, 149–164. [Google Scholar] [CrossRef]
  24. Xu, X.K.; Pan, B.L.; Hu, E.; Li, Y.J.; Liang, Y.H. Responses of two branches of Glacier No. 1 to climate change from 1993 to 2005, Tianshan, China. Quat. Int. 2011, 236, 143–150. [Google Scholar] [CrossRef]
  25. Williams, M.W.; Tonnessen, K.A.; Melack, J.M.; Yang, D.Q. Sources and spatial variation of the chemical-composition of snow in the Tien Shan, China. Ann. Glaciol. 1992, 16, 25–32. [Google Scholar]
  26. Li, X.; Li, Z.; Ding, Y.; Liu, S.; Zhao, Z.; Luo, L.; Pang, H.; Li, C.; Li, H.; You, X.; et al. Seasonal variations of ph and electrical conductivity in a snow-firn pack on Glacier No. 1, eastern Tianshan, China. Cold Reg. Sci. Technol. 2007, 48, 55–63. [Google Scholar] [CrossRef]
  27. Tian, L.; Yao, T.; MacClune, K.; White, J.W.C.; Schilla, A.; Vaughn, B.; Vachon, R.; Ichiyanagi, K. Stable isotopic variations in west China: A consideration of moisture sources. J. Geophys. Res. 2007, 112. [Google Scholar] [CrossRef]
  28. Zhang, G.F.; Li, Z.Q.; Wang, W.B.; Wang, W.D. Rapid decrease of observed mass balance in the Urumqi Glacier No. 1, Tianshan mountains, central Asia. Quat. Int. 2014, 349, 135–141. [Google Scholar] [CrossRef]
  29. Barnston, A.G.; Livezey, R.E. Classification, seasonality and persistence of low-frequency atmospheric circulation patterns. Mon. Weather Rev. 1987, 115, 1083–1126. [Google Scholar] [CrossRef]
  30. Burn, D.H.; Elnur, M.A.H. Detection of hydrologic trends and variability. J. Hydrol. 2002, 255, 107–122. [Google Scholar] [CrossRef]
  31. Westmacott, J.R.; Burn, D.H. Climate change effects on the hydrologic regime within the churchill-nelson river basin. J. Hydrol. 1997, 202, 263–279. [Google Scholar] [CrossRef]
  32. Luo, P.P.; He, B.; Chaffe, P.L.B.; Nover, D.; Takara, K.; Rozainy, M.A.Z.M.R. Statistical analysis and estimation of annual suspended sediments of major rivers in Japan. Environ. Sci. Process Impact 2013, 15, 1052–1061. [Google Scholar] [CrossRef] [PubMed]
  33. Luo, P.P.; He, B.; Takara, K.; Razafindrabe, B.H.N.; Nover, D.; Yamashiki, Y. Spatiotemporal trend analysis of recent river water quality conditions in Japan. J. Environ. Monit. 2011, 13, 2819–2829. [Google Scholar] [CrossRef] [PubMed] [Green Version]
  34. Taylor, W.A. Change-Point Analysis: A Powerful New Tool for Detecting Changes. Available online: http://www.variation.com/cpa/tech/changepoint.html (accessed on 31 December 2014).
  35. Collins, K.; Hunt, W.; Hathaway, J. Hydrologic comparison of four types of permeable pavement and standard asphalt in eastern North Crolina. J. Hydrol. Eng. 2008, 13, 1146–1157. [Google Scholar] [CrossRef]
  36. Fischer, T.; Gemmer, M.; Liu, L.; Su, B. Change-points in climate extremes in the Zhujiang River basin, south China, 1961–2007. Clim. Chang. 2012, 110, 783–799. [Google Scholar] [CrossRef]
  37. Mavromatis, T.; Stathis, D. Response of the water balance in greece to temperature and precipitation trends. Theor. Appl. Climatol. 2011, 104, 13–24. [Google Scholar] [CrossRef]
  38. Rana, A.; Uvo, C.B.; Bengtsson, L.; Sarthi, P.P. Trend analysis for rainfall in delhi and mumbai, india. Clim. Dyn. 2012, 38, 45–56. [Google Scholar] [CrossRef]
  39. Uvo, C.B. Analysis and regionalization of northern european winter precipitation based on its relationship with the north atlantic oscillation. Int. J. Climatol. 2003, 23, 1185–1194. [Google Scholar] [CrossRef]
  40. Wallace, J.M.; Smith, C.; Bretherton, C.S. Singular value decomposition of wintertime sea-surface temperature and 500-mb height anomalies. J. Clim. 1992, 5, 561–576. [Google Scholar] [CrossRef]
  41. Uvo, C.B.; Repelli, C.A.; Zebiak, S.E.; Kushnir, Y. The relationships between tropical pacific and atlantic sst and northeast brazil monthly precipitation. J. Clim. 1998, 11, 551–562. [Google Scholar] [CrossRef]
  42. Bretherton, C.S.; Smith, C.; Wallace, J.M. An intercomparison of methods for finding coupled patterns in climate data. J. Clim. 1992, 5, 541–560. [Google Scholar] [CrossRef]
  43. Liu, Q.; Liu, S. Response of glacier mass balance to climate change in the tianshan mountains during the second half of the twentieth century. Clim. Dyn. 2015, 46, 303–316. [Google Scholar] [CrossRef]
  44. Bueh, C.; Nakamura, H. Scandinavian pattern and its climatic impact. Q. J. R. Meteor. Soc. 2007, 133, 2117–2131. [Google Scholar] [CrossRef]
  45. Feng, F.; Li, Z.Q.; Zhang, M.J.; Jin, S.; Dong, Z.W. Deuterium and oxygen 18 in precipitation and atmospheric moisture in the upper urumqi river basin, eastern tianshan mountains. Environ. Earth Sci. 2013, 68, 1199–1209. [Google Scholar] [CrossRef]
  46. Yang, W.; Guo, X.; Yao, T.; Zhu, M.; Wang, Y. Recent accelerating mass loss of southeast tibetan glaciers and the relationship with changes in macroscale atmospheric circulations. Clim. Dyn. 2015, 1–11. [Google Scholar] [CrossRef]
  47. Bothe, O.; Fraedrich, K.; Zhu, X.H. Precipitation climate of central Asia and the large-scale atmospheric circulation. Theor. Appl. Climatol. 2012, 108, 345–354. [Google Scholar] [CrossRef]
Figure 1. Location of Glacier No. 1, and an overview of the ablation stake network [28].
Water 08 00100 g001
Figure 2. The mass balance of Glacier No. 1 from 1959 to 2010 at the headwaters of the Urumqi River.
Water 08 00100 g002
Figure 3. Biplot from the first two modes of PCA.
Water 08 00100 g003
Figure 4. Time series of the mass balance of Glacier No. 1 and climatic indices in the first mode of SVD.
Water 08 00100 g004
Figure 5. Comparison of the mass balance of Glacier No. 1 with significantly related climate indices.
Water 08 00100 g005
Table 1. The mass balance of Glacier No. 1 based on the change point results.
Change Point AnalyzerChange PointConfidence Pevel (%)Mass Plance (1959–1996)Mass Palance (1997–2010)Accumulated Pass Palance
Mass balance199799−136.4 mm/year−663.9 mm/year−14479 mm
Table 2. Heterogeneous correlation between the mass balance of Glacier No. 1 and climate indices.
ModeGlacier No. 1NAOEAWPPNAEA/WRSCAPOLPDO
Mode10.5940.277−0.5170.109−0.3230.2730.3440.241−0.092
Note: Values in bold are statistically significant at 0.01 level.

