Article

Will Dam Removal Increase Nitrogen Flux to Estuaries?

Department of Natural Resources Science, University of Rhode Island, One Greenhouse Road, Kingston, RI 02881, USA
*
Author to whom correspondence should be addressed.
Water 2016, 8(11), 522; https://doi.org/10.3390/w8110522
Submission received: 6 July 2016 / Revised: 24 October 2016 / Accepted: 31 October 2016 / Published: 8 November 2016
(This article belongs to the Special Issue Land Use, Climate, and Water Resources)

Abstract

:
To advance the science of dam removal, analyses of functions and benefits need to be linked to individual dam attributes and effects on downstream receiving waters. We examined 7550 dams in the New England (USA) region for possible tradeoffs associated with dam removal. Dam removal often generates improvements for safety or migratory fish passage but might increase nitrogen (N) flux and eutrophication in coastal watersheds. We estimated N loading and removal with algorithms using geospatial data on land use, stream flow and hydrography. We focused on dams with reservoirs that increase retention time at specific points of river reaches, creating localized hotspots of elevated N removal. Approximately 2200 dams with reservoirs had potential benefits for N removal based on N loading, retention time and depth. Across stream orders, safety concerns on these N removal dams ranged between 28% and 44%. First order streams constituted the majority of N removal dams (70%), but only 3% of those were classified as high value for fish passage. In cases where dam removal might eliminate N removal function from a particular reservoir, site-specific analyses are warranted to improve N delivery estimates and examine alternatives that retain the reservoir while enhancing fish passage and safety.

Graphical Abstract

1. Introduction

Decisions surrounding the future of dams can be informed by scientific inquiry into functions and values linked to their removal, alterations or maintenance [1,2]. There are numerous tradeoffs to be weighed with every dam decision. For example, in dam removal decisions, there are the potential benefits of improved migratory fish passage and reduced hazards due to dam failures versus the potential costs of removing water supply storage, flood control, recreational opportunities, pollutant retention, or economic opportunities with hydropower.
Dams stymie migratory fish passage, eliminating or degrading vast expanses of aquatic habitats in coastal watersheds [3]. This loss of connectivity between estuaries and watersheds affects biota across multiple trophic levels—resulting in negative consequences for the economics, sustainability and biodiversity of fisheries [4,5,6]. Even when fish passage across dams is promoted through technical structures like Denil fish ladders, poor design, changes in the annual flow regime and water temperatures present challenges to migratory species [7].
Dam failure is a constant concern—and is a clear threat to property, ecosystems and human well-being. Poor construction, aging infrastructure, insufficient maintenance and changes in upstream flow regimes can compromise dam safety. Dam failures can also unleash substantial and sometimes contaminated sediment loads to downstream habitats.
Dams provide a number of important economic and societal benefits including hydropower and flood control [2]. Some reservoirs associated with dams store water for irrigation and drinking water supplies. Dams—and their associated reservoirs—also provide historic and cultural values to some communities [8].
The ecological and societal impacts of dam removal can be complex, varied and confounded by a scarcity of systematic data-driven science. To advance the science of dam removal, analyses of functions and values need to be linked to the specific attributes of a given dam and its role within the larger watershed context [9]. Poff and Hart [7] argue for the development of ecological classification approaches based on characteristics available in governmental databases.
Here, we propose—and illustrate—an ecological classification based on a potential function of dams—the retention and removal of nitrate-nitrogen from coastal watersheds. Elevated nitrogen (N) loads to coastal estuaries can enhance primary productivity accelerating eutrophication that results in degradation of estuarine habitats (e.g., seagrasses replaced by macroalgae) and hypoxia [10,11,12]. Coastal watersheds—from local to regional scales—retain or remove a substantial portion of N inputs, dramatically reducing the ratio of N delivery to N inputs to estuaries [13,14]. This N retention and removal occurs in soils, wetlands, lower-order streams, lakes and reservoirs. Denitrification, the microbial process that reduces nitrate-N to nitrous oxide and N gas is a major removal mechanism in aquatic systems [13]. Plant uptake and immobilization in organic sediments are processes that serve to retain N [15]. Following prior conventions in the literature, we use the word “removal” to refer to all N retention and removal processes within reservoirs [16].
Seitzinger et al. [17], using empirical data from multiple studies, found that a substantial amount of the variability associated with watershed N removal in aquatic ecosystems could be described by the ratio of depth to hydraulic retention time. Shallow rivers, wetlands, lakes and reservoirs are associated with higher N removal. A number of other empirical and process-level studies have demonstrated that, with sufficient retention times and appropriate average depths, reservoirs of varying scales, ranging from <1 to 4400 ha, can be important locations for N removal [18,19,20,21]. However, many reservoirs with large contributing watersheds have low retention times and thus relatively low capacity to substantially change N flux.
We explore the extent of potential N removal by reservoirs associated with dams through a case study focused on all reported dams (>14,000) in the New England region (area approximately 200,000 km2) of the Northeast USA. The region has a high density of dams—many constructed decades or centuries ago—on coastal watersheds that drain to estuaries threatened or degraded by N loading. These coastal watersheds are essential to the life cycle of fish that migrate between marine and freshwater. Interest in dam removal is accelerating, motivated by concerns for both improved fish passage and safety. These dams are located on streams of varying sizes and many are run-of-river dams that do not have impoundments (i.e., reservoirs). We focused our study on situations where dam removal may create a marked change in the watershed N to downstream waters. Modeling [17,22] and empirical [23,24] studies have demonstrated that N can be removed from free flowing rivers, but here we examined dams with reservoirs that altered the retention time within a given stream reach and thus create a localized hotspot of N removal [18,19,20,21] that should exceed the N removal associated with the unaltered, free flowing river reach.
Where reservoirs exist, the ponded area can range from several hectares to several thousand hectares. The many combinations of stream order, watershed area, land use and ponded area suggest a widely varied set of N loading, depths and hydraulic retention times—thus a large range in N removal associated with reservoirs. Following the suggestion of Poff and Hart [7] on the need for regional-scale ecological classifications of dams, we used widely available geospatial databases to examine the extent and locations of dams with potential for N removal. Finally, we link our results to state and regional data that identify specific dams as safety risks or severe impediments to migratory fish passage to signal tradeoff situations where additional site specific studies, including additional N abatement approaches or alternatives to removal, may be warranted.

2. Approach

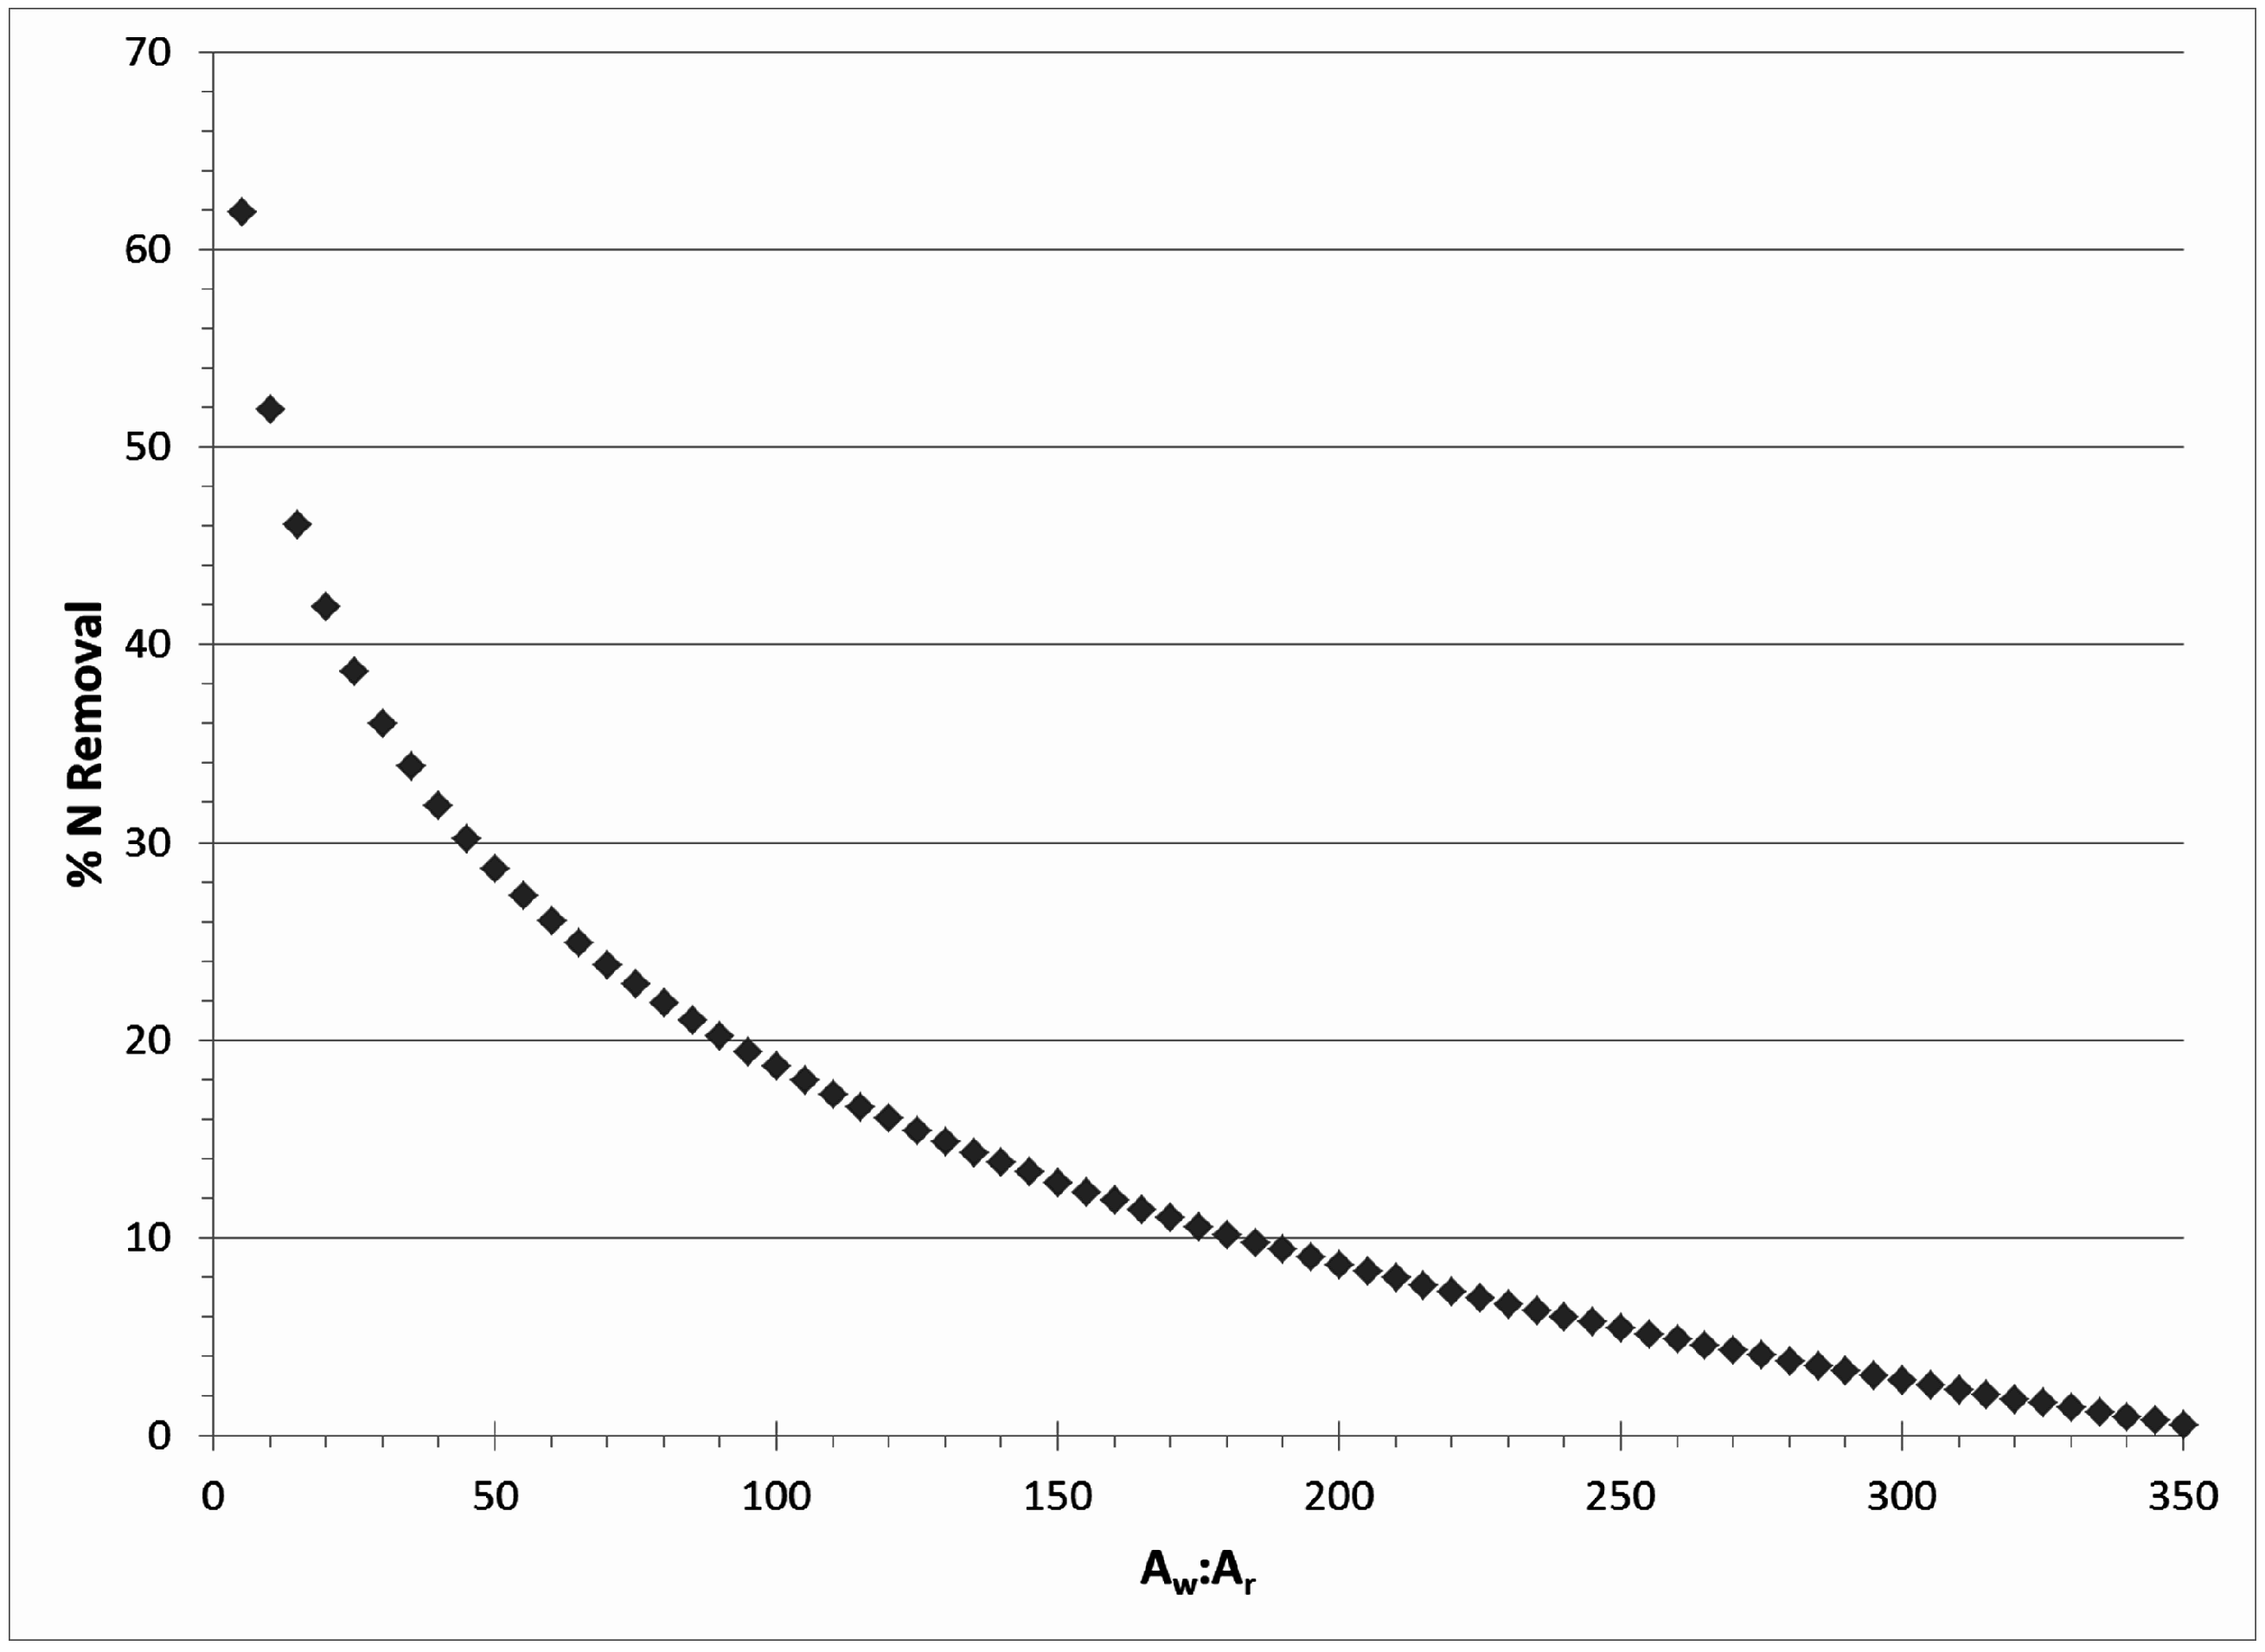
2.1. Assessing N Removal in Reservoirs

We used the geospatial approach developed by Kellogg et al. [25] to evaluate the potential for New England reservoirs to serve as locations of N removal. Kellogg et al. [25] used lake and reservoir N removal data compiled by Seitzinger et al. [17] to develop the following relationship between N removal and the ratio of reservoir depth to hydraulic residence time:
N Removal % = 79.24 − 33.26 × log10 (DT−1),
where D is the average reservoir depth (m) and T is the hydraulic residence time (year).
Data on reservoir depth and hydraulic residence time are not readily available for most reservoirs [7]. However, this equation can be translated into a relationship of N removal to a ratio of watershed area to reservoir area by taking advantage of the extensive record of area normalized flow records for a huge number of gaged watersheds across the United States [26].
To do this requires expressing depth (D) and hydraulic residence time (T) as follows:
D = VAr−1
T = VQyear−1,
where V is reservoir volume (km3), Ar is reservoir area (km2), and Qyear is discharge from the reservoir (km3·year−1). Equations (1)–(3) give information that negates the need to know either the depth or volume to estimate % N removal. Equation (1) shows that depth and residence time are inversely related. Thus, for a given reservoir area, as mean depth increases, the volume of the reservoir increases (Equation (2)) and the hydraulic residence time will increase in the same proportion (Equation (3)). The following equation expresses the relationship of DT−1 through the use of reservoir discharge and area:
D T 1 = V A r 1 V Q y e a r 1 × 1000   = Q y e a r A r 1 × 1000 .
One additional relationship then enables us to relate % N removal entirely with widely available geospatial and hydrologic data:
Qyear = 0.031536 × Aw Qnorm,
where Aw is the watershed area of the reservoir (km2), Qnorm is the estimated discharge normalized by watershed area (m3·s−1·km−2), and 0.031536 is used to convert from m3·s−1 to km3·year−1.
Combining Equations (3)–(5) then yields a relationship for DT−1 that can be substituted into Equation (1):
DT−1 = QyearAr−1 × 1000 = QnormAwAr−1 × 31.536.
To estimate % N removal provided by reservoirs, we used Equation (6) with a Qnorm value of 0.021 m3·s−1·km−2 for all dams with reservoirs (2915) denoted by the United State Geological Survey (USGS) NHDPLUSV2 data set for the study area (see Section 2.2 for details on reservoir identification). The selected Qnorm flow value represents the long term daily mean flow of USGS gaging data of 61 unaltered streams in southern New England. These streams are located from Southern NH and VT (at 43.154 N latitude) to Long Island Sound [27].
Although free flowing river reaches have been found to remove N, substantial travel distances are often needed to achieve suitable retention times, given the required combinations of velocity and depth associated with many free-flowing rivers [17,28,29]. Here, we focused on highly localized changes in N removal within a given reach due to the loss of a reservoir. We did not include all reservoirs with dams in our analyses of N removal associated with dams—we wish to differentiate reservoirs with marked changes in retention time from free-flow river systems. In addition, the empirical database we used to relate lake and reservoir properties to N removal did not include any sites with <10% removal [17]. We selected a lower threshold of 2.5% N removal for our analyses of N removal dams. Reservoirs with properties that generated less than 2.5% N removal—based on the relationship we used—could be part of river reaches that serve as important N sinks, but their removal may not make a marked change in N removal over the reach scale. Based on the results displayed in Figure 1, dams with Aw:Ar > 305 corresponded to N removal <2.5%. We focused further analyses on those dams (2206 out of 2915).

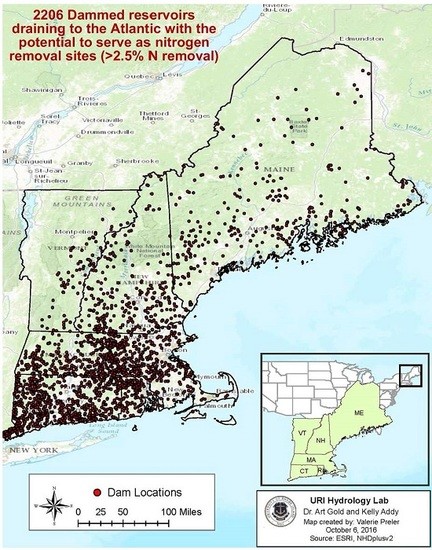
2.2. Assessing Dams and Associated Geospatial Data of Atlantic Watersheds in New England

We created a comprehensive geodatabase with multiple attributes associated with all known dams in New England. ArcGIS Version 10.3.1 [30] was used to perform all Geographic Information System (GIS) analyses. We obtained a comprehensive list of all known dams in New England from databases maintained by each of the six New England states (Table 1). These combined databases included the geospatial locations and hazard classifications for 14,291 dams—well in excess of the 4075 New England dams estimated from the 2013 U.S. Army Corps’ National Inventory of Dams (http://nid.usace.army.mil/cm_apex/f?p=838:1:0::NO), which focuses on dam safety [31]. We compiled these state-based databases into one feature class in a geodatabase.
USGS NHDPlusV2 [26] was then used to augment the attributes obtained from state-based databases on New England dams. Because the state-based point locations of the dams were obtained from different data sources than NHDPlusV2, we performed a “Snap” analysis within ArcGIS to align the data to the rivers (i.e., flowlines) within 60 m of each dam. Dams that were not within 60 m of the NHDPlusV2 flowlines were eliminated from the dataset. Martin and Apse [40] used a similar approach with a 100 m tolerance range to associate dams to the NHDPlus. We took a more conservative approach to minimize incorrectly identifying dams associated with small tributaries that might be adjacent to one of the streams depicted on the 100,000 scale hydrography.
Once we obtained the full set of dams associated with NHDPlusV2 flowlines, we used ArcGIS to perform a “Near” analysis using NHDPlusV2 data to determine if a reservoir identified by the NHDPlusV2 data was within 30 m of the dam. Dams without a reservoir within 30 m were eliminated from our geodatabase. Watersheds of each dam were delineated with National Hydrography Dataset USGS NHDPlusV2 Basin Delineator software (horizon-systems.com); watershed area was calculated for each watershed. For points that failed to process using Basin Delineator, we used ArcHydro version 1.4 tools in conjunction with ESRI’s ArcMap 10.2.2 geographic information system [30]. Watersheds were checked for accuracy using the NDHPlusV2 catchments. We also obtained pond area, stream order, USGS Hydrologic Unit Codes [38] and other attributes from NHDPlusV2 for each dam and its associated reservoir. This dataset was then manually curated to eliminate duplicate entries and sites with obvious anomalies, such as no recorded watershed area.
We focused our analyses on watersheds that drained directly to coastal estuaries along the Atlantic Coast. We therefore eliminated New England dams in watersheds that drain to Lake Champlain. Lake Champlain is a large (1127 km2) freshwater lake between New York and Vermont. Phosphorus loading, rather than N loading, is the focus of efforts to reduce eutrophication within this lake [42].
For these dams with reservoirs, we then incorporated dam-specific data on safety hazards, potential improvements to anadromous fish (i.e., fish that hatch and have a juvenile period in freshwater, but mature and migrate to the ocean) habitat and extant hydropower. We used ranking criteria from the Northeast Aquatic Connectivity Tool (NCAT) [40] to represent the ecological benefits to anadromous fish restoration that would be derived from eliminating the dam barrier and thus reconnecting aquatic habitats at the dam site. The tool creates a weighted metric based on a number of different habitat, hydrographic, connectivity and biotic attributes. Each dam in the database is grouped into one of 20 tiers (e.g., top 5%, 5%–10% of all dams), representing the relative benefits to anadromous fish restoration of eliminating the barrier relative to all dams in the Northeast U.S. In New England the ranking system is skewed towards rivers that drain to the Atlantic coast of the New England states. The NCAT tier information was incorporated into our dam geodatabase by joining the tables based on dam name, latitude and longitude. We were then able to search for dams within the highest tiers. Similarly, we identified dams with primary usage of hydropower from the NCAT database [40]. We also used the state-based data to identify the N removal dams that are classified as high or significant safety hazards [32,33,34,35,36,37].

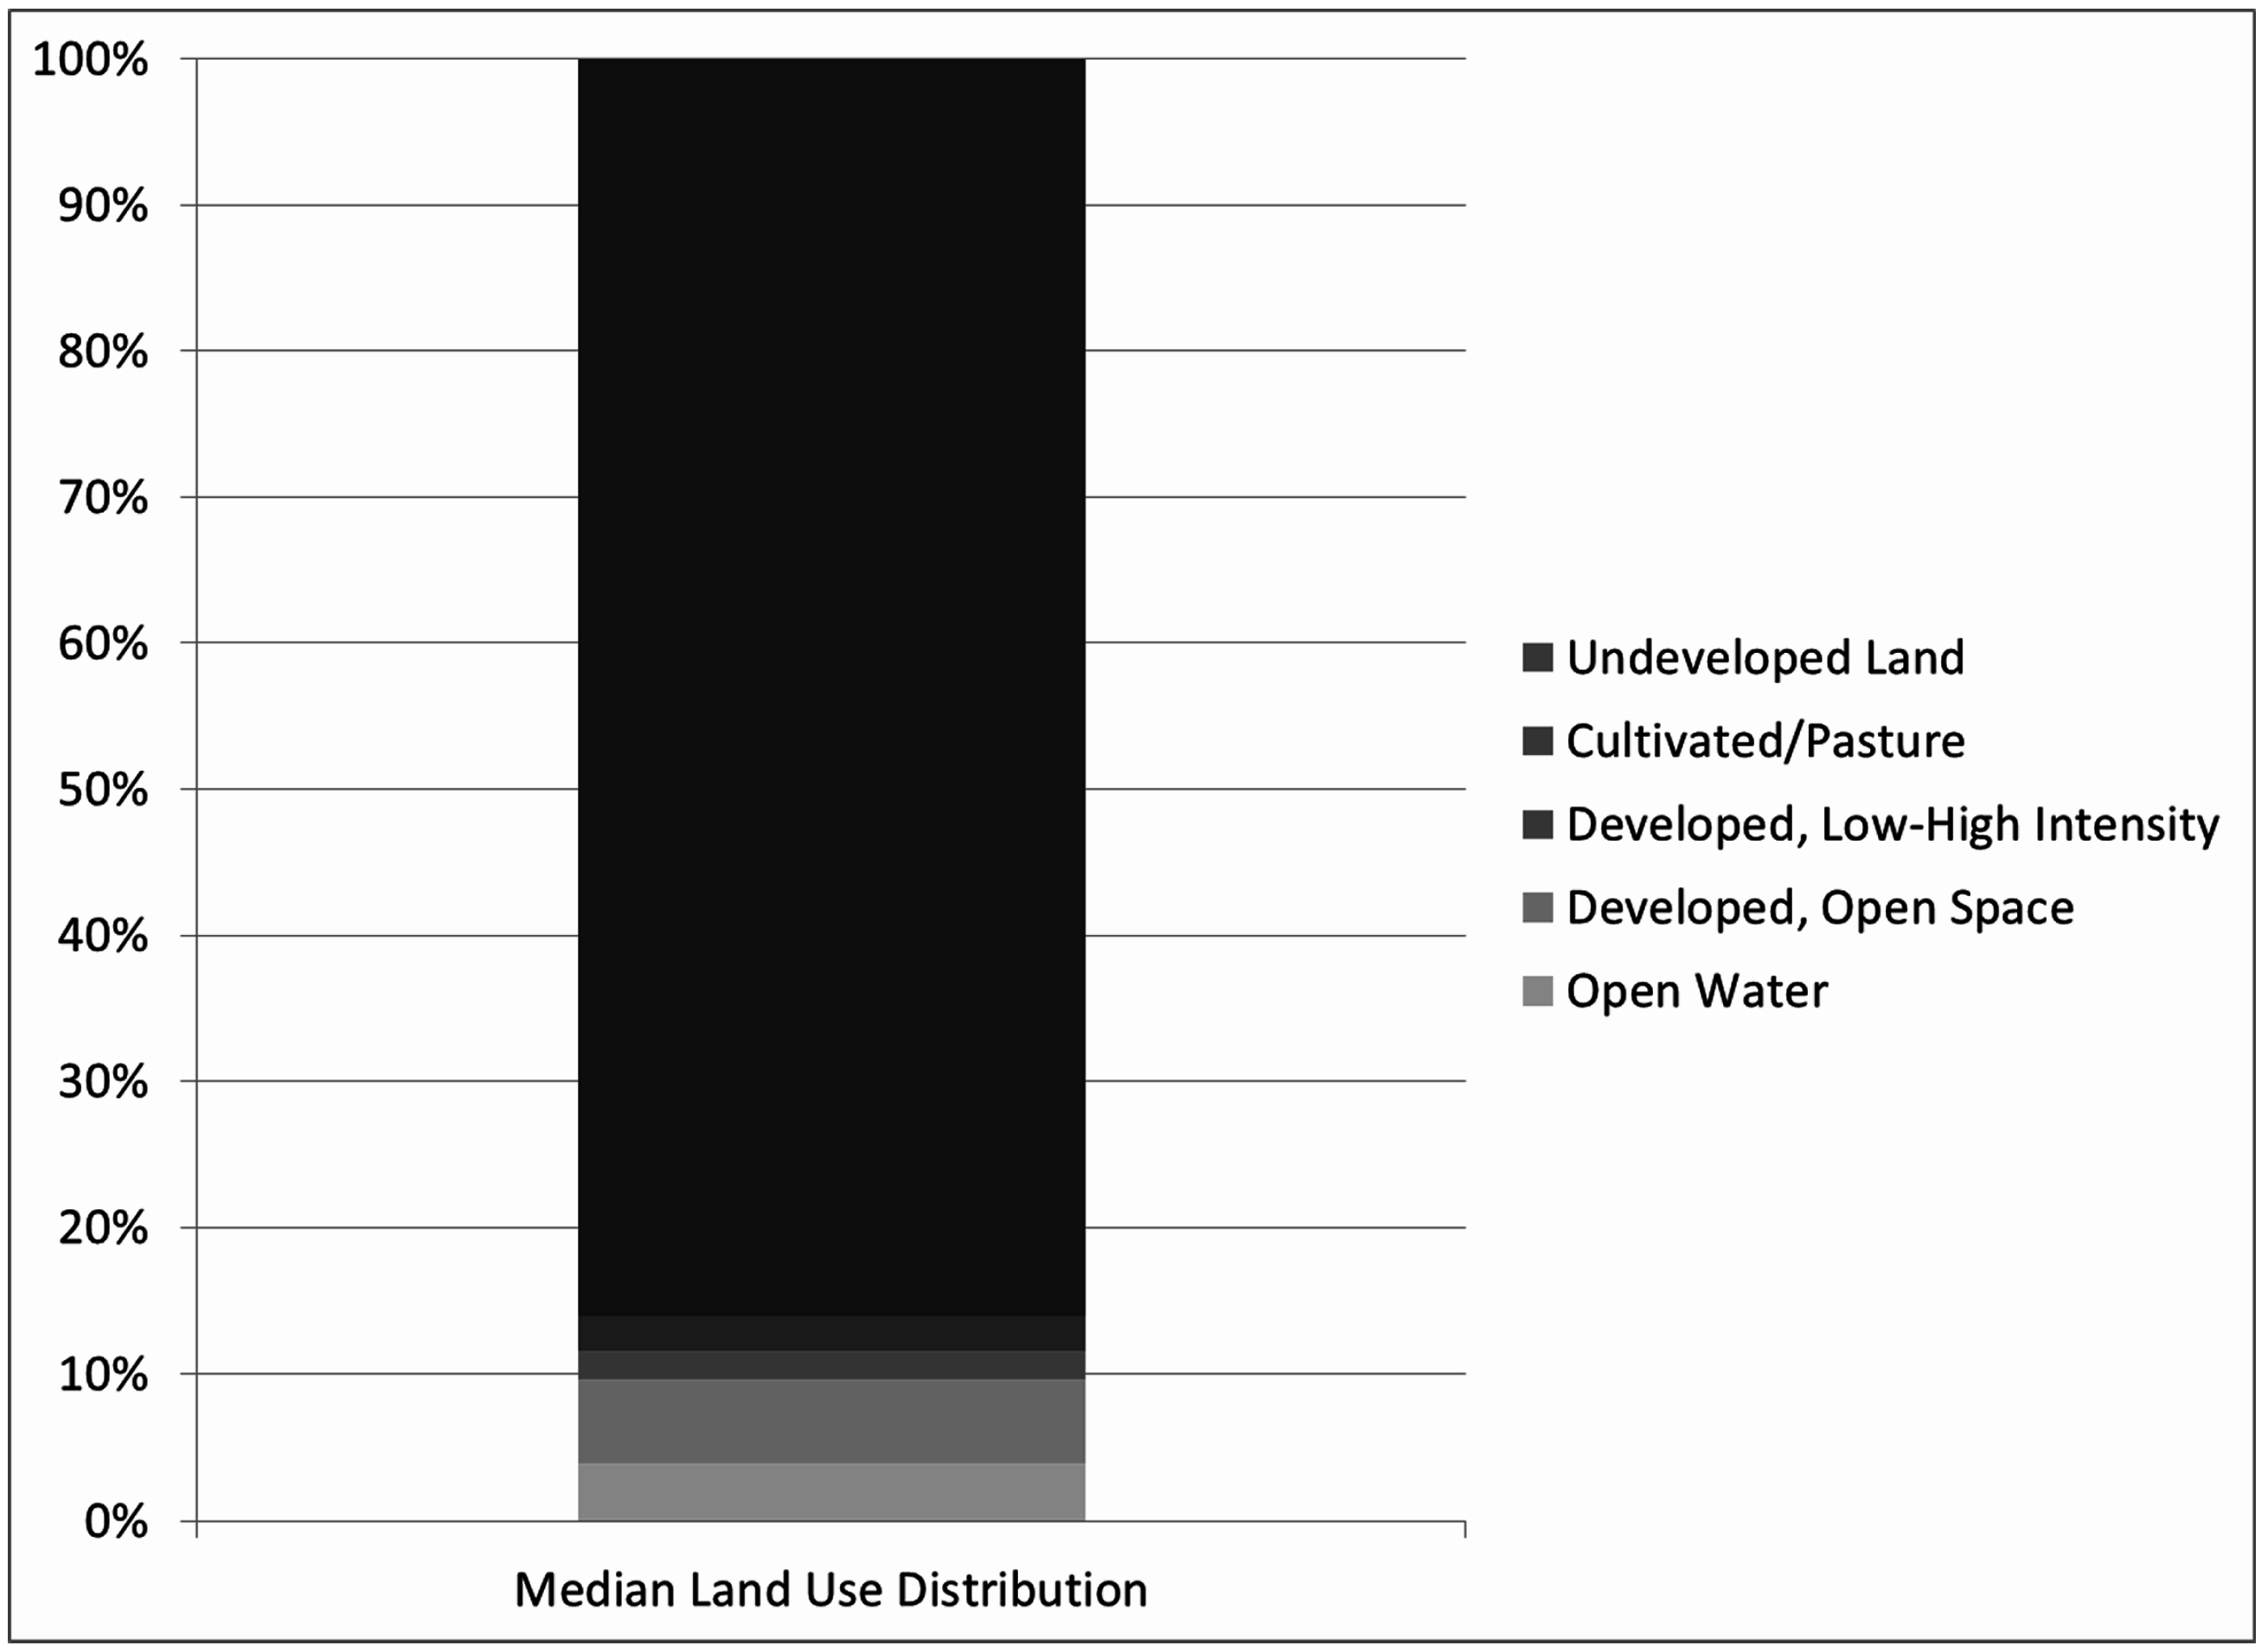
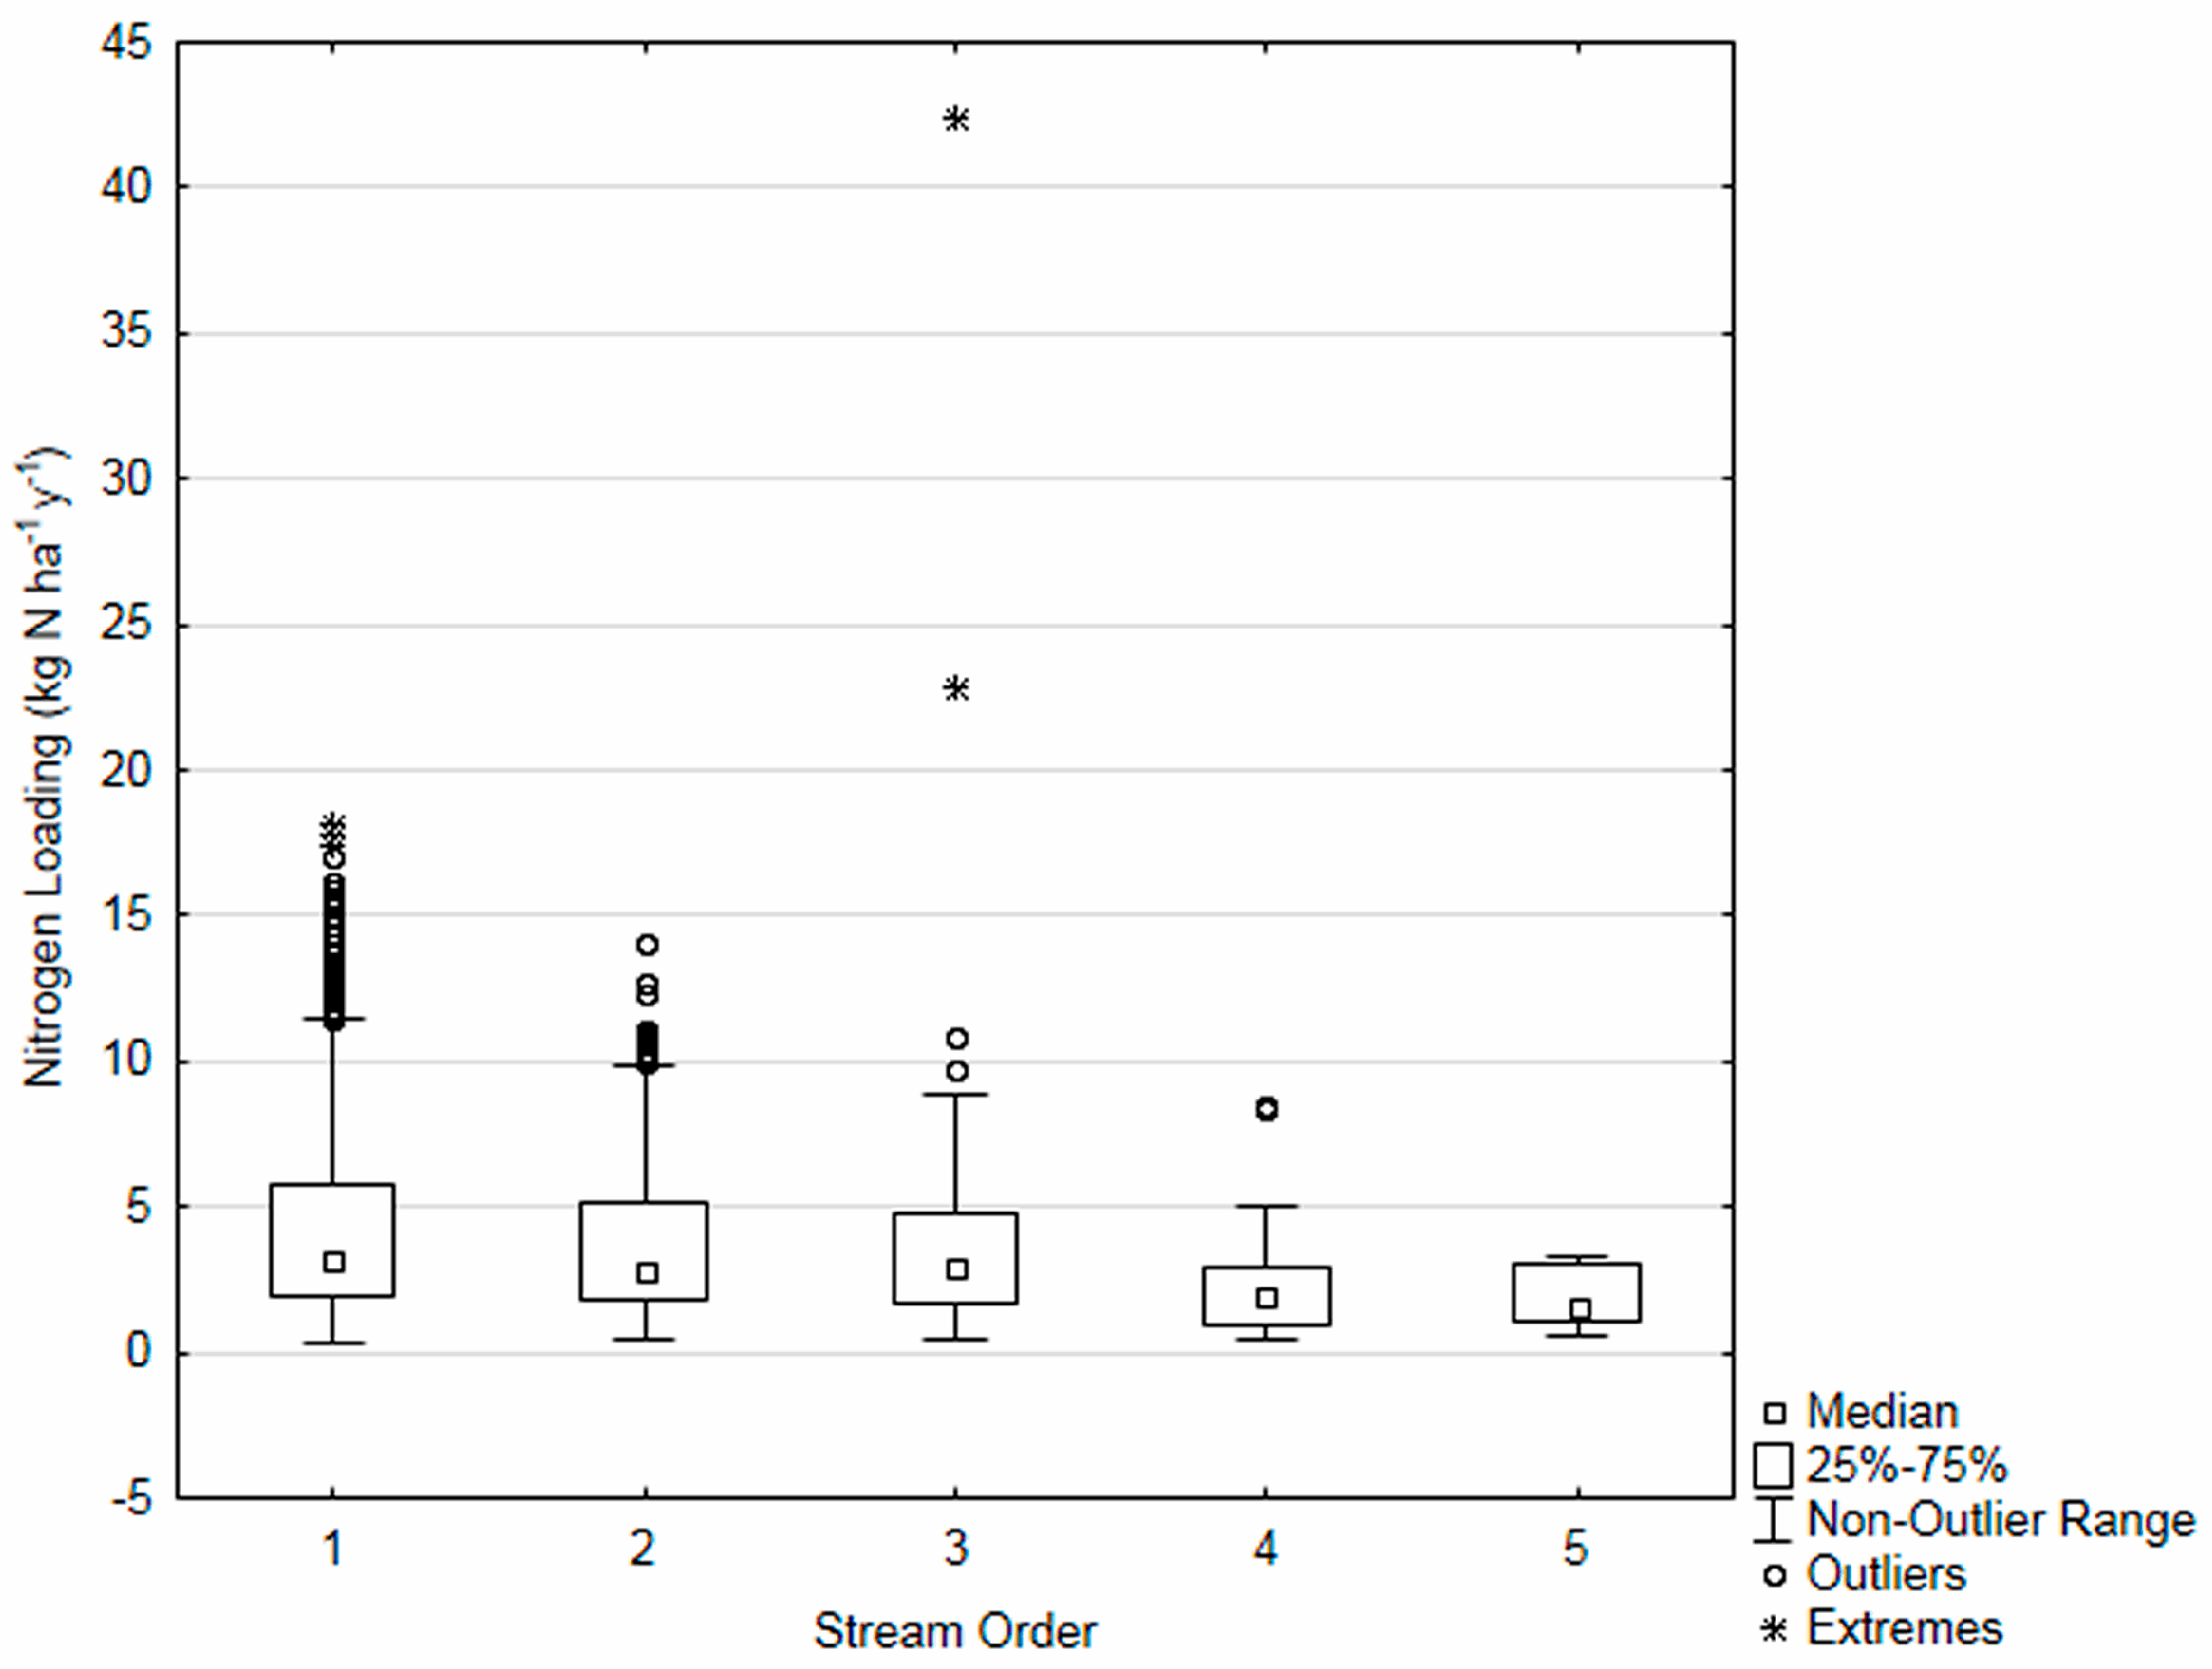
2.3. Estimating Nitrogen Loading to Dammed Reservoirs

We estimated N loading (kg N ha−1·year−1) to each reservoir. Details on the assumptions, attributes and N loading rates can be found in Table 2. For rural lands we used the Nitrogen Loading Model (NLM), with minor modifications, on the areas of each rural land use class in the reservoir watershed [43,44]. We obtained land use class areas from the National Land Cover Dataset (NLCD) using ArcMap 1.2.2 and the ArcMap add-on, Hawth’s Tool Geospatial Modeling Environment Tools [30]. NLM provides both N inputs and transport/retention coefficients to obtain loading to each reservoir [43] that were applied to all land use categories except for open water. Atmospheric N deposition on open water and non-residential impervious cover was not subject to retention [43]. The NLM recommended inputs were modified for lawn area at different residential densities [45] (Table 2). Inputs from atmospheric N deposition were based on wet and dry deposition for different subregions within New England [46]. For NLCD high density urban land use classes (e.g., Developed, medium and high intensity), we used N loading derived from urban runoff studies [47] (Table 2). We assumed that these developed areas relied on sewers and municipal wastewater treatment facilities [43] and added the N loading from municipal treatment facilities that discharged into the watershed of a reservoir when applicable [48] (Table 2). NLCD wetlands were not assigned N loading values as they are considered a N sink.
To determine the N loading from municipal treatment facilities, we searched the Environmental Protection Agency (EPA) Geospatial Data Access Project [41] for Non-point Source Discharge Elimination System (NPDES) program information that includes discharges from municipal wastewater facilities (https://www.epa.gov/enviro/geospatial-data-download-service (accessed on 21 August 2016) [41]). The geodatabase contains latitude and longitude of each facility, along with name, address, and program associated with the facility. We used the Geospatial Modelling Environment command “countpntsinpolys” to determine which dam watersheds contained municipal wastewater NPDES points. Once these watersheds were identified, we performed a Spatial Join Analysis in ArcGIS to select the individual points for further assessment of the location, type and amount of discharge at each facility. We estimated N loading for all municipal wastewater treatment systems that were found to discharge into the dammed reservoir watersheds from data found in EPA Region 1 NPDES permits (Publicly Owned Treatment Works General Permit (POTW GP); Available online: https://www3.epa.gov/region1/npdes/potw-gp.html accessed on 21–24 August 2016) [50]. Most of the wastewater treatment plants discharged secondary effluent into surface waters. We estimated N loading using data from Nixon [48] of annual per capita N loading from 17 secondary treatment facilities. Several wastewater treatment plants relied on lagoons (23% N removal) [51] followed by irrigation onto forest lands. In these cases, N inputs onto the irrigated forested lands were handled with the same transport/retention coefficients outlined for agricultural lands [43].

3. Results

A total of 14,291 of dams were compiled from the combined state-based datasets in watersheds of the six New England states. Within the New England wide dataset 7578 dams were associated with the NHDPlusV2 hydrographic river networks. Hereafter we use the value of 7578 as a basis of comparison when we examine the proportion of “New England dams” with different attributes.
Of the dams on NHDPlusV2 rivers, 2921 dams were associated with reservoirs identified on the NHDPlusV2 database. Of these, 2915 dams were within watersheds that drained to estuaries, bays and sounds of New England (i.e., were not tributaries to Lake Champlain). These 2915 locations will be referred to as “dammed reservoirs” throughout most of the paper.
When we took into account the % N removal attributed to these dammed reservoirs based on Equation (6), we identified 2206 of the dammed reservoirs draining to the Atlantic with the potential to serve as N removal sites (e.g., >2.5% N removal, based on Figure 1). These 2206 locations will be referred to as “N removal dams” throughout the paper. This represents approximately 29% of all New England dams.
These N removal dams are primarily located on lower-order streams (Figure 2); approximately 91% are located on either first or second order streams. As expected for lower-order streams, the cumulative watershed areas upstream of most of the N removal dams are relatively small (median: 3.3 km2; interquartile range: 6.3 km2) relative to the size of the watershed areas to the major New England estuaries (range: 1000 to 20,000 km2). The % N removal in N removal dams did not show a pronounced pattern with stream order (Figure 3).
Table 3 compares our results of reservoir N loading (kg N ha−1·year−1) normalized for watershed area to the results from 74 small, coastal watersheds in southern New England [43]. The watershed loading rates to the reservoirs in our study are substantially lower, due to the many reservoirs located in forested, undeveloped watersheds. Across all N removal dams, undeveloped land cover dominated (median: 86%) the watersheds (Figure 4)—these land covers generate N loading rates that are orders of magnitude lower than developed and agricultural lands found within the highly settled watersheds of southern New England. Nitrogen loading, normalized for watershed area, was highest in first order streams and declined with increasing stream order (Figure 5).
Based on the NCAT [40], 138 of N removal dams in watersheds draining to New England estuaries were rated in the upper decile of all Northeast dams based on their ecological value to anadromous fish restoration that would result from elimination of their barrier (Table 4). These 130 dams represent just 1.8% of New England dams. Dams deemed to be high priorities for barrier elimination, based on value to anadromous fish, constituted a larger proportion (e.g., >29%) of the dams on higher order streams (4th–5th order) than lower-order streams (Table 4). When examined for safety hazards, 662 N removal dams (8.7% of New England dams are classified by the New England States as high or significant safety hazards. Across a range of stream orders (small to large rivers) safety concerns ranged between 28% and 44%. The majority of N tradeoff dams (>65%) were located on relatively small 1st order streams, but only 3% of those dams are classified as high value for anadromous fish passage (Table 4).
Combining those data sets, a total of 763 N removal dams could be high priorities for removal or alterations due to their potential for improving anadromous fish values or addressing safety issues (note that removal of some dams will generate benefits for both improved safety and anadromous fish restoration), though dam removal could represent a loss of their capacity for N removal. These 763 N removal dams with high priorities for anadromous fish or safety, “N removal tradeoff dams,” represent 10% of New England dams.
Only 21 of the N removal dams are active hydropower sites (0.3% of New England dams) (Table 4). Where hydropower is extant, tradeoff analyses might consider the potential losses of both N removal and hydropower versus gains from anadromous fish or safety associated with dam removal.
Table 5 provides the number of N removal dams with potential tradeoffs for anadromous fish restoration, safety or hydropower in the watershed areas of major estuaries of New England. We have grouped these dams into the watersheds of different Atlantic estuaries in New England to foster attention to the receiving waters that may be influenced by changes in N load associated with any dam removal. The watersheds of Maine Coastal estuaries have the highest numbers of N removal tradeoff dams with values for anadromous fish restoration. The watersheds draining to Long Island Sound contain the largest numbers of N removal tradeoff dams where improved safety is a concern.

4. Discussion

4.1. Strategic vs. Opportunistic Views of N Tradeoff Dams

In our assessment of the value of reservoirs created by dams draining to New England estuaries, we demonstrated that lower-order streams had the highest number of dams that create changes in the river reach that can enhance N removal compared to an undammed state at the same location. Reservoirs with dams in lower order streams were more likely to create a substantial increase (compared to the free-flowing reach) in either depth or hydraulic residence time than those in larger order streams. Dammed reservoirs in higher order streams can generate substantial removal if the reservoir covers a large area. For example, David et al. [18] found 58% of total nitrate-N input was removed from a 4400 ha reservoir with a higher order, 273,000 ha watershed. David et al. [18] concluded that the increase in retention time generated by the creation of the reservoir was responsible for the large mass of N removed. The ratio of watershed area to reservoir area (Aw:Ar) was 62—a value in the range of elevated N removal in our model.
The number of these dams of interest to decision makers in New England becomes fairly limited if a “strategic” approach to dam removal is assumed to govern dam removal decisions. We selected two widely accepted values—reduction of safety hazards and improvements in anadromous fish habitat—to screen for locations where the benefits of dam removal need to be weighed against potential estuarine degradation due to increased N flux. If we were to assume that dam removal decisions were based solely on a strategic analyses that weighed tradeoffs using the specific regional and state data incorporated into our analyses (10% of New England dams), we would conclude that New England has only a small set and that dam removal tradeoffs primarily occur between N removal and reductions in safety hazards.
But, dam removal decisions do not necessarily follow this type of strategic approach. Magilligan et al. [53] found that “opportunistic” or “ad hoc” decision-making drove dam removal decisions in many of the 127 dams removed in New England over a 21 year period (1990–2011). Rather than emerging from a “top down” plan that focused investments in dam removal to gain the greatest benefits for safety, restoring anadromous fish passage or other societal values, dam removal frequently occurred because a particular dam owner was motivated by personal economic liabilities or specific environmental concerns. Other values such as improved connectivity that enhance resident fish habitat (e.g., trout) also influence dam removal decisions.
In those cases where dam removal might eliminate the N removal function from a particular reservoir, site specific analyses are warranted that focus on changes in the mass of N delivered to the downstream estuary—and the consequences of potential habitat degradation of the downstream coastal estuary. A number of approaches are under development to evaluate the susceptibility of estuaries to nutrient enrichment [10]. More specific analyses related to dam removal decisions should include (i) improved estimates of the mass of N delivered to downstream estuaries if the dam is removed and (ii) alternatives to dam removal that can retain the reservoir while enhancing fish passage and safety.
Given the thousands of watersheds assessed in this study we did not estimate retention of N through wetlands, riparian zones, lakes, beaver ponds and lower-order streams [15,21,23,54]. Instead, we followed the approach of Latimer and Charpentier [43] and used the terrestrial retention and transport coefficients of the NLM model that captures vegetative uptake, and denitrification and/or immobilization in soil, the vadose zone and groundwater aquifers. N inputs from terrestrial systems can be removed in aquatic N sinks upgradient of a given reservoir and the initial application of the NLM in the Waquoit Bay watershed estimated substantial N retention in the ponds upgradient of the estuary [44].
We note that the vast majority of N removal dams in our study were found on lower-order streams. Given the hierarchical, nested pattern of watersheds, reservoirs on higher order streams receive most their inputs from lower-order watersheds that serve as “pre-processing” units, resulting in N loading to higher order reservoirs that is markedly reduced compared to the loading we generated based on terrestrial inputs. In addition, a number of denitrification models of aquatic systems use first order kinetics to describe reaction rates with N loss proportional to N concentrations [16]. Since the area-normalized N loading (and resulting N concentrations) tend to be higher in lower-order (1st through 3rd order) reservoirs (Figure 5)—higher removal rates are expected within the lower-order reservoirs compared to the higher order reservoirs.
The approach used to value the N removal function of a given dam to a downstream estuary deserves consideration. For smaller estuaries, with limited drainage areas, the effect of eliminating a potential N removal dam could generate tangible alterations in the N flux and primary productivity. In larger estuaries, the N loading inputs to a reservoir is likely to comprise a minor proportion of the overall area (and N loading). This type of “cumulative effect” valuation may give little value to the N removal functions of any given reservoir. However, a different conclusion is likely to be reached if the N removal associated with the dam is compared to the costs associated with replacing that level of N removal through improvements in stream restoration, septic system technologies or agricultural practices [55,56,57]. Many of these abatement techniques can be costly. In addition, N removal dams constitute a targeted, verifiable practice—an advantage to the development of point/non-point nutrient trading arrangements [58]. Crumpton and Stenback [59] found that the creation of small reservoirs targeted to headwater streams draining cropland could reduce N flux substantially when Aw:Ar is <200. This contrasts to the high costs and uncertainty associated with many voluntary nonpoint abatement efforts that rely on locations of opportunity—rather than strategic locations where improved practices will generate the greatest effects on downstream delivery of pollution [60].

4.2. Fish Passage Designs to Minimize Tradeoffs between Dams and Connectivity?

In cases where the N removal functions of a particular reservoir are substantial, considerations of alternatives to complete dam removal may be warranted. We note that more than 90% of the N removal tradeoff dams are not priority locations for anadromous fish restoration, so alternatives other than complete removal might be sufficient to reduce the safety risks. In those N removal tradeoff dams where connectivity for fish restoration is particularly valuable, there are a growing number of options for fish passage that can sustain some portion of the reservoir, particularly for lower-order streams. Nature-like fish passage designs are now being used in New England on smaller dams with relatively low changes in elevation [61]. These designs typically sustain the reservoir level (and thus the retention time and depth). The dam is replaced by a long stream reach with a gradual slope and a series of weirs, notches and pools [62]. These passage ways typically encompass the entire stream width and use natural materials to create a range of habitats that are intended to encompass the capacities of multiple species and different life stages. Nature-like passage designs are not without problems. As with all fish passage measures, site-specific evaluations are required to minimize impediments to migration, particularly when low flow might impede attraction [63]. Turek et al. [64] have developed more advanced design guidelines for these nature-like passages based on the biometrics, swimming and leaping performance of anadromous fish species of Atlantic coastal rivers. Fish passage design is far from perfect, but this is an active area of research and in some cases may represent a means to sustain multiple functions [65].

4.3. Other Perspective on Tradeoffs for N Removal Dams

Magilligan et al. [53] note that dams with substantially larger watershed areas (>100 km2) accounted for nearly half of the dam removals in New England between 1990 and 2013. They argue for removal strategies that focus on a small set of dams with high potential to increase the availability of large tracts of high quality habitats—suggesting that dams with larger watershed areas may attract more attention for dam removal. Our results support these arguments. Most of the N removal dams are on lower-order streams and few lower-order dams have regional importance for improved anadromous fish passage. We found 38 N tradeoff dams that have watershed area >100 km2. Over half of the N tradeoff dams have largely undeveloped watersheds (>75% vegetated cover by area) and 86 of those dams are rated in the upper 10% of all Northeast dams for their potential for anadromous fish restoration if connectivity is restored. Thus, improved connectivity at these dam sites might permit access to extensive areas of pristine watershed conditions, potentially tipping the balance towards dam removal even though N removal is associated with the reservoir.
Our results may not fully capture anadromous fish values of N removal dams that drain to estuaries of local importance such as shallow coastal embayments or drowned-river valleys. These estuaries in New England serve as important nurseries and feeding habitat for fish and shellfish, but are very susceptible to degradation from N loading [11,66,67]. To illustrate the discrepancy between regional and local priorities, the state of Rhode Island (area approximately 3000 km2; Table S1) has only four N removal dams rated in the upper 10% for their regional importance to anadromous fish restoration at the scale of the Northeast U.S., an area >500,000 km2. However, only one of these four are under consideration (representing top-down decision making) for enhancements for migratory fish habitat (James Turek, Restoration Ecologist, U.S. National Oceanic and Atmospheric Administration Restoration Center, 26 June 2016). In addition, other dams that have small watersheds (<6 km2) on lower-order streams are local priorities even though they have a relatively limited amount of upstream functional habitat which partially accounts for their lower ranking at a regional scale [40]. However, the removal of barriers to fish passage at these dams still represent important habitat improvements in comparison to the other opportunities within the state of Rhode Island. Our approach of using a regional scale for strategic tradeoff analyses may not reflect the values of decision makers empowered to make these determinations. This argues for attention to local values and possible inclusion of additional N removal dams beyond the 736 N removal tradeoff dams we identified in our strategic analyses to ensure that the value of reservoirs for estuarine water quality protection are considered.

Supplementary Materials

The following are available online at www.mdpi.com/2073-4441/8/11/522/s1, Table S1: Nitrogen Removal Dams of Rhode Island: Attributes and Tradeoffs.

Acknowledgments

We thank Caroline Gottschalk Druschke and anonymous reviewers for insightful comments on drafts of this manuscript. We appreciate formatting work by students: Joseph Lofredo and Sarah Frazar with formatting and Valerie Preler with map generation. Support for this project was provided by the National Science Foundation’s Research Infrastructure Improvement NSF #IIA-1536071 and Multi-state Regional Hatch Project S-1063 (Contribution #5451 of the Rhode Island Agricultural Experiment Station).

Author Contributions

Arthur J. Gold and Kelly Addy conceived and designed the experiments; Alisa Morrison and Marissa Simpson generated the geodatabase and conducted GIS analyses; Kelly Addy analyzed the data; Arthur J. Gold and Kelly Addy wrote the paper.

Conflicts of Interest

The authors declare no conflict of interest.

Abbreviations:

The following abbreviations are used in this manuscript:
NNitrogen
DDepth
THydraulic Residence Time
VReservoir Volume
ArReservoir Area
QyearDischarge from Reservoir
AwWatershed Area
QnormDischarge Normalized by Area
HUCHydrologic Unit Code
MEMaine
NHNew Hampshire
MAMassachusetts
VTVermont
CTConnecticut
RIRhode Island
NCATNortheast Aquatic Connectivity Tool

References

  1. Stanley, E.H.; Doyle, M.W. Trading off: The ecological effects of dam removal. Front. Ecol. Environ. 2003, 1, 15–22. [Google Scholar] [CrossRef]
  2. Doyle, M.W.; Harbor, J.M.; Stanley, E.H. Toward policies and decision-making for dam removal. Environ. Manag. 2003, 31, 453–465. [Google Scholar] [CrossRef] [PubMed]
  3. Larinier, M. Dams and Fish Migration: World Commission on Dams; FAO Fisheries Technical Paper 419; Food and Agriculture Organization of the United Nations: Roma, Italy, 2000; pp. 45–89. [Google Scholar]
  4. Humborg, C.; Ittekkot, V.; Cociasu, A.; Bodungen, B.V. Effect of Danube River dam on Black Sea biogeochemistry and ecosystem structure. Nature 1997, 386, 385–388. [Google Scholar] [CrossRef]
  5. Pringle, C. What is hydrologic connectivity and why is it ecologically important? Hydrol. Process. 2003, 17, 2685–2689. [Google Scholar] [CrossRef]
  6. Erzini, K. Trends in NE Atlantic landings (southern Portugal): Identifying the relative importance of fisheries and environmental variables. Fish. Oceanogr. 2005, 14, 195–209. [Google Scholar] [CrossRef]
  7. Poff, N.L.; Hart, D.D. How dams vary and why it matters for the emerging science of dam removal. BioScience 2002, 52, 659–668. [Google Scholar] [CrossRef]
  8. Lejon, A.G.C.; Renöfält, B.M.; Nilsson, C. Conflicts associated with dam removal in Sweden. Ecol. Soc. 2009, 14, 2. [Google Scholar]
  9. Hart, D.D.; Johnson, T.E.; Bushaw-Newton, K.L.; Horwitz, R.J.; Bednarek, A.T.; Charles, D.F.; Kreeger, D.A.; Velinsky, D.J. Dam removal: Challenges and opportunities for ecological research and river restoration. BioScience 2002, 52, 669–682. [Google Scholar] [CrossRef]
  10. Howarth, R.W.; Anderson, D.M.; Church, T.M.; Greening, H.; Hopkinson, C.S.; Huber, W.C.; Marcus, N.; Naiman, R.J.; Segerson, K.; Sharpley, A.; et al. Clean Coastal Waters: Understanding and Reducing the Effects of Nutrient Pollution; National Academy Press: Washington, DC, USA, 2000. [Google Scholar]
  11. Nixon, S.W.; Buckley, B.; Granger, S.; Bintz, J. Responses of a very shallow marine ecosystem to nutrient enrichment. Hum. Ecol. Risk Assess. 2001, 7, 1457–1481. [Google Scholar] [CrossRef]
  12. Oviatt, C.A.; Gold, A.J.; Addiscott, T.M. Nitrate in coastal waters. In Nitrate, Agriculture, and the Environment; Addiscott, T.M., Ed.; Oxford University Press: New York, NY, USA, 2005; pp. 127–147. [Google Scholar]
  13. Howarth, R.W.; Billen, G.; Swaney, D.; Townsend, A.; Jaworski, N.; Lajtha, K.; Downing, J.A.; Elmgren, R.; Caraco, N.; Jordan, T.; et al. Regional nitrogen budgets and riverine N and P fluxes for the drainages to the North Atlantic Ocean: Natural and human influences. Biogeochemistry 1996, 35, 75–139. [Google Scholar] [CrossRef]
  14. Jordan, T.E.; Correll, D.L.; Weller, D.E. Effects of agriculture on discharge of nutrients from coastal plain watersheds of Chesapeake Bay. J. Environ. Qual. 1997, 26, 836–848. [Google Scholar] [CrossRef]
  15. Saunders, D.L.; Kalff, J. Nitrogen retention in wetlands, lakes and rivers. Hydrobiologia 2001, 443, 205–212. [Google Scholar] [CrossRef]
  16. Boyer, E.W.; Alexander, R.B.; Parton, W.J.; Li, C.; Butterbach-Bahl, K.; Donner, S.D.; Skaggs, R.W.; Del Grosso, S.J. Modeling denitrification in terrestrial and aquatic ecosystems at regional scales. Ecol. Appl. 2006, 16, 2123–2142. [Google Scholar] [CrossRef]
  17. Seitzinger, S.P.; Styles, R.V.; Boyer, E.W.; Alexander, R.B.; Billen, G.; Howarth, R.W.; Mayer, B.; Van Breemen, N. Nitrogen retention in rivers: Model development and application to watersheds in the northeastern USA. Biogeochemistry 2002, 57, 199–273. [Google Scholar] [CrossRef]
  18. David, M.B.; Wall, L.G.; Royer, T.V.; Tank, J.L. Denitrification and the nitrogen budget of a reservoir in an agricultural landscape. Ecol. Appl. 2006, 16, 2177–2190. [Google Scholar] [CrossRef]
  19. Bosch, N.S.; Allan, J.D. The influence of impoundments on nutrient budgets in two catchments of Southeastern Michigan. Biogeochemistry 2008, 87, 325–338. [Google Scholar] [CrossRef]
  20. Harrison, J.A.; Maranger, R.J.; Alexander, R.B.; Giblin, A.E.; Jacinthe, P.A.; Mayorga, E.; Seitzinger, S.P.; Sobota, D.J.; Wollheim, W.M. The regional and global significance of nitrogen removal in lakes and reservoirs. Biogeochemistry 2009, 93, 143–157. [Google Scholar] [CrossRef]
  21. Lazar, J.G.; Addy, K.; Gold, A.J.; Groffman, P.M.; McKinney, R.A.; Kellogg, D.Q. Beaver ponds: Resurgent nitrogen sinks for rural watersheds in the Northeast U.S.A. J. Environ. Qual. 2015, 44, 1684–1693. [Google Scholar] [CrossRef] [PubMed]
  22. Wolheim, W.M.; Vorosmarty, C.J.; Peterson, B.J.; Seitzinger, S.P.; Hopkinson, C.S. Relationship between river size and nutrient removal. Geophys. Res. Lett. 2006, 33, L06410. [Google Scholar] [CrossRef]
  23. Peterson, B.J.; Wollheim, W.M.; Mulholland, P.J.; Webster, J.R.; Meyer, J.L.; Tank, J.L.; Martí, E.; Bowden, W.B.; Valett, H.M.; Hershey, A.E.; et al. Control of nitrogen export from watersheds by headwater streams. Science 2001, 292, 86–90. [Google Scholar] [CrossRef] [PubMed]
  24. Tank, J.L.; Rosi-Marshall, E.J.; Baker, M.A.; Hall, R.O. Are rivers just big streams? A pulse method to quantify nitrogen demand in a large river. Ecology 2008, 89, 2935–2945. [Google Scholar] [CrossRef] [PubMed]
  25. Kellogg, D.Q.; Gold, A.J.; Cox, S.; Addy, K.; August, P.V. A geospatial approach for assessing denitrification sinks within lower-order catchments. Ecol. Eng. 2010, 36, 1596–1606. [Google Scholar] [CrossRef]
  26. United States Geological Survey (USGS). Water Data for the Nation. 2015. Available online: http://waterdata.usgs.gov/nwis/ (accessed on 20 December 2015). [Google Scholar]
  27. Armstrong, D.S.; Parker, G.W.; Richards, T.A. Characteristics and Classification of Least Altered Streamflows in Massachusetts; U.S. Geological Survey Scientific Investigations Report 2007-5291; U.S. Geological Survey: Reston, VA, USA, 2008; p. 64. Available online: http://pubs.usgs.gov/sir/2007/5291 (accessed on 27 June 2016).
  28. Allen, P.M.; Arnold, J.C.; Byars, B.W. Downstream channel geometry for use in planning-level models. J. Am. Water Res. Assoc. 1994, 30, 663–671. [Google Scholar] [CrossRef]
  29. Schulze, K.; Hunger, M.; Döll, P. Simulating river flow velocity on global scale. Adv. Geosci. 2005, 5, 133–136. [Google Scholar] [CrossRef]
  30. Environmental Systems Research Institute (ESRI). ArcGIS Desktop: Release 10; Environmental Systems Research Institute: Redlands, CA, USA, 2011. [Google Scholar]
  31. Graf, W.L. Dam nation: A geographic census of American dams and their large-scale hydrologic impacts. Water Resour. Res. 1999, 35, 1305–1311. [Google Scholar] [CrossRef]
  32. Rhode Island Geographic Information System (RIGIS). Rhode Island Dams; Environmental Data Center, University of Rhode Island: Kingston, RI, USA, 2001; Available online: http://www.rigis.org/data/dams (accessed on 15 December 2015).
  33. MassGIS. Massachusetts Dams; The Massachusetts Office of Dam Safety: West Boylston, MA, USA, 2012. Available online: http://www.mass.gov/anf/research-and-tech/it-serv-and-support/applicationserv/office-of-geographic-information-massgis/datalayers/dams.html (accessed on 15 December 2015).
  34. Connecticut Department of Energy & Environmental Protection (CT DEEP). Connecticut Dams; CT DEEP: Hartford, CT, USA, 1996. Available online: http://www.ct.gov/deep/cwp/view.asp?a=2698&q=322898&deepNav_GID=1707 (accessed on 15 December 2015).
  35. New Hampshire Granit (NH GRANIT). New Hampshire Dam Inventory; New Hampshire’s Statewide GIS Clearinghouse: Durham, NH, USA, 2015; Available online: http://www.granit.unh.edu/data/search?dset=damsnh (accessed on 15 December 2015).
  36. Vermont Center for Geographic Information (VCGI). Vermont Dam Inventory; Department of Environmental Conservation: Montpelier, VT, USA, 2009. Available online: http://vcgi.vermont.gov/opendata (accessed on 15 December 2015).
  37. Maine Office of GIS (MEGIS). Maine Impoundments and Dams; Maine Department of Environmental Protection: Augusta, ME, USA, 2006. Available online: http://www.maine.gov/megis/catalog/ (accessed on 15 December 2015).
  38. United States Department of Agriculture (USDA). 8 Digit Watershed Boundary Dataset; USDA/NRCS—National Geospatial Management Center: Reston, VA, USA, 2013. Available online: https://gdg.sc.egov.usda.gov/GDGOrder.aspx (accessed on 10 May 2016).
  39. Homer, C.G.; Dewitz, J.A.; Yang, L.; Jin, S.; Danielson, P.; Xian, G.; Coulston, J.; Herold, N.D.; Wickham, J.D.; Megown, K. Completion of the 2011 National Land Cover Database for the conterminous United States-Representing a decade of land cover change information. Photogramm. Eng. Remote Sens. 2015, 81, 345–354. Available online: http://www.mrlc.gov/nlcd2011.php (accessed on 18 March 2016). [Google Scholar]
  40. Martin, E.H.; Apse, C.D. Northeast Aquatic Connectivity: An Assessment of Dams on Northeastern Rivers; Eastern Freshwater Program; The Nature Conservancy: Bruswick, ME, USA, 2011; Available online: http://rcngrants.org/content/northeast-aquatic-connectivity (accessed on 24 May 2016).
  41. Environmental Protection Agency (EPA). Geospatical Data Access Project. Available online: https://www.epa.gov/enviro/geospatial-data-download-service (accessed on 21 August 2016).
  42. Stickney, M.; Hickey, C.; Hoerr, R. Lake Champlain basin program: Working together today for tomorrow. Lakes Reserv. Res. Manag. 2001, 6, 217–223. [Google Scholar] [CrossRef]
  43. Latimer, J.S.; Charpentier, M.A. Nitrogen inputs to seventy-four southern New England estuaries: Application of a watershed nitrogen loading model. Estuar. Coast. Shelf Sci. 2010, 89, 125–136. [Google Scholar] [CrossRef]
  44. Valiela, I.; Collins, G.; Kremer, J.; Lajtha, K.; Geist, M.; Seely, M.; Brawley, J.; Sham, C.H. Nitrogen loading from coastal watersheds to receiving estuaries: New method and application. Ecol. Appl. 1997, 7, 358–380. [Google Scholar] [CrossRef]
  45. Law, N.; Band, L.; Grove, M. Nitrogen input from residential lawn care practices in suburban watersheds in Baltimore County, MD. J. Environ. Plan. Manag. 2004, 47, 737–755. [Google Scholar] [CrossRef]
  46. Ollinger, S.V.; Aber, J.D.; Lovett, G.M.; Millham, S.E.; Lathrop, R.G.; Ellis, J.M. A spatial model of atmospheric deposition for the northeastern US. Ecol. Appl. 1993, 3, 459–472. [Google Scholar] [CrossRef] [PubMed]
  47. Shaver, E.; Horner, R.; Skupien, J.; May, C.; Ridley, G. Fundamentals of Urban Runoff Management, 2nd ed.; North American Lake Management Association: Madison, WI, USA, 2007; p. 327. [Google Scholar]
  48. Nixon, S.; Buckley, B.; Granger, S.; Harris, L.; Oxzkowski, A.; Cole, L.; Fulweiler, R. Anthropogenic Inputs to Narragansett Bay: A Twenty-Five Year Perspective; Narragansett Bay Commission and RI Sea Grant: Narragansett, RI, USA, 2005; p. 52. [Google Scholar]
  49. United States Department of Agriculture-Natural Resources Conservation Service (USDA-NRCS). Hydrologic soil-cover complexes, part 630 hydrology. In National Engineering Handbook; Natural Resources Conservation Service: Washington, DC, USA, 2004; p. 20. [Google Scholar]
  50. Environmental Protection Agency (EPA). Publicly Owned Treatment Works General Permit (POTW GP). Available online: https://www3.epa.gov/region1/npdes/potw-gp.html (accessed on 21–24 August 2016).
  51. Reed, S.C. Nitrogen Removal in wastewater stabilization ponds. J. Water Pollut. Control Fed. 1985, 57, 39–45. [Google Scholar]
  52. Seaber, P.R.; Kapinos, F.P.; Knapp, G.L. Hydrologic Unit Maps: U.S. Geological Survey Water Supply Paper 2294; U.S. Geological Survey: Reston, VA, USA, 1987.
  53. Magilligan, F.J.; Graber, B.E.; Nislow, K.H.; Chipman, J.W.; Sneddon, C.S.; Fox, C.A. River restoration by dam removal: Enhancing connectivity at watershed scales. Elementa 2016, 4, 000108. [Google Scholar] [CrossRef]
  54. Gold, A.J.; Groffman, P.M.; Addy, K.; Kellogg, D.Q.; Stolt, M.; Rosenblatt, A.E. Landscape attributes as controls on ground water nitrate removal capacity of riparian zones. J. Am. Water Resour. Assoc. 2001, 37, 1457–1464. [Google Scholar] [CrossRef]
  55. Oakley, S.M.; Gold, A.J.; Oczkowski, A.J. Nitrogen control through decentralized wastewater treatment: Process performance and alternative management strategies. Ecol. Eng. 2010, 36, 1520–1531. [Google Scholar] [CrossRef]
  56. Ribaudo, M.; Hansen, L.; Livingston, M.; Mosheim, R.; Williamson, J.; Delgado, J. Nitrogen in Agricultural Systems: Implications for Conservation Policy. 2011. Available online: https://ideas.repec.org/p/ags/uersrr/118022.html (accessed on 30 October 2016).
  57. Newcomer Johnson, T.A.; Kaushal, S.S.; Mayer, P.M.; Smith, R.M.; Sivirichi, G.M. Nutrient retention in restored streams and rivers: A global review and synthesis. Water 2016, 8, 116. [Google Scholar] [CrossRef]
  58. Ribaudo, M.; Abdalla, C.; Stephenson, K.; Wainger, L. Critical Issues in Implementing Nutrient Trading Programs in the Cheaspeake Bay Watershed; STAC Publication #14-002; STAC Publication: Edgewater, MD, USA, 2013. [Google Scholar]
  59. Crumpton, W.G.; Stenback, G.A. 2013 Annual Report on Performance of Iowa CREP Wetlands: Monitoring and Evaluation of Wetland Performance; Iowa Department of Agriculture and Land Stewardship: Des Moines, IA, USA, 2013; pp. 1–7.
  60. Kaufman, Z.; Abler, D.; Shortle, J.; Harper, J.; Hamlett, J.; Feather, P. Agricultural costs of the chesapeake bay total maximum daily load. Environ. Sci. Technol. 2014, 48, 14131–14138. [Google Scholar] [CrossRef] [PubMed]
  61. Franklin, A.E.; Haro, A.; Castro-Santos, T.; Noreika, J. Evaluation of nature-like and technical fishways for the passage of alewives at two coastal streams in New England. Trans. Am. Fish. Soc. 2012, 141, 624–637. [Google Scholar] [CrossRef]
  62. Roscoe, D.W.; Hinch, S.G. Effectiveness monitoring of fish passage facilities: Historical trends, geographic patterns and future directions. Fish Fish. 2010, 11, 12–33. [Google Scholar] [CrossRef]
  63. Bunt, C.M.; Castro-Santos, T.; Haro, A. Performance of fish passage structures at upstream barriers to migration. River Res. Appl. 2012, 28, 457–478. [Google Scholar] [CrossRef]
  64. Turek, J.; Haro, A.; Towler, B. Federal Interagency Nature-Like Fishway Passage Design Guidelines for Atlantic Coast Diadromous Fishes. 2016. Available online: http://www.habitat.noaa.gov/pdf/Final_Federal_Interagency_Technical_Memorandum_Fish_Passage_Guidelines.pdf (accessed on 30 October 2016). [Google Scholar]
  65. Katopodis, C. Developing a toolkit for fish passage, ecological flow management and fish habitat works. J. Hydraul. Res. 2005, 45, 451–467. [Google Scholar] [CrossRef]
  66. Roman, C.T.; Jaworski, N.; Short, F.T.; Findlay, S.; Warren, R.S. Estuaries of the northeastern United States: Habitat and land use signatures. Estuaries 2000, 23, 743–764. [Google Scholar] [CrossRef]
  67. Anthony, A.; Atwood, J.; August, P.V.; Byron, C.; Cobb, S.; Foster, C.; Fry, C.; Gold, A.; Hagos, K.; Heffner, L.; et al. Coastal lagoons and climate change: Ecological and social ramifications in the US Atlantic and Gulf coast ecosystems. Ecol. Soc. 2009, 14, 8. [Google Scholar]
Figure 1. Nitrogen removal (%) versus watershed area: reservoir area (Aw:Ar) based on Equation (6) and an area normalized flow rate (Qnorm) of 0.021 m3·s−1·km−2.
Water 08 00522 g001
Figure 2. Number of 2206 N removal dams draining to the Atlantic from New England distributed by stream order.
Water 08 00522 g002
Figure 3. Nitrogen removal (%) of the 2206 N removal dams draining to the Atlantic from New England distributed by stream order. Outliers are values >1.5 times the interquartile range.
Water 08 00522 g003
Figure 4. Median land use distribution across 2206 N removal dams draining to the Atlantic from New England.
Water 08 00522 g004
Figure 5. Watershed nitrogen loading from the watersheds of the 2206 N removal dams draining to the Atlantic from New England. Outliers are defined as values >1.5 times the interquartile range. Extremes are defined as values >3 times the interquartile range. Note that two extremes were removed for viewing clarity (513.5 and 207.2 kg N ha−1·year−1 respectively for stream order 1 and 2, respectively).
Water 08 00522 g005
Table 1. New England Dam and Geospatial Data Source Information.
Data LayerSource
Rhode Island Dams DatasetRhode Island Geographic Information System (RIGIS). Available online: http://www.rigis.org/data/dams (accessed on 15 December 2015) [32].
Massachusetts Dams DatasetThe Massachusetts Office of Dam Safety. MassGIS Data. Available online: http://www.mass.gov/anf/research-and-tech/it-serv-and-support/application-serv/office-of-geographic-information-massgis/datalayers/dams.html (accessed on 15 December 2015) [33].
Connecticut Dams DatasetConnecticut Department of Energy & Environmental Protection. Available online: http://www.ct.gov/deep/cwp/view.asp?a=2698&q=322898&deepNav_GID=1707 (accessed on 15 December 2015) [34].
New Hampshire Dam InventoryNew Hampshire Granit: New Hampshire’s Statewide GIS Clearinghouse. Available online: http://www.granit.unh.edu/data/search?dset=damsnh (accessed on 15 December 2015) [35].
Vermont Dam InventoryVermont Center for Geographic Information (VCGI), Department of Environmental Conservation. Available online: http://vcgi.vermont.gov/opendata (accessed on 15 December 2015) [36].
Maine Dam DatasetMaine Office of Geographic Information Systems (MEGIS). Maine Office of GIS Data Catalog. Maine Impoundments and dams. Available online: http://www.maine.gov/megis/catalog/ (accessed on 15 December 2015) [37]
NHDPlusV2USGS. Available online: http://waterdata.usgs.gov/nwis/ (accessed on 20 December 2015) [26]
HUC-8 WBDUSGS and USDA-NRCS. Geospatial Data Gateway. Available online: https://gdg.sc.egov.usda.gov/GDGOrder.aspx (accessed on 10 May 2016) [38].
NLCDNational Land Cover Database, 2011. Available online: http://www.mrlc.gov/nlcd2011.php (accessed on 18 March 2016) [39].
NCATNortheast Aquatic Connectivity. Available online: http://rcngrants.org/content/northeast-aquatic-connectivity (accessed on 24 May 2016) [40].
NPDESEPA Geospatial Data Access Project. Available online: https://www.epa.gov/enviro/geospatial-data-download-service (accessed on 21 August 2016) [41].
Table 2. Assumptions and rates for watershed nitrogen computations to reservoirs.
A. Characteristics and Assumptions of Rural Residential Land Use Categories
Land Use [39]Impervious Surface [39]Home Density [49]Lawn Area [45]Homes That Fertilize [43]Lawn N Applied [43]Persons per Home [43]Septic N Load per Person [43]
%ha−1%%kg N ha−1·Year−1 kg N Year−1
Developed, Open Space101.225341042.44.8
Developed, Low Intensity359.915341042.44.8
B. Characteristics and Assumptions of Non-Rural Land Use Categories
Land Use [39]Urban Runoff N Loading [47]Municipal Wastewater N Loading, Where Applicable [48]Field N Applied [43]
kg N ha−1·Year−1
Developed, Medium Intensity7.04.1-
Developed, High Intensity11.04.1-
Pasture/Cultivated Crops--136.0
Table 3. Comparison of nitrogen loading rates for selected New England estuaries [43] to this study’s watershed nitrogen loading rates of 2206 N removal dams draining to the Atlantic from New England.
Summary StatisticsLatimer and Charpentier [43] kg N ha−1·Year−1This Study kg N ha−1·Year−1
Number of watersheds742206
Minimum3.10.4
10th percentile5.61.2
25th percentile7.01.9
Median12.03.0
75th percentile19.05.5
90th percentile31.08.5
Maximum155.0513.5
Mean19.04.4
Table 4. Number (%) of N removal dams within different tradeoff categories by stream order.
Stream Order# Dams with Safety Concerns # Dams with High Priority Fish Habitat # Dams with Safety Concerns or High Priority for Fish Habitat # Dams with Safety Concerns and High Priority for Fish Habitat # Dams with Extant Hydropower §
1439 (28%)43 (3%)468 (31%)12 (<1%)4 (<1%)
2151 (32%)51 (11%)191 (41%)11 (2%)7 (1%)
354 (34%)31 (20%)77 (49%)8 (5%)4 (3%)
4 & 520 (44%)13 (29%)27 (60%)6 (13%)6 (13%)
Total6421387633721
Notes: Dams designated as high or significant safety risk by their State [32,33,34,35,36,37]; Dams designated among the top 10% in New England according to the NCAT [40] for improving anadromous fish restoration by dam removal; § Identified in the NCAT [40] with the primary usage of hydropower.
Table 5. Number of N removal dams in the drainage networks of different New England estuaries with values for anadromous fish restoration or safety concerns.
EstuaryUSGS HUC αState(s)# Dams with Safety Concerns # Dams with High Priority Fish Habitat # Dams with Safety Concerns and High Priority for Fish Habitat # Dams with Extant Hydropower §
St. John River010100ME1710
Penobscot River010200ME41621
Kennebec River010300ME161441
Androscoggin River010400ME, NH5310
Maine Coastal010500ME134040
Saco River010600ME, NH, MA251640
Merrimack River010700NH, MA76518
Connecticut River0108NH, VT, MA, CT166822
Charles River01090001MA28530
Cape Cod01090002MA, RI291250
Blackstone River01090003MA, RI27002
Narragansett Bay01090004MA, RI44541
Pawcatuck-Wood River01090005CT, RI14110
Long Island Sound (excluding Connecticut River)0110MA, CT, RI214856
Notes: α HUC: Hydrologic Unit Code [52]; Dams designated as high or significant safety risk by their State; Dams designated among the top 10% in New England according to the NCAT [40] for improving anadromous fish restoration by dam removal; § Identified in the NCAT [40] with the primary usage of hydropower.

