Article

A Simple and Robust Method for Simultaneous Consideration of Overland and Underground Space in Urban Flood Modeling

1
National Disaster Management Research Institute, 365 Jongga-ro, Ulsan 44538, Korea
2
Disaster Prevention Research Institute, Kyungpook National University, 80 Daehak-ro, Buk-gu Daegu 41566, Korea
3
Department of Civil Engineering, Kyungpook National University, 80 Daehak-ro, Buk-gu Daegu 41566, Korea
*
Author to whom correspondence should be addressed.
Water 2016, 8(11), 494; https://doi.org/10.3390/w8110494
Submission received: 2 August 2016 / Revised: 4 October 2016 / Accepted: 24 October 2016 / Published: 1 November 2016
(This article belongs to the Special Issue Urban Drainage and Urban Stormwater Management)

Abstract

:
This study proposed two methods, boundary-type and pond-type, to link overland and underground space in urban flood modeling. The boundary-type treats the exit of underground space as an interface for inflow of floodwater by imposing open boundary condition and pond-type considers underground space as an underground pond by configuring pond terrain. The effect of underground space in urban flood inundation was examined by coupling one-dimensional (1D) stormwater management model (SWMM) and two-dimensional (2D) overland flood model. The models were applied to the Hyoja drainage basin, Seoul, Korea where urban flood occurred due to heavy rainfall in 21 September 2010. The conduit roughness coefficient of SWMM was calibrated to minimize the difference between observed and predicted water depth of pipe. In addition, the surface roughness coefficient of 2D model was calibrated by comparing observed and predicted flood extent. Then, urban flood analysis was performed on three different scenarios involving a case not considering underground (Case 1) and cases considering underground, boundary-type (Case 2) and pond-type (Case 3). The simulation results have shown that the boundary-type is simple but robust method with high computational efficiency to link overland and underground space in urban flood modeling.

1. Introduction

Rapid industrialization and urbanization has brought about an increase in population, industrial facilities, and transportation, which require building space utilization advancement and space layout planning for efficient utilization of overland space. Nonetheless, the lack of overland due to the expanding urbanization has led a variety of types of underground developments, such as underground roads, underground shops, subways, underground culverts, or substation for space utilization advancement, which has created highly complex combinations of overland and underground in urban areas. In recent years, the occurrence frequency of effective rainfall that exceeds design capacity of storm water drainage systems has increased due to the climate change and local heavy rainfall, resulting in flooding in overland and underground spaces.
1D/1D or 1D/2D coupled urban flood analysis models have emerged to assess the hydraulic performance of sewer network flow and overland flow simultaneously. 1D/1D models were developed and improved significantly [1,2], and studied for modeling approaches and real-time application about overland flooding modeling [3,4,5]. Mark et al. [1] and Leandro et al. [6] suggested the potentials and drawbacks of each model for urban flood modeling through extensive comparison of 1D/1D and 1D/2D models. Recently, 1D/2D models are becoming popular with the development of modeling techniques and the improvement of computer performance [7] despite the drawback of 2D overland model requiring considerable computational efforts including long simulation time. The resolution of topographic data is one of the most critical factors for accuracy of 2D overland model in urban inundation analysis [8,9]. That is, the accuracy of the urban inundation analysis is dependent on how well the real topography is considered. There have been numerous studies on the effect of urban topography including building. Shoji and Mikio [10] investigated the effect of building arrangement on the flood wave through the hydraulic model experiment. Mirei and Juichiro [11] investigated the behavior of 2D flood flows and the hydrodynamic force acting on structures through numerical model simulation and experiment. Alcrudo [12] studied mathematical modeling techniques to represent water depth and velocity in the vicinity and around buildings. In recent years, a number of studies of topographic data utilizing higher, more sophisticated resolution such as Light Detection And Ranging (LiDAR) and Digital Surface Model (DSM) have been conducted in order to calculate direction and pattern of flood flow in roads or around buildings [13,14,15,16,17,18]. However, 2D flood inundation modeling using a fine grid with high-resolution topography requires considerable computational time, thus the computational efficiency of 2D flood modeling is one of the challenges [19]. This problem has led to several methodologies to improve the performance of 2D urban flood modeling such as sub-grid method [20,21], 2D storage model with bilinear gridding technique [22], multi-layered coarse grid modeling [19], porosity shallow water model [20,21,22,23,24,25,26,27,28] and LiDAR filtering algorithm [29,30].
Most studies on urban flood modeling including the aforementioned studies did not consider floodwaters flowed into the underground space from the overland. That is, most studies on urban flood have been conducted by considering overland and underground space independently; few studies have been conducted on the analysis of the effect of the presence of underground space on urban flood considering the link between overland and underground spaces.
This study proposed two methods, boundary-type and pond-type, to link the overland and underground spaces in the urban flood modeling using the 2D flood model. The methods have been applied to examine the effect of underground spaces on flood characteristics including flood depth, area, and velocity of overland floodwaters in the urban flood modeling. To achieve this, the 1D SWMM and 2D overland flood models have been applied to the Hyoja drainage basin of Seoul where urban flooding occurred in 21 September 2010. The manhole overflow predicted from the SWMM was employed as forcing data in the 2D overland flood model. The accuracy and computational efficiency of the proposed methods were examined by comparing measured flood extent and depth and predictions, and computation time between models.

2. Methods

2D flood inundation model was coupled with 1D SWMM to account for rainfall–runoff, pipe flow, surcharged overflow at manhole, flood flow entered into underground space, and overland flow on the street in urban area. The 1D SWMM simulates rainfall–runoff, sewer network and sewer overflow, and 2D flood inundation model accounts for overland flow caused by manholes and floodwater flowed into underground space.

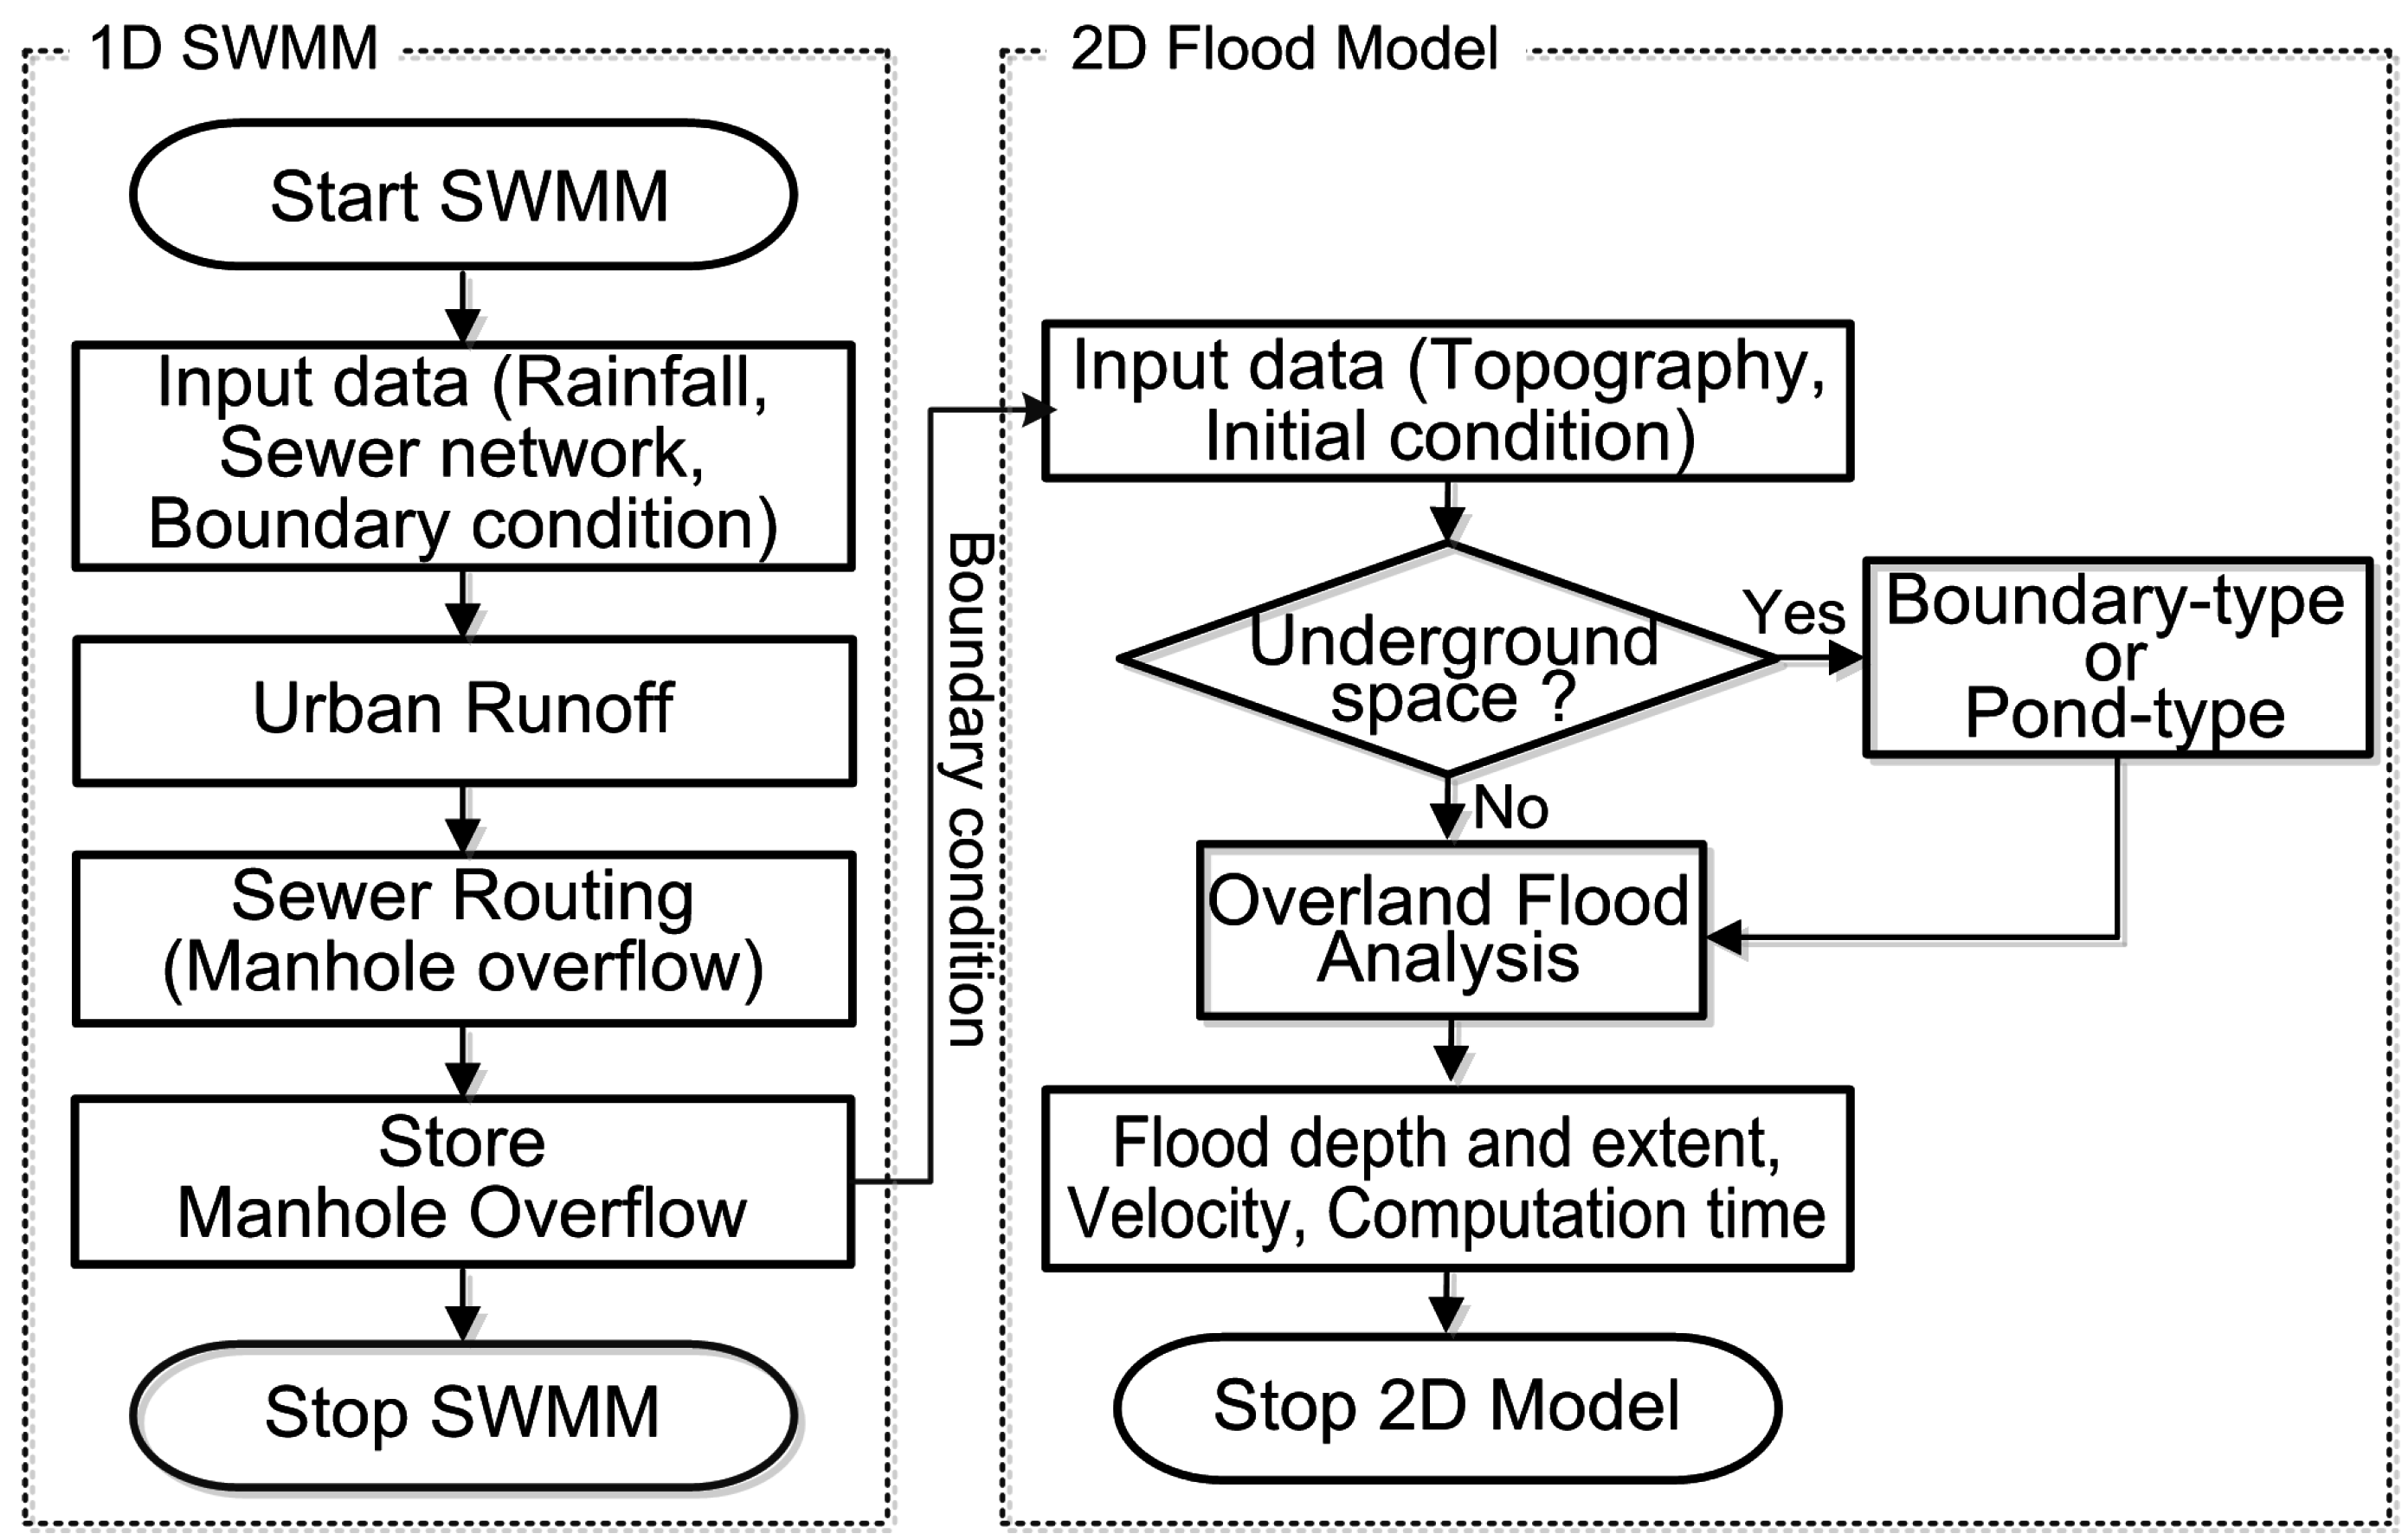
2.1. Urban Flood Inundation Model

The causes of urban inundation are topographically low lands, poor drainage due to an increase of water level in the river, road surface drainage due to sewage backwater, lack of capacity or failure of pumps, and lack of drainage capacity of sewer system. In Korea, 25% of urban flooding is due to a lack of drainage capacity of sewer system [31]. In recent years, urban flooding has increased due to abnormal climate activity and local heavy rainfalls that exceed the design frequency of conveyance capacity in the urban drainage system.
In this study, the overflows at the manhole due to exceeding pipe capacity were calculated through rainfall–runoff analysis with SWMM which is a 1D dynamic urban storm sewer system analysis model. Then, an urban flood analysis was conducted by utilizing the manhole overflows as boundary conditions in the 2D overland flood model. The linkage process between 1D SWMM and 2D overland flood model applied in this study is shown in Figure 1.
Overflows at the manholes due to the surcharge in the urban drainage system cause overland flood inundation; some of them flow into underground, and thereby inundate the underground space. In this study, the 2D Godunov-type flood model [32] was applied to perform the linkage with overland flooding and inflow into underground space due to manhole overflows. The 2D flood model is based on shallow water equations and can be represented as a vector type as shown in Equation (1).
U t + F ( U ) x + G ( U ) y = S ( U ) + Q ( U ) ,
where U is a physical vector consisting of conservation variables; F ( U ) and G ( U ) are the fluxes in the x and y directions, respectively; S ( U ) is a source term; and Q ( U ) is a term that connects the SWMM and 2D overland flood model. In this study, urban flood inundation analysis was conducted by inputting the overflow calculated from SWMM to the 2D flood model through Q ( U ) .
In this study, the following two-step time frictional scheme was applied to calculate conservation variables U i in the mesh center at n + 1 time. In the first step ( n and n ), fluxes F ( U ) and G ( U ) are considered (Equation (2)), and in the second step ( n and n + 1 ), U i n , S ( U ) , and Q ( U ) are considered, thereby calculating conservation variables at the n + 1 time (Equation (3)).
U i n = U i n Δ t A i ( k = 1 N i ( F n G n ) k n   L i , k ) ,
U i n + 1 = U i n Δ t A i ( S + Q ) i n ,
where A i and N i are area of mesh ( i ) and the number of interfaces in the mesh, respectively, and L i , k is a length of the k-th interface in the mesh ( i ).

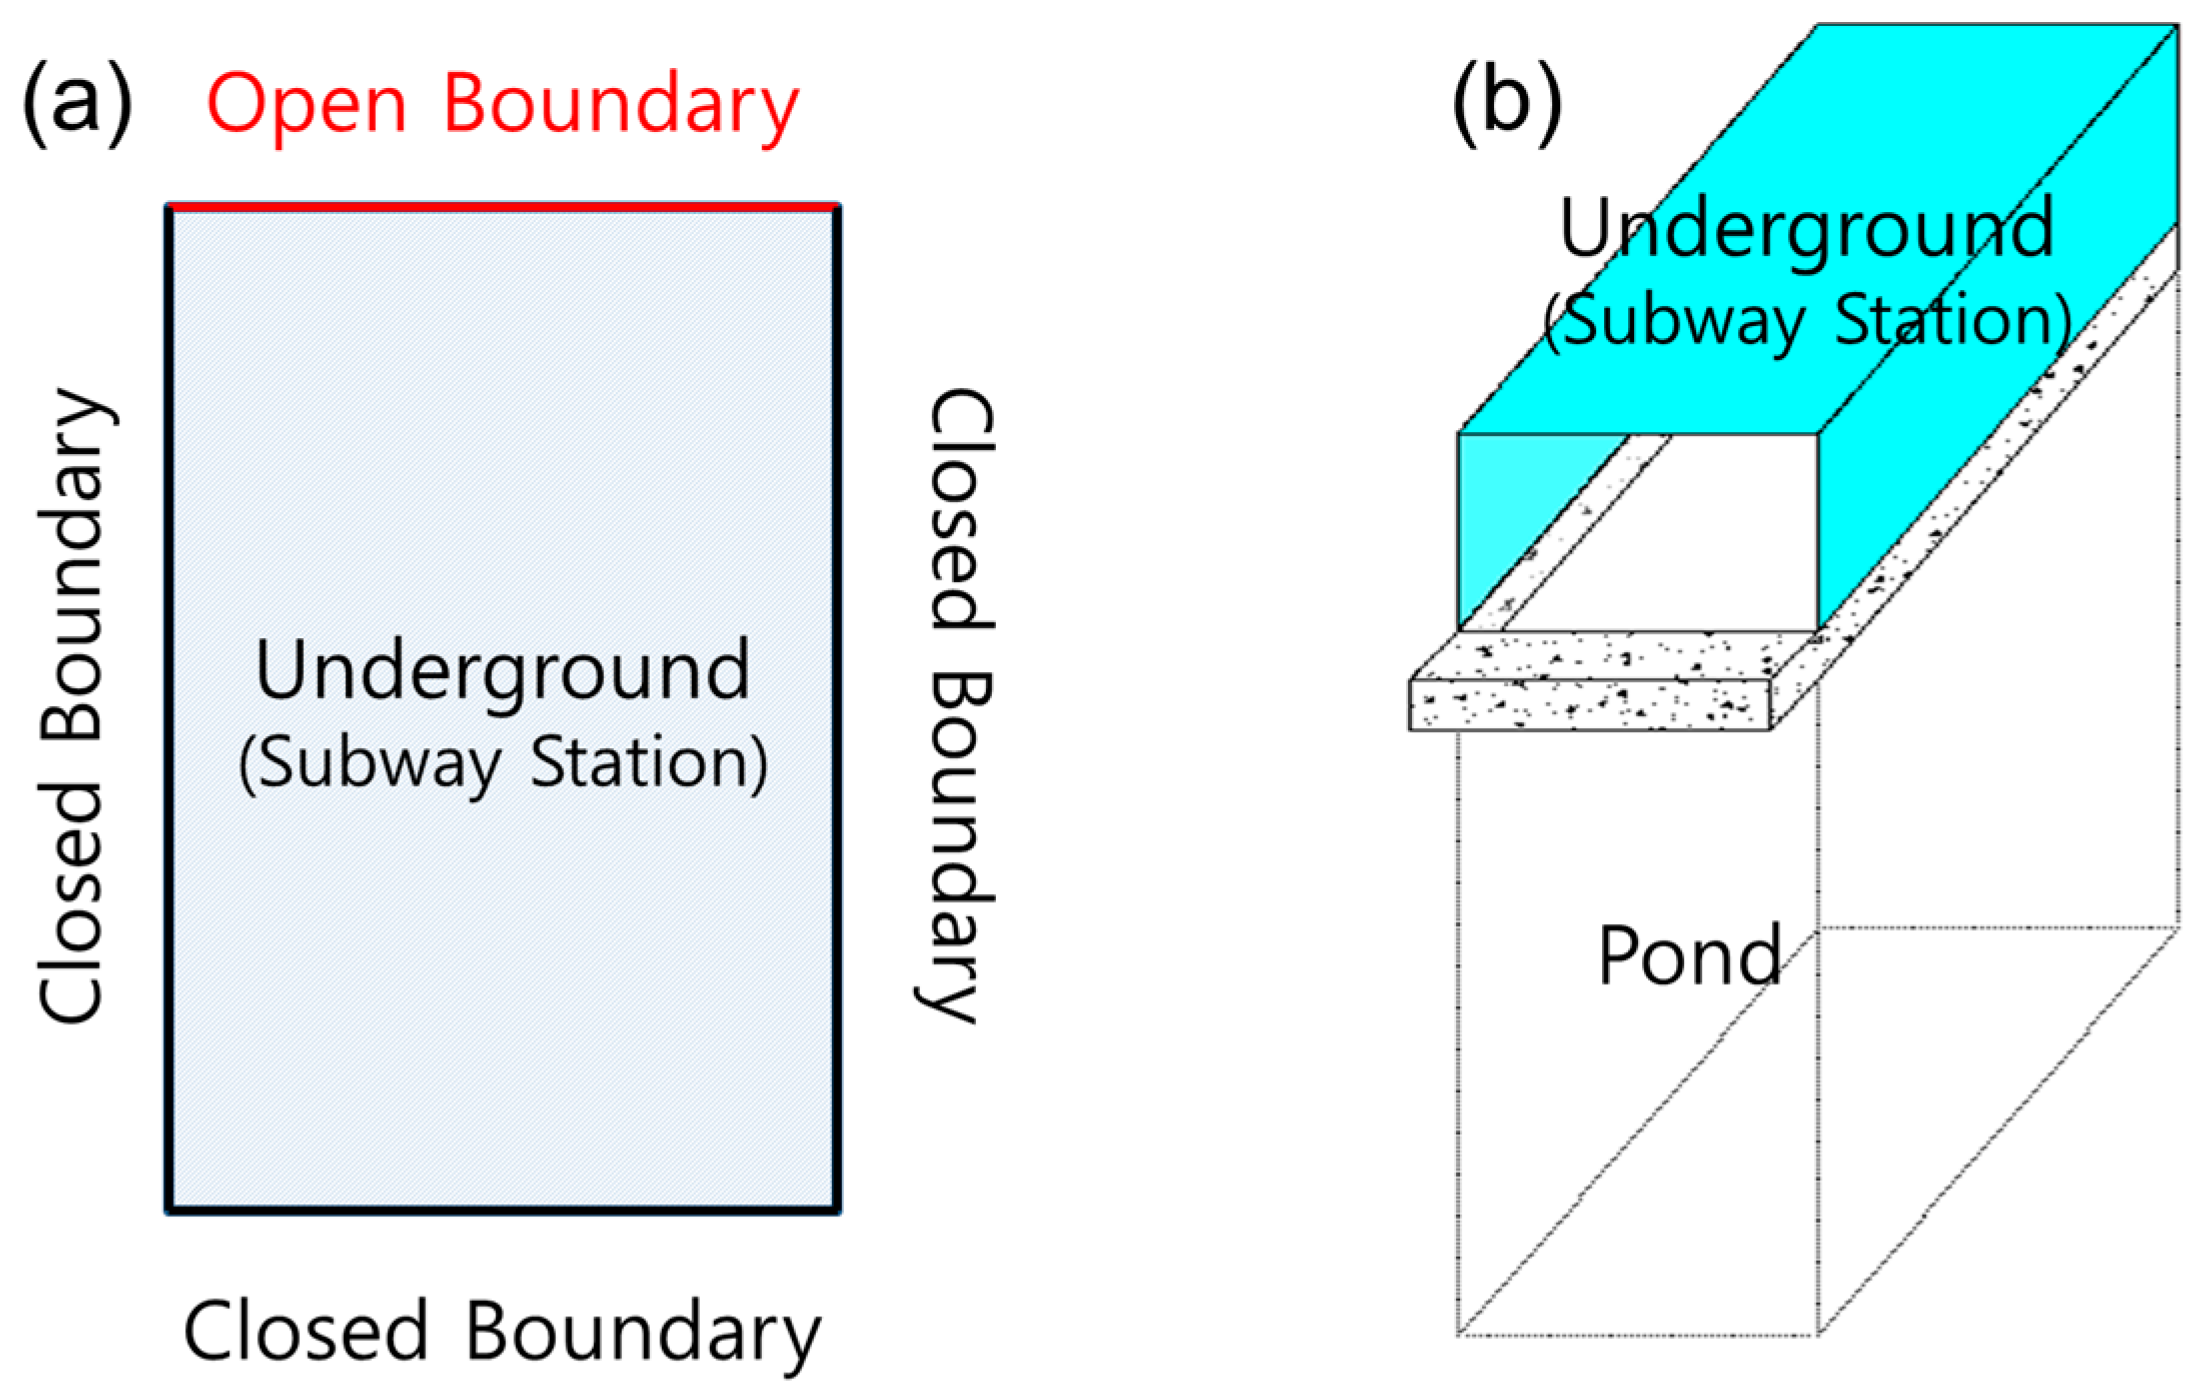
2.2. Methods to Link Overland and Underground Spaces

Subway stations accounted for the largest area in the underground spaces and flood inundation occurred there frequently in Seoul Metropolitan City, Korea. Accordingly, a subway station was taken into consideration as representative underground space to determine the effect of the underground space on the urban inundation modelings, a subway station was taken into consideration as representative underground space.
This study proposed two methods, boundary-type and pond-type, to link the overland and underground spaces in the 2D flood model. In the first method (boundary-type), the underground space in the 2D flood model was set as an interface, and inflow of floodwater to underground space was only possible at the exit (entrance) of subway station (Figure 2a). That is, a mesh was configured to set the subway station as a boundary condition, and the exit was imposed as the open boundary condition [32], thereby flow any floodwater above the threshold in the exit into the subway station. The other three sides were imposed as closed boundary conditions, so that inflow of floodwater did not occur as they were blocked by the wall.
In the second method (pond-type), the subway station was considered as an underground pond (Figure 2b). That is, the subway station at the 2D flood model was configured as a pond terrain. Here, size of the pond was set appropriately so that the water stored in the underground was not allowed to back flow to the ground. The floodwater over exit threshold only flowed into subway station through exit, and the three sides other than the exit side blocked by having the real structure elevation in the terrain mesh.

3. Applications and Results
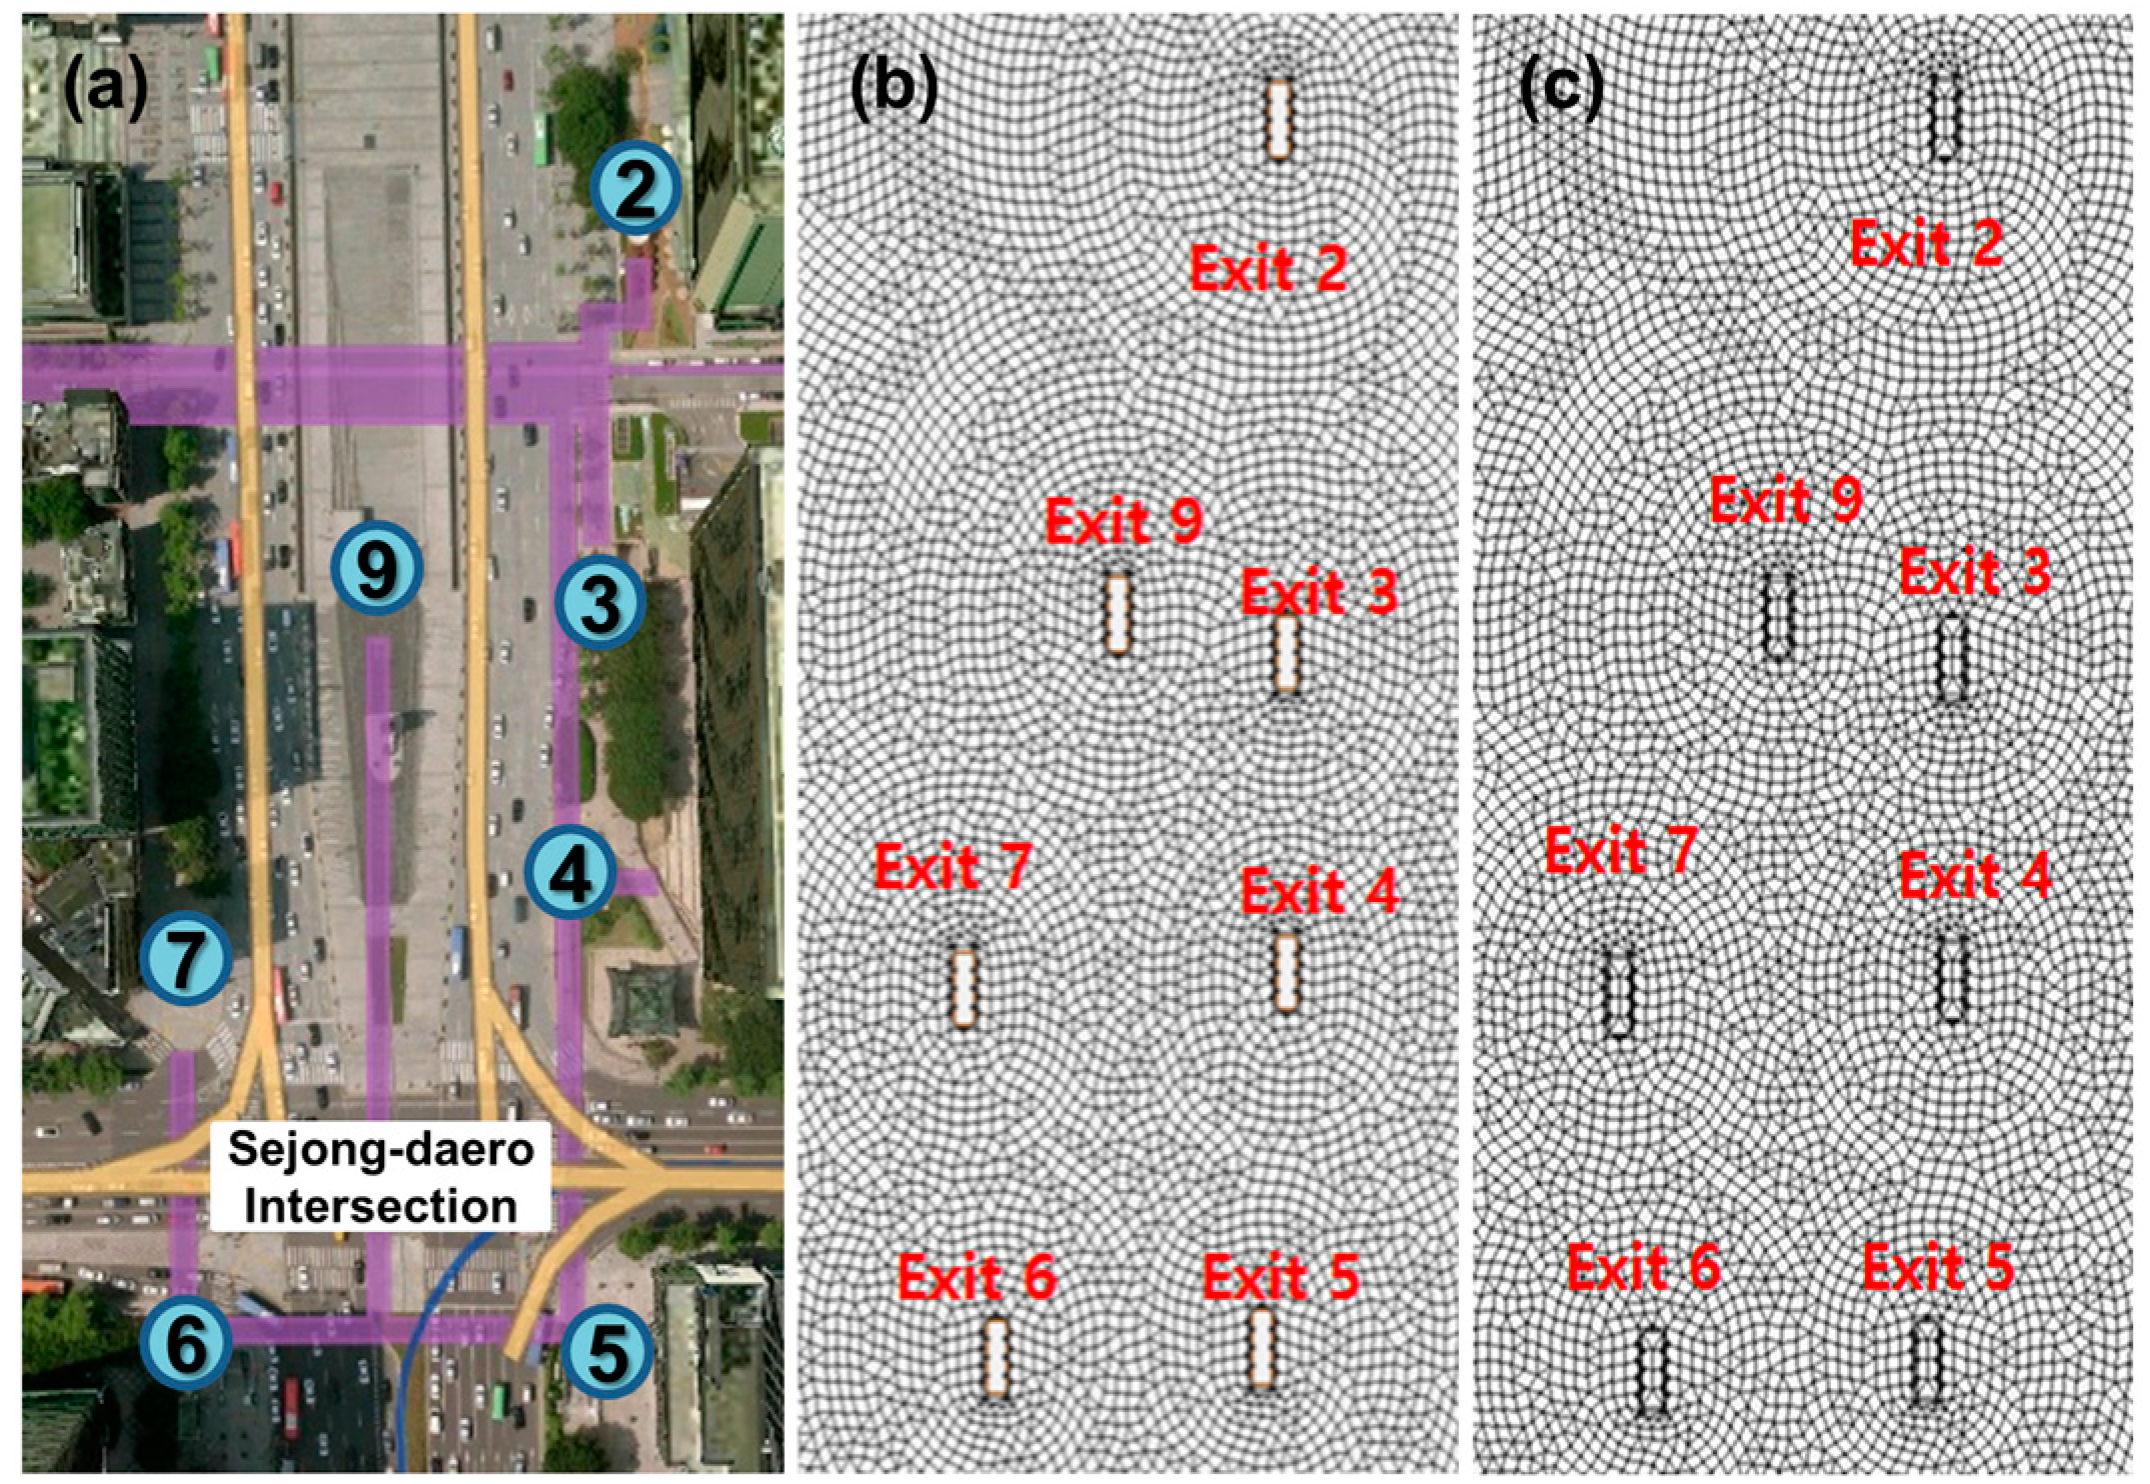
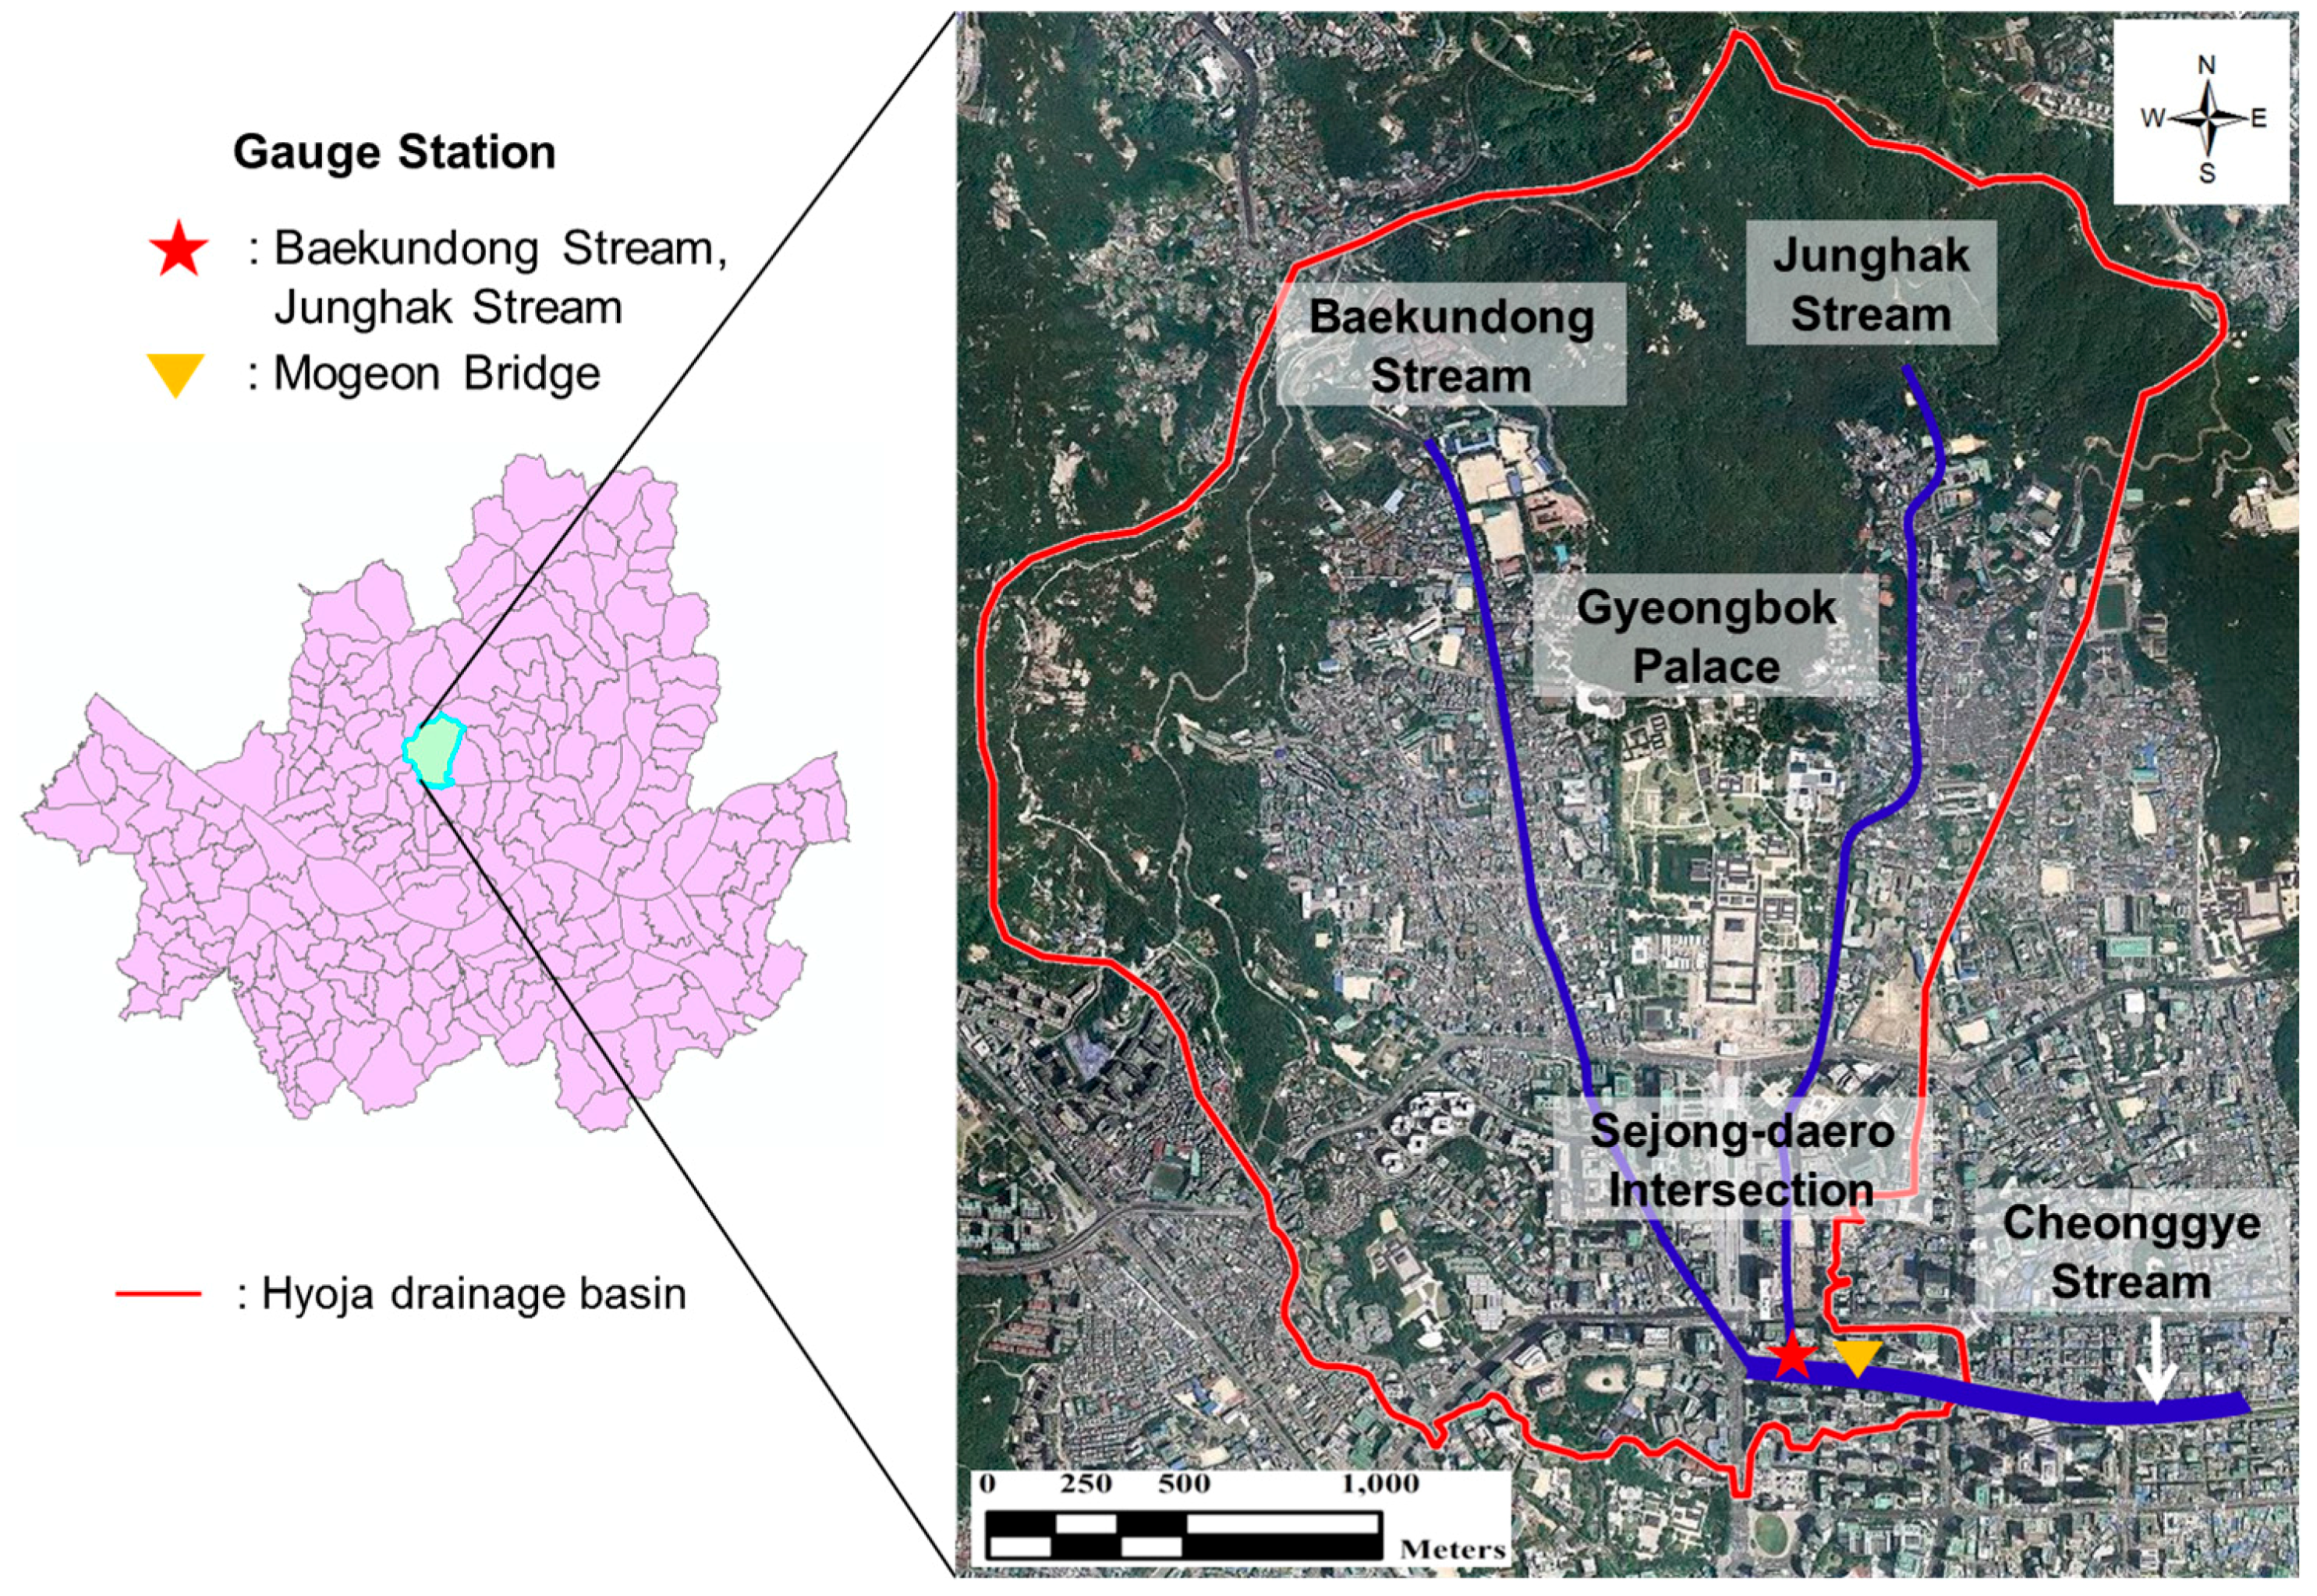
3.1. Study Area

Seoul Metropolitan City is divided into 239 drainage basins according to area size [33]. In this study, Hyoja drainage basin is selected as the study area because it was one of the most flood-prone areas among the 239 drainage basins. The area of the Hyoja drainage basin is 5.4 km2, and the upstream of the basin is a steep mountainous terrain, which gradually becomes flat in the downstream. In the mid-to-downstream, most residential and commercial zones are densely populated, and there are many underground structures such as subway (Figure 3). In the drainage system of study area, rainfall collects through sewage pipes flowing down to Baekundong Stream and Junghak Stream and finally joining at Cheonggye Stream. Baekundong Stream and Junghak Stream are urban streams that had been covered with cement. Figure 3 shows the geographical location and satellite image of the study area.

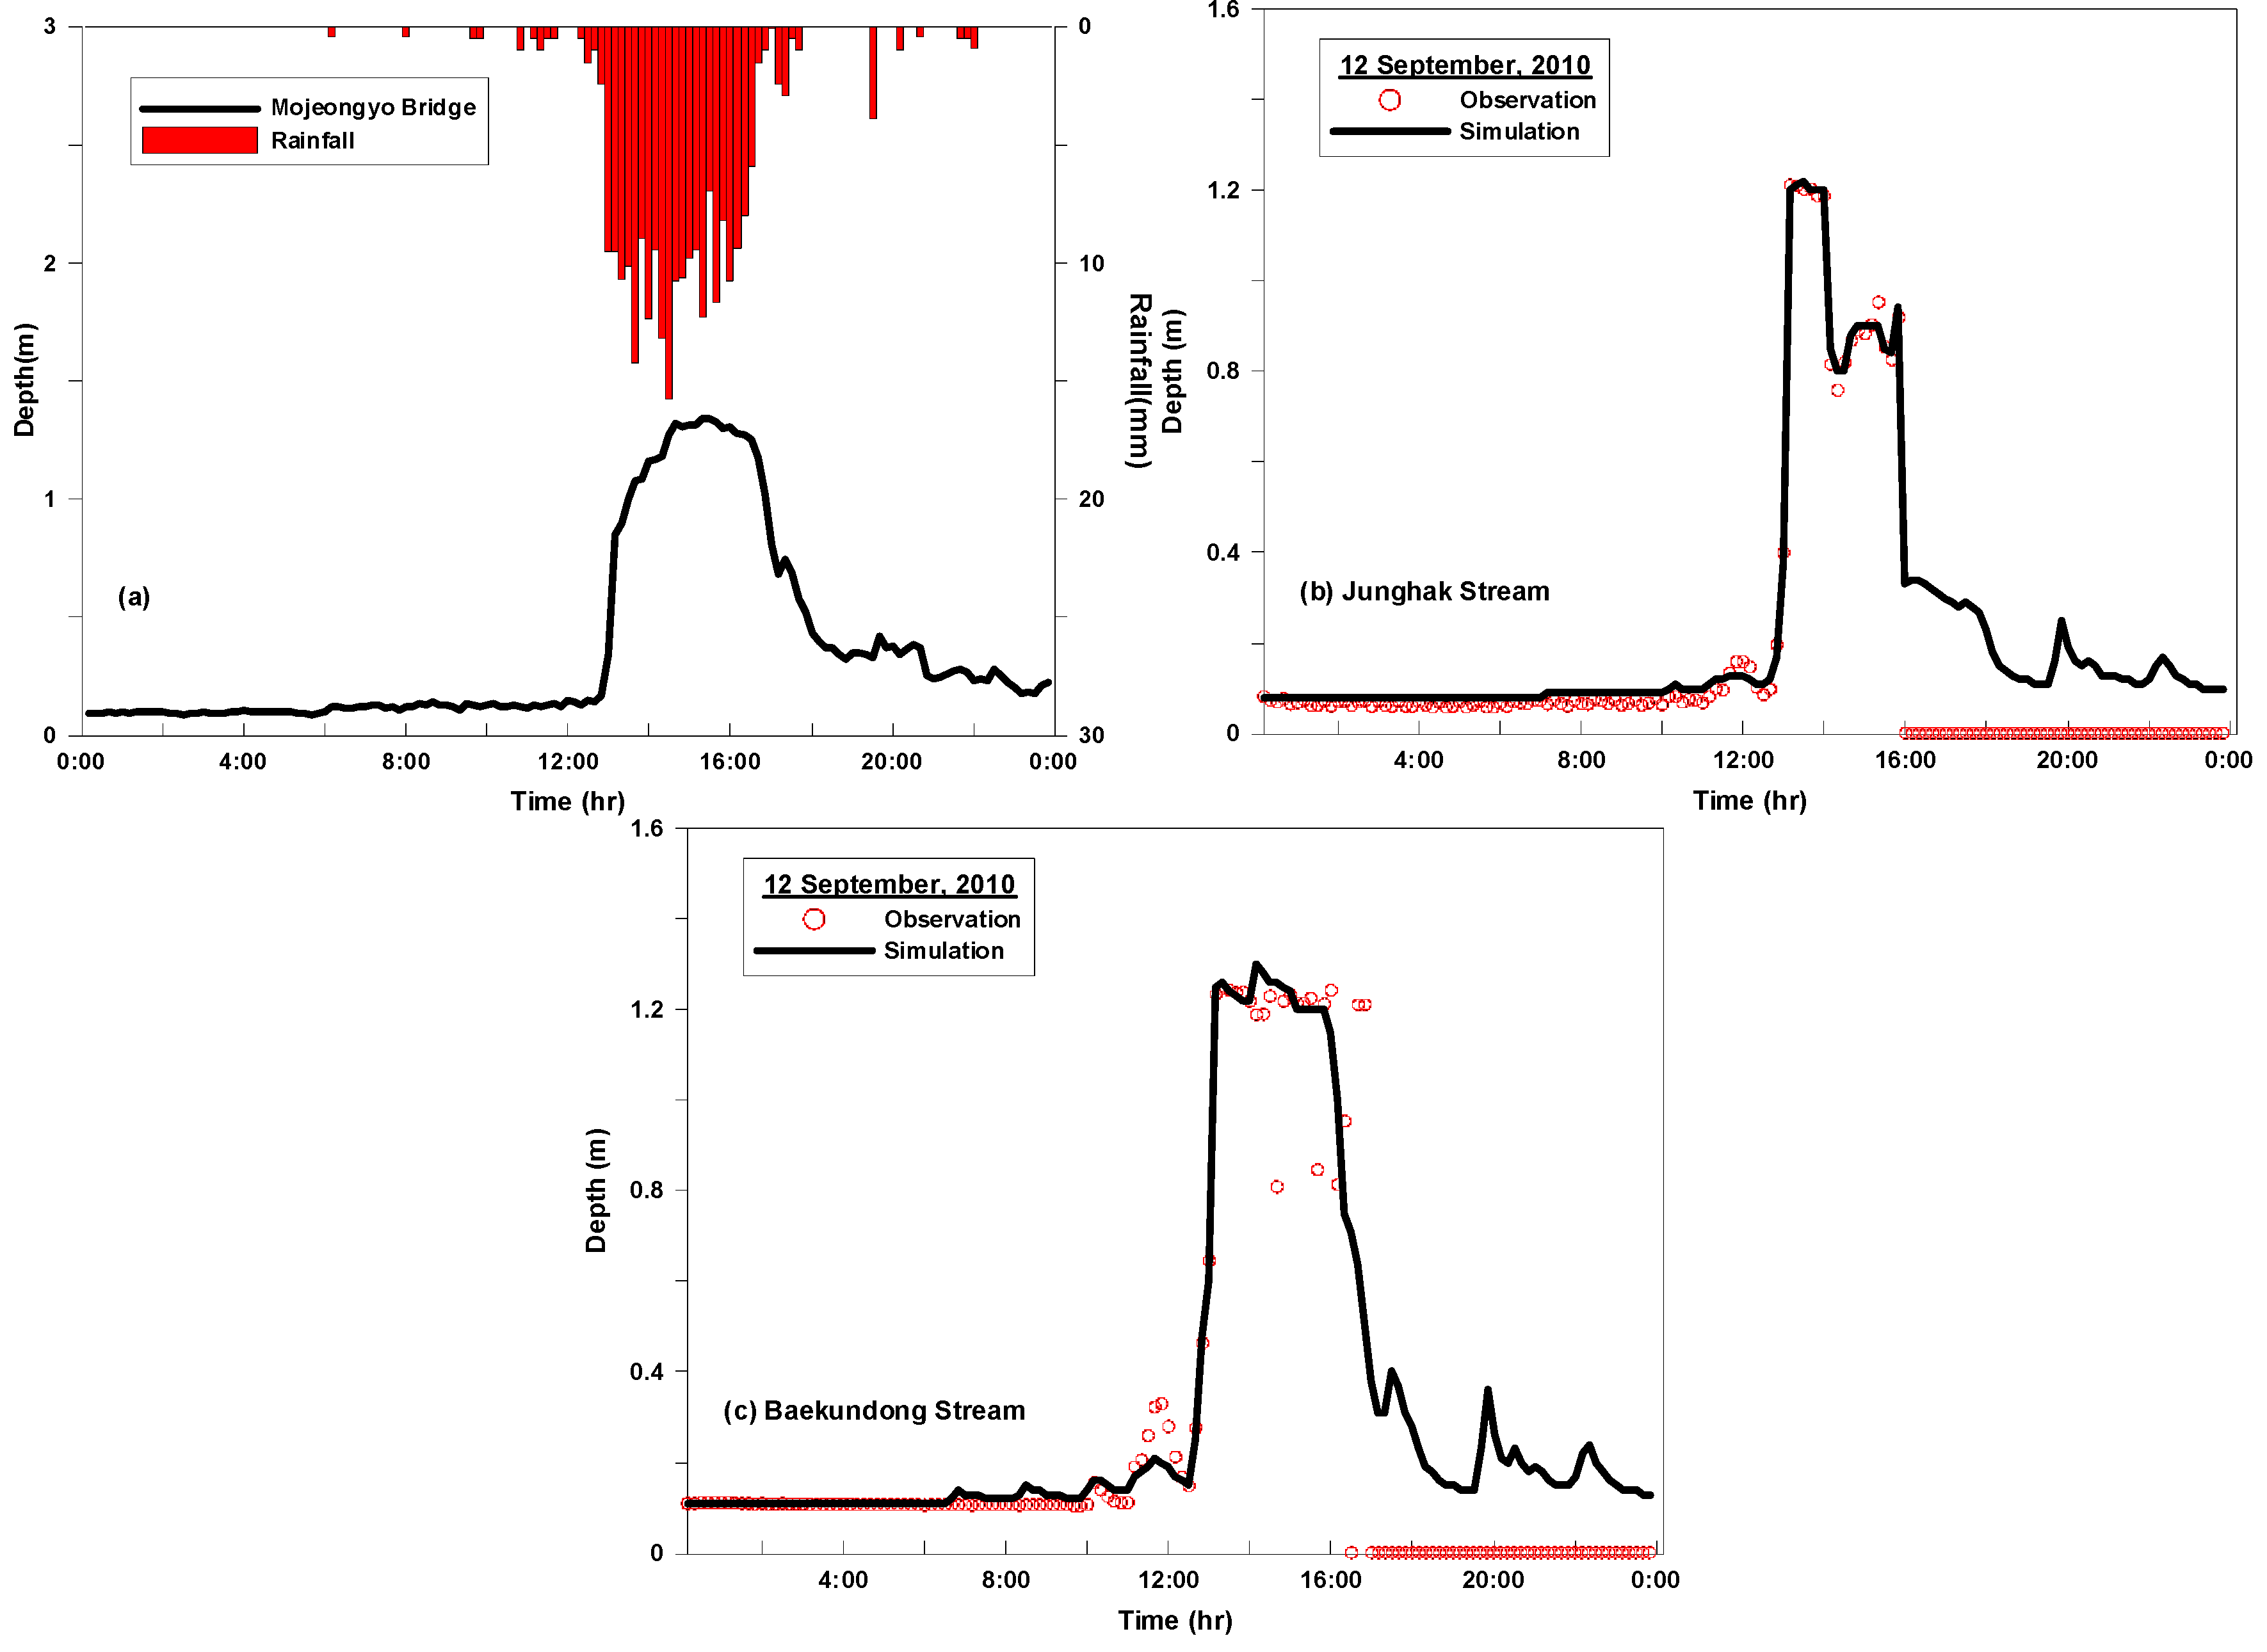
3.2. SWMM Calibration

In the study area, the 1D SWMM was applied to calculate an overflow that exceeded the conveyance capacity of the sewer pipes. As shown in Figure 4, the study area was divided into 165 sub-catchments, and input data of the SWMM including impervious ratio, slope, and CN of the sub-catchments were applied. This study utilized the shapefile format data for specifications of the sewer pipes and manholes, and the level-2 land cover map and biotope map to calculate an impervious ratio and runoff curve number (CN) in the basin. These three data were provided by Urban Safety Division of Seoul Metropolitan City (https://safe.seoul.go.kr). The 34 automatic weather stations (AWSs) are operating in Seoul Metropolitan City. Among them, AWSs in Jung-gu, Seongbuk-gu, and Seodaemun-gu are located around the study area and rainfalls measured at these three AWSs (http://www.kma.go.kr) were used.
The pipes in the Sejong-daero crossroad were constructed as C-shape type (Figure 3), which was claimed to be one of the main causes of repeated flood due to the degradation of rainwater passage capability as a result of reduction in flow velocity and increase in friction [34]. Since the SWMM analyzed pipe flow assuming the sewage and rainwater pipes as a straight line, an energy loss coefficient was applied to take the C-shape type pipes in the Sejong-daero crossroad into consideration. For the value of the energy loss coefficient, 1.8, as proposed by Kim [34], was applied.
Lee et al. [35] reported that roughness coefficient of pipe and pipe slope were more sensitive than other parameters with regard to the concentration time of run-off at the urban area as rainfall scale increased. In addition, Kim et al. [36] highlighted Manning resistance parameter for sewer pipes is the greatest source of uncertainty relative to surcharge prediction and thus flood extent prediction. Thus, this study calibrated the Manning roughness parameter of conduit, which was one of the most sensitive parameters that affected the concentration time in the basin and overflow in the manholes. To do this, point rainfall data measured at the AWSs in Jung-gu, Seongbuk-gu, and Seodaemun-gu for two rainfall events that occurred at 12 June 2012 and 27 August 2012 were used. The point rainfall was converted into areal rainfall for every 10 min via the Thiessen's weighting method (Figure 5). For the downstream boundary condition of SWMM, a water depth observed at Mojeon Bridge in Cheonggye Stream was applied (Figure 5) (http://www.sisul.or.kr).
In the KWRA [37], the range of Manning roughness coefficient in concrete channels was proposed to 0.010–0.022 m 1 / 3 s . In this study, conduit flow analysis was conducted by changing the roughness coefficient by 0.001 m 1 / 3 s increments within the proposed range, and the roughness coefficient was calibrated through comparison between calculated and observed water depth. A water depth at Baekundong Stream and Junghak Stream was observed via an ultrasonic gauge, which was installed at a location where two streams had just joined with the Cheonggye Stream (Figure 3) (http://www.sisul.or.kr). Baekundong Stream and Junghak Stream are urban streams that were covered up, and they were considered as combined pipes in this study.
To calibrate the conduit roughness coefficient, the aforementioned two rainfall events and water depths in Baekundong Stream and Junghak Stream were employed. The conduit roughness coefficient was calibrated by adjusting it in SWMM and comparing the calculated and observed water depths. The root mean square error (RMSE, Equation (4)) and relative peak error (RPE, Equation (5)) were used as objective functions to minimize the difference of observations and calculations. In this study, n m = 0.020 m 1 / 3 s , where the least error between the calculated and observed values was set as the optimal roughness coefficient. Table 1 shows the quantitative errors including RMSE and RPE, and Figure 6 shows the comparison between observed and calculated water depth applying n m = 0.020 m 1 / 3 s at Junghak Stream and Baekundong Stream.
RMSE = i = 1 N ( I o b s i I c o m i ) 2 N ,
RPE = | I o b s p I c o m p | I o b s p × 100 ( % ) ,
where I o b s i and I c o m i are the observed and calculated water depth at time ( i ), respectively; I o b s p and I c o m p are observed and calculated peak water depth, respectively; and N is the number of data.

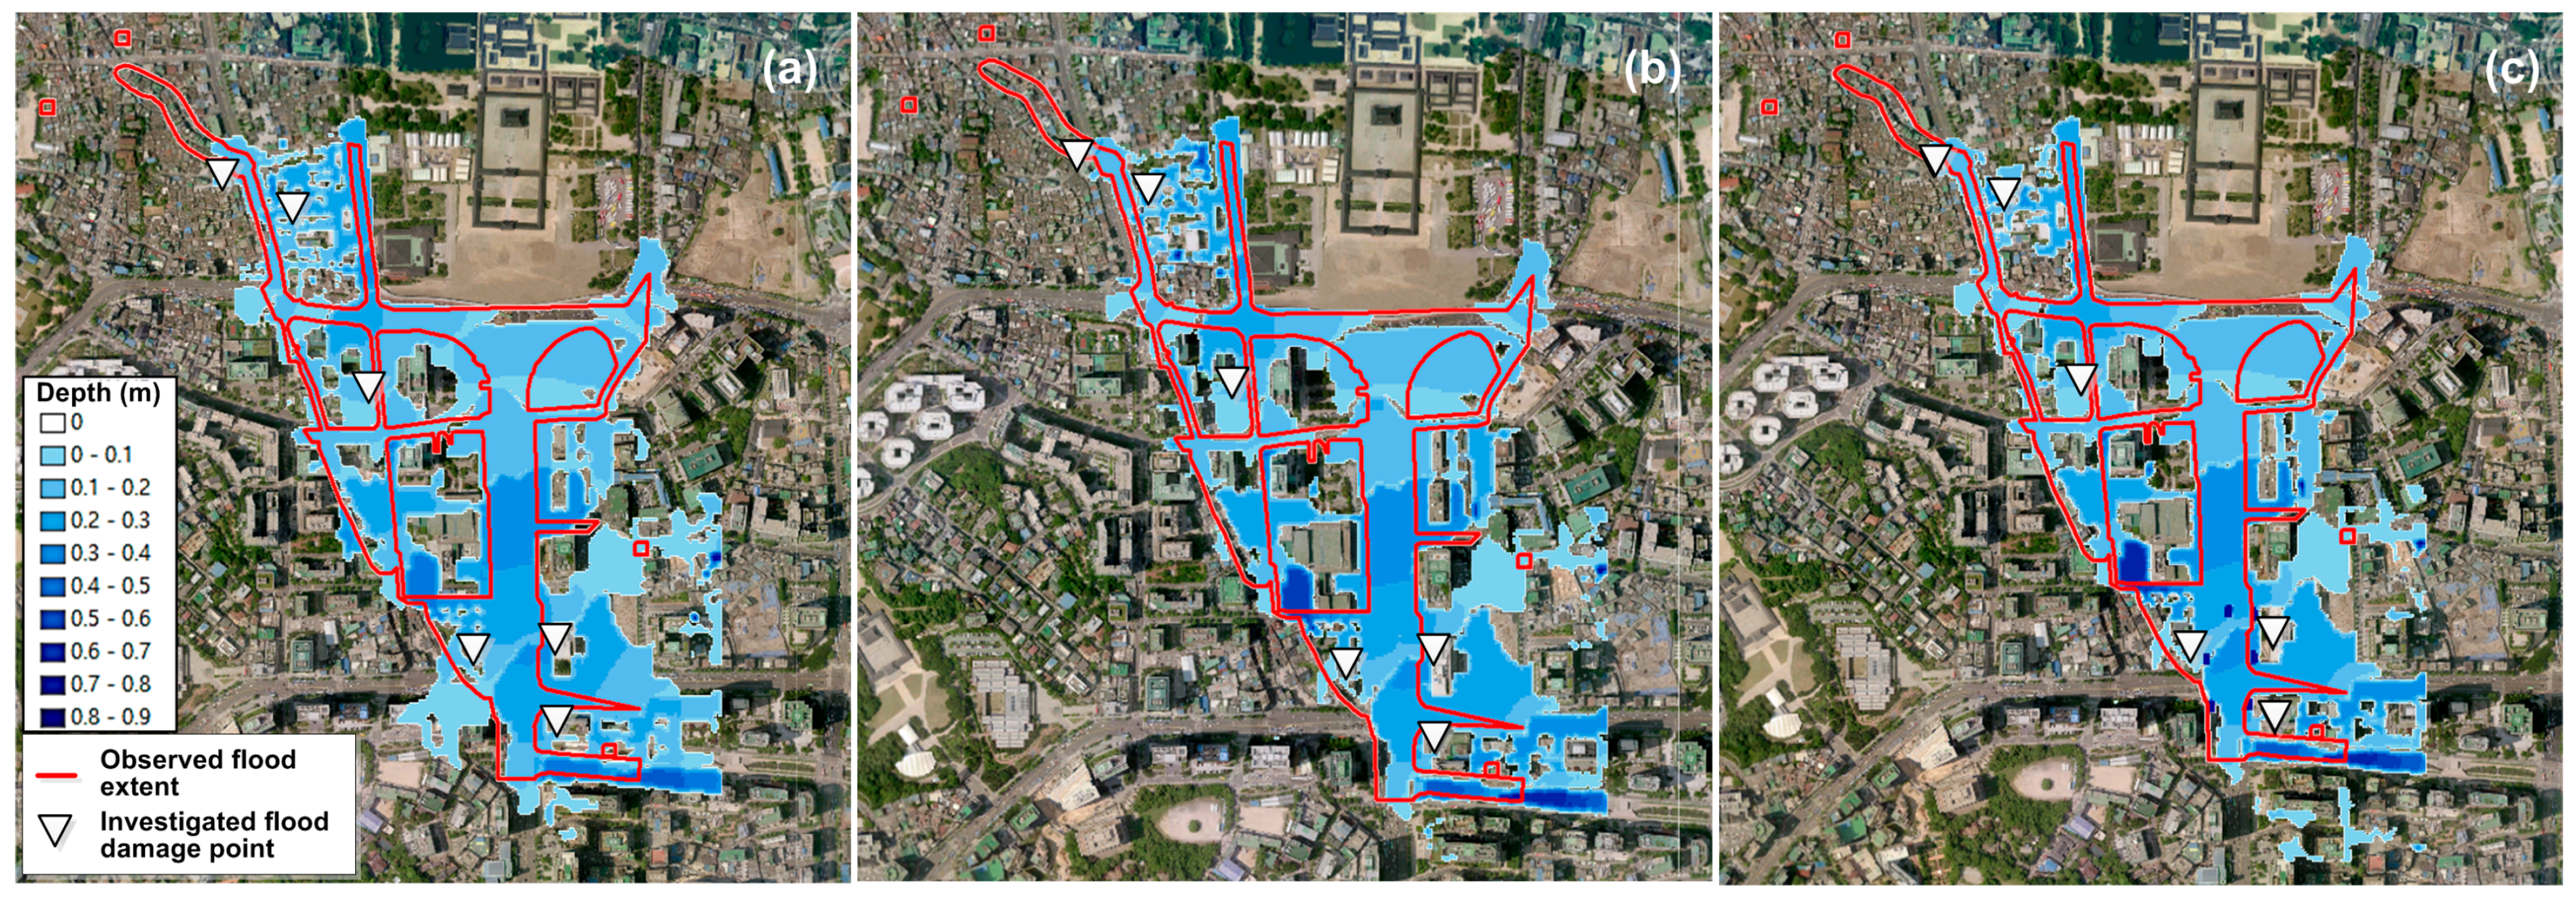
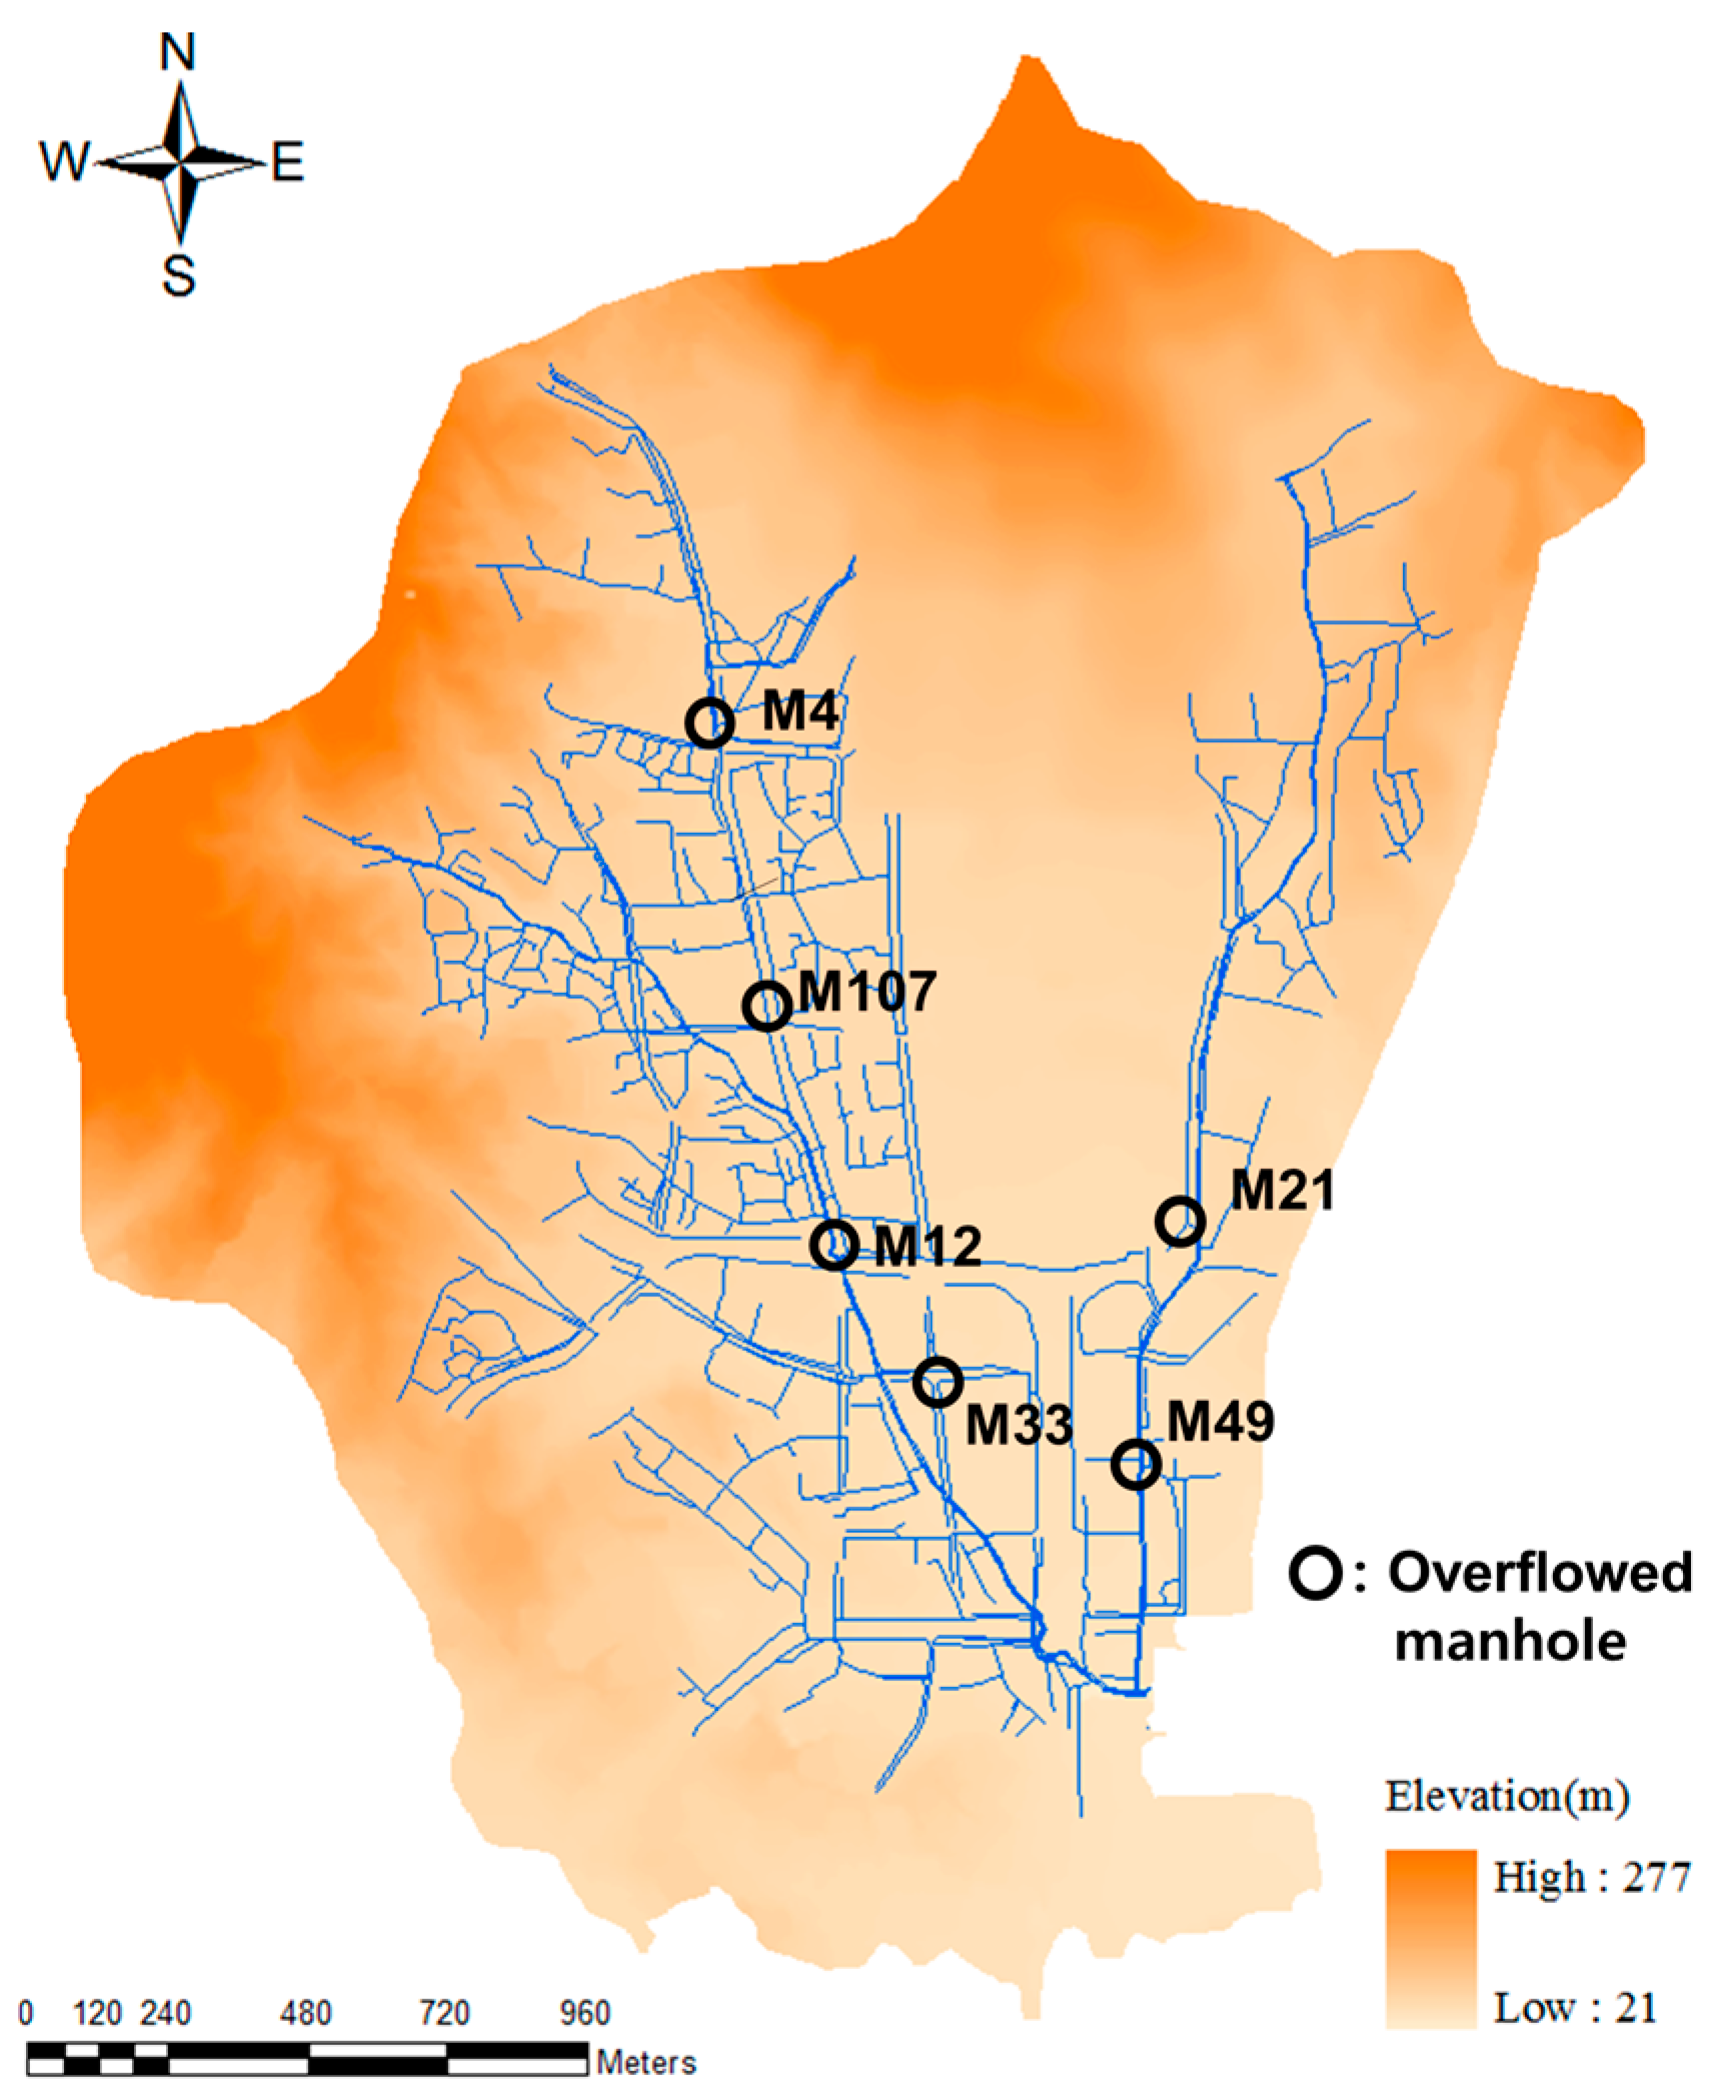
3.3. Urban Flood Analysis

3.3.1. Model Scenarios

Subway stations are the largest underground spaces in the study area and this study took Gwanghwamun subway station located at the Sejong-daero where urban flood occurred in 21 September 2010 (Figure 3 and Figure 7a). In this study, three scenarios were made to compare the flood influence according to whether underground space was present or not in the urban inundation modeling. In Case 1, the underground space was not considered, in Case 2, the underground space was considered as a boundary-type, and in Case 3, the underground space was considered as a pond-type. That is, in Case 2, an exit of the subway station was set to open boundary condition to have an inflow of the floodwater, and other sides were set to closed boundary condition to block the inflow of the flood into underground space. In Case 3, floodwater came into underground space through the exit of the subway station, and a real elevation of the subway station was taken for the other sides to block the flow.
To apply 2D flooding model, unstructured mesh was generated using SMS Surface Water Modeling System (SMS) (Aquaveo, Provo, UT, USA). The mesh has a resolution of approximately from 2 m around subway station to 6 m. Figure 7b,c shows the generated meshes for Case 2 and Case 3, respectively. In Case 2, a mesh was configured to have an exit of the subway station set to open boundary condition and the other sides set to closed boundary condition (Figure 7b). In Case 3, a mesh was configured to consider the elevation of the underground space (Figure 7c). In Cases 2 and 3, am overland floodwater was flowed into the subway station, when flood depth was higher than the exit threshold elevation of the subway station. The elevations of the exit were measured in the site, shown in Table 2. The floodwater flowed into underground space was able to flow out to overland in Case 3 considering topography of underground space, whereas the water flowed outside of computational domain by open boundary condition was not considered in Case 2.
The elevation was assigned to nodes of mesh from topographic data combining buildings of digital contour maps with 1:1000 scale (http://www.nsic.go.kr) and DEM with 2 m resolution. Yi et al. [38] built the DEM with 2 and 5 m resolution, respectively, from Airborne LiDAR with average point density of 2.5 pt/m2 (http://www.ngii.go.kr) and KOMPSAT-2 (Korea Multi-Purpose Satellite-2) images with 1–4 m resolution (http://www.kari.re.kr). This study used this DEM with 2 m resolution and building process of topographic data involving LiDAR filtering algorithms was described in detail in Yi et al. [38].

3.3.2. 2D Flood Analysis Linking the Overland and Underground Spaces

In the study area, rainfall intensity of up to 94.4 mm/h and total rainfall of 243 mm for six hours were observed in 21 September 2010. This heavy rainfall exceeded the capacity of the sewer drainage system in the study area, thereby inducing an overflow in the manholes and causing urban inundation (Figure 8 and Figure 9a). Figure 8 presents the flood inundation around Sejoing-daero intersection and exit No. 7 of Gwanghwamun subway station at that time.
Figure 9a shows the converted areal rainfall from measured point rainfall at three AWSs and the observed water depth at Mojeon Bridge in 21 September 2010. These two data were used to calculate overflow at the manhole in the SWMM. Figure 9b,c shows a comparison of the observed and calculated water depth applying calibrated roughness coefficient in SWMM at two urban streams. In the urban run-off analysis, an overflow occurred at about 40 min after the heavy rainfall was started, and the overflow continued at the manhole from 13:00 to 17:00. An overflow occurred at six manholes (Figure 4), and the calculated overflow is shown in Figure 10. The calculated overflow was used for the 2D flood inundation analysis linking the overland and underground spaces.
UFDMRC [22] proposed a manning roughness coefficient of the commercial zone in a range of 0.015–0.030 m 1 / 3 s . In this study, four roughness coefficients (0.015, 0.020, 0.025, and 0.030) were considered within a range proposed by UFDMRC [39] and increased by 0.005 to calibrate the surface roughness coefficient. The calculated flood extent through the application of each roughness coefficient and measured flood extent were compared, and a roughness coefficient that showed the greatest goodness of fit between them was selected as the optimal one. To do this, the manhole overflow (Figure 10) was applied to the 2D overland flood model (Case 1) in which the underground space was not considered. The measured flood extent was supplied from Seoul Metropolitan City (http://www.seoul.go.kr) and goodness of fit was calculated using Equation (6).
Goodness of fit  ( % ) = A c A m A c A m × 100 ( % ) ,
where A c and A m are the computed and measured flood extent area, respectively. The symbols and represent the intersection and union of two domains, respectively. The value equals to 100 when two domains match perfectly, and 0 when no intersection area [40].
When n m = 0.015, 0.020, 0.025, and 0.030 m 1 / 3 s were applied as roughness coefficient to 2D flooding model, the goodness of fit between measured and calculated flood extent was 39.52%, 39.88%, 40.22% and 40.11%, respectively (Table 3). This result showed low agreement compared with that of other studies presenting 54%–91% [40], 78%–92% [41] and 54%–95% [42]. Wadey et al. [43] divided the range of goodness of fit into three sections: good fit (>75%), moderate fit (50%~75%) and poor fit (<50%).
In order to find the reason for the low goodness of fit, an inundation region was divided into three sub-regions (A, B and C). Sub-region A refers to where the calculated flood extent and measured one were matched, sub-region B refers to where two extents were not matched within the measured flood extent, and sub-region C refers to where two extents were not matched outside the measured flood extent. When a proportion of each sub-region in entire region (A + B + C) was calculated, the area of sub-region C was relatively larger than the other two areas, and this was the cause of the low goodness of fit. This was because the measured flood extent had the following problems. First, the objective criterion depth to distinguish flooding was not established so the measured flood extent tends to be dependent on the subjectivity of post-flood field investigator. Second, inundation that occurred around the buildings or streets, which were far away from the main roads, was not taken into consideration clearly since the flood extent was examined based on the main roads only.
Thus, inundation regions based on flood damage reports for houses and shops provided by National Disaster Management Institute (http://www.ndmi.go.kr), media articles, and photo images showing real situations were collected in this study in order to overcome the inaccuracy of the measured flood extent. Figure 11 shows locations indicated by these new data marked with white inverted triangle. Most of the additionally investigated inundation areas were presented outside of the measured flood extent, which indicated that the real flood area was larger than the measured flood extent. Since the evidence for the accuracy of the area in sub-region C was not supportive, a modified goodness of fit equation was used in this study. The goodness of fit for each roughness coefficient calculated using Equation (7) is shown in Table 3, and n m = 0.025 m 1 / 3 s whose goodness of fit was the highest (74.2%) was selected as the optimal roughness coefficient.
Modified goodness of fit  ( % ) = Area  ( A B ) Area  ( A B ) × 100 ( % ) ,
A manhole overflow (Figure 10) calculated using the SWMM was applied to the 2D overland flood model with n m = 0.025 m 1 / 3 s to calculate a flood area, flood depth, and velocity for each scenario. The calculated results are shown in Figure 11 and Figure 12 and Table 4. Cases 2 and 3 showed a similar flood area, whereas Case 1 had a larger flood area than that of Cases 2 and 3 by 12% approximately (Table 4). At the west of Gyeongbok Palace and downstream of the study area, Case 1 was more inundated than in Cases 2 and 3 were (Figure 11). The goodness of fit between measured and calculated flood extent in Case 1 was 74.2% while those of Cases 2 and 3 were 82.7% and 84.2%, respectively, which revealed that a scenario in consideration of underground space had about 10% higher goodness of fit.
Kim [34] presented a flood depth of two places (Exit No. 6 and 7 shown in Figure 7) through site survey. The calculated flood depth was compared with this site surveyed flood depth. A flood depth surveyed at the site of Exit No. 7 in Gwanghwamun station was 0.47 m (Figure 8b) while those for Case 1, Case 2, and Case 3 were 0.51, 0.48 and 0.46 m, respectively, indicating that Case 1 had 9% error and Cases 2 and 3 had 2% error approximately. A flood depth measured at the site of Exit No. 6 was 0.47 m while those for Case 1, Case 2, and Case 3 were 0.15, 0.16, and 0.15 m, respectively, indicating that Case 1 had 25% error and Cases 2 and 3 had 20% error approximately. Case 1 in the above two places showed 17% error on average and Cases 3 and 3 showed 12% error on average, indicating that more accurate results were obtained when underground space was considered in the case of a flood depth as the same as in the flood extent.
Although, there was not measured flood velocity at the time of flood event, this study examined the flood velocity for each case. A mean velocity in Cases 1, 2, and 3 was 0.10, 0.09, and 0.09 m/s, respectively, revealing no significant difference according to the consideration of underground space. However, the maximum velocity was 1.87, 2.30, and 2.47 m/s, resulting in a difference of 0.43–0.6 m/s between the cases (Table 4). In particular, Cases 2 and 3 showed a higher velocity distribution near the subway station than in Case 1.
Cases 2 and 3 showed more accurate results than Case 1 and two cases had similar accuracy in flood extent and depth. However, the execution time of Case 2 was almost four times faster than Case 3 under same situation (Table 4), which indicated that Case 2 had the highest computational efficiency among three cases.
A difference of flood depth and velocity was calculated using ArcGIS (ESRI, Redlands, CA, USA) to compare the difference of them for each case. Figure 13 and Figure 14 presented differences in maximum flood depths and velocities between each case (Cases 2 and 3) and the Case 1, respectively. For flood depth, no significant difference in mean flood depth was shown between cases but some region showed a large difference in flood depth, such as −0.71~0.60 m and −0.73~0.33 m (Table 5). As shown in Figure 13, a deeper flood depth was calculated in Case 2 and 3 than in Case 1 around the subway station, whereas a deeper flood depth was presented in Case 1 around Cheonggye Stream, which was a downstream of the study area. The reason for this result was because floodwater that was not entered into the underground space was flowed to Cheonggye Stream, thereby increasing a flood depth and flood area around Cheonggye Stream. Furthermore, the reason for the deeper flood depth in Cases 2 and 3 around the subway station was due to the conveyance reduction of flood flow caused by the terrain mesh to present the topography of subway station. For the velocity, a difference in velocity around Gwanghwamun station and Cheonggye Stream was revealed relatively large as similar as the flood depth (Table 5). The reason for this was the same as the cause of difference in flood depth for each scenario as explained above.

4. Conclusions

Although urban area is a complex topography composed of overland and underground spaces, few studies have been conducted on urban flood analysis in consideration of the two spaces simultaneously. This study proposed two methods of boundary-type and pond-type to link the overland and underground spaces in the 2D flood modeling, and examined the influence of underground space in urban flood inundation. An overflow at the manhole was calculated through sewer flow analysis using SWMM and then this overflow was applied to the 2D overland flood model as boundary condition. Model simulations were conducted in the Gwanghwamun area of the Hyoja drainage basin, Korea where flood inundation occurred on 21 September 2010. The predictions were compared with measured data including water depth in the covered urban streams considered as conduit in this study, and flood depth and extent in overland. The main study results are as follows:
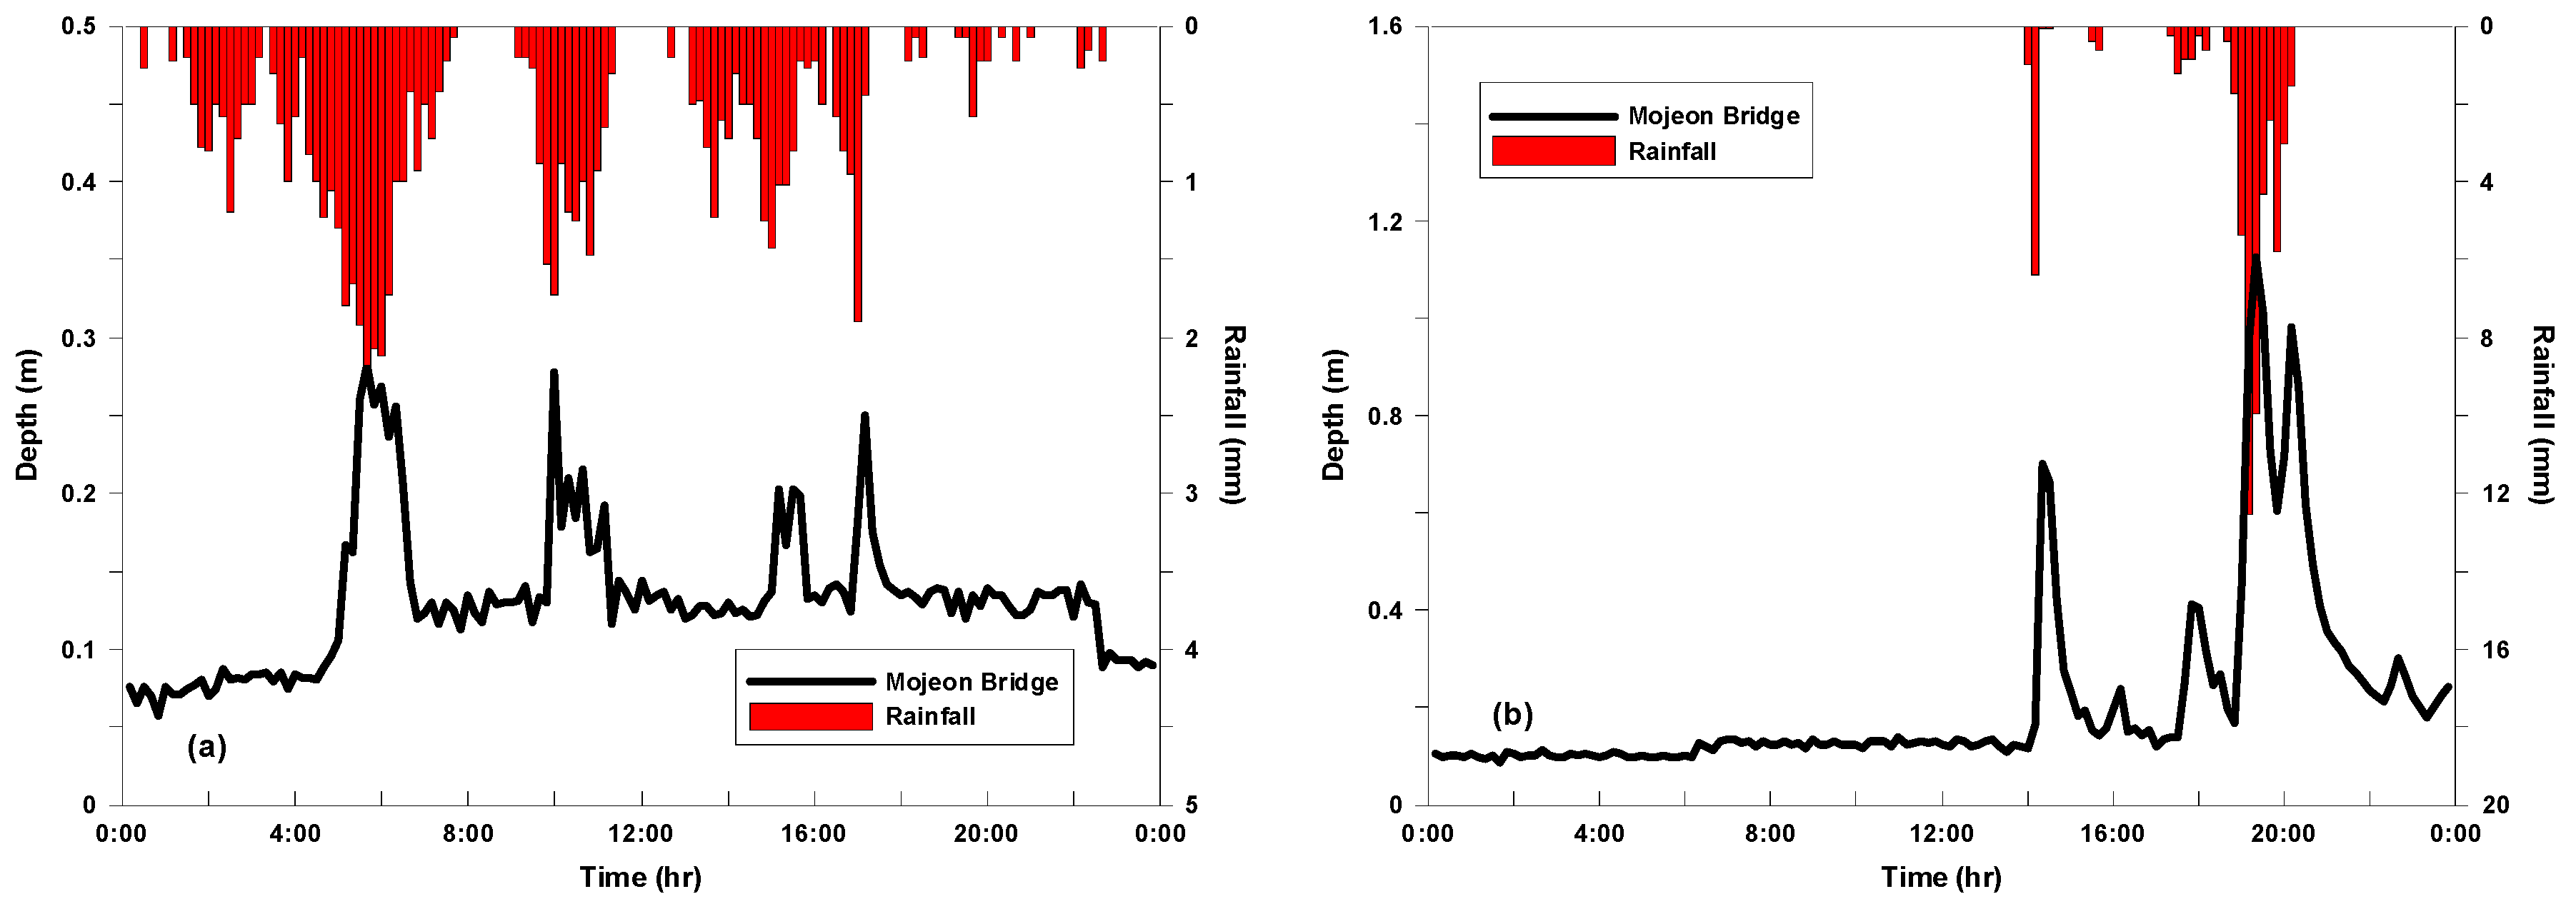
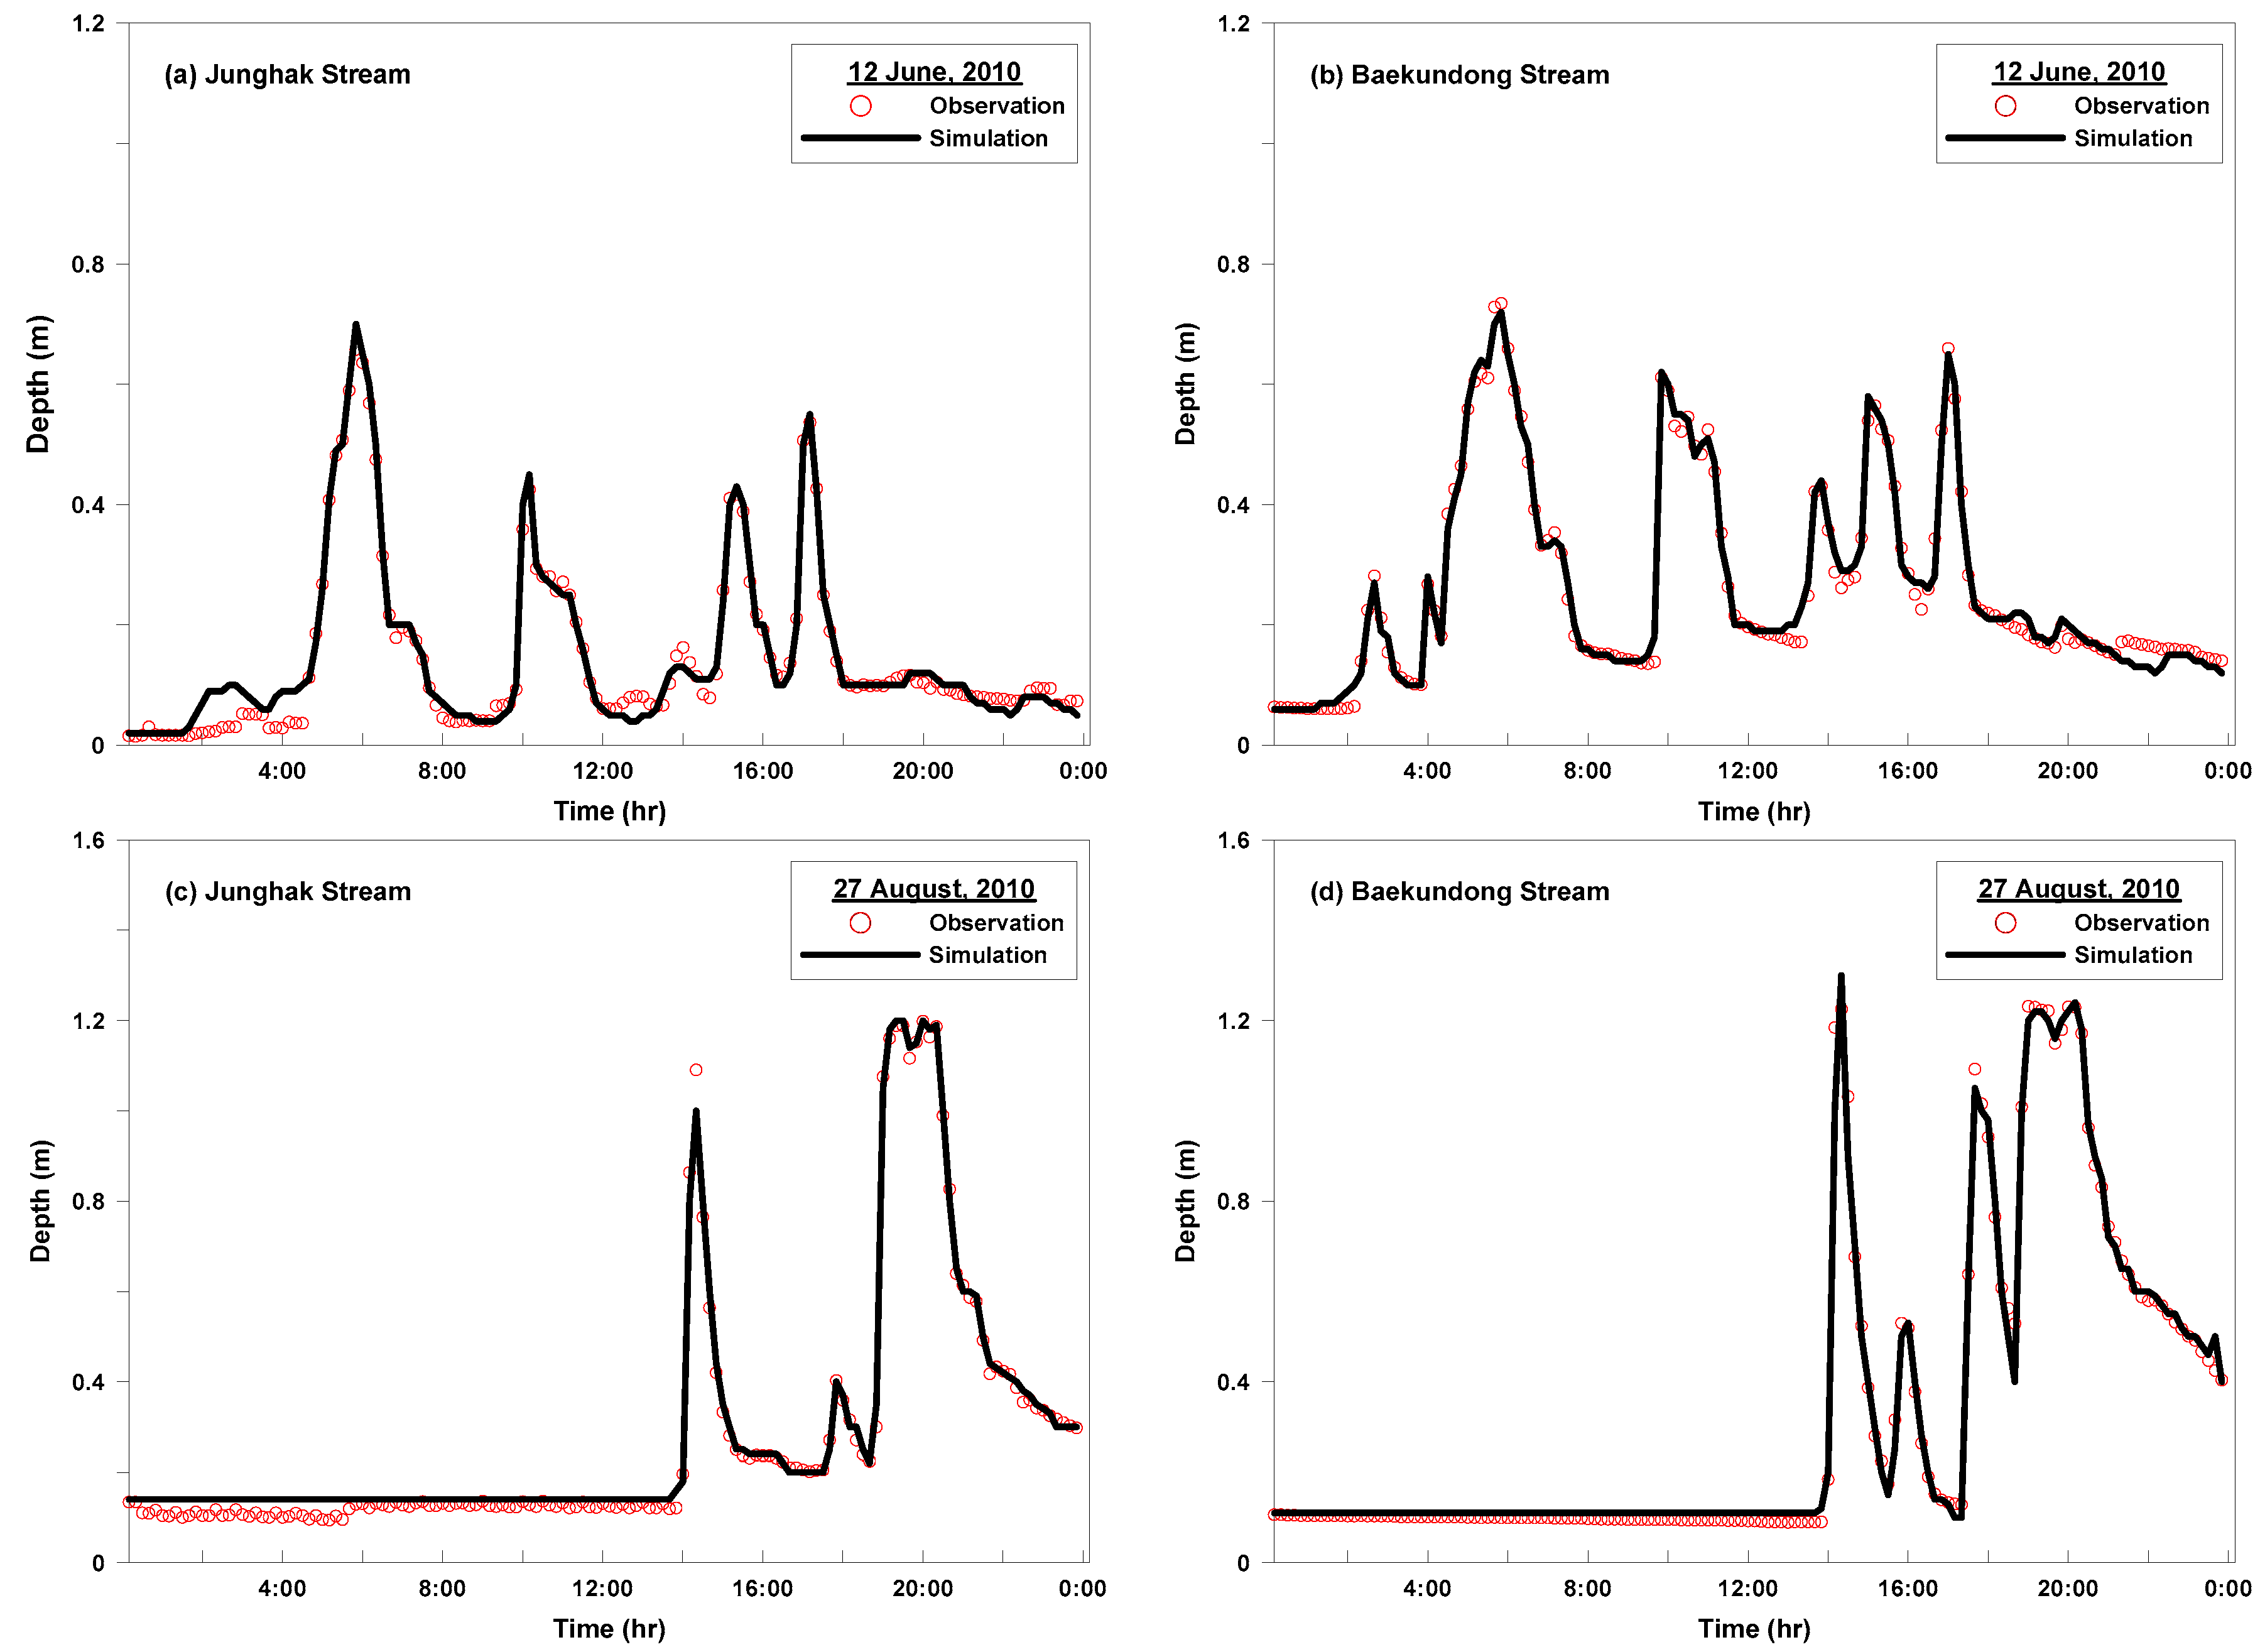
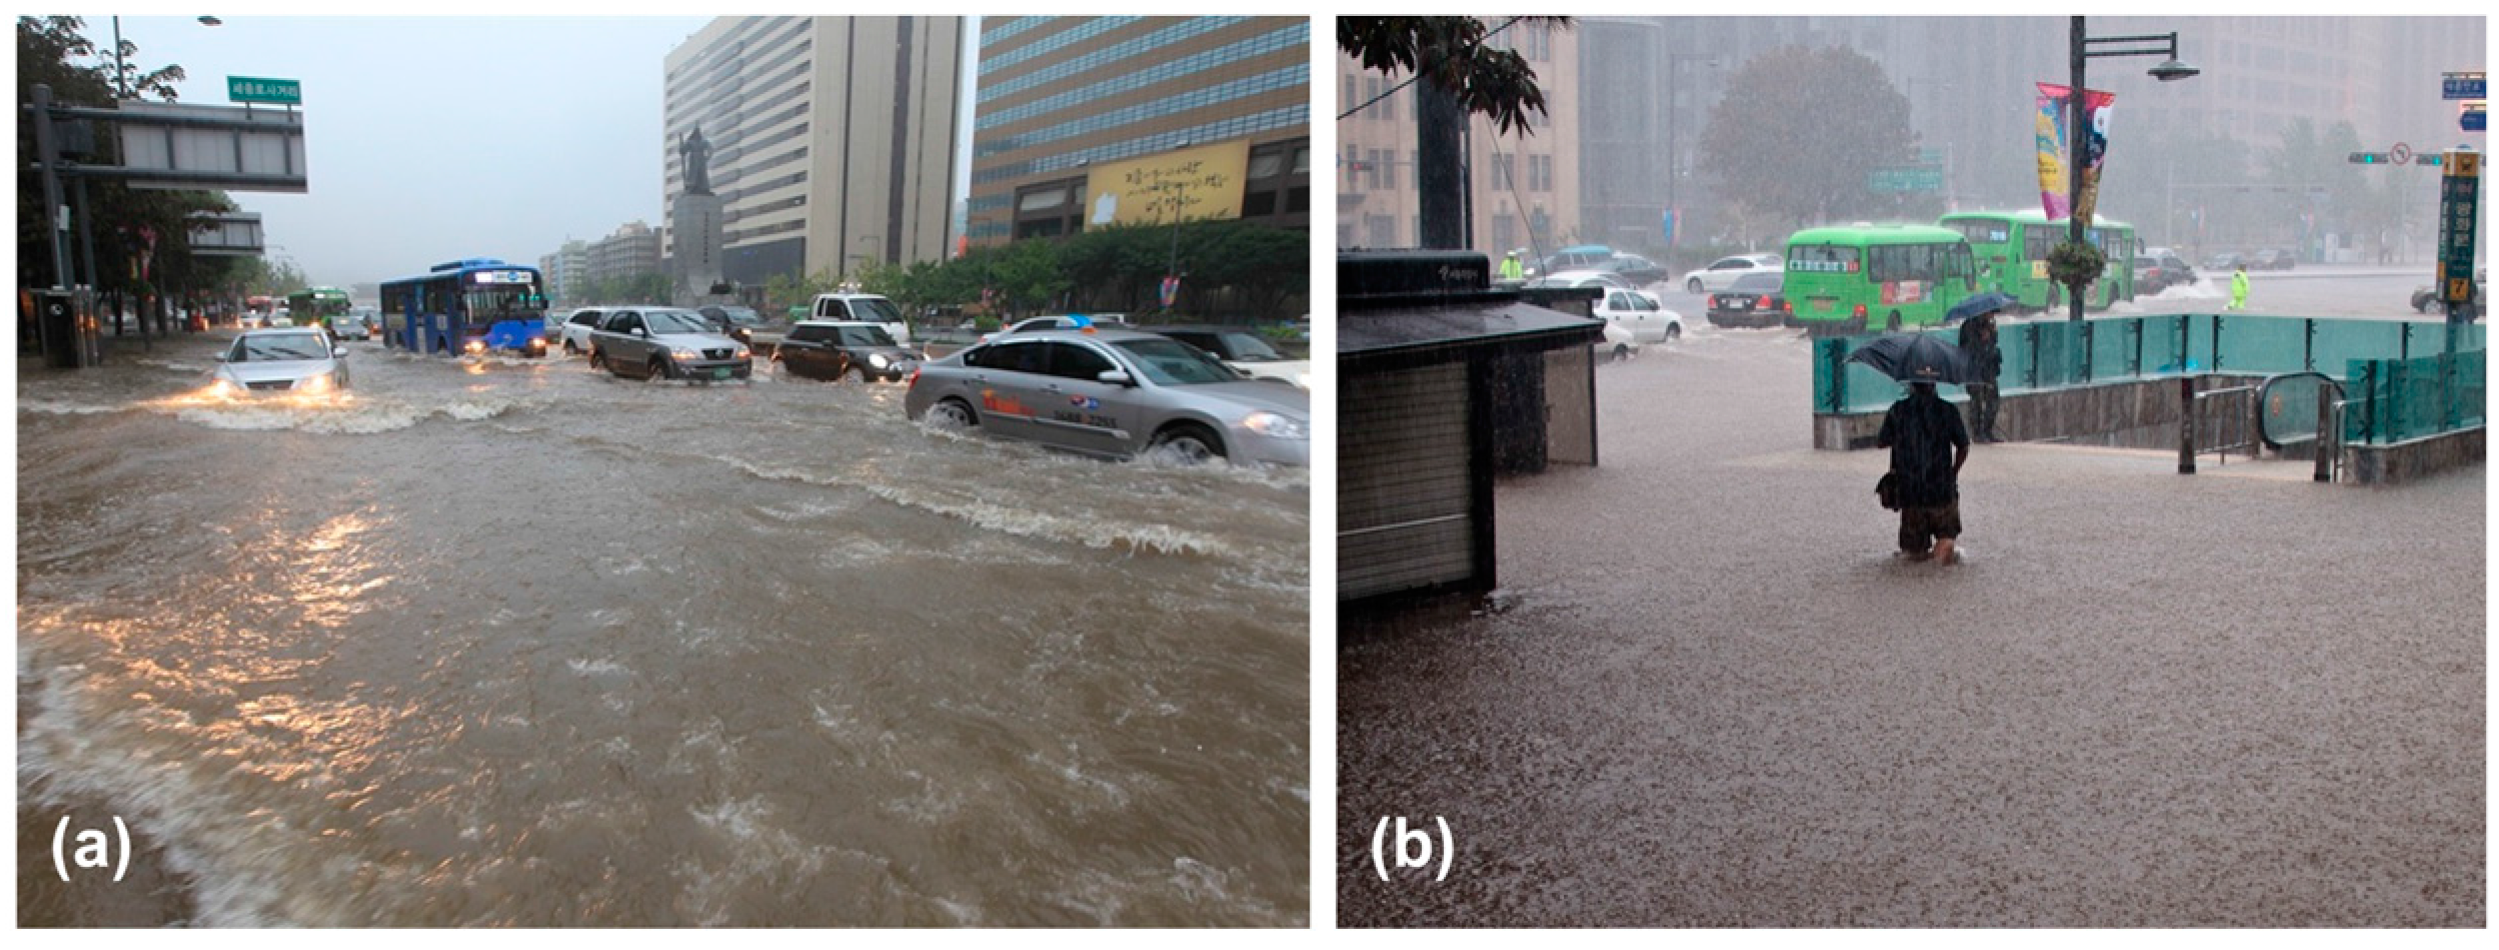
  • The water depths measured at two covered streams were used for calibration of the conduit roughness coefficient in the SWMM. When n m = 0.02 m 1 / 3 s was applied, a RMSE and RPE of the calculated and observed water depth at two streams were about 2.32 cm and 3.92%, respectively, showing the highest accuracy. In addition, surface roughness coefficient of 2D flood model was calibrated by minimizing the difference between measured and calculated flood extent, and n m = 0.025 m 1 / 3 s presenting the highest goodness of fit (74.2%) was selected as an optimal roughness coefficient. In addition, in order to overcome the problem of the measured flood extent not being accurately investigated, flood damage report regions of residents, press media articles, and photos showing real situations as well as measured flood depth were additionally used.
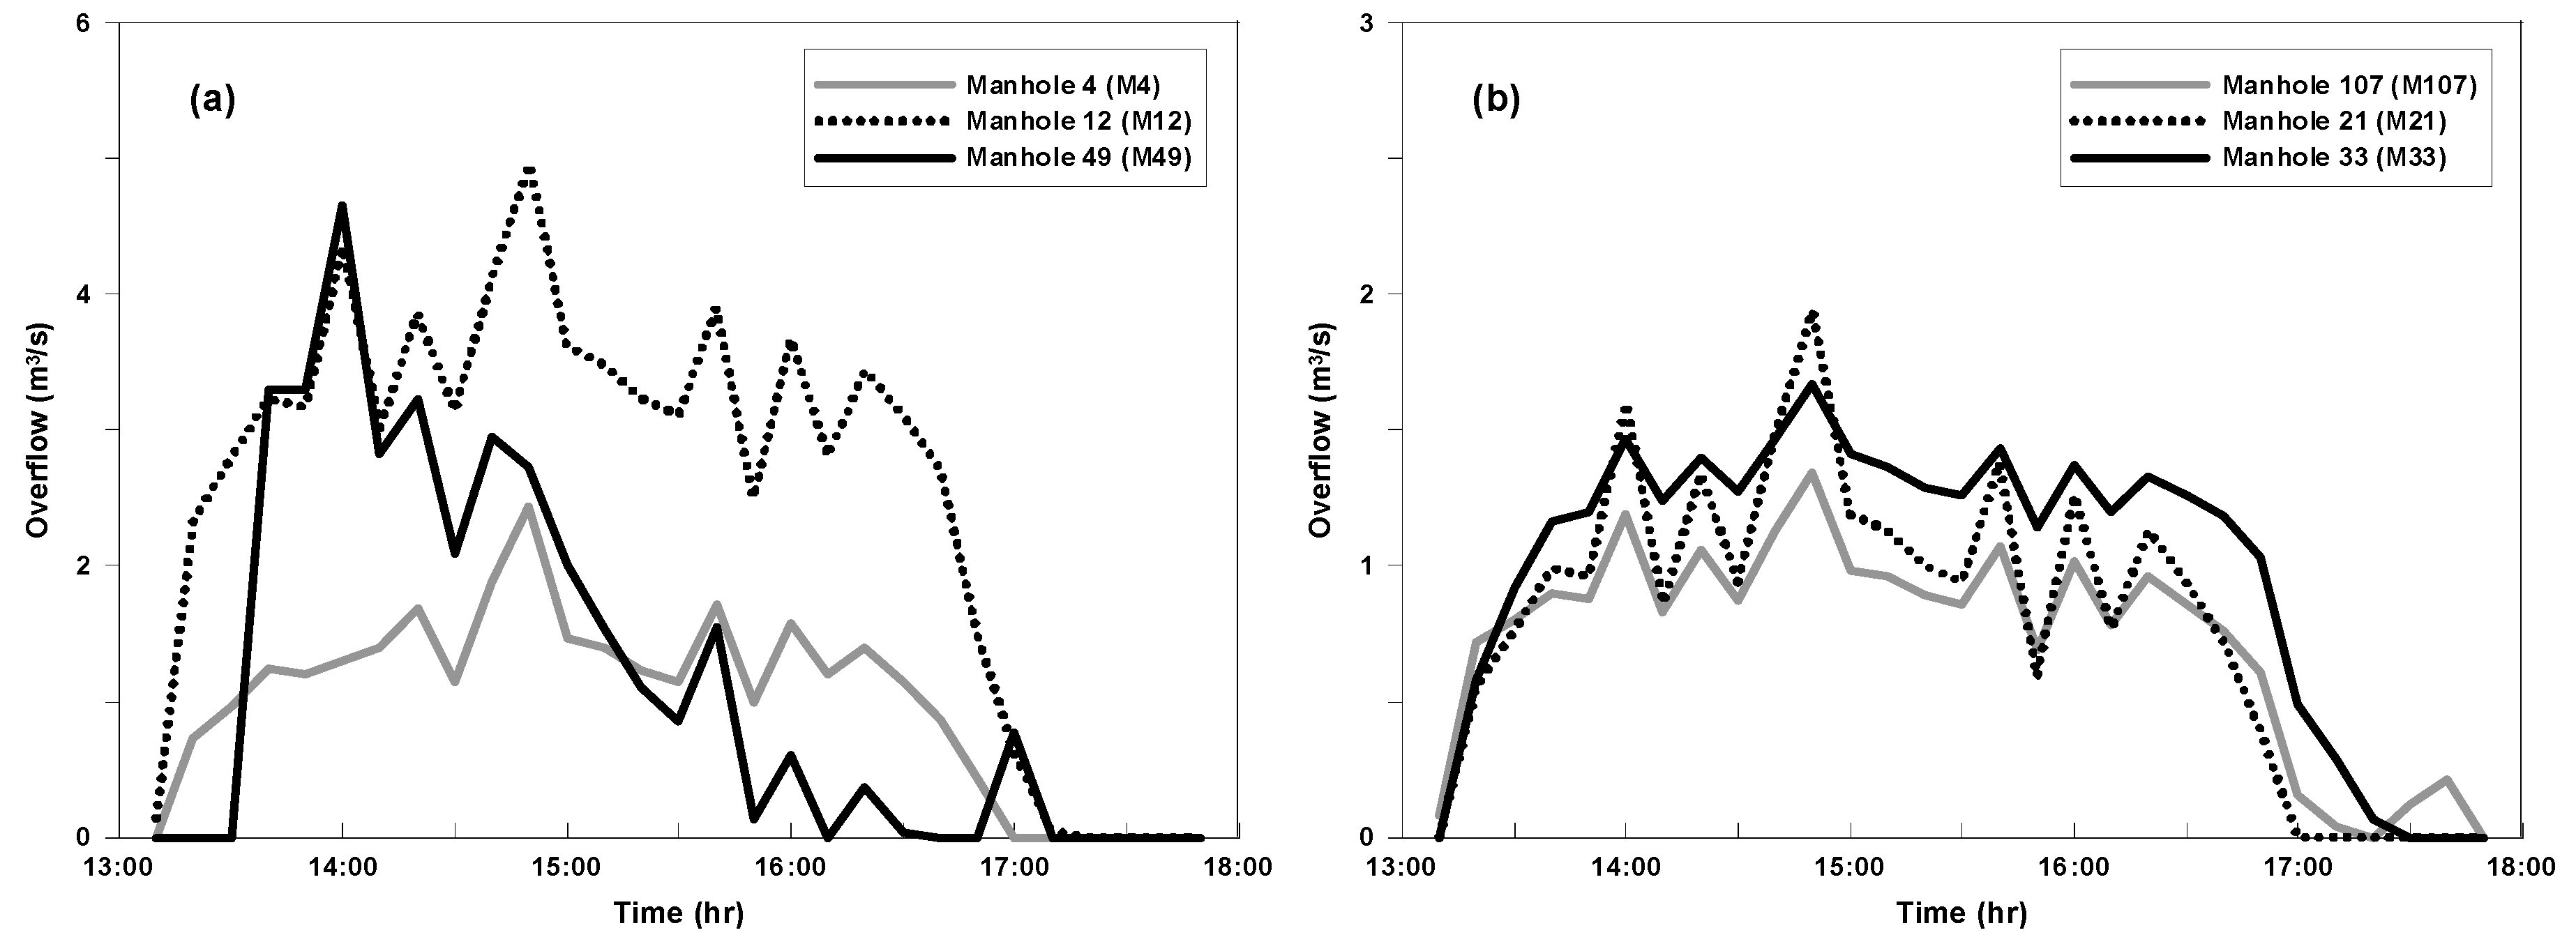
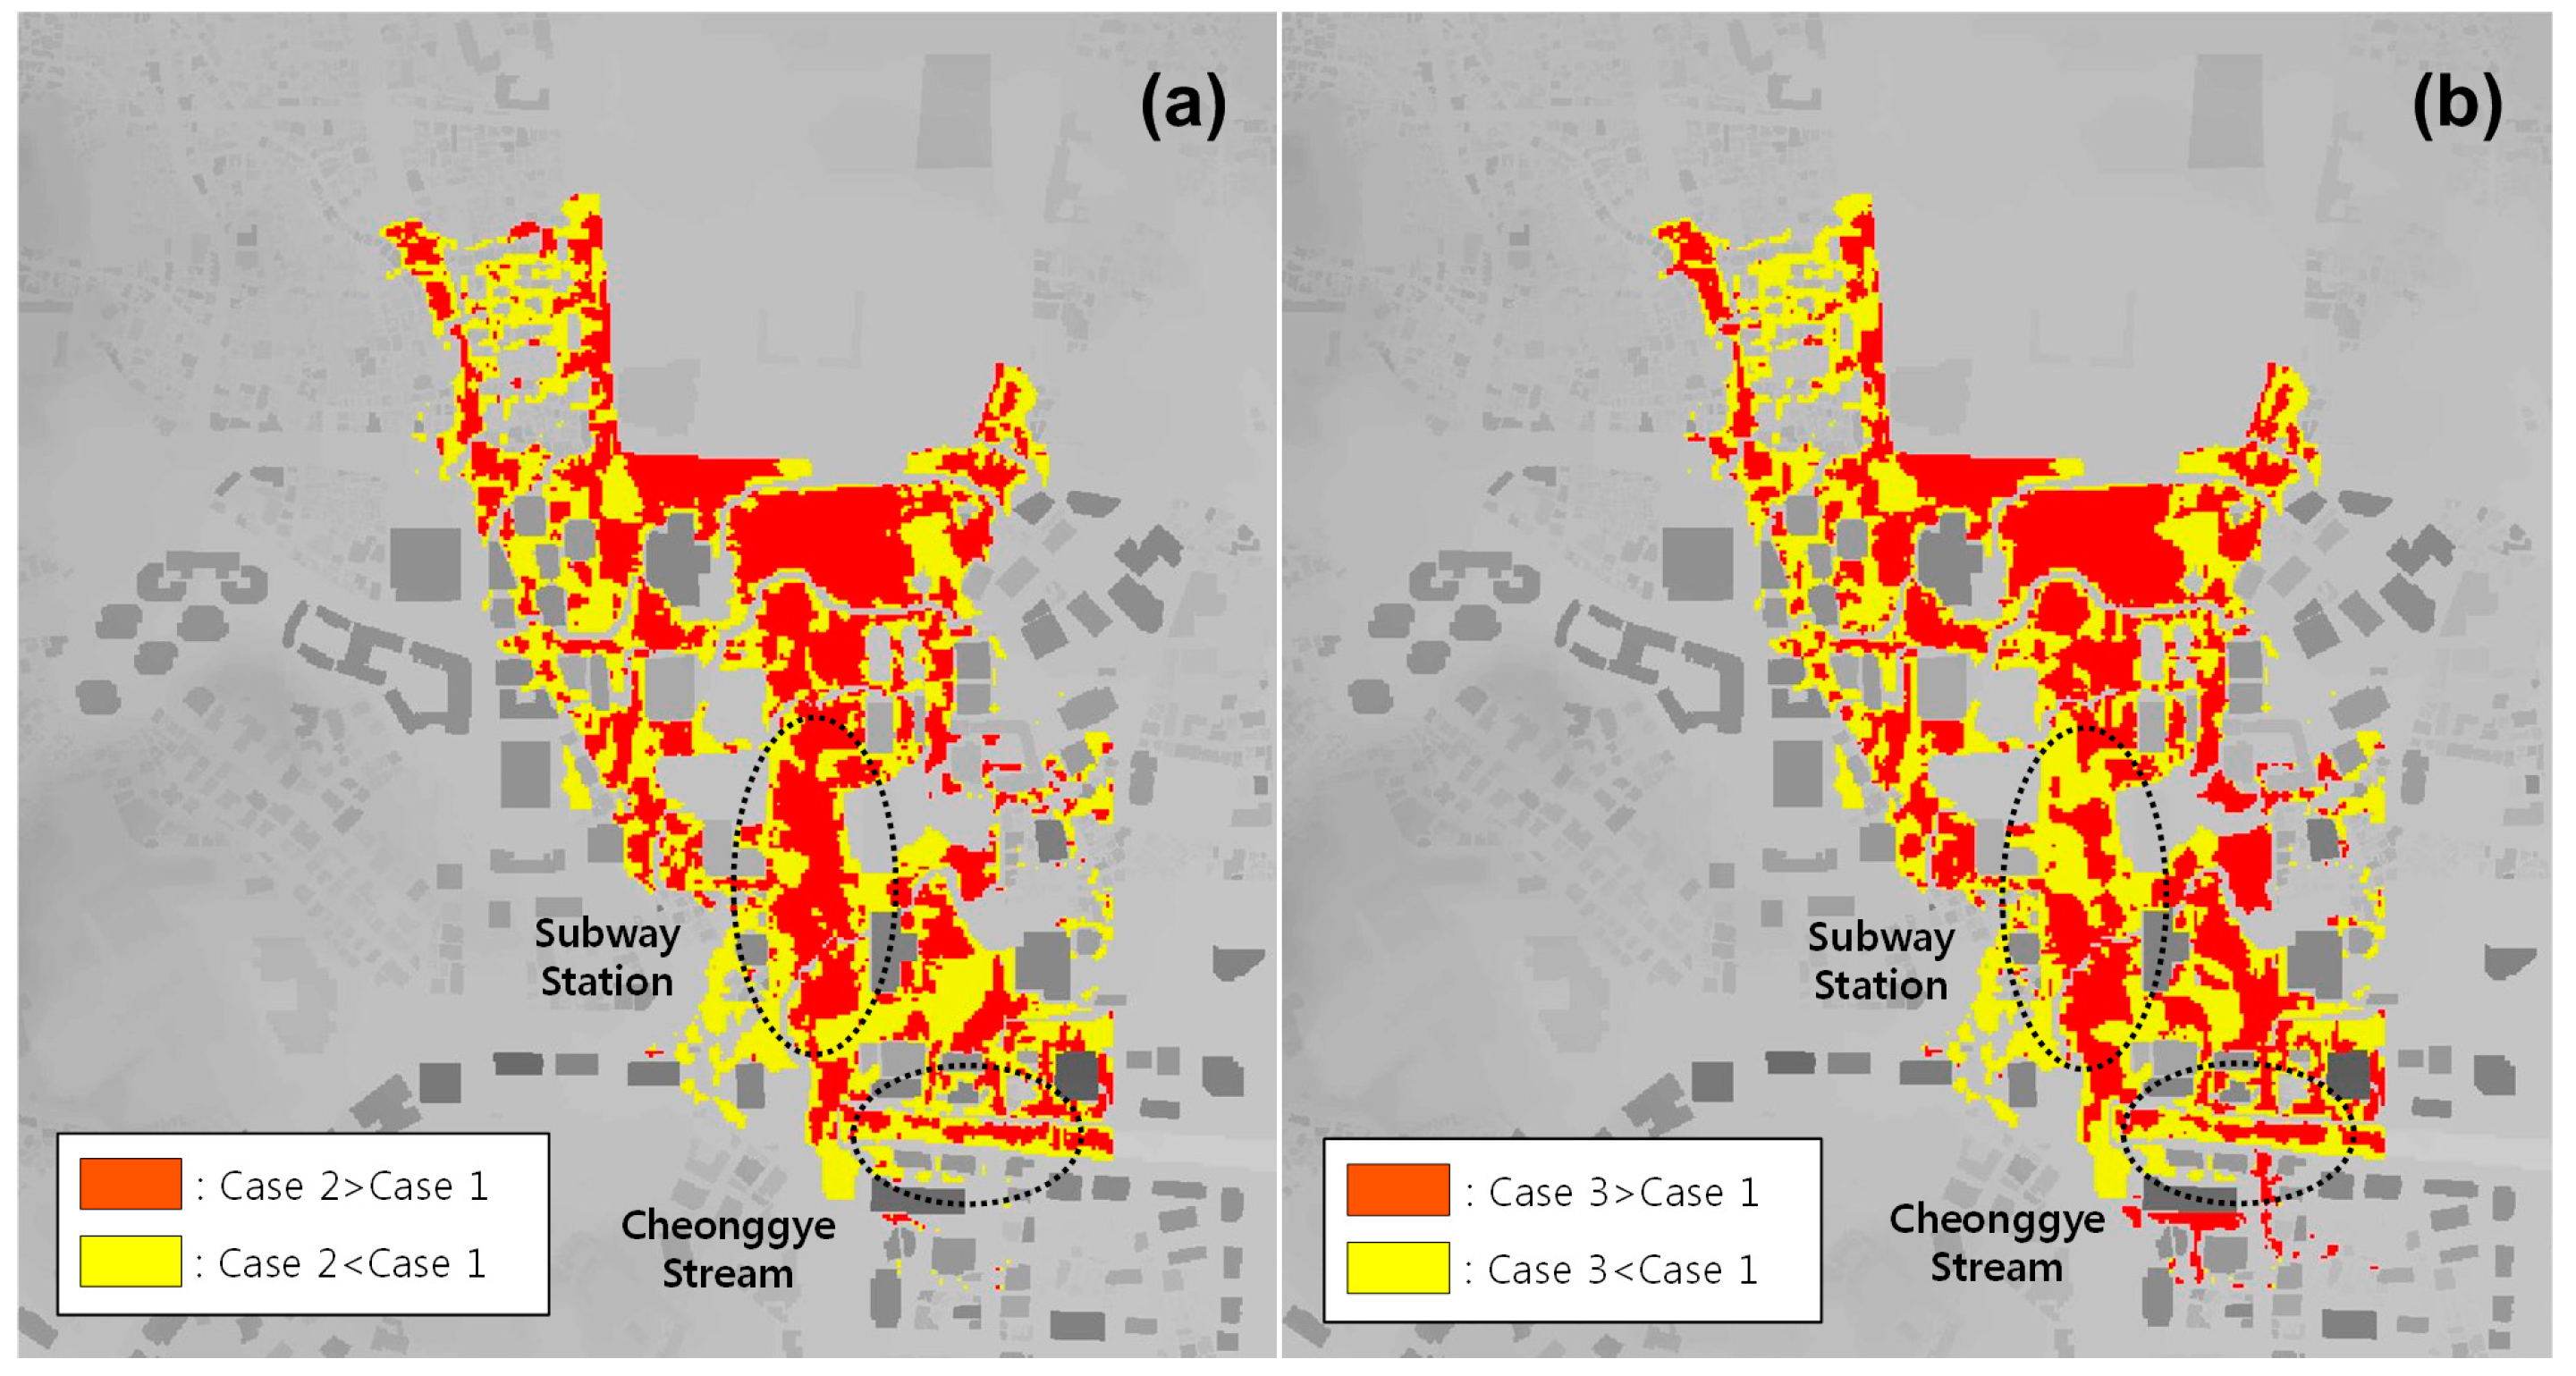
  • The boundary-type (Case 2) and pond-type (Case 3) to link overland and underground spaces by considering floodwater flowed into the underground space were proposed. The predictions of Cases 2 and 3 were compared with those of Case 1 considering only overland flow to examine the effect of underground space in the urban flood modeling. Regardless of the consideration of the underground space, mean flood depth, mean velocity, and maximum flood depth showed similar results, whereas flood extent and maximum velocity of Cases 2 and 3 were approximately 12% smaller and 30% faster, respectively, than those of Case 1.
  • Both of the boundary-type and pond-type presented more accurate in the predictions of flood extent and flood depth as compared with Case 1 not considering underground space. A model execution time of the boundary-type was similar to that of Case 1, whereas the pond-type took more execution time than the other cases. These results indicate that the boundary-type is simple but robust method with high computational efficiency for simultaneous consideration of overland and underground space in urban flood modeling. Thus, the boundary-type in urban flood modeling is expected to be usefully applied when accurate and fast flood information is required regionally such as urban flood responses, measures and planning or flood insurance.

Acknowledgments

This research was supported by a grant (16AWMP-B079625-03) from Water Management Research Program funded by Ministry of Land, Infrastructure and Transport of Korean government.

Author Contributions

All authors contributed extensively to the work. Byunghyun Kim and Kun-Yeun Han conceived and designed the study. Ah-Long Son produced the data required to apply the methodology to the study area and conducted the model simulations. Byunghyun Kim analyzed the results and completed the manuscript.

Conflicts of Interest

The authors declare no conflict of interest.

References

  1. Djordjević, S.; Prodanović, D.; Maksimović, Č. An approach to simulation of dual drainage. Water Sci. Technol. 1999, 39, 95–103. [Google Scholar] [CrossRef]
  2. Mark, O.; Weesakul, S.; Apirumanekul, C.; Aroonnet, S.B.; Djordjević, S. Potential and limitations of 1D modelling of urban flooding. J. Hydrol. 2004, 299, 284–299. [Google Scholar] [CrossRef]
  3. Djordjević, S.; Prodanović, D.; Maksimović, C.; Ivetić, M.; Savić, D. SIPSON-Simulation of interaction between pipe flow and surface overland flow in networks. Water Sci. Technol. 2005, 52, 275–283. [Google Scholar] [PubMed]
  4. Schmitt, T.G.; Thomas, M.; Ettrich, N. Assessment of Urban flooding by dual drainage simulation model RisUrSim. Water Sci. Technol. 2005, 52, 264–274. [Google Scholar]
  5. Maksimović, Č.; Prodanović, D.; Boonya-Aroonnet, S.; Leitão, J.P.; Djordjević, S.; Allitt, R. Overland flow and pathway analysis for modelling of urban pluvial flooding. J. Hydraul. Res. 2009, 47, 512–523. [Google Scholar] [CrossRef]
  6. Leandro, J.; Chen, A.; Djordjević, S.; Savić, D.D.A. Comparison of 1D/1D and 1D/2D coupled (Sewer/Surface) hydraulic models for urban flood simulation. J. Hydraul. Eng. 2009, 135, 495–504. [Google Scholar] [CrossRef]
  7. Pina, R.D.; Ochoa, S.; Simões, N.E.; Mijic, A. Semi- vs. Fully-distributed urban stormwater models: Model set up and comparison with two real case studies. Water 2016, 8, 58. [Google Scholar] [CrossRef]
  8. Casas, A.; Benito, G.; Thorndycraft, V.R.; Rico, M. The topographic data source of digital terrain models as a key element in the accuracy of hydraulic flood modelling. Earth Surf. Process. Landf. 2006, 31, 444–456. [Google Scholar] [CrossRef]
  9. Van de Sande, B.; Lansen, J.; Hoyng, C. Sensitivity of coastal flood risk assessments to digital elevation models. Water 2012, 4, 568–579. [Google Scholar] [CrossRef]
  10. Shoji, F.; Mikio, K. Prediction of flood-induced flows in urban residential areas and damage reduction. In Proceedings of the International Workshop on Floodplain Risk Management, Hiroshima, Japan, 11–13 November 1996.
  11. Mirei, S.; Juichiro, A. Numerical and experimental study on 2-D flood flows with and without structures. J. Hydraul. Eng. 2003, 129, 817–821. [Google Scholar]
  12. Alcrudo, F. Mathematical Modelling Techniques for Flood Propagation in Urban Areas; IMPACT Project Technical Report: Wallingford, UK, January 2004. [Google Scholar]
  13. Marks, K.; Bates, P. Integration of high-resolution topographic data with floodplain flow models. Hydrol. Process. 2000, 14, 2109–2122. [Google Scholar] [CrossRef]
  14. Vojinovic, Z.; Seyoum, S.D.; Mwalwaka, J.M.; Price, R.K. Effects of model schematization, geometry and parameter values on urban flood modelling. Water Sci. Technol. 2011, 63, 462–467. [Google Scholar] [CrossRef] [PubMed]
  15. Fewtrell, T.J.; Duncan, A.; Sampson, C.C.; Neal, J.C.; Bates, P.D. Benchmarking urban flood models of varying complexity and scale using high resolution terrestrial LiDAR data. Phys. Chem. Earth A/B/C 2011, 36, 281–291. [Google Scholar] [CrossRef]
  16. Turner, A.B.; Colby, J.D.; Csontos, R.M.; Batten, M. Flood modeling using a synthesis of multi-platform LiDAR data. Water 2013, 5, 1533–1560. [Google Scholar] [CrossRef]
  17. Mason, D.C.; Giustarini, L.; Garcia-Pintado, J.; Cloke, H.L. Detection of flooded urban areas in high resolution synthetic aperture radar images using double scattering. Int. J. Appl. Earth Obs. Geoinf. 2014, 28, 150–159. [Google Scholar] [CrossRef]
  18. Leitão, J.P.; Moy de Vitry, M.; Scheidegger, A.; Rieckermann, J. Assessing the quality of digital elevation models obtained from mini unmanned aerial vehicles for overland flow modelling in urban areas. Hydrol. Earth Syst. Sci. 2016, 20, 1637–1653. [Google Scholar] [CrossRef]
  19. Chen, A.S.; Evans, B.; Djordjević, S.; Savić, D.A. Multi-layered coarse grid modelling in 2D urban flood simulations. J. Hydrol. 2012, 470–471, 1–11. [Google Scholar] [CrossRef] [Green Version]
  20. Yu, D.; Lane, S.N. Urban fluvial flood modelling using a two-dimensional diffusion-wave treatment, part 2: Development of a sub-grid-scale treatment. Hydrol. Process. 2006, 20, 1567–1583. [Google Scholar] [CrossRef]
  21. Yu, D.; Lane, S.N. Interactions between subgrid-scale resolution, feature representation and grid-scale resolution in flood inundation modelling. Hydrol. Process. 2011, 25, 36–53. [Google Scholar] [CrossRef] [Green Version]
  22. Fewtrell, T.J.; Bates, P.D.; Horitt, M.; Hunter, N.M. Evaluating the effect of scale in flood inundation modelling in urban environments. Hydrol. Process. 2008, 22, 5107–5118. [Google Scholar] [CrossRef]
  23. McMillan, H.K.; Brasington, J. Reduced complexity strategies for modelling urban floodplain inundation. Geomorphology 2007, 90, 226–243. [Google Scholar] [CrossRef]
  24. Soares-Frazao, S.; Lhomme, J.; Guinot, V.; Zech, Y. Two-dimensional shallow-water model with porosity for urban flood modelling. J. Hydraul. Res. 2008, 46, 45–64. [Google Scholar] [CrossRef]
  25. Cea, L.; Vázquez-Cendón, M.E. Unstructured finite volume discretization of two-dimensional depth-averaged shallow water equations with porosity. Int. J. Numer. Methods Fluids 2009, 63, 903–930. [Google Scholar] [CrossRef]
  26. Guinot, V. Multiple porosity shallow water models for macroscopic modelling of urban floods. Adv. Water Res. 2012, 37, 40–72. [Google Scholar] [CrossRef]
  27. Kim, B.; Sanders, B.F.; Famiglietti, J.S.; Guinot, V. Urban flood modeling with porous shallow-water equations: A case study of model errors in the presence of anisotropic porosity. J. Hydrol. 2015, 523, 680–692. [Google Scholar] [CrossRef]
  28. Özgen, I.; Zhao, J.; Liang, D.; Hinkelmann, R. Urban flood modeling using shallow water equations with depth-dependent anisotropic porosity. J. Hydrol. 2016, 541, 1165–1184. [Google Scholar] [CrossRef]
  29. Abdullah, A.F.; Vojinovic, Z.; Price, R.K.; Aziz, N.A.A. A methodology for processing raw LiDAR data to support urban flood modelling framework. J. Hydroinform. 2012, 14, 75–92. [Google Scholar] [CrossRef]
  30. Abdullah, A.F.; Vojinovic, Z.; Price, R.K.; Aziz, N.A.A. Improved methodology for processing raw LiDAR data to support urban flood modelling—Accounting for elevated roads and bridges. J. Hydroinform. 2012, 14, 253–269. [Google Scholar] [CrossRef]
  31. Shon, T.S.; Kang, D.H.; Jang, J.K.; Shin, H.S. A study of assessment for internal inundation vulnerability in urban area using SWMM. J. Korean Soc. Hazard. Mitig. 2010, 10, 105–117. [Google Scholar]
  32. Kim, B.; Kim, T.H.; Kim, J.H.; Han, K.Y. A well-balanced unsplit finite volume model with geometric flexibility. J. Vibroeng. 2014, 16, 1574–1589. [Google Scholar]
  33. Seoul Metropolitan City (SMC). Environment White Paper: Environment of Seoul; Seoul Metropolitan City Press: Seoul, Korea, 2014. [Google Scholar]
  34. Kim, H.S. A Study on the Decision of Design Magnitude for Flood Control of Urban Basin Based on Flooding Characteristic Values: A Case Study on the Hyoja Drainage Basin, Located in Cheonggyecheon Basin in Seoul. Master’s Thesis, University of Yonsei, Seoul, Korea, 2012. [Google Scholar]
  35. Lee, J.T.; Hur, S.C.; Kim, T.H. Sensitivity analysis of the SWMM model parameters based on design rainfall condition. J. Korea Water Resour. Assoc. 2005, 38, 213–222. [Google Scholar] [CrossRef]
  36. Kim, B.; Sanders, B.F.; Han, K.Y.; Kim, Y.J.; Famiglietti, J.S. Calibration of stormwater management model using flood extent. Proc. ICE Water Manag. 2014, 167, 17–29. [Google Scholar] [CrossRef]
  37. Korean Water Resources Association (KWRA). River Design Criteria; Korean Water Resources Association: Seoul, Korea, 2009. [Google Scholar]
  38. Yi, C.Y.; An, S.M.; Kim, K.R.; Choi, Y.J.; Dieter, S. Improvement of air temperature analysis by precise spatial data on local-scale: A case study of Eunpyeong Newtown in Seoul. J. Korean Assoc. Geogr. Inf. Stud. 2012, 15, 144–158. [Google Scholar] [CrossRef]
  39. Urban Flood Disaster Management Research Center (UFDMRC). A Guideline on Flood Estimation in Urban Area: FFC06-1; Urban Flood Disaster Management Research Center: Seoul, Korea, 2008. [Google Scholar]
  40. Bates, P.D.; Dawson, R.J.; Hall, J.W.; Horritt, M.S.; Nicholls, R.J.; Wicks, J.; Hassan, M.A.A.M. Simplified two-dimensional numerical modelling of coastal flooding and example applications. Coast. Eng. 2005, 52, 793–810. [Google Scholar] [CrossRef]
  41. Schubert, J.E.; Sanders, B.F. Building treatments for urban flood inundation models and implications for predictive skill and modeling efficiency. Adv. Water Resour. 2012, 41, 49–64. [Google Scholar] [CrossRef]
  42. Smith, R.A.E.; Bates, P.D.; Hayes, C. Evaluation of a coastal flood inundation model using hard and soft data. Environ. Model. Softw. 2012, 30, 35–46. [Google Scholar] [CrossRef]
  43. Wadey, M.P.; Nicholls, R.J.; Hutton, C. Coastal flooding in the Solent: An integrated analysis of defences and inundation. Water 2012, 4, 430–459. [Google Scholar] [CrossRef]
Figure 1. Flowchart of linkage process between SWMM (stormwater management model) and 2D flood model considering underground space.
Water 08 00494 g001
Figure 2. Schematic design to link overland and underground space: (a) boundary-type; and (b) pond-type.
Water 08 00494 g002
Figure 3. Study area including two covered urban streams with gauge station.
Water 08 00494 g003
Figure 4. Digital Elevation Model (DEM) and sewer drainage network.
Water 08 00494 g004
Figure 5. Rainfall hyetograph and boundary condition for urban run-off analysis: (a) 12 June 2010; and (b) 27 August 2010.
Water 08 00494 g005
Figure 6. Comparison of observed and calculated water depths from SWMM at two covered urban streams: (a,b) 12 June 2012; and (c,d) 27 August 2010.
Water 08 00494 g006
Figure 7. Mesh generation to link overland and underground spaces: (a) exit locations of Gwanghwamun subway station; (b) boundary-type; and (c) pond-type.
Water 08 00494 g007
Figure 8. Flooding of study area on 12 September 2010 around: (a) Sejoing-daero intersection; and (b) Exit No. 7 of Gwanghwamun subway station (Photo by Yonhap News).
Water 08 00494 g008
Figure 9. Flood event on 12 September 2010: (a) Rainfall hyetograph and boundary condition of SWMM; and (b,c) comparison of observed and calculated water depth at two covered urban streams.
Water 08 00494 g009
Figure 10. Calculated overflow at manhole: (a) M4, M12, and M49; and (b) M107, M21, and M33 where surcharging occurred (shown in Figure 4). These values are inputted to 2D flooding model as boundary conditions.
Water 08 00494 g010
Figure 11. Comparison of observed and computed flood extent for: (a) Case 1; (b) Case 2; and (c) Case 3.
Water 08 00494 g011
Figure 12. Computed flood velocity for: (a) Case 1; (b) Case 2; and (c) Case 3.
Water 08 00494 g012
Figure 13. Difference of flood depth for: (a) Case 1–Case 2; and (b) Case 1–Case 3.
Water 08 00494 g013
Figure 14. Difference of flood velocity for: (a) Case 1–Case 2; and (b) Case 1–Case 3.
Water 08 00494 g014
Table 1. Errors between observed and calculated water depth at two covered urban streams with gauge station.
Error12 June 201027 August 2010
JunghakBaekundongJunghakBaekundon
RMSE (cm)2.291.882.272.87
RPE (%)6.381.752.045.52
Table 2. Height of exit threshold in Gwanghwamun subway station.
Exit No.2345679
Height (m)0.220.100.330.490.320.290.0
Table 3. Calibration of surface Manning’s runoff coefficient.
Fit (%)Surface Manning’s Roughness Coefficient (m−1/3s)
0.0150.0200.0250.030
Goodness of fit39.5239.8840.2240.11
Modified goodness of fit73.673.974.274.0
Table 4. Computed flood characteristics for each case.
CaseCase 1Case 2Case 3
Goodness of fit (%)74.282.784.2
Avg. depth (m)0.040.060.05
Max. depth (m)1.010.960.98
Avg. velocity (m/s)0.100.090.09
Max. velocity (m/s)1.772.302.47
Execution time (min)4265141865
Table 5. Difference of depth and velocity for each case.
DifferenceDepth (m)Velocity (m/s)
Min.Max.MeanMin.Max.Mean
Case 1–Case 2−0.710.600.006−1.350.770.012
Case 1–Case 3−0.730.330.004−1.480.740.008

